
Abstract
Do local political party members reflect the views of voters in their constituencies? Since candidate selection by local party members is the most common form of candidate selection in the United Kingdom, it is important to understand local party members’ views, and how those views relate to views in the local area. We investigate the degree to which individual members’ views match local opinion by combining the results of a large-scale survey of party members in the United Kingdom with estimates of local opinion created using multilevel regression and post-stratification. We find that individual party members’ views are moderately to strongly associated with local opinion on both left-right and liberty-authority dimensions. Even so, party members are not entirely congruent with opinion in the local area, having opinions which are either to the left or right of voters in their local area, and which are uniformly more liberal than party supporters.
Introduction
Members of political parties in consolidated democracies are often involved in candidate selection: the chance to choose leading exponents of one’s party is one of the key selective benefits of party membership. Although selection by party elites can be geographically centralised (Lundell, 2004: 30), selection by party members is typically selection by local party members. Shomer (2014), in her cross-national study of candidate selection, found that candidate selection by local delegates/party members is the single most common form of candidate selection, and it is certainly the norm for British political parties. Understanding the beliefs and preferences of local party members is therefore important for understanding candidate selection, for: [t]he values of the selectorate, often a small number of activists, frequently have more impact than those of voters. This applies especially under electoral systems which do not permit voters any degree of choice between candidates of the same party; picking candidates then often amounts to picking deputies. (Gallagher and Marsh, 1988: 2)
Past research has shown how candidate selection can have consequences for representation at the national level (Spies and Kaiser, 2014). Our focus here is on representation of the local area, and in particular, the consequences for the representation of single-member districts when voters are not allowed any choice between candidates of the same party. We know that in these settings there is an association between local opinion in single-member districts and legislators’ behaviour, even when comparing legislators from the same party (Carson et al., 2018; Converse and Pierce, 1986; Hanretty et al., 2017). What we lack is any explanation of the mechanism underpinning this ‘dyadic representation’ (Weissberg, 1978). One possible mechanism is through selection by party members who share (to some extent) the views of the local area. If (1) local party members’ political views could be predicted based on the views of the local area, and if (2) local party members select on the basis of their policy distance to prospective candidates (rather than, say, on the basis of valence characteristics like candidates’ preparedness or charisma), then this would go a long way to explaining these patterns of dyadic representation. While we cannot tackle the second limb of this argument, we are able in this article to ask whether local party members’ political views are associated with opinion in their area, which we see as a necessary step towards understanding the mechanisms of dyadic representation.
In this article, we use data from a large (N = 4718) survey of the membership of several different parties in Britain. This survey provides information on individual party members’ political views on a range of issues but (importantly for our purposes) also includes two standard batteries which allow party members’ views to be compared to the views of the general population, as revealed by other academic surveys. We use one general population academic survey (the British Election Study) to generate estimates of local opinion on the two key dimensions of political competition in Britain (left vs right and liberty vs authority). We then assess the degree to which individual members’ views can be predicted based on average opinion in their constituency. Our results provide support for the view that party members’ views are correlated with local opinion, in the sense that individual party members are more left-wing in more left-wing constituencies, and vice versa. This is true even if party members are not completely congruent with local opinion: Labour party members are always to the left of average opinion in their area, just as Conservative party members are always to the right. The strength of the association is striking: around two-fifths of constituency opinion on the left-right dimension ‘passes through’ to the opinion of party members; the association for the liberty-authority dimension is higher still. Rather than stand stock still representing a single point in political space, party members sway with the prevailing local winds.
We begin by rooting our work in the overlapping literatures on party membership, candidate selection, and dyadic representation. We then move on to discuss the United Kingdom as a case, and the reasons why we might expect there to be an association between local opinion and party members’ opinions. Because we draw on two distinct types of data (data on local opinion and data on party members), a rather lengthy data section describes how we operationalized our predictor and outcome variables. We then set out a regression model which respects particular features of our model, and in particular, the way in which local opinion is measured. In the closing section, we discuss the consequences of our findings for the literature on dyadic representation and candidate selection.
Literature and context
For some time, it has been easy to convince oneself that party members are of declining significance for the way that political linkages between state and society work. Across the democratised world, party membership has dwindled (Van Biezen et al., 2012; Webb and Keith, 2017), and politicians increasingly bypass members to communicate with voters, drawing on mainstream and alternative media channels. Party resources are as likely to come from corporate donors, major trade unions or the state itself (Van Biezen and Kopecky, 2017) than from grassroots members.
There are, however, stubborn counter-indications that party members retain a significant role in creating and maintaining territorial political linkages, not least in Britain, which has bucked the trend of membership decline so evident elsewhere (Bale et al., 2019: 8–14). Moreover, there is a well-known litany of the benefits that members can still bring to parties (Scarrow, 1994, 1996: ch. 2). For one thing, parties need to demonstrate that they have a vibrant appeal and a healthy level of internal activity to establish legitimacy with the electorate. Second, members provide a reliable core of loyal voters. Third, members can become opinion leaders for the party in the local community, thereby boosting electoral support. This network of representatives in the locality is a potential source of two-way linkage between members of the parliament (MPs) and their constituents, channelling citizens’ views up to the MP as well as facilitating top-down messaging. This linkage function touches directly on the research question motivating this article – the mechanism by which legislators approximate the views of their constituents.
Above all, the membership is critically important both as a source of candidates for public office, and as a key actor in the process of nominating and selecting those candidates. Although it is only relatively recently, especially in the Conservative Party, that grassroots party members in the United Kingdom have had a direct say in electing their party’s leader, they have been instrumental in deciding who represents it at elections and therefore in parliament for over a century now – in marked contrast to members in other European democracies, most of which, of course, operate under proportional representation rather than single-member plurality systems and so were perhaps less likely, until they were bitten by the bug of ‘democratization’ (Cordero and Coller, 2018; Cross and Katz, 2013) to hand the decision over to inevitably rather small groups of local activists. Indeed, in the case of the United Kingdom’s so-called ‘safe seats’ – those constituencies which are highly unlikely to be lost to a rival party even in the event of a bad defeat nationally – ‘selection’, as one of the earliest studies of the process noted, ‘is election’ (Ranney, 1965: 4).
The process of candidate selection has continued to attract academic attention, notwithstanding the challenges it poses to researchers – namely the level of secrecy involved and the fact that parties, who are free to make their own rules on the issue, make frequent adjustments to how their selection contests are conducted as they attempt to balance competition, participation, representation, and responsiveness (Hazan and Rahat, 2010). Most of those adjustments, it is true, are not much more than variations on a theme – the theme, in the United Kingdom at least, being a multi-stage process whereby local parties (1) receive applications from aspirants who are generally on some kind of approved list provided by party headquarters, (2) allow a small committee of members to shortlist those applications they want to take further, and (3) choose which one of the people on the shortlist they want as their ‘prospective parliamentary candidate’ through a vote (in person and/or postal) of the local party membership – a vote that on some occasions and in some parties has been opened up to include registered supporters and even just ordinary members of the public living in the constituency (Alexandre-Collier, 2016). However, even small changes (perhaps to eligibility, perhaps to timing, or even just to how things are conducted ‘on the night’) can potentially make a big difference and are therefore a frequent source of debate between leaders and members.
Party members often hold strong preferences as to the kind of candidate they would like to see represent them and the kind of candidate they think is most likely to win at the general election – preferences that are sometimes in conflict with each other, as well as in conflict with the messages their leaders want to send about their party to the wider electorate, not least if that message is one of ideological moderation and/or diversity (Ashe, 2019; Bale et al., 2019; Bochel and Denver, 1983; Campbell and Cowley, 2014). That said, while it is no longer true to characterise candidate selection as ‘the secret garden of politics’ (Gallagher and Marsh, 1988), most of the academic attention paid to it since has, while recognising the interaction of demand and supply, and of formal rules and cultural norms, involved in the process itself, tended to focus on its outputs – and in particular, the extent to which it produces candidates who are representative (especially demographically) of the electorate as a whole (see, for a seminal example, Norris and Lovenduski, 1995). There has, however, been some interest in ideological – and, indeed, geographical – representativeness. Mikulska and Scarrow (2010), for instance, found that, in the 1990s anyway, more inclusive procedures (namely those that ensured that grassroots party members played the dominant role) were likely to produce candidates more likely to appeal, in terms of their policy preferences, to the party’s potential voters. Meanwhile, Buttice and Milazzo (2011) find that local party members tend to pick more ideologically congenial candidates when they are in safe (or hopeless) seats than they do in ‘competitive’ seats that are more likely to change hands at election time. When it comes to geography, research shows that in the UK local candidates enjoy an electoral advantage over their less local opponent (Evans et al., 2017) and that, partly as a result perhaps, a substantial majority of both MPs and candidates are indeed (relatively) local (Cowley et al., 2022; Gandy, 2014; Rüdig et al., 2016).
Localness may matter for its own sake, but it may also matter because local candidates are more likely to deliver dyadic representation, or a strong association or match (Achen, 1977) between local preferences and representative behaviour. Although dyadic representation is a staple topic in the analysis of Congressional behaviour, it has also been found in much less congenial environments such as the United Kingdom or Australia. Where legislators are not whipped, their votes are associated with opinion in their district (Carson et al., 2018; Hanretty et al., 2017). It is not clear why exactly this should be so. The electoral benefits of being in-step with one’s constituents are negligible even on highly salient issues (Hanretty et al., 2021), and so any account of dyadic representation based on the potential for sanctioning would not get very far. This suggests strongly that a greater driver of the observed dyadic representation we see is rooted in selection. Because of this, we need to study the views of the selectors – the local party members.
Expectations surrounding local party members’ views
We consider two principal ways in which an association between constituency position and local party member position might arise: a direct causal effect, and a ‘common cause’ explanation.
A direct causal effect of constituency upon opinion is the most obvious path by which local opinions might influence party members’ opinions. Constituency positions might cause people’s positions to change, such that if the constituency suddenly moved left, individuals in that constituency would also move left; or such that, if an individual moved from a left-wing to a right-wing constituency, they would become more right-wing. This is essentially premised on a social contagion argument in that people come to emulate the views of those with whom they mix on a regular basis. There is evidence of a direct causal effect of place on attitudes, and indeed this is behind the logic of neighbourhood effects. In the United Kingdom, Gallego et al. (2016) have shown that, compared to individuals who do not move at all, moving into a ‘safe Conservative seat’ is associated with a 0.64 unit increase in left-right score on a 0–10 scale, controlling for other demographic factors which also affect left-right position. They estimate their results over four elections and define a ‘safe Conservative seat’ as one which was won by the party in all four elections.
Whether or not a change of 0.64 units is a little or a lot depends on how different ‘safe Conservative seats’ are compared to all others. Based on an multilevel regression and post-stratification (MRP) analysis similar to the one reported below, we have found that the average 0–10 left–right score for constituencies which were won by the Conservative party in 2010, 2015, and 2017 is 5.6; the average for all other seats is 4.95, and so the difference in constituency left–right position of a move from a non-safe Conservative seat to a safe Conservative seat is around 0.65 units. The effects found are therefore entirely consistent with those reported by Gallego et al. (2016) – at least for those who move into Conservative areas: the same authors found no (statistically significant) effect of moving into Labour areas.
Gallego’s findings concern the general population. Should we expect effects found in the general population to apply also to party members? There is no clear answer. On one hand, party members are ideological sophisticates, and ideological sophisticates show greater opinion stability. On the other hand, party members who canvass do (to some extent) talk about politics with a range of people and have the kinds of conversation which might yield opinion change over time. Sadly, there is little research on the effects of activism on activists. Pre-post tests of activist attitudes before and after deep canvassing in several American states suggests canvassing can promote perspective-getting and reduce hostility towards the out-party (Kalla and Broockman, 2022), but these findings refer to affective rather than cognitive attitudes, and involve ‘deep canvassing’ rather than the shorter more directed canvassing encouraged by British political parties. These findings indicate the potential for party members to experience opinion change, or at least to adopt a broader perspective on constituency opinion which may feed into subsequent selection decisions.
An alternative to a direct causal effect is a common cause explanation. An observed association between constituency and individual party member position might arise because both constituency opinion and individual party member opinion are caused by the same underlying factors. This is most clearly with the case with area-level characteristics which exert an effect on issue positions and vote choice. Consider, as an example, the average house price in a constituency. The average house price is an area-level characteristic which affects issue positions and vote choice on the left-right (Ansell, 2014) and authoritarian/libertarian dimensions (Ansell et al., 2022). Although party members are disproportionately likely to own their own home, the value of their home depends principally on the interaction between housing demand and supply in that area, rather than any individual feature or action. Changes in house prices might therefore change opinions in the constituency generally and among party members specifically.
Data and method
Party member data
The data on party members come from Round 1 of the UK Party Membership Survey 2015, which was part of the ESRC Party Members Project (PMP), and which is described in Bale et al. (2019). The survey was conducted by YouGov, and surveyed YouGov panellists who said they were party members. Members of the Conservative, Labour, Liberal Democrat, UK Independence, and Scottish National parties were surveyed. The fieldwork for Round 1 was carried out between the 12th and 26th May 2015, shortly after the UK general election held on the 7th May. The fieldwork preceded the surge in Labour party membership which was associated with the 2015 leadership election.
Because there is limited public information about the characteristics of party members, it is difficult to assess the representativeness of the data. However, YouGov surveys of Labour party members voting in Labour leadership elections have generally been highly accurate, suggesting that our sample is representative of party members nation-wide.
Constituency opinion data
The constituency opinion data were generated using MRP (Hanretty et al., 2018; Park et al., 2004) based on individual-level data from wave 5 of the British Election Study. MRP is a technique for generating estimates of opinion for small areas by combining large national samples with information on the types of voters present in each area, where information on voter types is drawn from the census or other official records. The fieldwork for wave 5 (N = 30,725) was carried out between the 27th March and 6th May 2015, before the election on the 7th May. Wave 5 is the closest wave of the British Election Study to the Party Members Project Survey. As such, we can obtain roughly contemporaneous measures of party member and constituency opinion.
Large national samples of the kind provided by the British Election Study can be used to produce estimates of average opinion in local areas using a multilevel regression model. This model can incorporate area-level predictors of opinion and individual-level predictors of opinion, subject to the requirement that the constituency-level distribution of those individual-level predictors is known. Thus educational qualifications can be included because this is asked about in the Census and Labour Force Survey, but ‘political interest’ cannot because we do not know what average political interest is in each constituency. Given these constraints, the individual-level variables included in the MRP model were as follows: respondent age (eight categories); respondent ethnicity (white/nonwhite), sex, education (five categories); and 2010 vote choice. Area-level variables included in the MRP model were as follows: the government operating region; the winning party in 2010; the vote shares won by the Conservatives, Labour, Liberal Democrats, Scottish National Party (SNP) and Plaid Cymru in 2010, turnout in 2010, and 2011 census-derived population density. The post-stratification frame, which records the counts of individuals with each combination of individual characteristics (25–34 years old white male with a university degree who voted Conservative) was constructed by taking the regional joint distribution of 2011 Census microdata, imputing 2010 vote choice using the 2010 BES Internet panel study data, and repeatedly re-weighting or ‘raking’ this joint distribution to match the known marginal distributions (i.e. how many 25–34 years olds, how many white residents, how many male residents, etc.).
Dependent variables
While our independent variable is measured at the constituency level, our dependent variables are measured at the level of the individual party member, and are taken from the Party Members Project Survey. The two dependent variables in the analysis are averages of agree/disagree responses to (1) five statements concerning (economic) left and right, and (2) five statements concerning authority and liberty. 1 The statements have been used as part of left/right and authority/liberty batteries in academic surveys since the 1980s (Evans and Heath, 1995), and the use of such batteries is desirable given that survey respondents in the United Kingdom are not very good at placing themselves on a left–right scale (Bølstad, 2020). Respondents could indicate that they strongly disagreed, disagreed, neither disagreed nor agreed, agreed, or strongly agreed with the statement. These responses were converted into numbers between 1 and 5. Left–right statements were originally written so that greater agreement (=higher values) indicated a more left-wing position, but we reversed the responses so that numerically larger responses indicate a right-wing position. Authority–liberty statements were written so that greater agreement indicates a more authoritarian position.
The value for each respondent is the average of their responses to each statement in the battery. The average (mean) value of the left–right battery is 2.18 (SD = 1.02). The average value of the authority–liberty battery is 2.99 (SD = 0.98). There is evidence of truncation in the responses to the left–right battery: 15.8% of respondents consistently gave ‘strong agree’ or ‘strong disagree’ responses to the statements. There is less evidence of truncation in responses to the authority–liberty battery: only 3.4% of respondents had the lowest or highest possible values.
Independent variable
The independent variable is the constituency-level analogue of the dependent variable, as estimated through multilevel regression and post-stratification. The constituency means are on average more right-wing than are our party member respondents (mean of 2.79 compared to 2.18) and more authoritarian (mean of 3.26 compared to 2.99). The constituency figures are also much less dispersed than the party members’ figures. The standard deviation for constituency positions on the left–right battery is around one-ninth the size of the standard deviation for party member respondent positions (0.11 compared to 1.02). The standard deviation for authority/liberty is larger, but still small compared to that for party members (0.22 vs 0.98). This is to be expected – averages of individual values are always less variable than individual values themselves – but it does mean that the figures we show plotting constituency opinion against individual opinion have a considerable amount of ‘scatter’ in them.
Because the figures for constituency positions are estimates derived from a model, it is important also to recognise the uncertainty surrounding those estimates. We discuss this later in our model specification, but for the moment it is important to note that the MRP estimates include standard errors, which incorporate uncertainty concerning the model parameters and fundamental uncertainty. The uncertainty in constituency estimates is large relative to the spread of constituency opinion: the average standard error for constituency left–right position is 0.08, compared to the standard deviation of 0.11. This uncertainty does not prevent the estimates from having high-face validity: the most left-wing constituencies (Knowsley (2.48), Blaenau Gwent (2.48), and Liverpool Walton (2.49) have been held by the Labour party for decades, and have a history of socialist and communist organisation. Conversely, the most right-wing constituencies (Orpington, Esher, and Walton) are (recently) affluent areas on the periphery of London. The most libertarian constituency, Islington North (2.56), is often used as a metonym for a supposed liberal metropolitan elite, while the most authoritarian constituencies (Houghton and Sunderland South (3.63) and Clacton (3.61)) voted to leave the European Union (EU) by large margins.
Visual representation
Figure 1 shows multiple small scatterplots showing constituency positions on the left-right dimension (on the horizontal axis) against party member positions (on the vertical axis). A solid line shows the results of a generalised additive model in which party member position is a smoothed function of constituency position. The plot shows vertical striation, which is the result of averaging over a small number of ordinal responses. The ratio of the scales is very different, showing the difference between the small spread of constituency positions and the very large spread of party member positions, even considering party members from the same party. The smoothed fits generally are either flat (Liberal Democrats, Labour) or increasing in constituency position (all other parties).
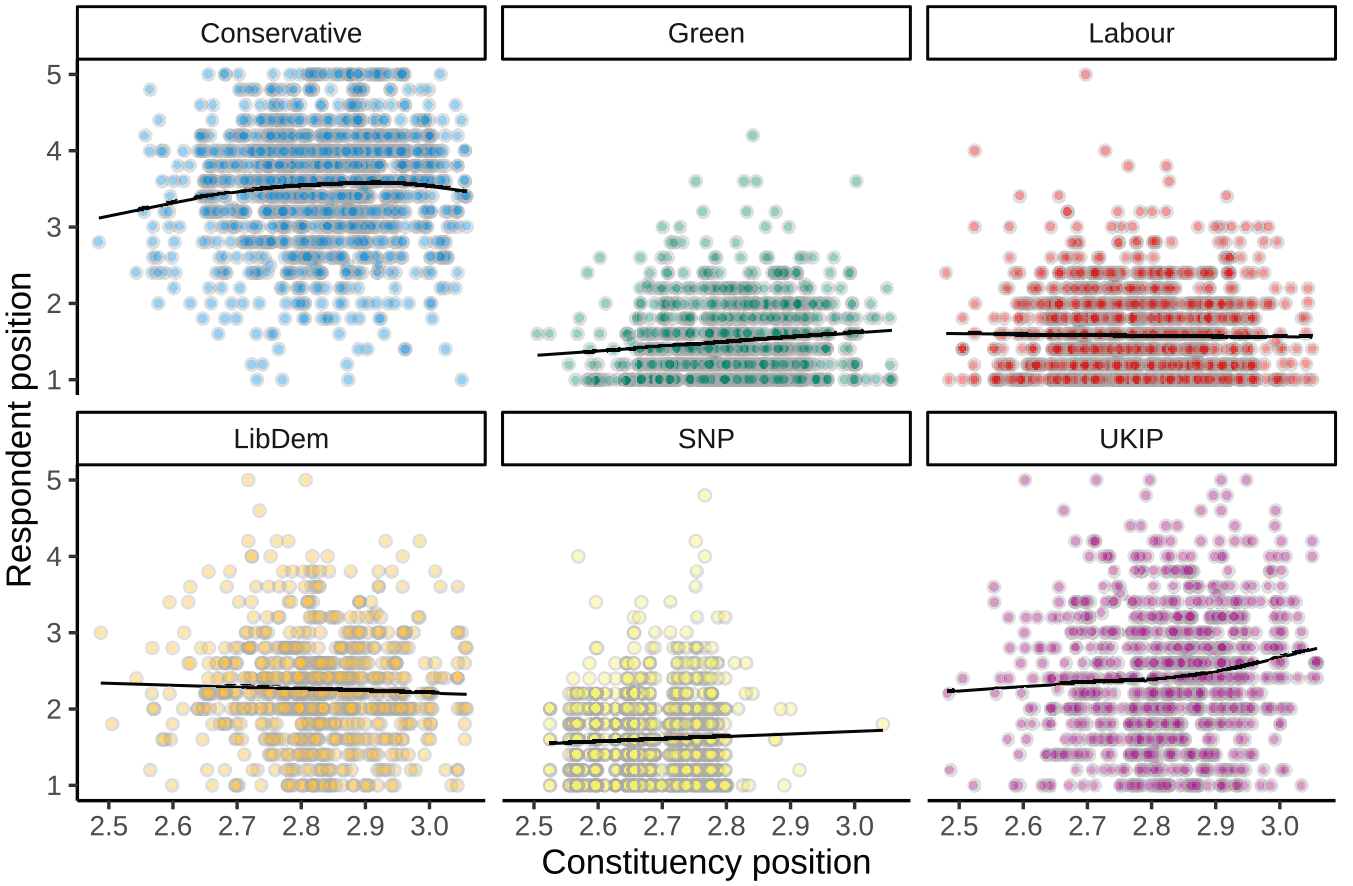
Party member positions on the left–right dimension by constituency positions, by party.
Figure 2 repeats this for the authoritarian–libertarian dimension. The smoothed fits seem to show a stronger relationship between constituency opinion and the average respondent position, with the possible exception of United Kingdom Independence Party (UKIP) respondents, where the relationship is flat. These figures are useful – but are these impressions born out by more structured models?
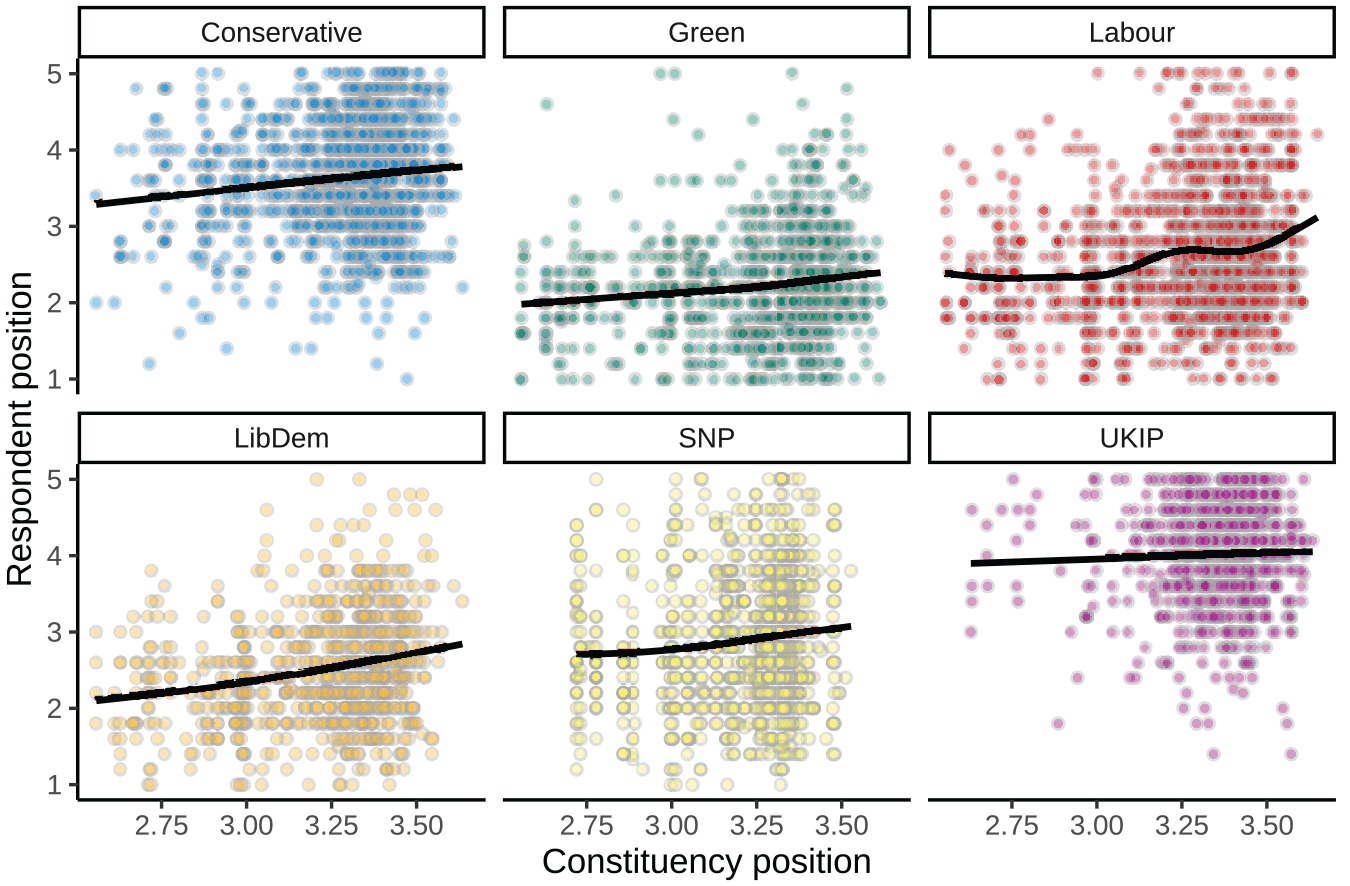
Party member positions on the authoritarian–libertarian dimension by constituency positions, by party.
Model
In this section, we describe the model we use to study the positions of individual party members. Modelling individual party members is the only possible course given the data available. In a following section, we describe the implications of our findings for ‘average’ constituency party positions, but these implications are only obtainable using stylized assumptions about how local parties decide in aggregate. There are three features of our individual-level data which make modelling challenging. First, the response variable has a limited range. Responses lower than 1 or greater than 5 are not possible. Modelling bounded or censored data using models designed for continuous data risks biasing our coefficients downwards. This risk is particularly significant given that a non-negligible proportion of our responses are at the boundary.
Second, our key independent variable, estimated constituency opinion, is a noisy measure. Inclusion of measures without accounting for measurement uncertainty also risks biasing coefficients downwards. Again, this risk is a genuine one, because the standard error of our constituency position estimates is large relative to the spread of the constituency positions.
Third, our respondents are clustered within constituencies. Although we are interested in explaining their positions using a constituency-level measure, there will be other characteristics of respondents’ constituencies which we do not observe, and for which we must make an allowance.
We therefore estimate a multilevel errors-in-variables model for a censored response.
2
It is helpful first to set out the model for how an unobserved quantity,

We can then relate this unobserved quantity
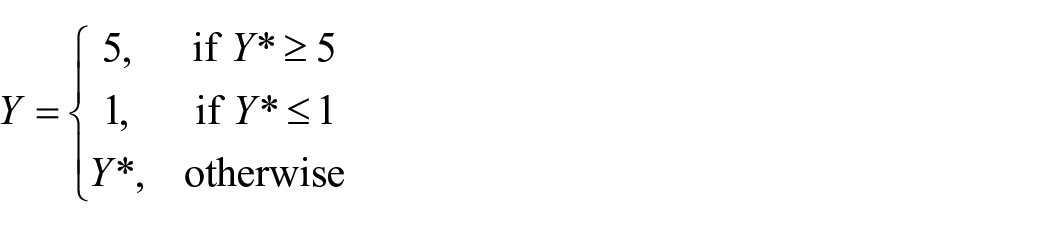
This deals with the first particular feature of our data, the presence of censoring. To deal with the second particular feature of our data (the presence of error in our measurement of constituency opinion), we once again relate an unobserved quantity to an observed quantity. If

The final feature of our data (clustering of respondents in constituencies) is dealt with by estimating a constituency-level random intercept (
Although not simple in absolute terms, this is the simplest possible model which respects the characteristics of the data. It would be possible to estimate a more complex model – for example, to allow the effects of constituency opinion to vary by party, or to allow the relationship between constituency opinion and respondent opinion to follow a different functional form rather than a linear relationship. In the Appendix 1, we present results from models which allow the effects of constituency opinion to vary by party, but we also show that there are good reasons to prefer more parsimonious models in which there is a single effect of constituency opinion.
We estimate this model using the brms package for the R statistical environment (R Core Team, 2019); brms (Bürkner, 2017) is a package for estimating models using Bayesian techniques, and is built on top of Stan, a probabilistic programming language (Stan Development Team, 2020). Each model was run for 2000 iterations per chain using 1000 iterations as burn-in. We set N(3, 1) prior on the intercept and a N(0, 2) prior on all coefficients to reflect our belief that the intercept is somewhere between the minimum and maximum values of one and five but very unlikely to be beyond these values, and to reflect our belief that a single variable would be unlikely to do more than move a respondent from the midpoint of the response scale to the upper or lower end. There were no problems with convergence as measured by the
Results
Table 1 shows the results of two multilevel linear regressions of individual party members’ views on the left–right and authority–liberty dimensions. The coefficients in each model can be interpreted as in a linear regression (i.e. as expected changes in the dependent variable given a one-unit change in the independent variable). The coefficients are reported together with two measures of fit: the Bayesian
Multilevel regression models of party members’ political views. 95% credible intervals reported in square brackets.
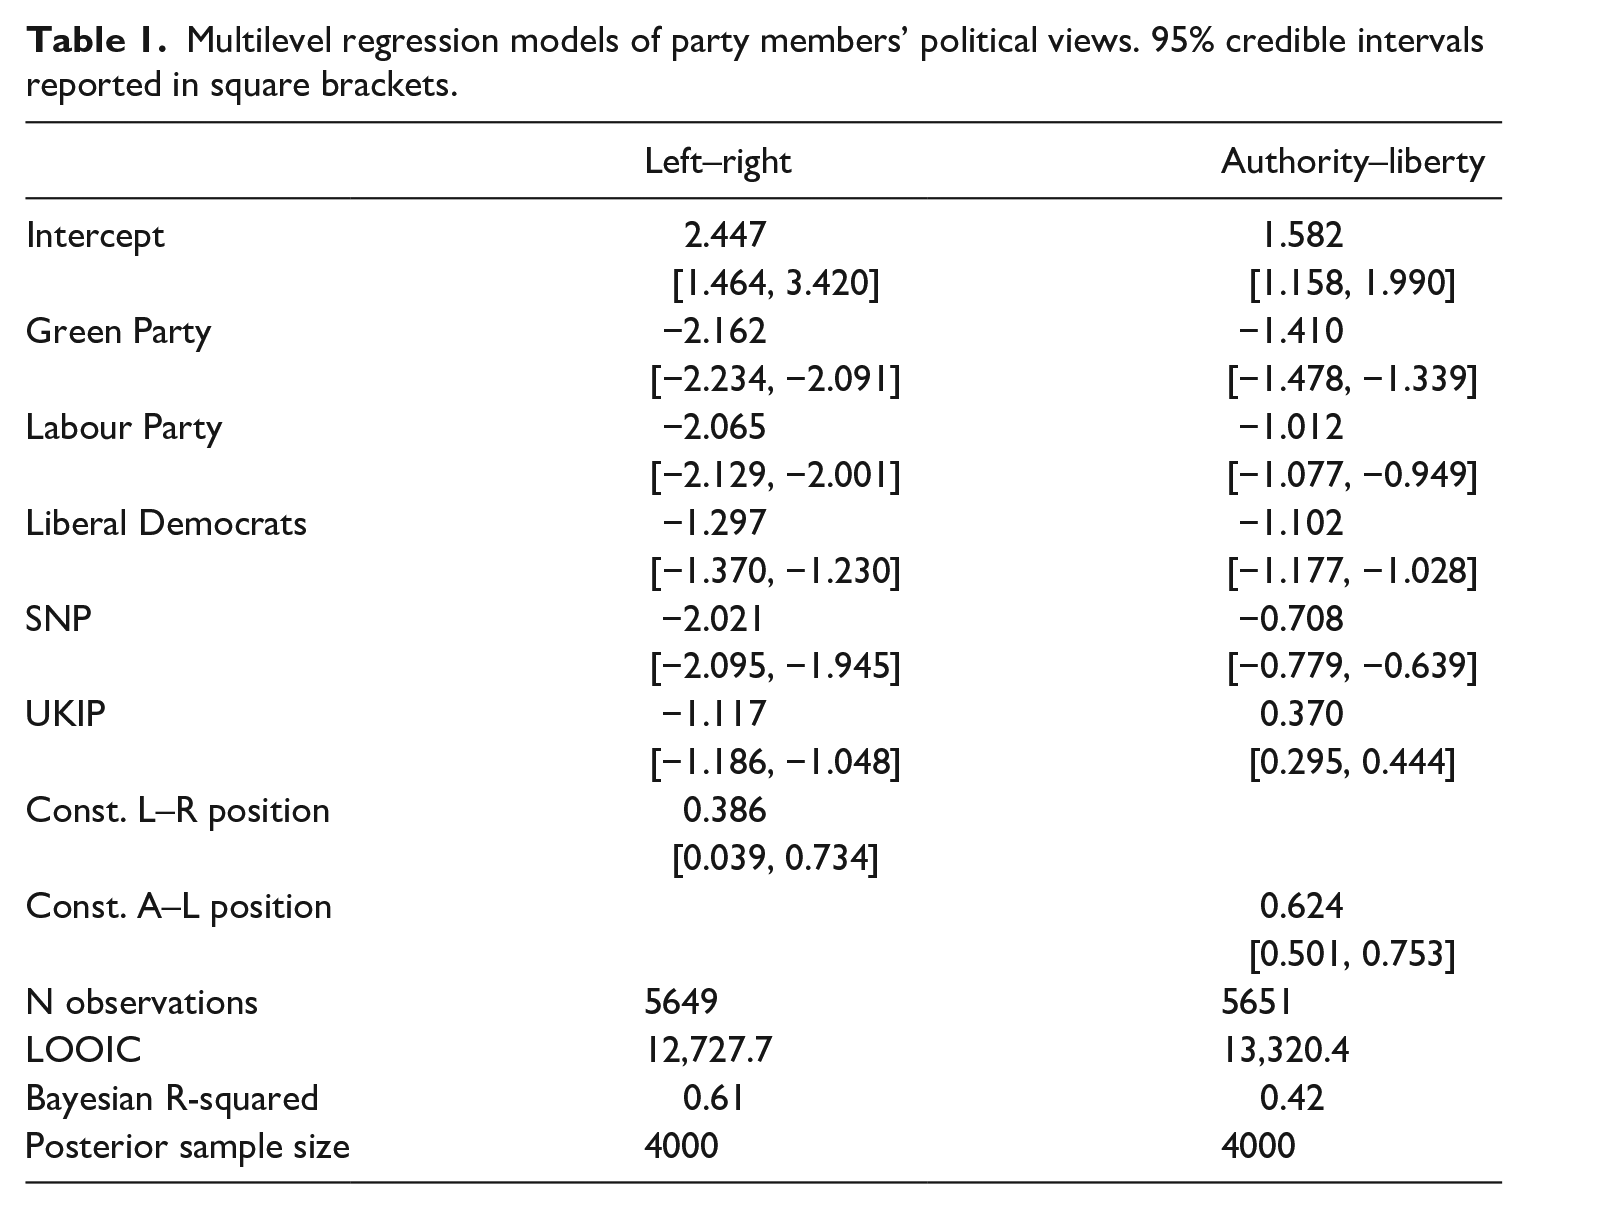
Before discussing the effects of constituency opinion, and as a form of sense-check on the model, we discuss the effects of party. Relative to members of the Conservative party (the reference category) members of all other parties are more left-wing (i.e. have negative coefficients); these differences are less pronounced for the Liberal Democrats and UKIP members. Turning to authority–liberty, the only party with more authoritarian members (i.e. a positive coefficient) than the Conservative party is UKIP; all other parties are reliably more permissive. These findings match our understanding of UK party politics in general and the findings of Bale et al. (2019: Appendix 1).
Turning to the effects of constituency opinion, because the measurements of constituency and respondent position are on the same scale, the coefficients in each model show the change in respondent opinion we would expect from an analogous change in constituency opinion. Each unit change in constituency left–right opinion is associated with a change of around two-fifths of a unit in the positions of party members from that constituency, though there is considerable uncertainty surrounding this point estimate. The association between constituency opinion and respondent position on the authority–liberty scale is stronger, at around three-fifths, and is more precisely estimated because fewer of the responses are at the lower and upper bounds of zero and five, respectively.
Although the coefficients on constituency opinion are significantly different from zero and may be quite large relative to the maximum value we might expect (a coefficient of one, where a one unit change in constituency opinion is associated with a one unit change in party member opinion), they explain a relatively small proportion of the total variance in individual respondents’ left–right and authoritarian–libertarian positions. The total range of the constituency opinion variable is 0.8 units, but the total range of individual respondent opinion is four units (i.e. from 1 to 5). Even if our coefficients reached their maximum value of one, it would still only be able to explain a small proportion of the observed variation in individual respondent opinion. The coefficients on party do much more work and ensure that the total variance explained by the models is between two-fifths and three-fifths.
These coefficients relate to individual party members, but individual party members do not select local candidates by themselves, only in groups. We now discuss a stylized example of a local party selection meeting to show possible implications of our findings for dyadic representation. Suppose that individual party members select based on their own position, rather than any concern for the position of the constituency more broadly. Suppose also that all party members attend selection meetings (or alternately that local party members attend selection meetings at random). Finally, suppose that group decision-making follows majority rule, and that therefore the position of the median party member is particularly important. In this scenario, the relationship between local opinion and the median party member will be stronger than the relationship between local opinion and a random party member, because medians are necessarily less subject to idiosyncratic error than individual members are. The relationship between constituency opinion and the local party median will depend to a large extent on the number of members participating.
To work out the likely correlation between constituency opinion and local party medians, we simulated 25 and 250 Conservative party members per constituency 100 times, incorporating uncertainty about the individual-level relationship between constituency opinion and individual opinion, uncertainty about constituency random effects, and fundamental uncertainty. We then calculated constituency medians and then, because constituency opinion is measured imperfectly, calculated the attenuation-corrected correlation coefficient (Spearman, 1904) between constituency opinion and the constituency party median. With an effective number of 25 party members per selection meeting, the correlation between constituency opinion and local party median is somewhat greater than the coefficient reported above, at 0.60 (95% credible interval = 0.32–0.84). With an effective number of 250 party members per selection meeting, the correlation is much higher, at 0.94 (95% credible interval = 0.53–1.25; note that confidence intervals on attenuation-corrected correlations can exceed 1). The lower number of 25 party members per selection meeting is probably pessimistic even for the Conservative party; the upper number of 250 members per selection meeting would, for the Conservatives, only be attained if a very high proportion of their total membership attended (2019 membership is reported as being 180,000 which divided by 632 constituencies gives a figure of 285 members per constituency). By way of comparison, on average around 35% of party members reported attending any public meeting during the 2015 general election campaign (Bale et al., 2019: 102).
These individual-level figures therefore imply a strong potential for local party selectorates to be responsive to their local areas, in the sense that local parties from more left-wing areas are more left-wing than local parties from more right-wing areas. In identifying the potential for responsiveness of this kind, we must note that we have not, in this article, shown anything about local party responses to changes over time in local opinion. We also note that we have shown an association between local views and local party members’ views, without showing that this constitutes strong congruence; while a given party’s members in a relatively left-wing constituency are generally more left-wing than their counterparts in a relatively right-wing constituency, party members are still almost always further left (in the case of Labour, Liberal Democrats, Greens, Scottish National Party) or right (in the case of the Conservatives) than local voters; they are also generally more socially liberal (except for members of UKIP).
Are party members different to party supporters?
We have shown that the views of local party members are associated with local opinion, in the specific sense that the slope of a regression model which links local opinion and individual member opinion is reliably greater than zero. But it is also interesting to know whether party members are in some sense less responsive to local opinion than ordinary party supporters, perhaps because membership appeals to a particular type of person who is more ideologically consistent and less prone to varying their political views.
In order to investigate this possibility, we combine our data on party members with a dataset on party supporters. These are individuals who reported strongly identifying with a party, but who were not party members. These individuals were surveyed at the same time and as part of the same fieldwork as the party members discussed earlier, and so although we have presented these as two separate sources of data, this separation is artificial. We reunite these two data sources and create for our party supporters the same summary measures of left–right and authority–liberty orientation.
Figure 3 shows the left–right and authority–liberty positions for members and supporters of different parties. The figure shows that members are more right-wing for right-wing parties (Conservative, UKIP) and more left-wing for left-wing parties (Labour, Green, SNP), with Liberal Democrat members being more centrist. However, party members of all parties are uniformly more liberty-oriented than authority-oriented, even for parties which are towards the authority end of this scale. This suggests that the party membership process may act as a filter, selectively recruiting more liberal individuals, and weakening an otherwise existing relationship between local area and individual opinion on social issues.
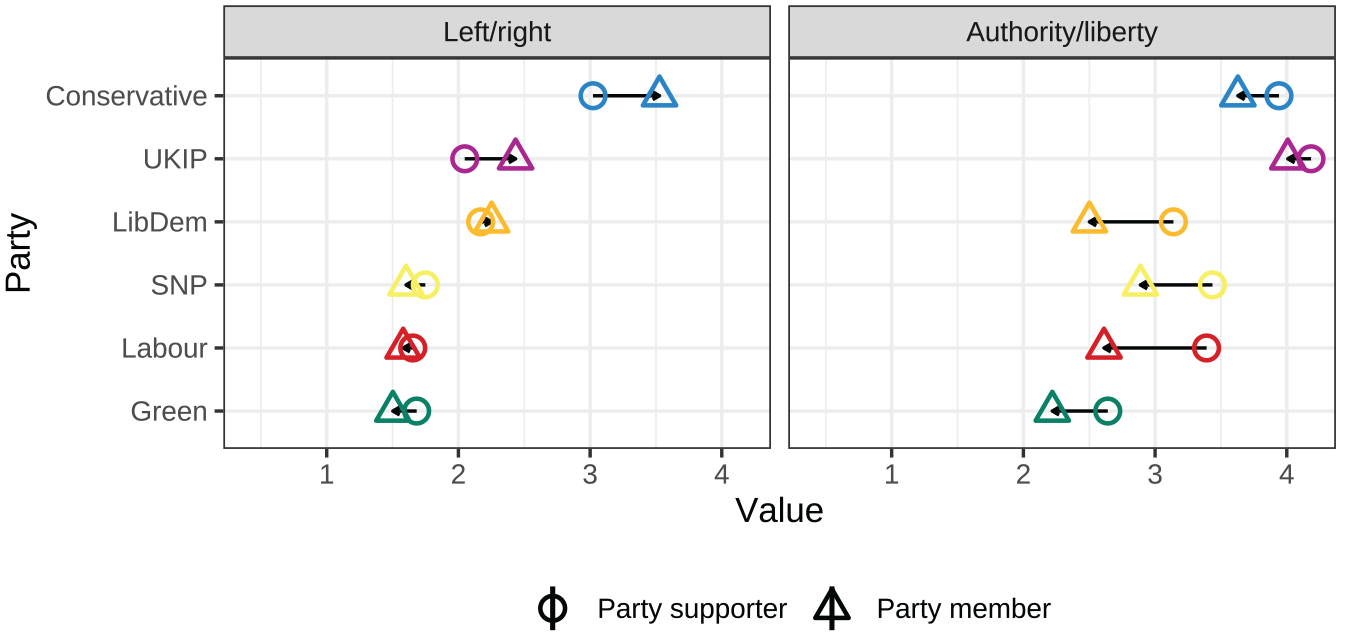
Member versus supporter positions.
To test this more rigorously, we estimate a regression model on our combined dataset. As before, we control for party, but we now allow party to interact with membership status. In this way, we allow for party members to have systematically different issue stances to party supporters. We also interact party membership with local opinion. This interaction term is our key focus: if the interaction term is negative, it implies that party members are less responsive to local opinion.
Table 2 shows the results of these regressions. The unconditional effect of party membership shown is the effect of party membership for members/sympathisers of the reference party, the Conservatives. As we have already seen from Figure 2, the effects of party membership for the left-wing parties are to reliably make respondent positions more left-wing (more negative values); there are no clear effects for the Conservatives or UKIP.
Multilevel regression models of political views for both party members and party supporters.
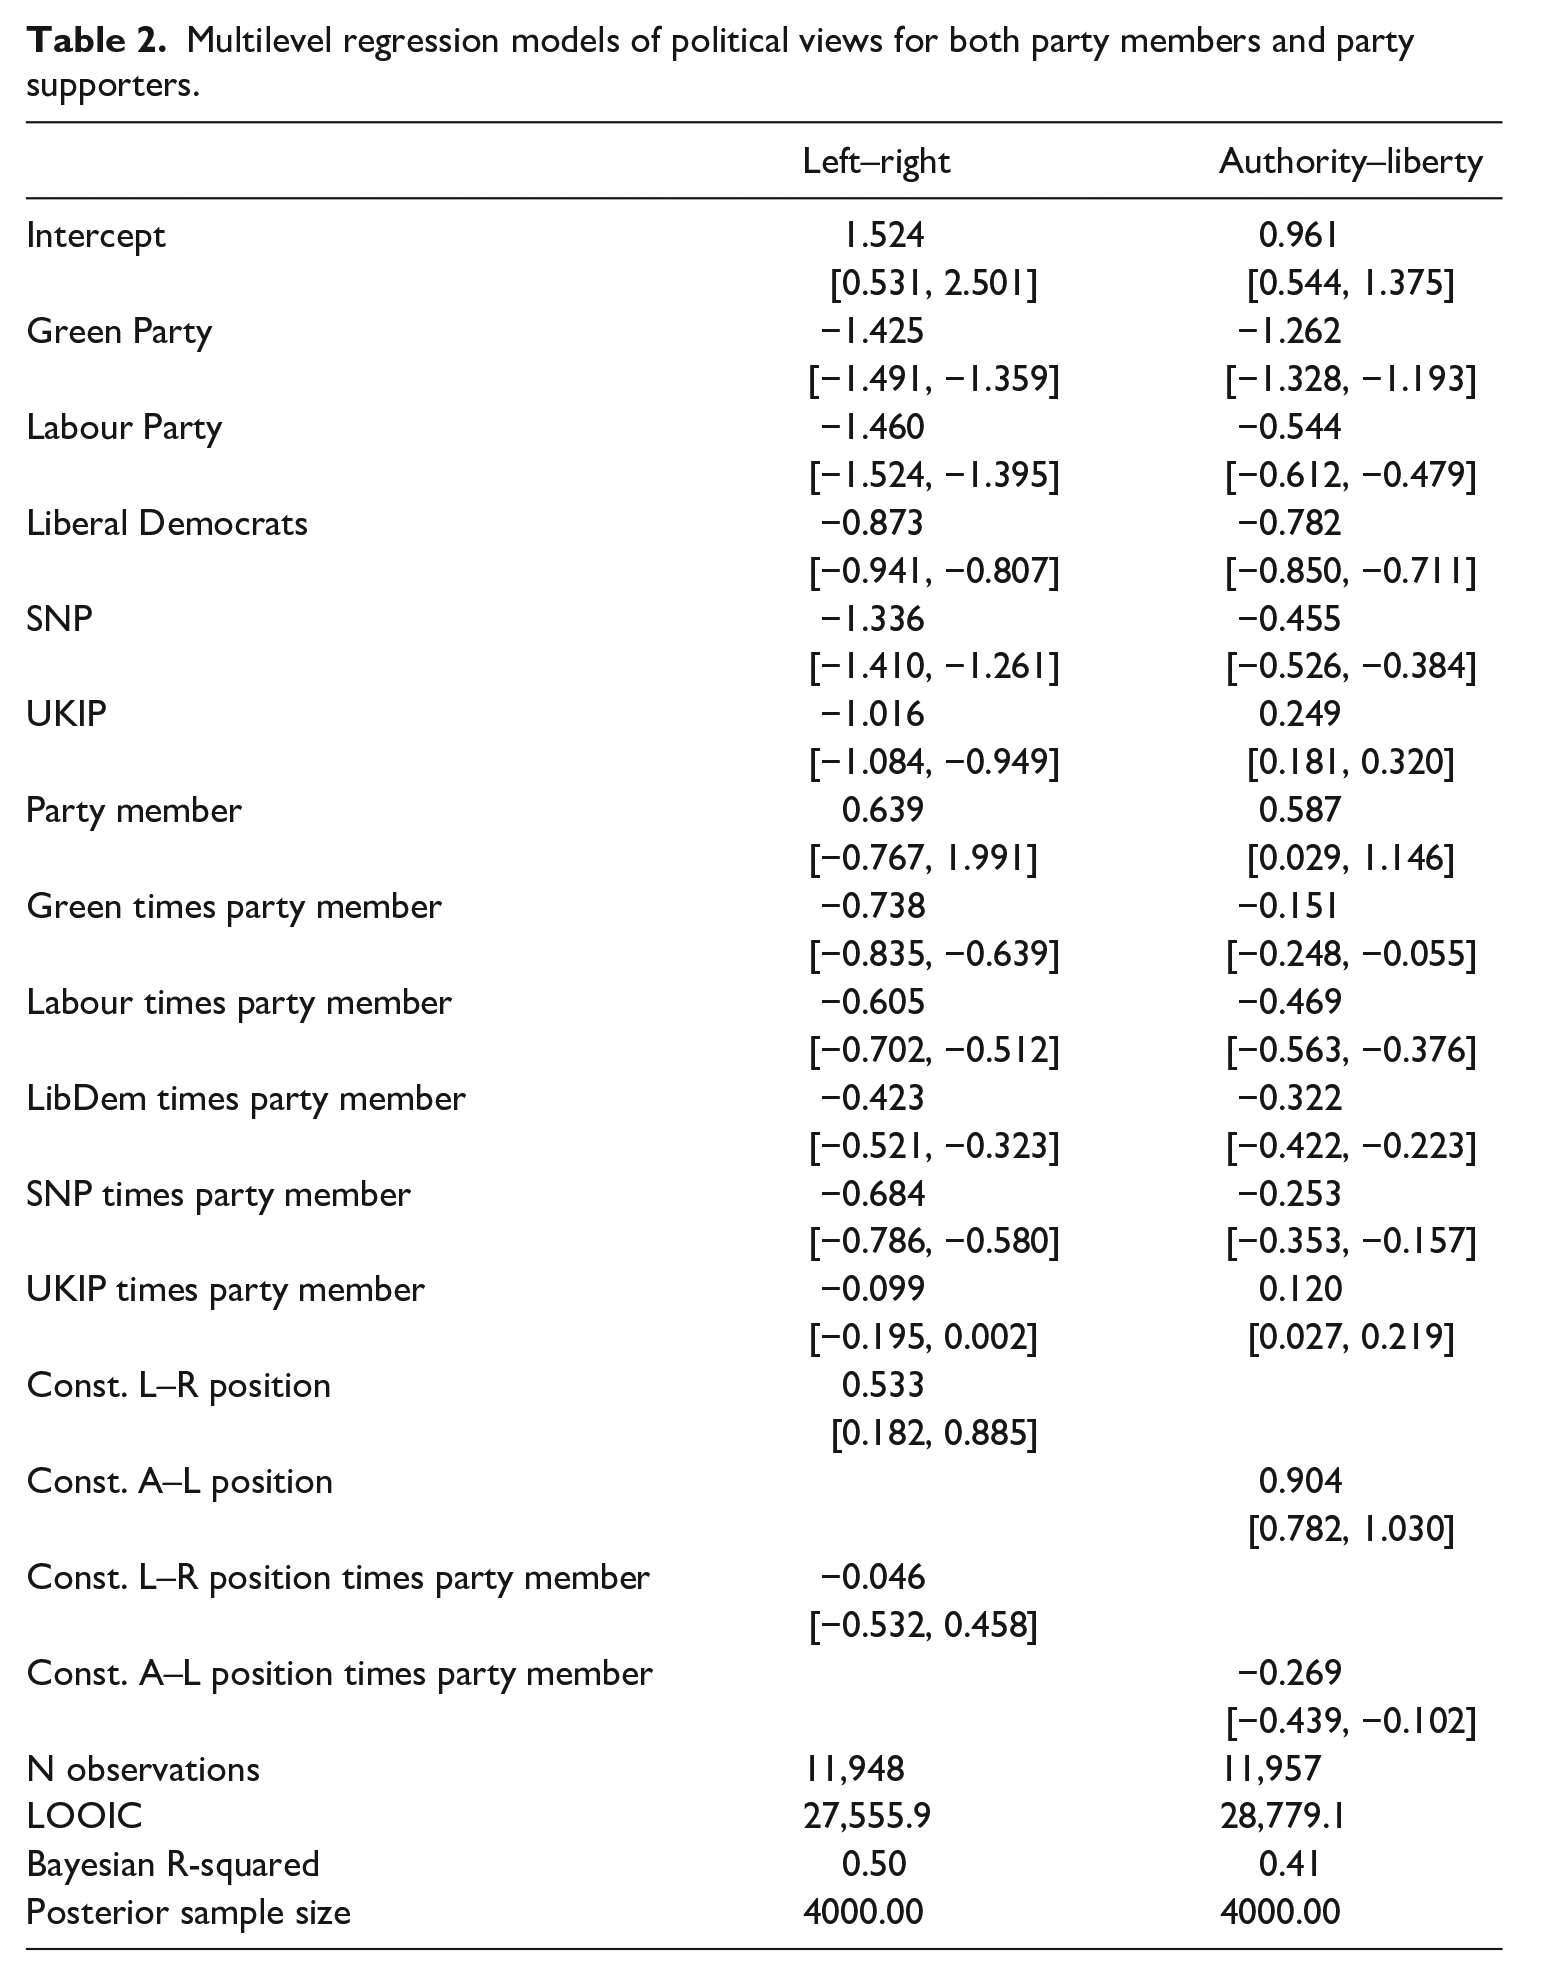
What about the varying effects of constituency position by party membership? The effect of a one unit change in constituency opinion on the left-right position of party sympathisers is 0.533 units, but this is very imprecisely estimated, and we cannot rule out much smaller effects of roughly 0.2 units. The effect of a one unit change in constituency opinion on the left-right position of party members is 0.533 – 0.046 = 0.487 units. However, given the sizable uncertainty surrounding the interaction term, we cannot rule out the possibility that party supporters’ and members’ views are correlated with local opinion to the same degree.
If now we turn to the associations on the authority–liberty dimension, we begin to see differences emerge between party supporters and party members. The effect of a one unit change in constituency authority–liberty position on party supporters is 0.904 units, but the effect on party members is 0.904–0.269 = 0.635 units. We can therefore say that party members’ opinions are less tightly bound up with local opinion on the authority–liberty dimension than are the views of party supporters. This is in part because party members have views that are significantly further to the liberty end of the authority–liberty dimension.
Conclusion
In this article, we have studied the views of party members in the United Kingdom and found that while their views are not necessarily highly congruent with the views of their fellow constituents, there is nevertheless a strong association with those views: party members in left-leaning areas have more left-wing views, and vice versa. This association varies across dimensions of political competition: the association with local views is stronger on the authority–liberty dimension. This stronger association occurs despite evidence that party members are predisposed to the liberal end of that dimension. Party members’ views on this dimension are less tightly bound up with local opinion than individuals who support parties but who (for various reasons) are not joiners.
Our study is based on party members in the United Kingdom, but there is no a priori reason why these findings should not apply to other polities with similar levels of (and conceptions of) party membership. Although we do not see any scope restrictions on the generalisation of our findings, we recognise that the practical relevance of our findings is likely to be greater in systems (like the United Kingdom’s) where candidates are selected at local level for contests in small magnitude electoral districts, and where voters have no way of expressing preferences between candidates of the same party. In such settings, moving from localised to centralised candidate selection would likely reduce the ideological heterogeneity of candidates, at the cost of reduced electoral benefits of candidate-constituency congruence. Navigating this trade-off thus depends on complicated instrumental calculations of relative electoral advantage, together with expressive commitments to local party democracy.
Future research on party members should explore the ways in which party characteristics mediate the relationship between local and party member opinions. We have analysed a single unmediated link by combining data from members of multiple parties, from large catch-all parties to niche or single-issue parties. The small number of parties in the United Kingdom prevents us from testing whether the constituency link is weaker among broad programmatic parties than it is among niche or single-issue parties, but this is clearly an open question which could suitably be addressed by comparative research.
More broadly, our research points to the problems that parties have in competing on the secondary authoritarian–libertarian dimension of political competition. Party members are, by definition, ‘joiners’, and joiners have different views on the authority–liberty dimension. Accordingly, the mismatch between party opinion (construed broadly to include candidates and party members) and local opinion can become considerable. This trend is already clear for parties on the centre-left (Gidron, 2022), but we have shown that this problem can also affect other types of party.
Footnotes
Appendix 1
Declaration of conflicting interests
The author(s) declared no potential conflicts of interest with respect to the research, authorship, and/or publication of this article.
Funding
The author(s) disclosed receipt of the following financial support for the research, authorship, and/or publication of this article: Bale and Webb received funding from the ESRC for their Party Members Project [reference ES/M007537/1].