
Abstract
Is there a gender gap in voting? Most cross-national survey research on gender inequalities in voter turnout finds that men have a higher probability to vote than women. Yet, some studies using validated turnout data shed some doubt on this finding. We revisit the question of a gender gap in voting using official records. In more detail, we compare the gender gap in turnout between survey data and official electoral figures across 73 elections. Our results highlight that in surveys, men still report higher turnout in most countries. However, official electoral figures reveal contrasting trends: across countries, women are, on average, more likely to vote. We also test two explanations for this difference in turnout between official figures and surveys: (1) men over-report voting more than women and (2) the survey samples of men and women are different. We find some, albeit very moderate, evidence for the first explanation and no support for the second explanation. All in all, our research nevertheless suggests that scholars should be careful in using surveys to detect gender differences in voting.
Keywords
Introduction
One of the major discrepancies in voting research between survey data and validated survey data concerns the likelihood of men and women to vote. By relying on self-reported measures of turnout, most cross-national surveys suggest that there exists a gender gap in electoral participation (Córdova and Rangel, 2017; Isaksson et al., 2014; Kittilson and Schwindt-Bayer, 2012; Kostelka et al., 2019; Robinson and Gottlieb, 2021; Solijonov, 2016). Yet, the little research we have that compares self-reported turnout to individuals’ official voting record disconfirms this gender gap in favour of men (Ansolabehere and Schaffner, 2017; MacManus, 2018). The validated data seem to indicate that women have a (slightly) higher likelihood to vote than men. Does this signify that survey research is a suboptimal means to study gender differences in turnout? Ideally, we would use validated survey data from different contexts to answer this question. Unfortunately, validated survey data are rare, often based on non-representative samples and frequently restricted to one country. Therefore, it is impossible to establish cross-national gender differences in turnout with validated turnout data.
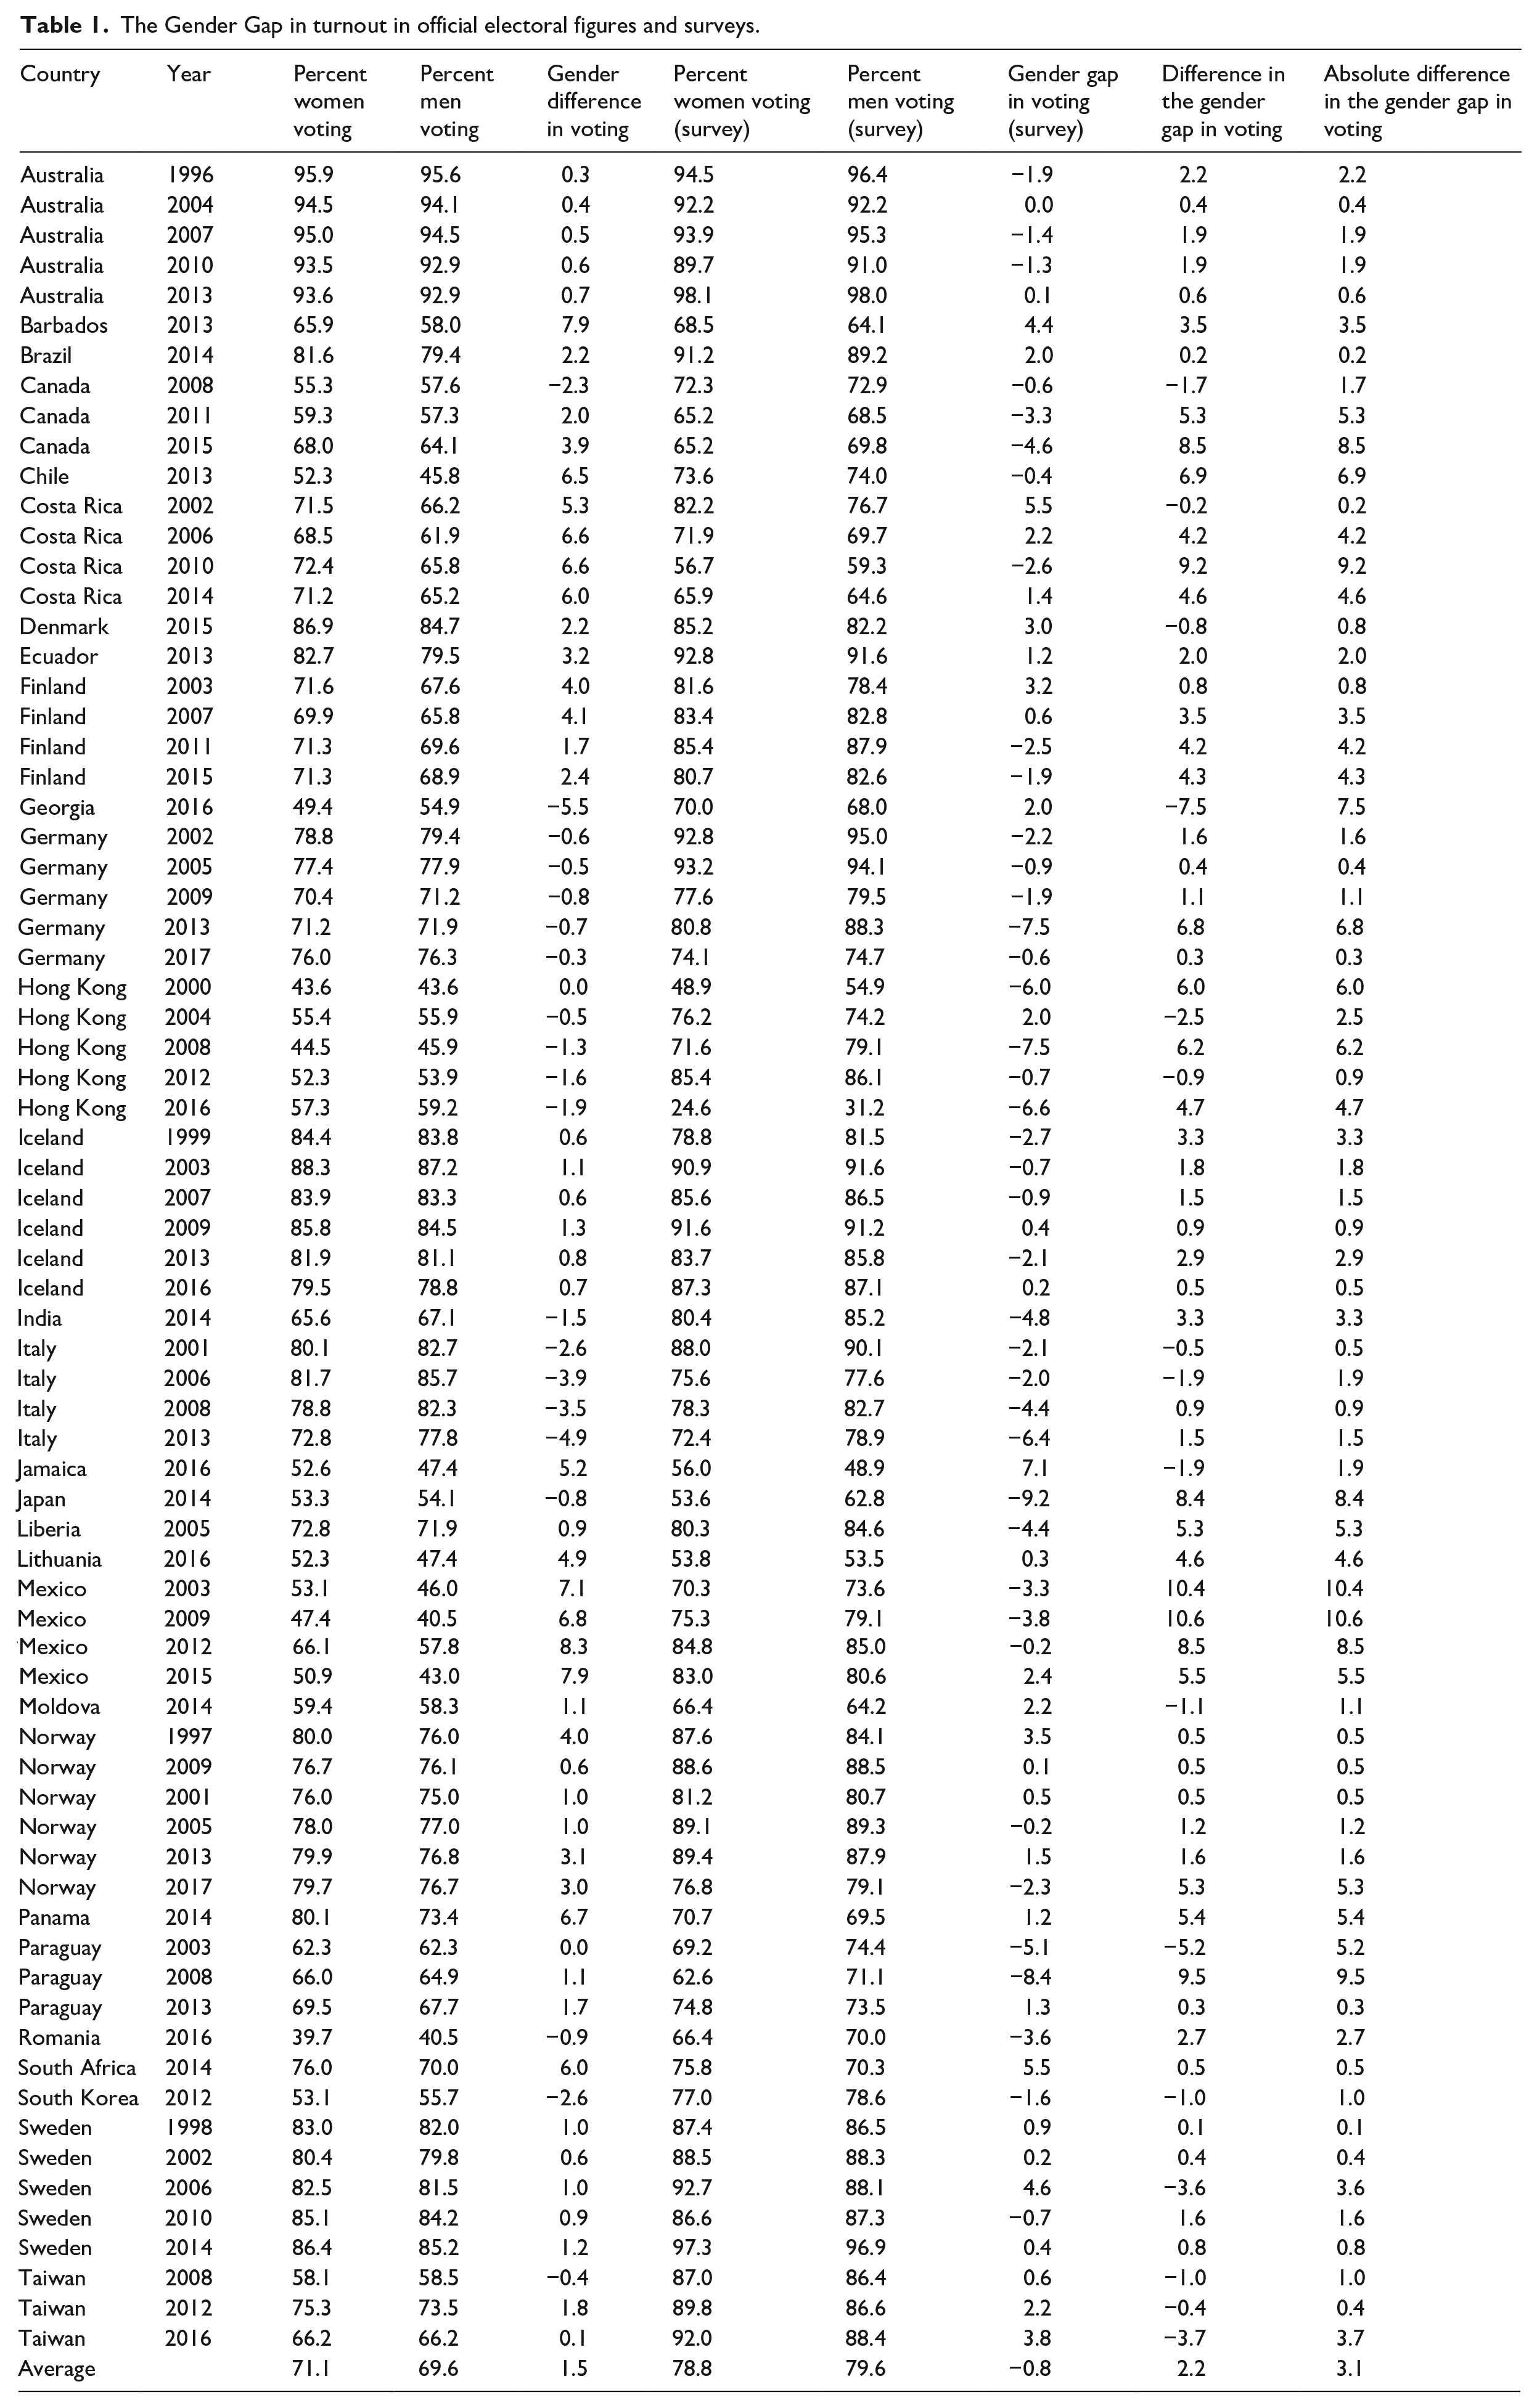
In the absence of validated turnout data, how else can we verify survey data and determine whether or not there is a gender gap in turnout and, if so, what is its direction? We suggest the use of official turnout figures, which we could collect for 73 elections in 26 countries (see Table 1). We compare these official turnout figures with data derived from cross-county surveys and find that more often than not, the self-reported gender gap in voting from surveys is a poor proxy for the gap in voting between men and women. In fact, the official figures suggest that women in most countries have a higher likelihood to vote. Finally, we discuss two potential explanations for why men potentially report higher turnout than women: (1) men might have an increased tendency to over-report turnout in surveys and (2) the sample of men and women respondents might be different.
The Gender Gap in turnout in official electoral figures and surveys.
A gender gap in voting: What does the empirical literature say?
It is currently unclear if a gender gap in voting still exists. There are two strands of research. First, most comparative studies concur that, as a general rule, men are still more likely to vote than women (Blais and Kostelka, 2015; Bratton et al., 2010; Córdova and Rangel, 2017; Engeli et al., 2006; Isaksson et al., 2014; Kittilson and Schwindt-Bayer, 2012; Kostelka et al., 2019; Robinson and Gottlieb, 2021; Söderlund et al., 2011). To name a few examples, Kittilson and Schwindt-Bayer (2012) find that women report lower turnout in 21 of 31 mainly Western democracies. Similarly, Solijonov (2016) reports that in the majority of 59 studied countries, men still report higher turnout than women. Some recent studies also bolster this finding of a gender gap, where men are more likely to turn out at Election Day. For example, using data from the European Elections Project, Dassonneville and Kostelka (2021) report a consistent gender gap in favour of men in European Parliament (EP) elections since 1979. They attribute this increased propensity to vote to men’s higher political interest.
If we look at large-scale international survey programmes instead of single studies, we find that most of these survey programmes tend to confirm this higher voting propensity for men. These survey programmes include the Comparative Study of Electoral Systems (CSES) (Córdova and Rangel, 2017; Kittilson and Schwindt-Bayer, 2012), the World Values Survey (WVS) (Solijonov, 2016), the European Election Study (EES) (Kostelka et al., 2019; Söderlund et al., 2011), the Afrobarometer (Bratton et al., 2010; Isaksson et al., 2014; Robinson and Gottlieb, 2021), and the European Election Database (Blais and Kostelka, 2015). 1 The three survey programmes which shed some doubt on this gender gap is the International Social Survey Program (ISSP), the AmericasBarometer, and the Asian Barometer Survey from 2010. The two versions of the ISSP module on citizenship, which include 18 and 33 countries, respectively, find inconclusive results with regard to who votes more, men or women. For the 2004 version, the self-reported turnout was 84% for men and 83% for women (Coffé and Bolzendahl, 2010). For the 2014 version, it was 85% for women and 84% for men (Carreras, 2018). Research articles using the AmericasBarometer further find that there is either no significant difference in the propensity of men and women to vote (Espinal and Zhao, 2015) or that women vote more frequently, albeit very moderately (see Carreras and Castañeda-Angarita, 2014). Finally, the Asian Barometer seems to display no gender gap in voting, but a gender gap in favour of men for other types of political action (see Liu, 2020).
While five out of the eight survey programmes, we refer to above, still suggest that men are more likely to vote than women, there is some literature that contests this claim. First, there are few comparative case studies that compare the official voting numbers for men and women. This research concludes that the turnout gap between men and women vanishes. For instance, Pintor and Gratschew (2002), as well as Norris (2002) report that turnout differences in favour of men have vanished or reversed between 1945 and 1999 in seven of the eight countries they study (i.e. Finland, Germany, Iceland, Sweden, Malta, New Zealand, India and Barbados). Norris et al. (2004) also find a gradually closing gender gap in voting in the United Kingdom in the years 1964–2001.
Second, and more importantly, a closer look at studies using validated turnout data increasingly point to a disappearance in a gender gap in voting or even a reversed gap. To take a concrete example, if we analyse the validated turnout data from the 2016 US Cooperative Congressional Election Survey (CCES), we find that women’s turnout was approximately 4 percentage points higher than men’s turnout for the 2016 US Presidential Elections (Ansolabehere and Schaffner, 2017). More recently, MacManus (2018) corroborates this finding: he too finds that women have displayed a higher rate of voting than men in recent elections (see also Reingold and Harrell, 2010). Hence, the growing evidence from validated survey data questions the findings derived from surveys that men are more likely to participate in voting than women.
Research design
How to investigate whether surveys accurately gauge a gender gap in voting? Ideally, we would compare survey respondents’ answers to whether they voted to the official record. We would get unbiased estimates, if we were to validate a representative or random sample of survey respondents with their actual vote. Unfortunately, validated survey data are not available across countries. In fact, even in those countries with validated data, most information comes from samples, which are not representative of the population. The largest project, the CCES, uses an online panel that includes more than 50,000 US participants. Yet, this online panel is far from representative of the larger population. The average panel member is 60 years old, and validated turnout among participants is 80% (about 20 percentage points higher than official turnout). Another project that attempts to validate voting is the American National Election Survey (ANES). However, it validates a mere 20% of its sample (around 300 individuals per survey). Moreover, the ANES does not randomly chose participants for validation. In countries outside the United States, there is less systematic collection of validated data. As a result, with the current data, it is difficult to answer conclusively across countries whether there is a gender gap in voting.
Then how can we test whether survey data provide valid estimates when analysing the gender gap in voting? We follow earlier research such as Pintor and Gratschew (2002), as well as Norris (2002) and suggest retrieving official turnout figures as the next best solution after validating self-reported turnout with official records. Official turnout figures are frequently not readily available, but many electoral commissions or statistical offices collect these data. To retrieve and analyse these figures, we engaged in a process consisting of several steps. First, we contacted every national electoral commission or electoral office per email and asked if they collect turnout data for their national election split by gender and if they could send us these data. These official figures vary in their construct. Sometimes they capture the whole voting register. At other times, they are validated records for a smaller but representative sample of the voting age population. As such, we consider them the best available estimate of actual voter turnout across countries (Appendix 1 describes sources).
Second, we consulted major cross-national surveys – the CSES, the WVS, the ESS, the Afrobarometer, the AmericasBarometer, and the Asian Barometer Survey – to compare our official electoral results with the survey data. Except for the Afrobarometer, all these surveys asked respondents if they voted in the last national (presidential) election. Thus, the wording of the voting question is basically the same as in the CSES survey. 2 For matching purposes, we accepted data for the year of the election and 2 years after, as long as the respective survey explicitly captured the same national election as our official turnout statistics.
In cases where we could find several matches, we used the surveys in the order listed above. As such, we adopted a similar approach to Kostelka et al. (2019) and Stephenson et al. (2017) and amassed information on turnout from different survey projects. We used these data to calculate eight parameters (see Table 1): (1) the percentage of female voters based on official figures (see column 3 in Table 1), (2) the percentage of male voters based on official figures (see column 4), (3) the gender difference in voting based on official figures (column 5), (4) the percentage female voters based on survey data (column 6), (5) the percentage of male voters based on survey data (column 7), (6) the gender difference in voting based on survey data (column 8), (7) the difference in the gender gap between official figures and survey data (column 9), and (8) the absolute difference in the gender gap between official figures and survey data (column 10).
Results
Our first finding is that there is a difference in the turnout gap between official figures and surveys. Column 10 in Table 1 illustrates that this difference is 3.1 points, on average, if we just take the net difference regardless of whether men or women vote more frequently. Even more importantly, the electoral figures show that there is a gender gap in voting in the opposite direction than proposed: it suggests that, compared to men, women are more likely to vote. In more detail, the official turnout data highlight that women are more likely to vote in 52 out of the 73 elections (see columns 5 and 9 in Table 1). Throughout the 73 elections, the average difference in favour of women is more than 1.50 percentage points (see column 9 in Table 1). A single-sample t-test further confirms that this gap is statistically different from zero (p < .05). This gap is robust, whether we use data for the 49 country years, where we have official turnout data split by the gender for the eligible population, or the 24 country years, which use a sample of the eligible population to calculate the gender gap in voting. In detail, women’s average participation rate is 1.29 percentage points higher for the cases where there are available gendered voting data for the whole population and 2.00 percentage points for the cases where we calculate the gender gap in voting based on a stratified sample of municipalities or districts. An independent-sample t-test reveals that the difference between the full and the stratified sample is not statistically different from zero (p > .1).
However, if we look at the gender gap derived from survey data, we get a different picture (column 8, Table 1). In this case, we see that men generally report a slightly higher likelihood of voting (i.e. overall 0.8 percentage points more men reported that they voted). An independent-samples t-test reveals that this difference is statistically different from zero (p < .05). In addition, self-reported turnout is higher among men compared to women in 41 of the 73 elections. 3 This result is robust whether we use the CSES, which has a comparable methodology across all participating countries, or any of the other survey projects (i.e. the WVS, the ESS, the Afrobarometer, the AmericasBarometer, and the Asian Barometer Survey). In fact, the average gender gap in favour of men is .91 points in the 41 cases where we could use the CSES and .61 points in the 32 cases where we used another survey. An independent-sample t-test reveals that this difference is not statistically different from zero (p > .1).
Possible biases in survey data
The literature has identified three possible sources of turnout over-reporting in surveys: (1) a recall error, that is, the respondent does not remember correctly whether or not she actually voted (McAllister and Quinlan, 2021); (2) the mode of delivery, that is, there is less inaccuracy or over-reporting in personal interviews compared to telephone interviews (DeBell et al., 2020); and (3) sampling error, that is, the sample participants do not correspond to the larger population they should represent (Berent et al., 2016).
When it comes to gender differences in over-reporting electoral participation, we see two potential biases: (1) men over-report voting more than women do and (2) the sample of men and women is different in a survey, which, in turn, can lead to bias. We preliminary test the first explanation with data from a handful of countries that validate self-reported voting numbers through official registers. In these few settings, we evaluate if these confirmed individual non-voters that falsely stated that they voted are more likely to be men or women. In addition, we use data from the Making Electoral Democracy Work (MEDW) project, which has a ‘face-saving question’ which allows respondents to use some more options on whether they voted in addition to the yes and no option. We preliminary test the second stipulation by analysing Japan, the country with the largest self-reported gender gap in voting (in favour for men) and one of the countries with the largest disparities in the gender gap in voting between survey data and official figures.
Gender, social desirability bias, and turnout
Gender differences in social desirability biases are common in surveys. For example, in the field of domestic work, men tend to overstate their contribution to household work more than women (Press and Townsley, 1998), while in work on public opinion in the United States, men are more inclined to overstate their positive opinions towards a woman as president (Streb et al., 2008). We maintain that there might also be a gender bias in self-reported turnout.
4
While citizens regardless of gender tend to over-report their electoral participation in surveys, we conjecture that this over-reporting might be higher for men (DeBell et al., 2020). There are two explanations why this might be the case; one focusing on social desirability and lying, and another one on memory failure (Belli et al., 1999; 2001). First, it is entirely possible that the social desirability bias is stronger among men. According to Belli et al.: people who exhibit greater confidence and benefit from the political process are more likely to be susceptible to social desirability and self-presentation concerns that result from the expectation to participate in the political process but the failure to have done so. (Belli et al., 2001: 493)
Of the two genders, men generally fit this category better than women. Second, social-psychology research suggests that men tweak reality more often than women do, especially in situations where the stakes are low, because they are less afraid of the stigma associated with getting caught lying (Houser et al., 2016). For instance, through experimental research, Dreber and Johannesson (2008) find that men are more likely to lie for a monetary gain and more prone to incorrectly report the result of a private coin flip. A survey question about voting is likely such a low-stakes situation with no sanctions, and it is therefore entirely possible that men lie more about whether they voted or not than women do. 5
Another explanation contends that men suffer more strongly from memory failure, because voting is more habitual for women than for men. This explanation would affirm that men’s participation is more fluctuating and therefore more susceptible to effects from memory-distortion: in the words of Belli et al. (2001: 495), ‘the increased levels of over-reporting in men are likely associated with the fact that men constitute a larger proportion of intermittent voters than women’.
Table 2 summarises all the studies we could find that compare the validated figures with the self-reported figures for men and women. Seven of the nine studies/surveys we consult confirm that men over-report turnout more than women. The most evidence we could find in favour of this proposition comes from the United States. For example, in the 1976 Center for Political Studies Election Study, the percentage of men who incorrectly indicated that they voted was 15%, whereas for women it was only 12% (for voter registration, 17% of men misreported and 15% of women). For the same election, the self-reported turnout difference between men and women in the survey was 9 points (77% for men and 68% for women), whereas the ‘real’ turnout difference was only 1% (60% for men and 59% for women) (Traugott and Katosh, 1979). Similarly, the ANES from 1964 to 1990 confirms that men engaged more strongly in over-reporting (see Belli et al., 2001). This is also the result of two studies by Ansolabehere and Hersh (2012, 2013). They affirm that: studying reported voters and non-voters, it looks as if men voted more than women; but in the validated vote model, the reverse is apparent, and we know it to be correct that women voted at higher rates than men in 2008. (Ansolabehere and Hersh, 2012: 456)
Gender gap in voting comparing survey data to validated turnout data.
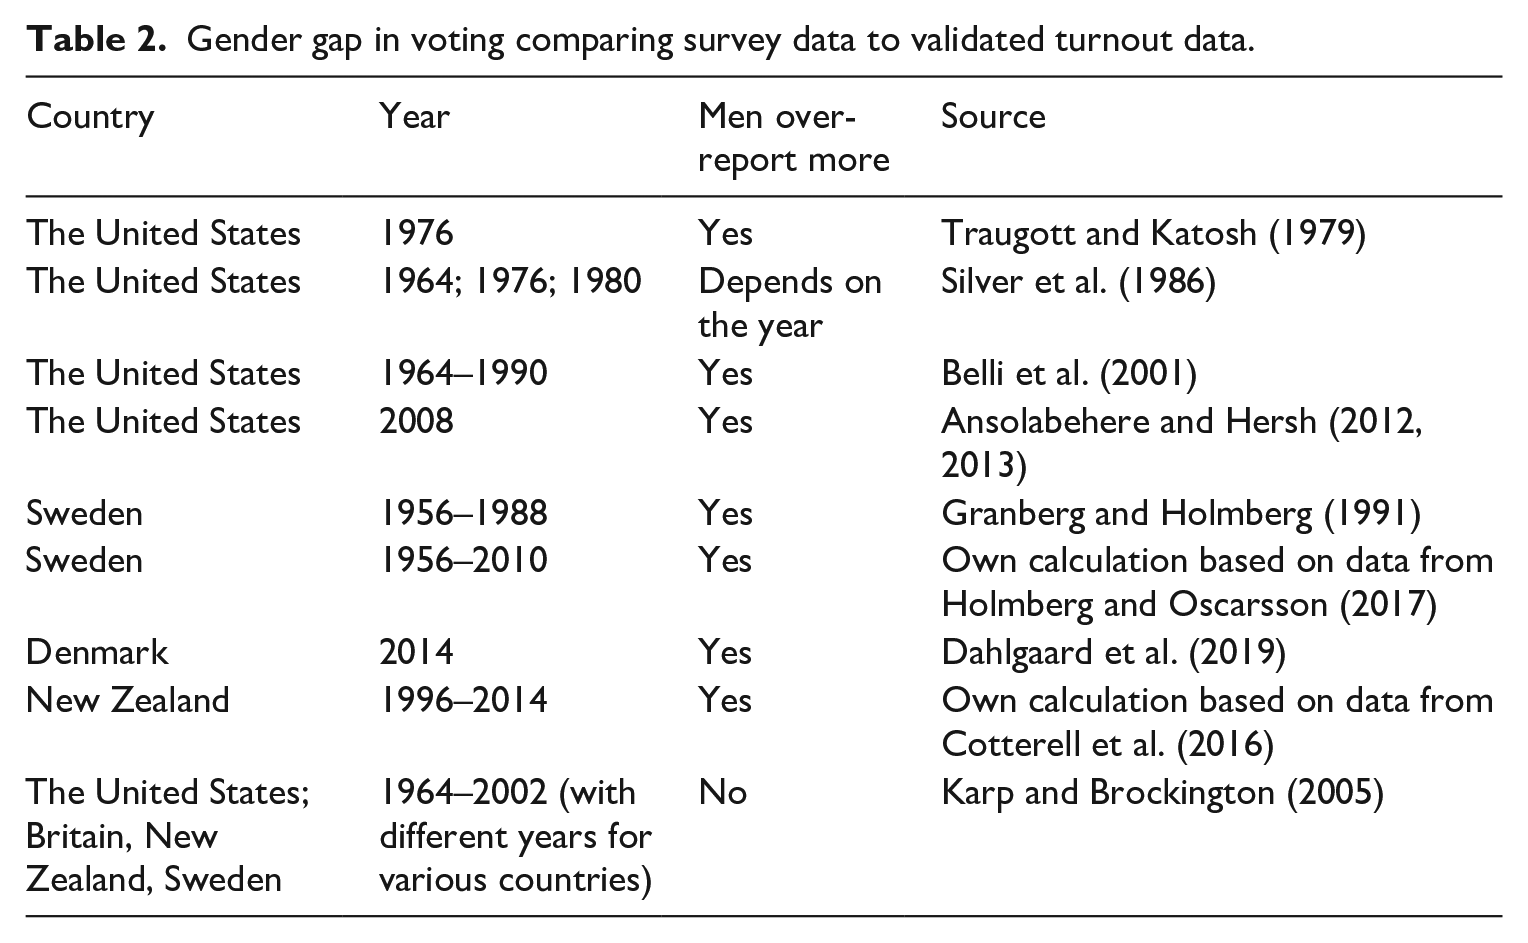
The only study in the US context that nuances the finding that men over-report turnout more than women is Silver et al. (1986). The authors note that in 1964, men were more likely to over-report voting than women, but this difference was eliminated by 1980, probably because of the virtual elimination of sex differences in reported voter turnout.
For other countries, the scarce evidence supports the notion that men are more likely to over-report turnout. Four of the five studies we review come to this conclusion. For example, the Swedish National Election Studies’ project has validated its surveys since 1956. In a study of the period until 1988 (see Granberg and Holmberg, 1991), 27% of male non-voters incorrectly claimed that they voted while for women the corresponding figure was 25%. We complemented this finding and analysed ourselves the data for all 17 elections from 1956 to 2010 (see also Holmberg and Oscarsson, 2017). This analysis confirms that the share of men who falsely claimed to have voted is about 4% higher than the share among women. The 2015 Danish National Election Study validated self-reported turnout with official figures, revealing no gender gap in reported turnout, but still a statistically significantly higher likelihood of women to vote, if we look at the validated figures (Dahlgaard et al., 2019). In New Zealand, the gap is quite small. Between 1996 and 2014, the New Zealand Election Study systematically validated its voting figures, showing that during this time period, women were slightly more likely to vote (91.1% vs 91.0% for men). However, the self-reported survey data indicate that men were marginally more likely than women to falsely state that they voted (i.e. self-reported turnout for men is 95.3%, whereas for women it is 95.2%) (Cotterell et al., 2016). However, and aside from these case studies, there is a comparative study by Karp and Brockington (2005), which validated survey data from five Western countries and found no evidence of a gender gap in over-reporting.
Overall, the available evidence from validated survey data points in the direction that men over-report voting more than women. In a last step, we have cross-validated these results using the MEDW dataset, which covers 27 elections at the regional, national, and European level in France, Spain, Germany, Canada, and Switzerland (see Stephenson et al., 2017). Most of these 27 elections have a short experiment included. The researchers from the MEDW project asked two questions. The first question is the standard voting question: ‘Were you personally able to vote in this election?’ The response categories were ‘yes’, ‘no’, and ‘do not know’/‘prefer not to say’. The other half of respondents in each country sample received, what the MEDW researchers call, the ‘face-saving question’, which should make it easier for respondents to admit that they did not vote (see Blais and Daoust, 2020). This question had the following five categories: (1) I did not vote in the election, (2) I thought about voting this time but didn’t, (3) I usually vote but didn’t this time, (4) I am sure I voted in the election, and (5) don’t know/prefer not to answer. In each country sample, the survey participants were randomly assigned to either the control or the treatment group (49.8% were in the treatment group). The treatment group received the face-saving question, and the control group received the general turnout question (see Morin-Chassé et al., 2017, for a more extensive description of the data and the logic of adding a face-saving question).
We used this experimental setting to get some more information on whether men have a higher tendency to over-report turnout compared to women. The dependent variable in these additional tests is self-reported turnout. The independent variables are (1) a dummy variable coded 1 if respondents answered the face-saving turnout question and coded 0 if they responded to the general voting question and (2) a dummy variable for gender, coded 1 for women and 0 for men. In Table 3, we present several logistic regression models featuring turnout as the dependent variable, pooled across all elections the face-saving question was asked in the MEDW dataset. Model 1 measures the effect of the face-saving question on self-reported turnout. Models 2 and 3 gauge this effect for men and women separately. Finally, Model 4 is an interactive model, where we interact the dummy variable for gender with the dummy for whether respondents received the face-saving turnout question or the regular turnout question. We also present a conditional marginal effects plot of the interaction term from Model 4.
The differences of the face-saving question on turnout by sex (MEDW data).
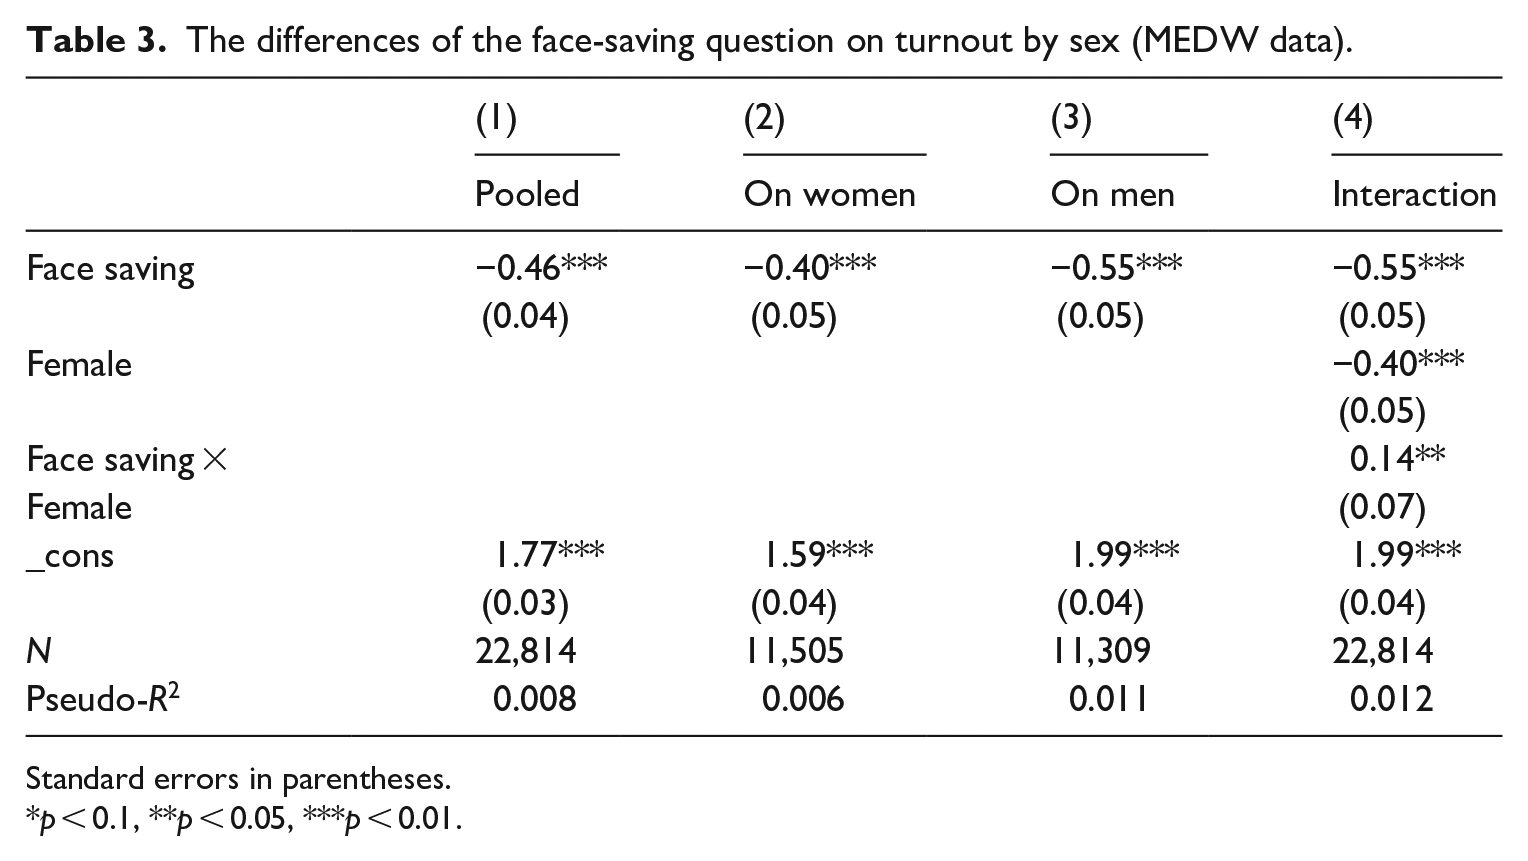
Standard errors in parentheses.
p < 0.1, **p < 0.05, ***p < 0.01.
The first result that sticks out from the MEDW data is that self-reported voter turnout is higher for men than for women (84.4% for men vs 79.8% for women). We also have some very preliminary evidence for a higher turnout drop for men than for women, when both genders are asked the face-saving question. The interaction term in Model 4 is statistically significant (p < .05), yet the substantive influence of the interaction term is very modest, to say the least. Figure 1 predicts that the number of men who indicated that they voted drops by more than 7 percentage points, whereas the corresponding drop for women is only roughly 6.4 percentage points. Hence, the analysis of MEDW data only offers some small evidence that men might have a higher propensity than women to over-report turnout.
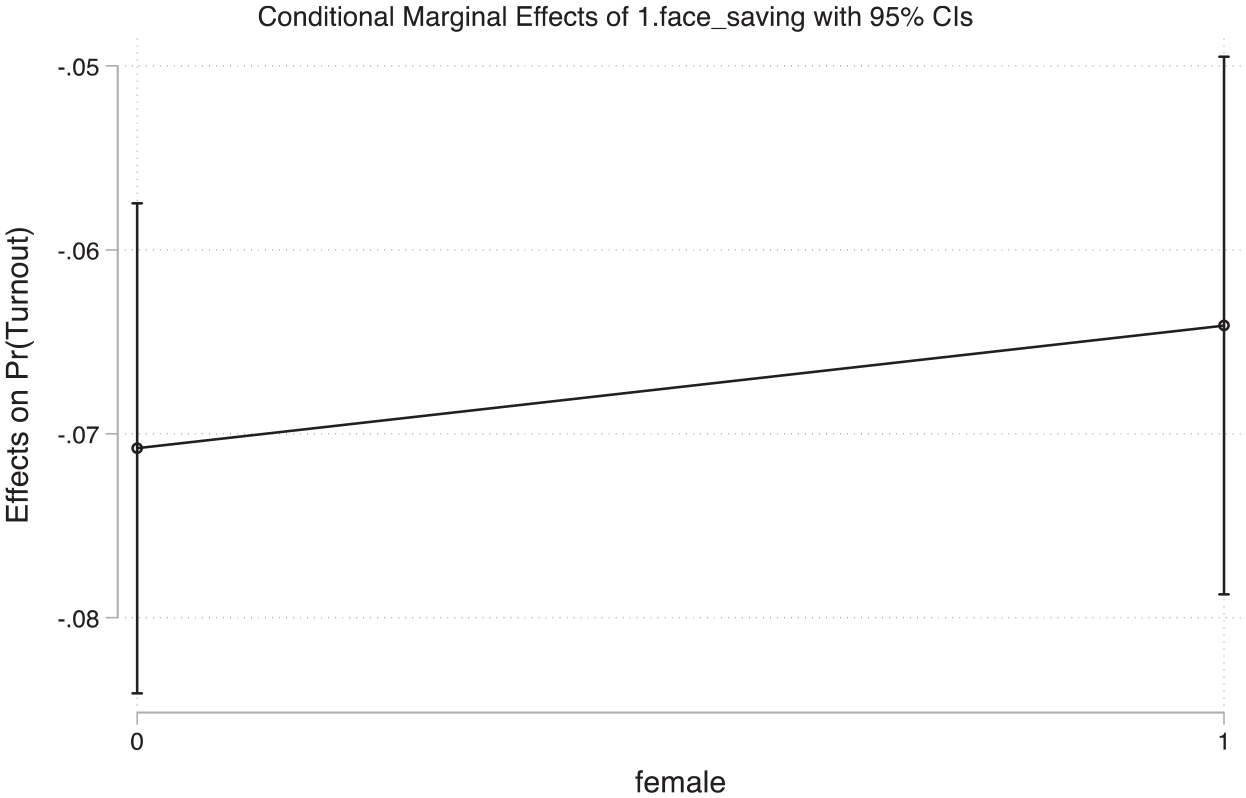
The predicted effect of the face-saving question by sex (MEDW data).
Different samples between men and women
Another explanation why surveys may portray higher male turnout could stem from the sample of male respondents being different from that of female respondents. For example, Jackman and Spahn (2019) highlight that it is much harder to sample politically uninterested, less educated, and younger individuals; all characteristics that make individuals more likely to vote. We further conjecture that there could be a moderating influence of gender. For instance, if in any sample male respondents are more religious, more educated, and live in households with higher income than female respondents, then these characteristics could supposedly explain higher male turnout in surveys. To investigate this possibility, we have checked the surveys we have used and, in most countries, we do not find that the sample of male participants is statistically different from the sample of female participants for other relevant predictors of turnout. Representatively, we show that there is no visible difference in the sample of male and female survey respondents using the example of Japan in 2014, as the country with the largest self-reported gap in male and female turnout in our sample of countries (the data source is the Inglehart et al., 2014). In Japan, official figures for this general election indicate a near identical turnout number for the two genders (54.1% for men and 53.8% for women). However, the Inglehart et al., (2014) displays a turnout gap of 9.2 points between the genders (62.8% for men and 53.6% for women). A binary logistic regression analysis confirms that this gap is statically significant from zero (see Table 4).
Logistic regression measuring the gender gap in voting in Japan.
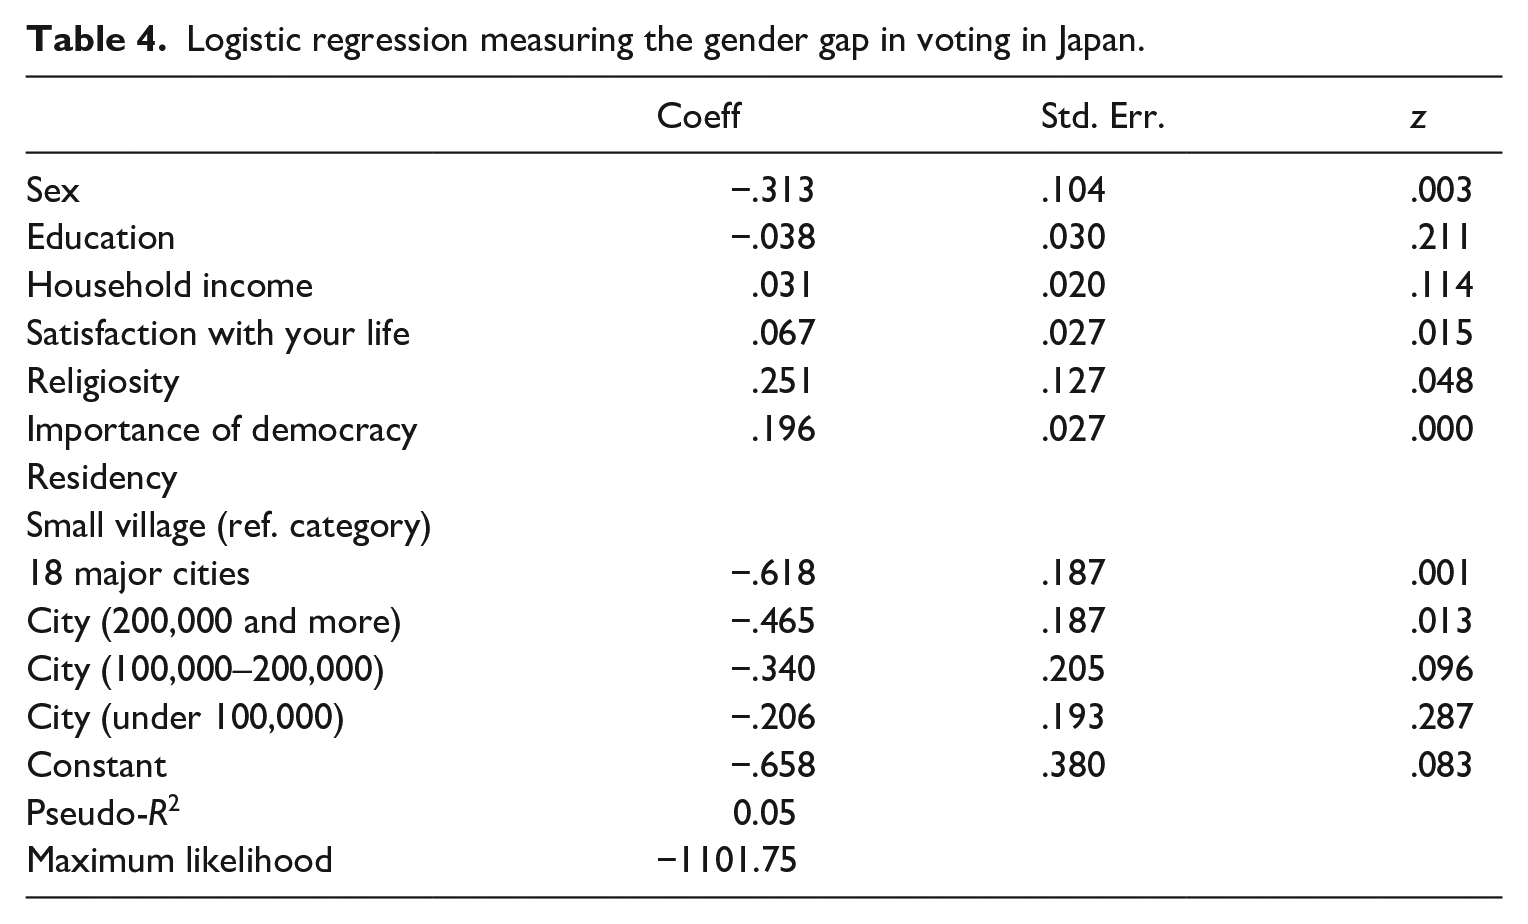
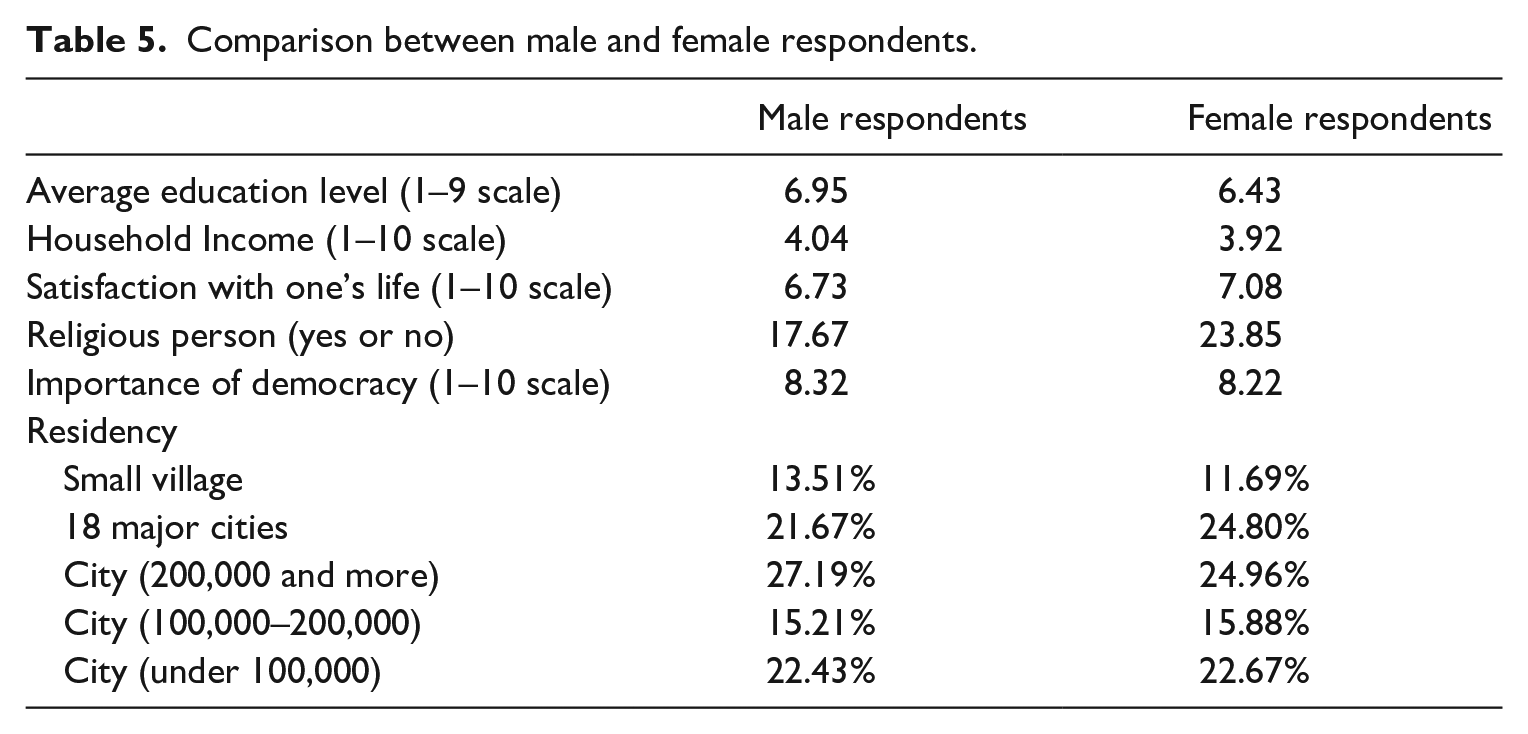
We also systematically compare men and women in the sample across all other independent variables. Table 5 illustrates that there are very few differences in the sample of men and women. For two significant factors of the likelihood of voting in Model 4 – that is, religiosity and satisfaction with one’s life – women even show higher values. 6 For the other right-hand-side variables in Table 4, there is hardly any difference between men and women. In complementary analyses, we also find that these sample characteristics closely match the population characteristics in the Japanese society. 7 Hence, from the example of Japan, we do not find support for the second possibility; that is, we cannot substantiate the possibility that different samples drive the reported gender gap in surveys.
Comparison between male and female respondents.
Conclusion
This article challenges the finding of a gender gap in voting in favour of men in cross-country survey research. We analyse official turnout figures, and our findings suggest that women are in fact more likely to vote. This result indicates that scholars should be cautious when using surveys to gauge gender differences in turnout. Moreover, the result we report has relevance for the study of non-electoral forms of political participation, where researchers similarly have suggested the existence of gender gaps by analysing survey data (Barnes and Burchard, 2013; Beauregard, 2014; Kittilson and Schwindt-Bayer, 2010; Nir and McClurg, 2015). Whether these gender gaps are also an artefact of survey research requires further interrogation.
More generally, this study invites a larger discussion on why women participate to a higher extent in elections than men. Previous theoretical models of resources or rational self-interest are in need for complements. For the former, the resource model, it is difficult to argue that women have more resources than men and therefore vote more often. For the latter, rational choice, it is unlikely that the benefits women gain from voting surpass those of men. One explanation that could bear some salience is that female citizens have a higher sense of duty. Yet, support for this explanation is mixed in recent research (see Carreras, 2018; Galais and Blais, 2019). Given these inconclusive results, future research should continue to look at the intricate relationship between gender, civic duty, and voting.
We suggest that future research should also try to confirm and develop the findings from this study once more countries validate their survey data with official records. If these studies confirm our finding, then we need to continue to look for more explanations (besides possibly women’s higher sense of duty) why women are more likely to turn out on Election Day than men. Given that we find only moderate support for men’s tendency to over-report voting more than women and no indication that biased samples drive the reported gender gap in surveys, we need to probably look for new explanations.
Footnotes
Appendix 1
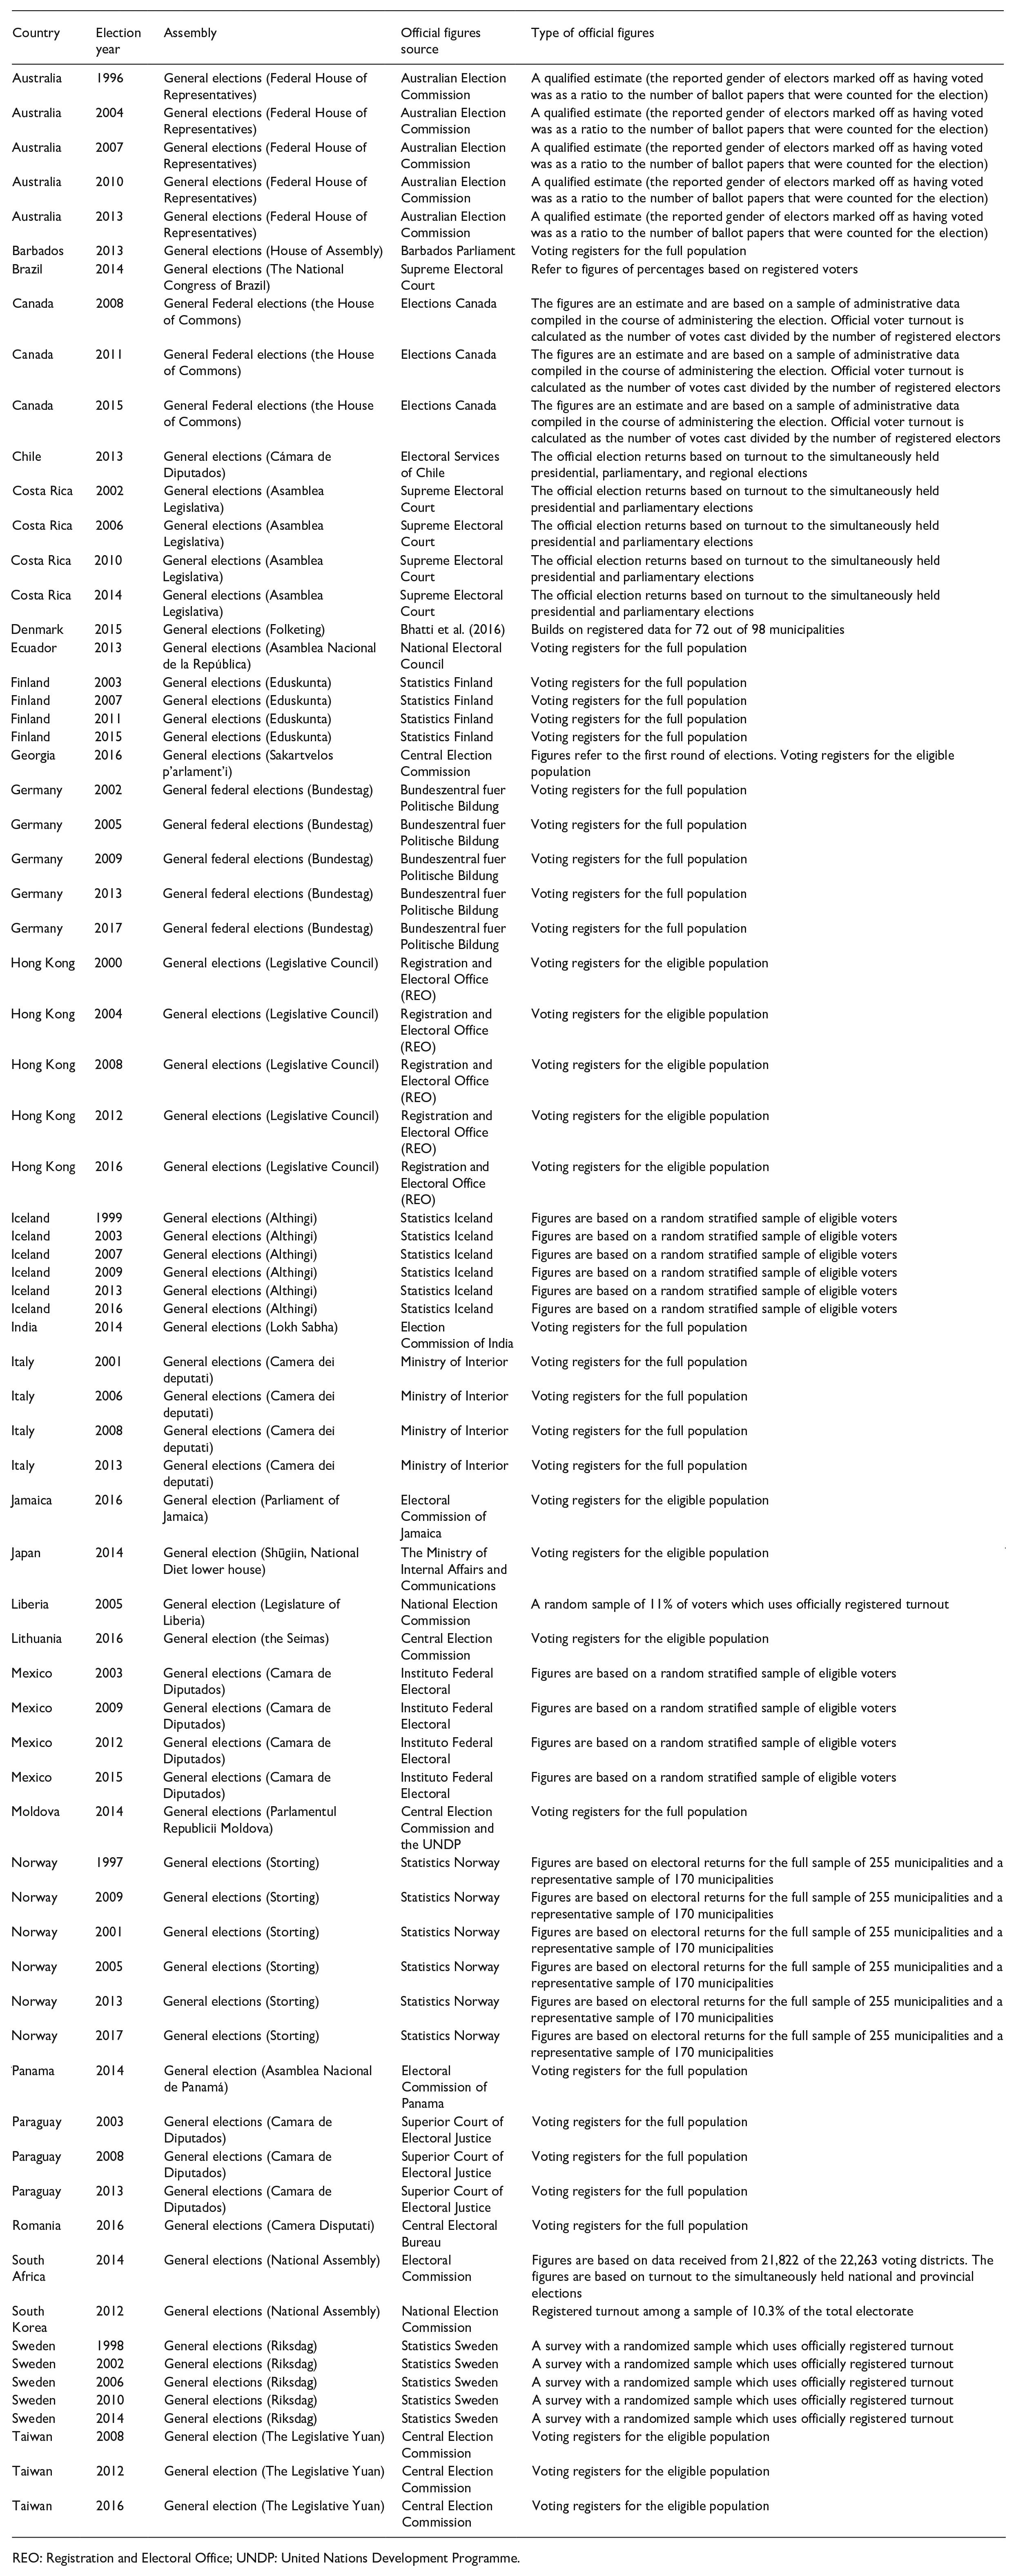
| Country | Election year | Assembly | Official figures source | Type of official figures |
|---|---|---|---|---|
| Australia | 1996 | General elections (Federal House of Representatives) | Australian Election Commission | A qualified estimate (the reported gender of electors marked off as having voted was as a ratio to the number of ballot papers that were counted for the election) |
| Australia | 2004 | General elections (Federal House of Representatives) | Australian Election Commission | A qualified estimate (the reported gender of electors marked off as having voted was as a ratio to the number of ballot papers that were counted for the election) |
| Australia | 2007 | General elections (Federal House of Representatives) | Australian Election Commission | A qualified estimate (the reported gender of electors marked off as having voted was as a ratio to the number of ballot papers that were counted for the election) |
| Australia | 2010 | General elections (Federal House of Representatives) | Australian Election Commission | A qualified estimate (the reported gender of electors marked off as having voted was as a ratio to the number of ballot papers that were counted for the election) |
| Australia | 2013 | General elections (Federal House of Representatives) | Australian Election Commission | A qualified estimate (the reported gender of electors marked off as having voted was as a ratio to the number of ballot papers that were counted for the election) |
| Barbados | 2013 | General elections (House of Assembly) | Barbados Parliament | Voting registers for the full population |
| Brazil | 2014 | General elections (The National Congress of Brazil) | Supreme Electoral Court | Refer to figures of percentages based on registered voters |
| Canada | 2008 | General Federal elections (the House of Commons) | Elections Canada | The figures are an estimate and are based on a sample of administrative data compiled in the course of administering the election. Official voter turnout is calculated as the number of votes cast divided by the number of registered electors |
| Canada | 2011 | General Federal elections (the House of Commons) | Elections Canada | The figures are an estimate and are based on a sample of administrative data compiled in the course of administering the election. Official voter turnout is calculated as the number of votes cast divided by the number of registered electors |
| Canada | 2015 | General Federal elections (the House of Commons) | Elections Canada | The figures are an estimate and are based on a sample of administrative data compiled in the course of administering the election. Official voter turnout is calculated as the number of votes cast divided by the number of registered electors |
| Chile | 2013 | General elections (Cámara de Diputados) | Electoral Services of Chile | The official election returns based on turnout to the simultaneously held presidential, parliamentary, and regional elections |
| Costa Rica | 2002 | General elections (Asamblea Legislativa) | Supreme Electoral Court | The official election returns based on turnout to the simultaneously held presidential and parliamentary elections |
| Costa Rica | 2006 | General elections (Asamblea Legislativa) | Supreme Electoral Court | The official election returns based on turnout to the simultaneously held presidential and parliamentary elections |
| Costa Rica | 2010 | General elections (Asamblea Legislativa) | Supreme Electoral Court | The official election returns based on turnout to the simultaneously held presidential and parliamentary elections |
| Costa Rica | 2014 | General elections (Asamblea Legislativa) | Supreme Electoral Court | The official election returns based on turnout to the simultaneously held presidential and parliamentary elections |
| Denmark | 2015 | General elections (Folketing) | Bhatti et al. (2016) | Builds on registered data for 72 out of 98 municipalities |
| Ecuador | 2013 | General elections (Asamblea Nacional de la República) | National Electoral Council | Voting registers for the full population |
| Finland | 2003 | General elections (Eduskunta) | Statistics Finland | Voting registers for the full population |
| Finland | 2007 | General elections (Eduskunta) | Statistics Finland | Voting registers for the full population |
| Finland | 2011 | General elections (Eduskunta) | Statistics Finland | Voting registers for the full population |
| Finland | 2015 | General elections (Eduskunta) | Statistics Finland | Voting registers for the full population |
| Georgia | 2016 | General elections (Sakartvelos p’arlament’i) | Central Election Commission | Figures refer to the first round of elections. Voting registers for the eligible population |
| Germany | 2002 | General federal elections (Bundestag) | Bundeszentral fuer Politische Bildung | Voting registers for the full population |
| Germany | 2005 | General federal elections (Bundestag) | Bundeszentral fuer Politische Bildung | Voting registers for the full population |
| Germany | 2009 | General federal elections (Bundestag) | Bundeszentral fuer Politische Bildung | Voting registers for the full population |
| Germany | 2013 | General federal elections (Bundestag) | Bundeszentral fuer Politische Bildung | Voting registers for the full population |
| Germany | 2017 | General federal elections (Bundestag) | Bundeszentral fuer Politische Bildung | Voting registers for the full population |
| Hong Kong | 2000 | General elections (Legislative Council) | Registration and Electoral Office (REO) | Voting registers for the eligible population |
| Hong Kong | 2004 | General elections (Legislative Council) | Registration and Electoral Office (REO) | Voting registers for the eligible population |
| Hong Kong | 2008 | General elections (Legislative Council) | Registration and Electoral Office (REO) | Voting registers for the eligible population |
| Hong Kong | 2012 | General elections (Legislative Council) | Registration and Electoral Office (REO) | Voting registers for the eligible population |
| Hong Kong | 2016 | General elections (Legislative Council) | Registration and Electoral Office (REO) | Voting registers for the eligible population |
| Iceland | 1999 | General elections (Althingi) | Statistics Iceland | Figures are based on a random stratified sample of eligible voters |
| Iceland | 2003 | General elections (Althingi) | Statistics Iceland | Figures are based on a random stratified sample of eligible voters |
| Iceland | 2007 | General elections (Althingi) | Statistics Iceland | Figures are based on a random stratified sample of eligible voters |
| Iceland | 2009 | General elections (Althingi) | Statistics Iceland | Figures are based on a random stratified sample of eligible voters |
| Iceland | 2013 | General elections (Althingi) | Statistics Iceland | Figures are based on a random stratified sample of eligible voters |
| Iceland | 2016 | General elections (Althingi) | Statistics Iceland | Figures are based on a random stratified sample of eligible voters |
| India | 2014 | General elections (Lokh Sabha) | Election Commission of India | Voting registers for the full population |
| Italy | 2001 | General elections (Camera dei deputati) | Ministry of Interior | Voting registers for the full population |
| Italy | 2006 | General elections (Camera dei deputati) | Ministry of Interior | Voting registers for the full population |
| Italy | 2008 | General elections (Camera dei deputati) | Ministry of Interior | Voting registers for the full population |
| Italy | 2013 | General elections (Camera dei deputati) | Ministry of Interior | Voting registers for the full population |
| Jamaica | 2016 | General election (Parliament of Jamaica) | Electoral Commission of Jamaica | Voting registers for the eligible population |
| Japan | 2014 | General election (Shūgiin, National Diet lower house) | The Ministry of Internal Affairs and Communications | Voting registers for the eligible population |
| Liberia | 2005 | General election (Legislature of Liberia) | National Election Commission | A random sample of 11% of voters which uses officially registered turnout |
| Lithuania | 2016 | General election (the Seimas) | Central Election Commission | Voting registers for the eligible population |
| Mexico | 2003 | General elections (Camara de Diputados) | Instituto Federal Electoral | Figures are based on a random stratified sample of eligible voters |
| Mexico | 2009 | General elections (Camara de Diputados) | Instituto Federal Electoral | Figures are based on a random stratified sample of eligible voters |
| Mexico | 2012 | General elections (Camara de Diputados) | Instituto Federal Electoral | Figures are based on a random stratified sample of eligible voters |
| Mexico | 2015 | General elections (Camara de Diputados) | Instituto Federal Electoral | Figures are based on a random stratified sample of eligible voters |
| Moldova | 2014 | General elections (Parlamentul Republicii Moldova) | Central Election Commission and the UNDP | Voting registers for the full population |
| Norway | 1997 | General elections (Storting) | Statistics Norway | Figures are based on electoral returns for the full sample of 255 municipalities and a representative sample of 170 municipalities |
| Norway | 2009 | General elections (Storting) | Statistics Norway | Figures are based on electoral returns for the full sample of 255 municipalities and a representative sample of 170 municipalities |
| Norway | 2001 | General elections (Storting) | Statistics Norway | Figures are based on electoral returns for the full sample of 255 municipalities and a representative sample of 170 municipalities |
| Norway | 2005 | General elections (Storting) | Statistics Norway | Figures are based on electoral returns for the full sample of 255 municipalities and a representative sample of 170 municipalities |
| Norway | 2013 | General elections (Storting) | Statistics Norway | Figures are based on electoral returns for the full sample of 255 municipalities and a representative sample of 170 municipalities |
| Norway | 2017 | General elections (Storting) | Statistics Norway | Figures are based on electoral returns for the full sample of 255 municipalities and a representative sample of 170 municipalities |
| Panama | 2014 | General election (Asamblea Nacional de Panamá) | Electoral Commission of Panama | Voting registers for the full population |
| Paraguay | 2003 | General elections (Camara de Diputados) | Superior Court of Electoral Justice | Voting registers for the full population |
| Paraguay | 2008 | General elections (Camara de Diputados) | Superior Court of Electoral Justice | Voting registers for the full population |
| Paraguay | 2013 | General elections (Camara de Diputados) | Superior Court of Electoral Justice | Voting registers for the full population |
| Romania | 2016 | General elections (Camera Disputati) | Central Electoral Bureau | Voting registers for the full population |
| South Africa | 2014 | General elections (National Assembly) | Electoral Commission | Figures are based on data received from 21,822 of the 22,263 voting districts. The figures are based on turnout to the simultaneously held national and provincial elections |
| South Korea | 2012 | General elections (National Assembly) | National Election Commission | Registered turnout among a sample of 10.3% of the total electorate |
| Sweden | 1998 | General elections (Riksdag) | Statistics Sweden | A survey with a randomized sample which uses officially registered turnout |
| Sweden | 2002 | General elections (Riksdag) | Statistics Sweden | A survey with a randomized sample which uses officially registered turnout |
| Sweden | 2006 | General elections (Riksdag) | Statistics Sweden | A survey with a randomized sample which uses officially registered turnout |
| Sweden | 2010 | General elections (Riksdag) | Statistics Sweden | A survey with a randomized sample which uses officially registered turnout |
| Sweden | 2014 | General elections (Riksdag) | Statistics Sweden | A survey with a randomized sample which uses officially registered turnout |
| Taiwan | 2008 | General election (The Legislative Yuan) | Central Election Commission | Voting registers for the eligible population |
| Taiwan | 2012 | General election (The Legislative Yuan) | Central Election Commission | Voting registers for the eligible population |
| Taiwan | 2016 | General election (The Legislative Yuan) | Central Election Commission | Voting registers for the eligible population |
REO: Registration and Electoral Office; UNDP: United Nations Development Programme.
Funding
The author(s) disclosed receipt of the following financial support for the research, authorship, and/or publication of this article: This research was supported by Konrad Adenauer Foundation.