
Abstract
The use of advanced pulsed waveform control during gas metal arc welding is evaluated for additive manufacturing, also known as 3D printing. This investigation used a water-cooled base and a modified wave shape, operating in the short-circuit transfer mode. Carbon steel walls are compared in terms of bead geometry, microstructure and hardness and tensile properties. The results indicate that the use of an ultra-low heat input provides more uniform properties across the wall section and reduces anisotropy in mechanical properties compared to prior work using other gas metal arc welding techniques. Overall, the deposited samples have properties comparable to weld metals produced with ER70S-6 carbon steel wire, with over 600 MPa strength for all conditions tested.
Keywords
Introduction
The use of additive manufacturing (AM) for metals has become widespread in several industries and has been demonstrated using a wide range of materials along with various methods for delivering material and energy.1,2 The technology of AM is defined by ASTM 3 as ‘a process of joining materials to make objects from 3D model data, usually layer upon layer, as opposed to subtractive manufacturing methodologies’, and this has enabled much higher geometrical complexity, for example, by including internal cavities and selectively removing material from locations which are not stressed. This has enabled considerable weight savings and dramatically increased the design freedom.
The two primary feedstock materials in AM can be generally categorised as being either based on a continuously fed solid wire or metal powder. Although powder-fed processes such as powder-bed fusion and directed energy deposition methods permit high geometrical accuracy and precision, their mass deposition rates are typically on the order of 1 kg/h. Also, the need for costly powder-based materials makes these processes more suited to smaller high-value components based on stainless steels, rather than larger and lower-cost carbon steels. 4 This has partly driven the research into adapting more conventional wire-fed welding processes, such as gas metal arc welding (GMAW), to accomplish wire-arc additive manufacturing (WAAM) at much lower cost and at higher production rates.5–8
There is a great potential for adapting GMAW for WAAM fabrication, since this is one of the most widely used commercial arc welding processes, and wire feed stock is readily available at low cost. Several advances in productivity and energy efficiency of arc welding processes have also increased the potential to deposit material during WAAM with either lower heat or at a higher deposition rate, for example, using pulsed current, controlled short-circuit, and cold-metal transfer techniques. 9 To-date, one of the lowest heat input processes that is reported is for the deposition of steel is cold-metal transfer, which can deposit the wire electrode material at 0.15 kJ/mm; however, a lack of fusion is reported using such low values. 10 In the case of deposition processes for WAAM, it is essential that the arc process achieves consistent deposition with good fusion, low porosity, and low spatter to avoid defect formation within the structure.
The key components to accomplish WAAM are commercially available and well established in industry (such as various GMAW power sources, torches, and positioning systems), and these may be combined with open-source software for slicing and path planning to achieve layer-by-layer deposition. There has been relatively little emphasis on optimising the droplet transfer mode and power supply behaviour for AM. In the case of WAAM, there is an increased need to achieve high bead uniformity during deposition, and to reduce heat input since this will lead to excessive distortion or residual stress in the built component.11,12 Some studies have shown that heating or cooling the substrate can be used to control the properties and residual stress of the build material in AM, and it is common to find heated substrates to increase layer adhesion and reduce residual stress during powder-based AM.13,14 However, adhesion is not a severe concern with GMAW since fully molten droplets are transferred, and instead it may be useful to cool the substrate when large structures are fabricated during WAAM to control distortions. Although many advances have been made in developing pulsed and controlled short-circuit transfer power supplies for GMAW,15,16 evaluating the performance of a power supply which is optimised for ultra-low heat input controlled short-circuit transfer has never been considered in combination with the use of a cooled substrate to control properties and build geometry.
Experimental procedures
Welding
For these experiments, a newly developed Liburdi Dimetrics Gold Track 7 welding power source was employed using onboard digital signal process controls for manipulation and shaping of the welding current based on high-resolution voltage/amp feedback control. The Gold Track 7 control architecture and interface allows the researcher to independently change different aspects (ramps, peaks, delays, etc.) of the modified short circuit dip transfer process for overall process optimisation. Such optimisations, only available in this ‘open type’ of control architecture, led the researcher to avoid generation of spatter by reducing current during the short-circuit contact of the droplet into the molten pool through experimentation. A carbon steel wire electrode was used, conforming to classification ER70S-6, with a 0.035″ (0.9 mm) diameter. Welding was performed using a wire feed speed of 3.81 m·min−1, travel speed equal to 50.8 cm·min−1, while the resulting average welding voltage and current were 15.8 V and 78 A. Shielding was provided using a commercially available argon and 8% carbon dioxide blend. Supplemental Table S1 provides the specified composition and mechanical properties for the wire used, while Supplemental Table S2 provides the welding parameters.
The welding was performed on the flat position and schematically shown in Figure 1. The constant torch travel speed (x-direction) was achieved by means of a displacement system operated by servo motors. For the build-up of the wall in the y-direction, the torch was lifted by a constant amount after completion of each layer. This was also achieved using servo motors.
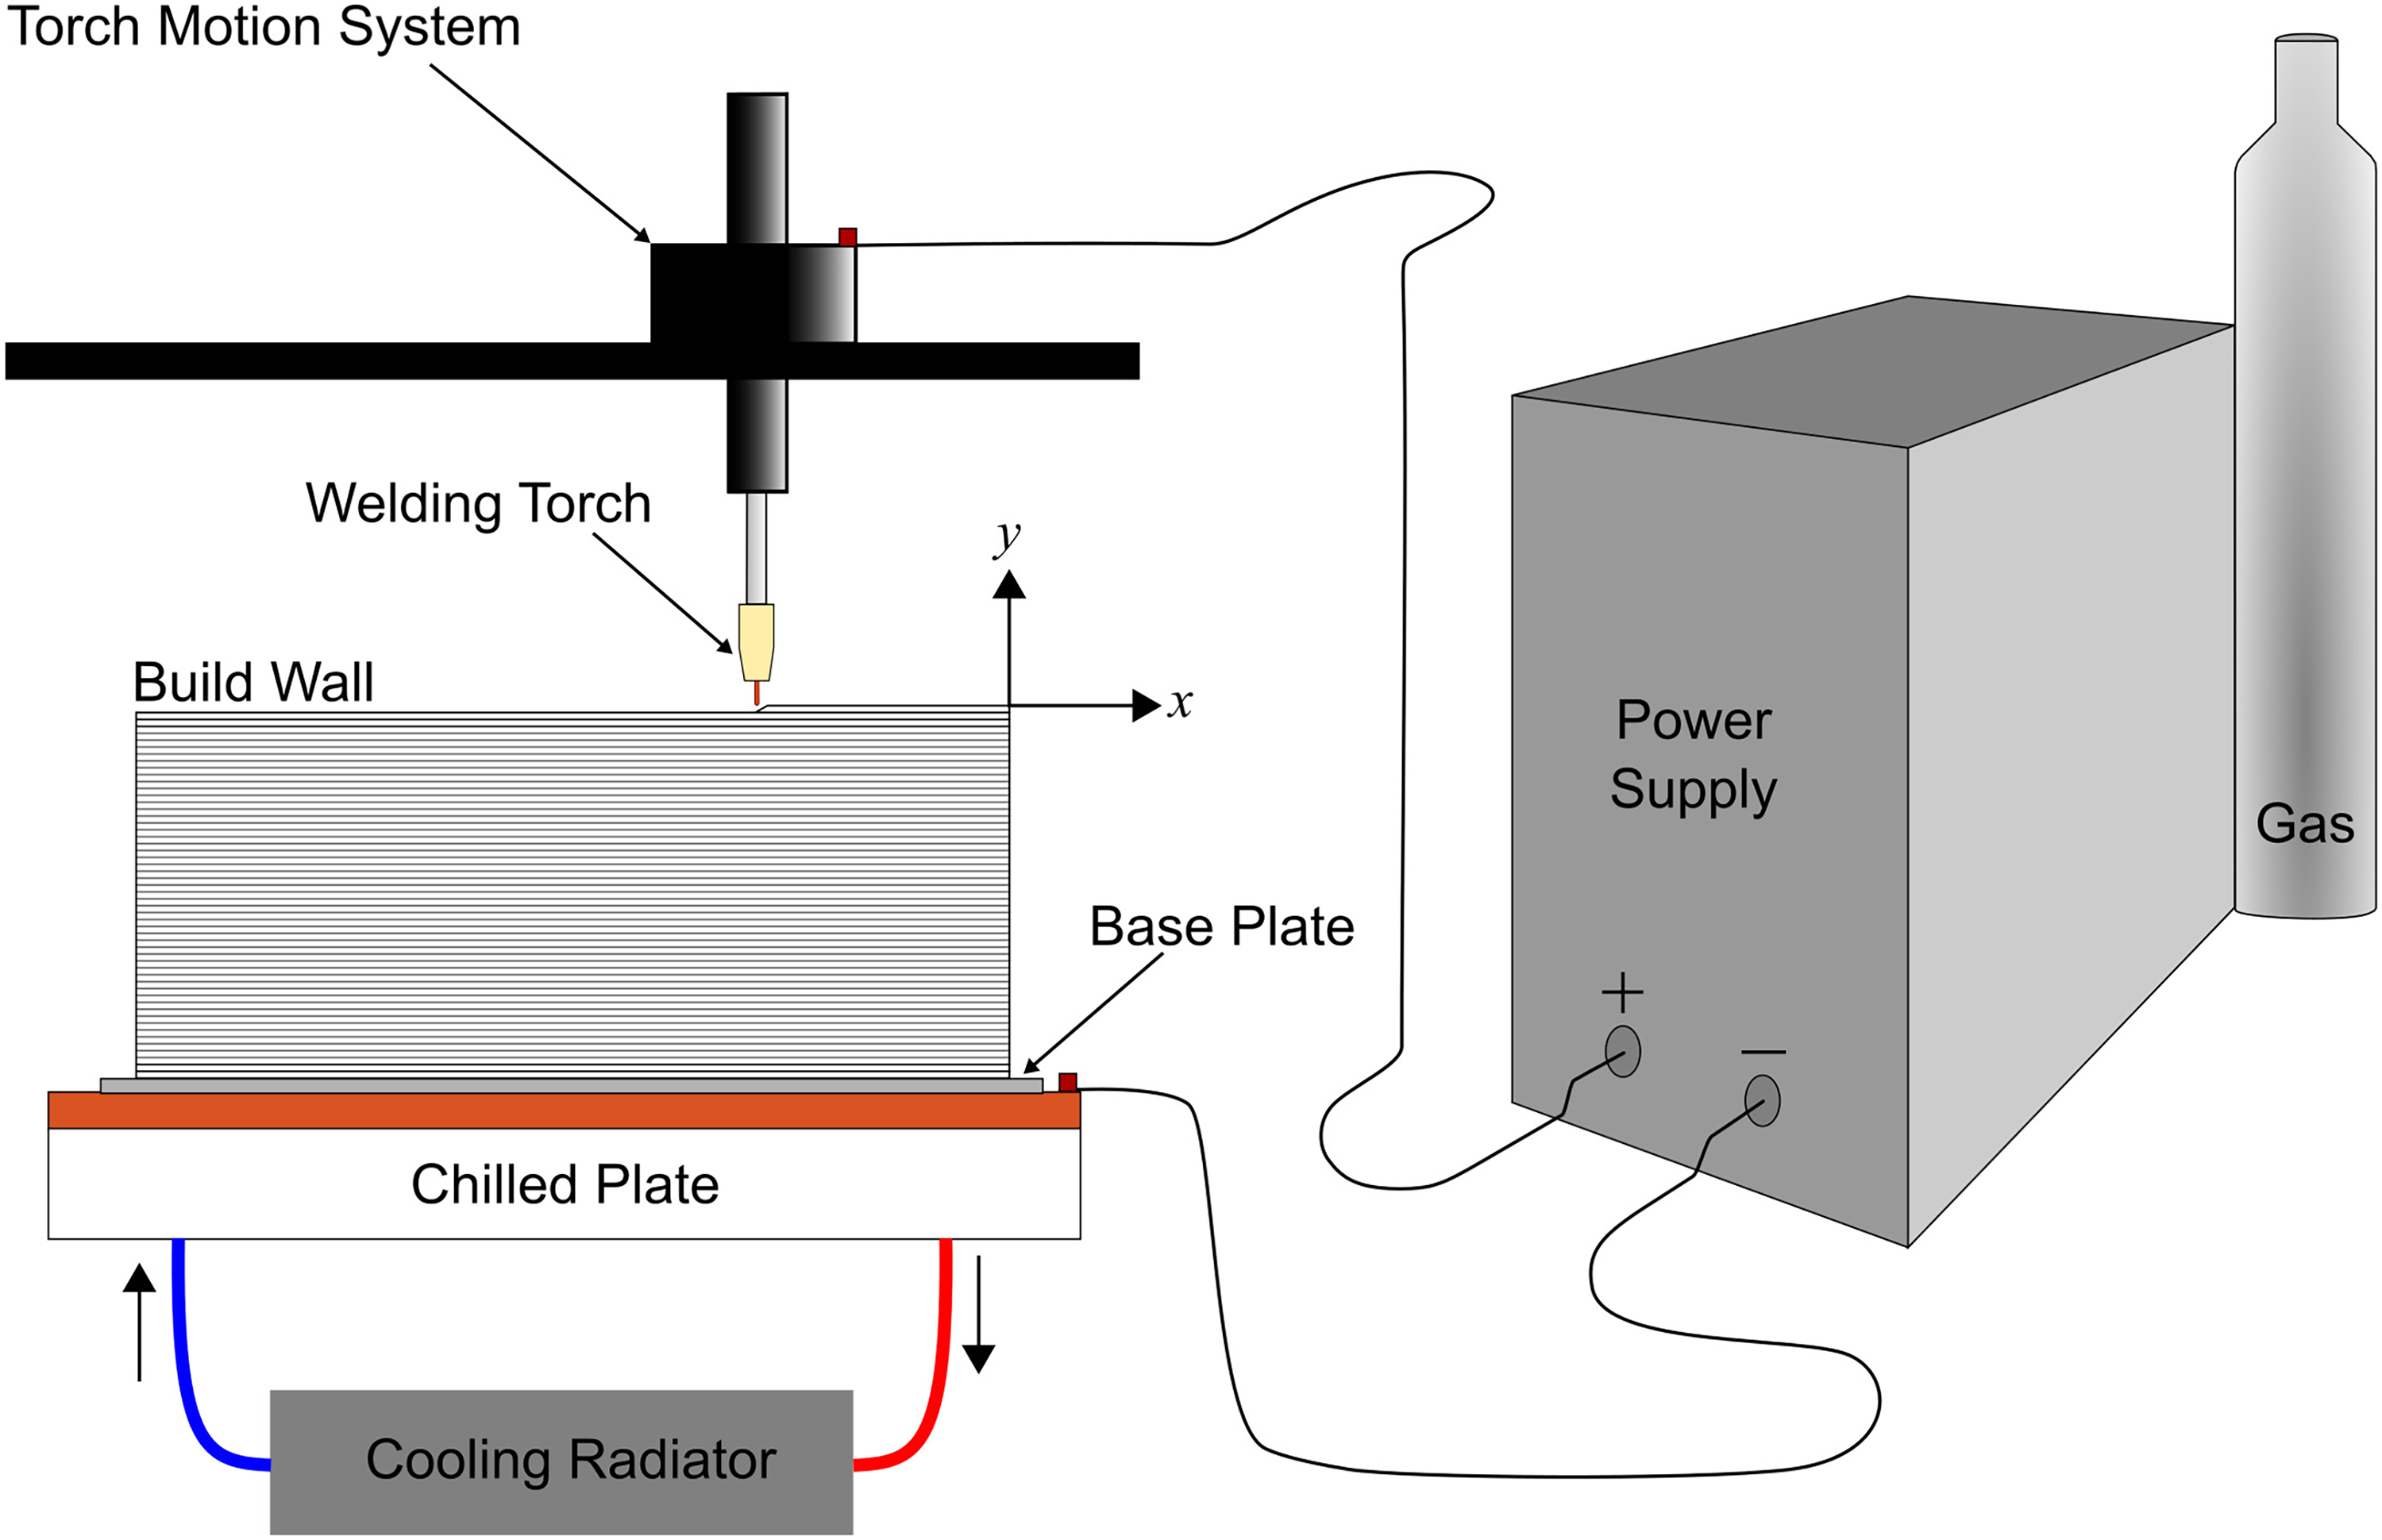
Experimental setup diagram showing the torch motion system, base plate cooling system (cooling radiator and chilled plate) and power supply arrangements.
To prevent heat accumulation on the build wall, which in turn can lead to geometrical instability of the build wall, a closed-loop cooling system was built to prevent overheating of the build wall and reduce the time waiting between layers. As schematically shown in Figure 1, the base plate was placed on top of a chilled plate. For this work, two walls were produced, one using the chilled water plate, and one wall was built without the chilled plate, hereafter referred to as water-cooled (WC) and natural-cooled (NC) conditions, respectively. The interpass waiting time was such that the interpass temperature was no more than 150 °C.
Metallography and microhardness
For the evaluation of the weld beads and wall cross-section, standard metallography procedures were used. After grinding and polishing, the cross sections were etched using 2% Nital solution.
Microhardness profiles were performed across the vertical direction of the built walls. This was done using an automated Vickers hardness tester with a 300-gf load and 10 s dwell time, was used and are here expressed as Vickers hardness number (HV). The average hardness as a function of height of the wall, up to a height of 22 mm, is reported as the average hardness of three lines performed in the middle of the wall cross section, the indentations are spaced from each other by 0.5 mm, in both the x and y directions.
Tensile testing
To compare the mechanical properties for the different cooling conditions and evaluate the uniformity of properties throughout the built wall, tensile specimens were extracted from the build. Tensile specimens were prepared from the built walls by cutting standard dogbone shapes based on ASTM E8/E8 M sub-sized coupon dimensions (with a gauge length of 32 mm and thickness of 2 mm). Tensile samples were extracted from both longitudinal and transverse orientations to the welding direction. Supplemental Figure S1 provides the dimensions of the tensile specimen dimensions and the location from where the samples were extracted from the built wall. Longitudinal samples were removed from the region close to the base plate and away from the base plate. The tensile specimens from regions R1 and R3 were loaded longitudinally to the welding direction to compare the properties near the substrate versus near the final layers, while the specimens from R2 were evaluated with loading in the building direction, that is, transverse to the welding directions, and tensile samples were removed from the mid-length of the wall build-up. For each location, three tensile samples were prepared.
The tensile tests were performed in displacement-controlled mode using a constant rate of 1 mm/min controlled by the tensile tester crosshead motion. The tests were conducted using a digital image correlation (DIC) system (Vic-3D-7 Software from Correlated Solutions, USA), allowing for a two-dimensional (2D) strain distribution in the test specimen. DIC settings were Subset of 29 pixels, step of 7 pixels and the image is about 24 pixels per millimetre.
Results and discussion
A feature of the present study is the application of a novel droplet transfer mode using pulsed current. The use of pulsed current GMAW is known to offer reduced heat input and offer the potential of ‘one drop per pulse’ deposition, which can reduce spatter. 17 However, the pulse shape here has been modified to optimise the transfer at lower average current and short arc length, in order to avoid spatter associated with short-circuit transfer with spatter. This resulted in a controlled short-circuit transfer mode, and the details of current control and short-circuit response will be described elsewhere.
Figure 2(a) provides the torch current and voltage measurements for a duration of 1 s; Figure 2(b) to (e) shows high speed video snapshot of the metal transfer for different phases of the cycle; and Figure 2(f) and (g), provide the characteristic short/detachment calculated using a fast Fourier transform (FFT) for a 1 s period.
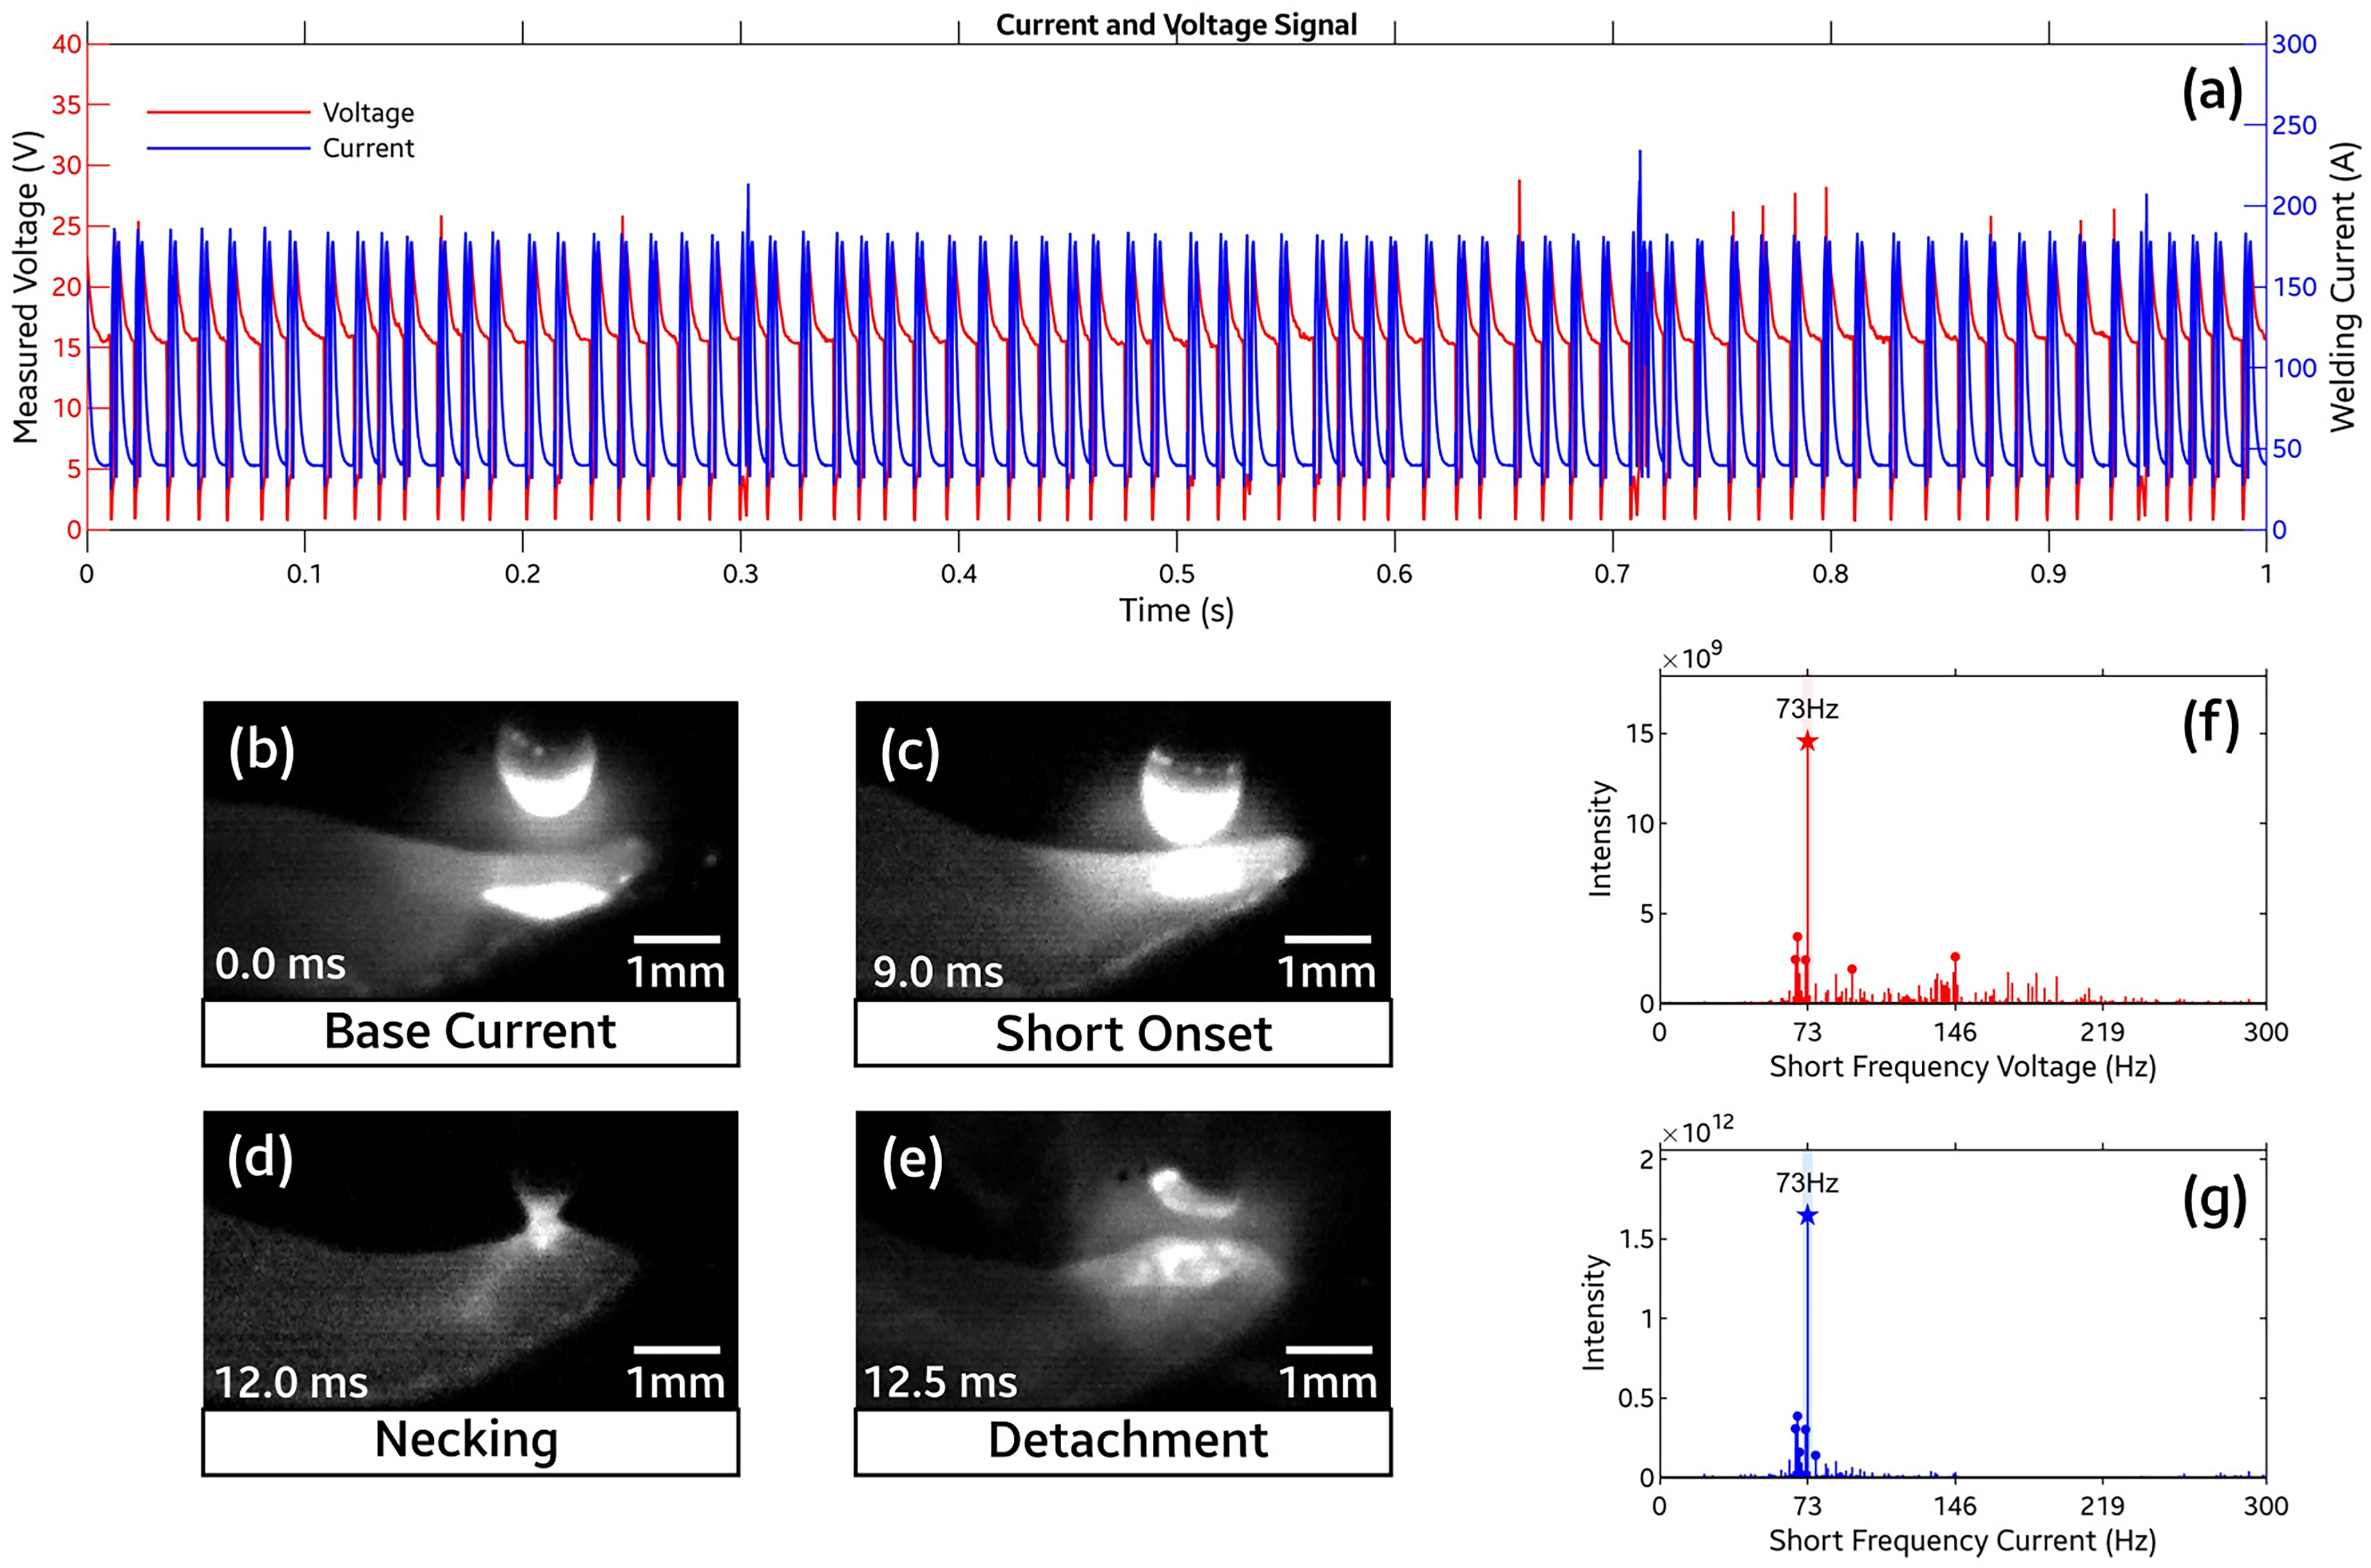
Current and voltage electrical signals for welding condition: (a) multiple cycles over 1 s long period; (b–e) snapshot of the metal transfer for one cycle; characteristic short circuit frequency based on voltage (f) and current (g) signals.
As shown in Figure 2(a), for the results reported in this work, the average welding current average of 78 A was achieved when pulsing the instantaneous welding current between 40 and 175 A, which gives an average duty cycle of 28%. It should be noted that, despite peaks in current in the range of 175 A, those were lasted only about 1 ms, with an exponential decay to 40 A, which leads to the low average current observed. Figure 2(a) also depicts the time regularity of the short circuits and the droplet transfer events, which is confirmed by the characteristic short/detachment calculated using the FFT shown in Figure 2(f) and (g).
High-speed imaging was used to capture the droplet transfer process, as shown in Figure 3 for an individual cycle during the arc phase is shown for both NC and WC conditions. One of the interesting features is that for the WC condition, a slightly longer molten pool is observed. This can be noted in comparing the bright regions at the time intervals 0 and 0.5 ms in Figures 3(a) and 4(b). On timestamp 0.0 ms, Figure 3 shows the moment just before the onset of arc, while at timestamp 0.5 ms shows the moment just after the arc is reestablished. Special attention is to be given to this timestamp, at to the fact that no spatter is observed, and this in turn is achieved by the fact that the detachment, that is, the breaking of the thin column of liquid metal, occurs at low current values. When detachment occurs at high current values, the increased electromagnetic and pinch forces would lead to instability of the thin column of liquid into small droplets, which can induce spatter formation. In Figure 3(a) and (b), from timestamp 1.5 to 6 ms, the welding wire is being molten to be transferred to the molten pool in the next short event, which takes place at timestamps 8 and 9 ms for NC and WC conditions, respectively.
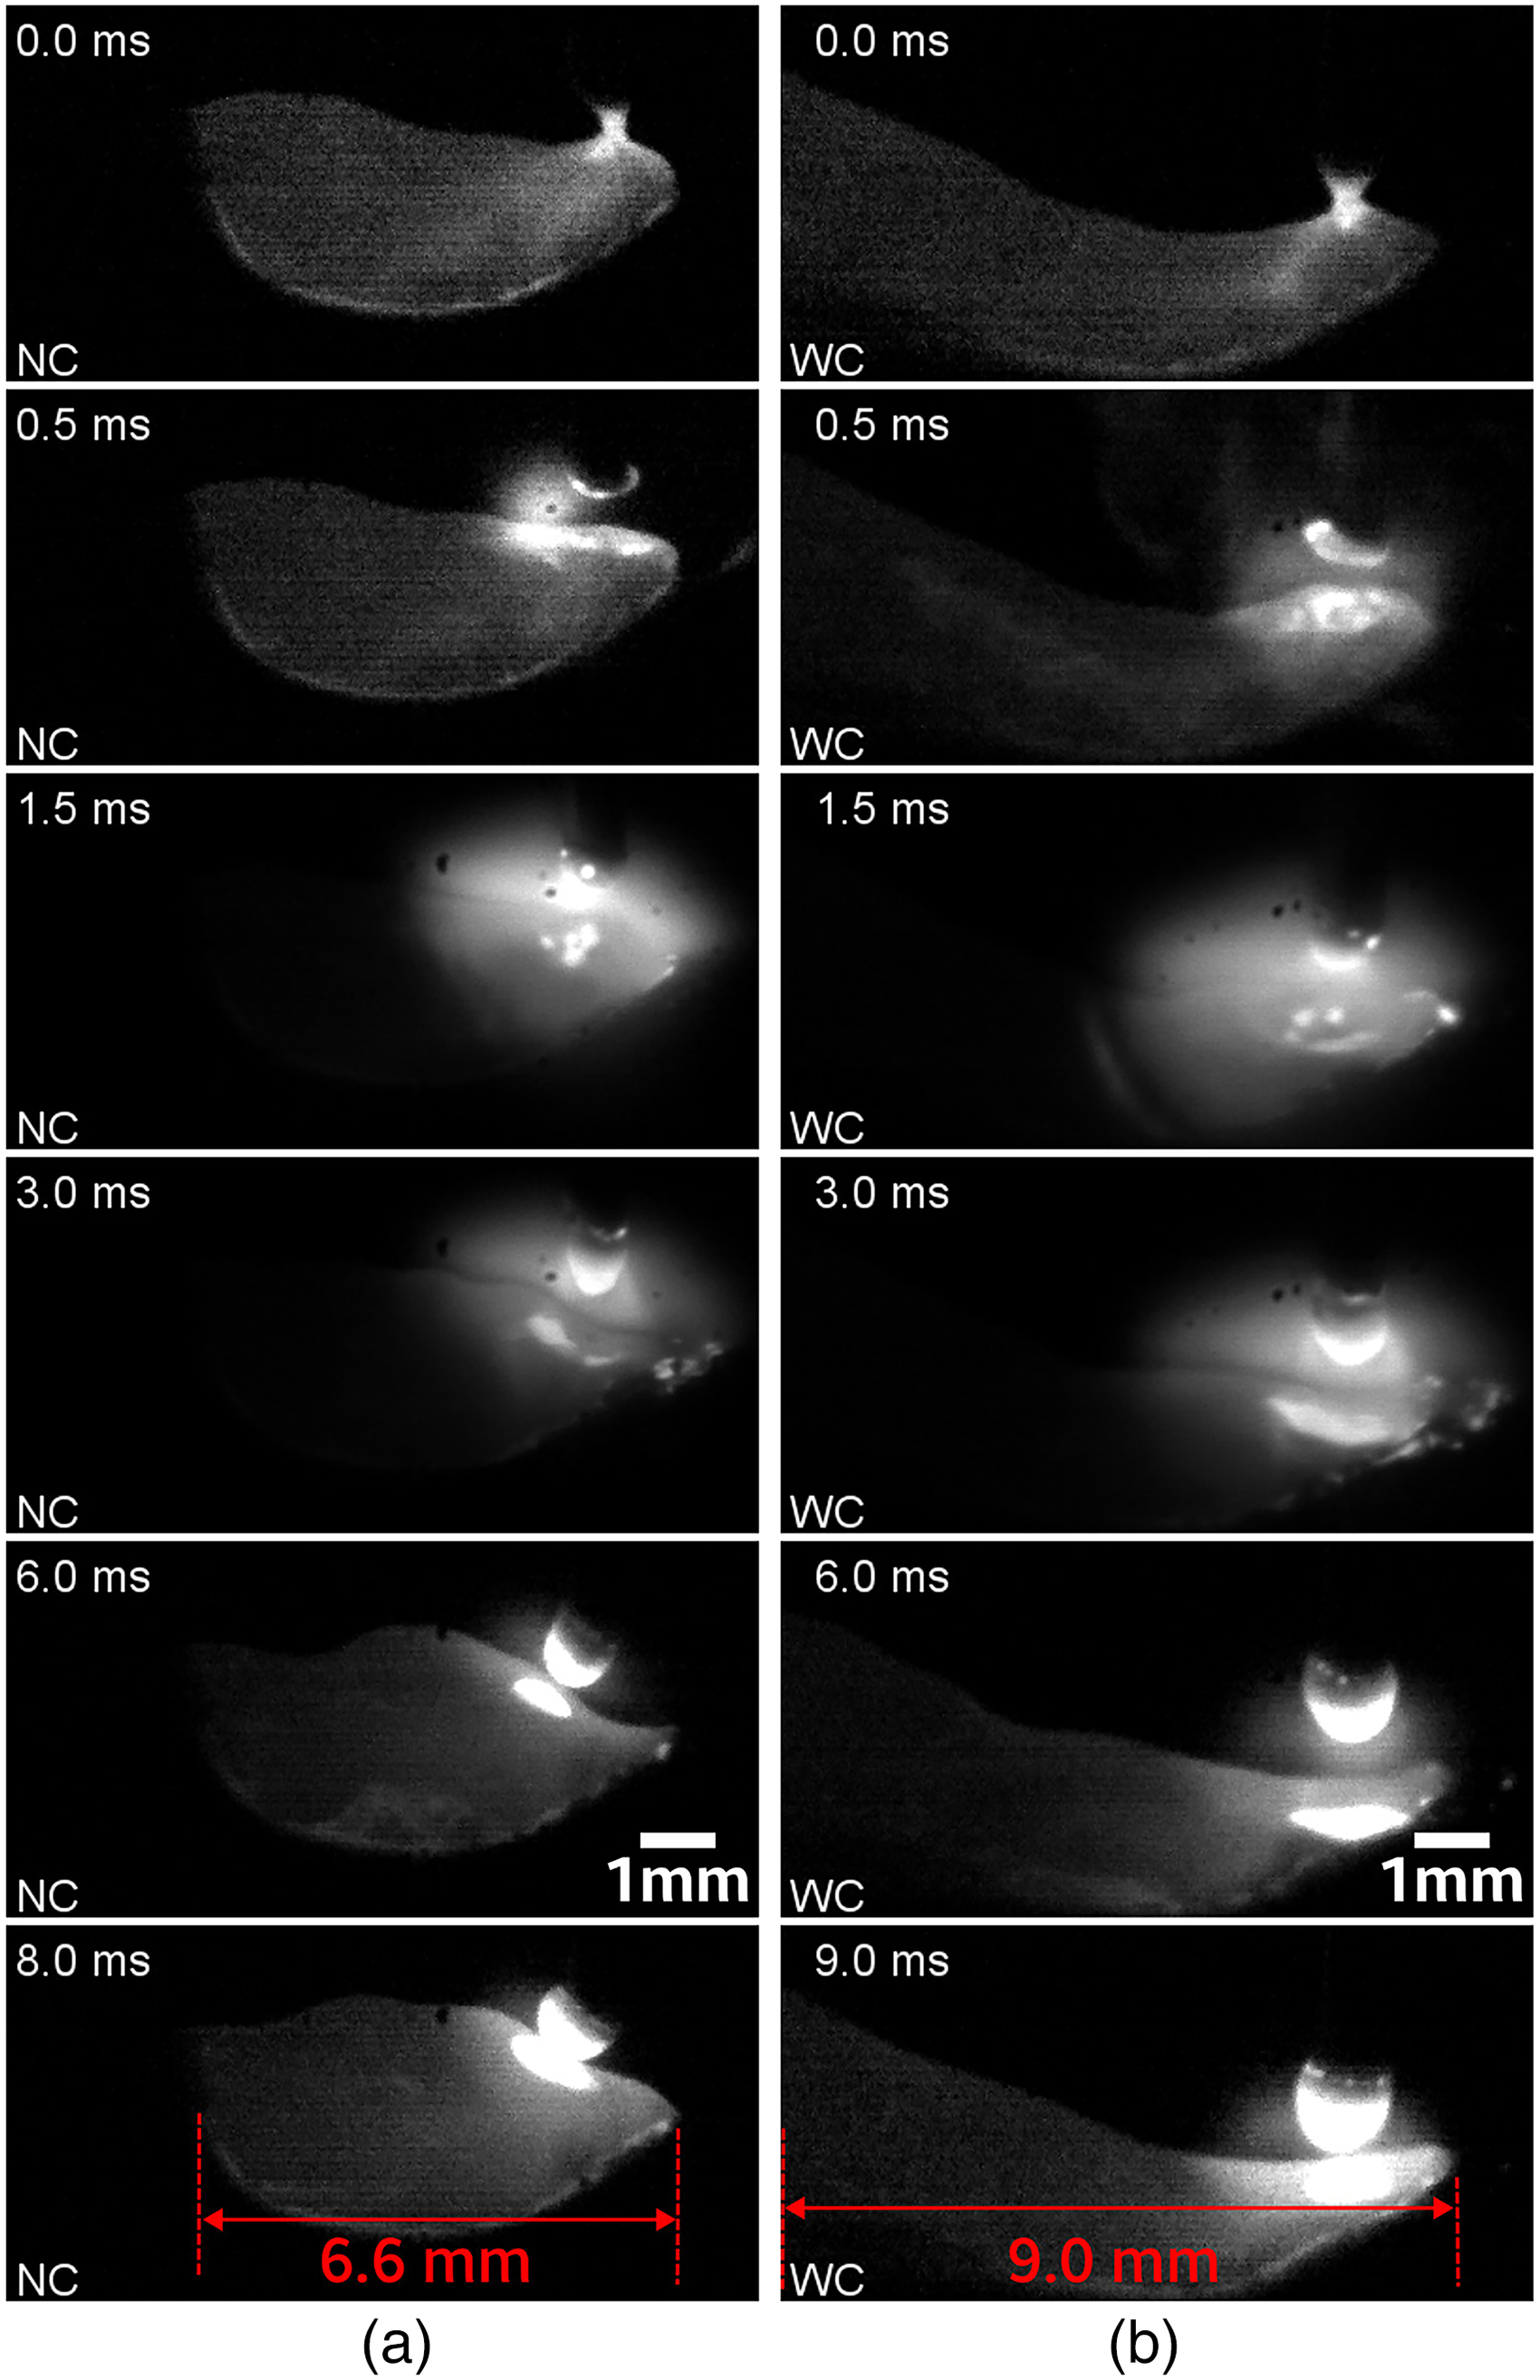
Metal transfer process sequence for (a) natural-cooled (NC), and (b) water-cooled (WC) plate conditions, while depositing the sixth bead. Images captured using high-speed videography.
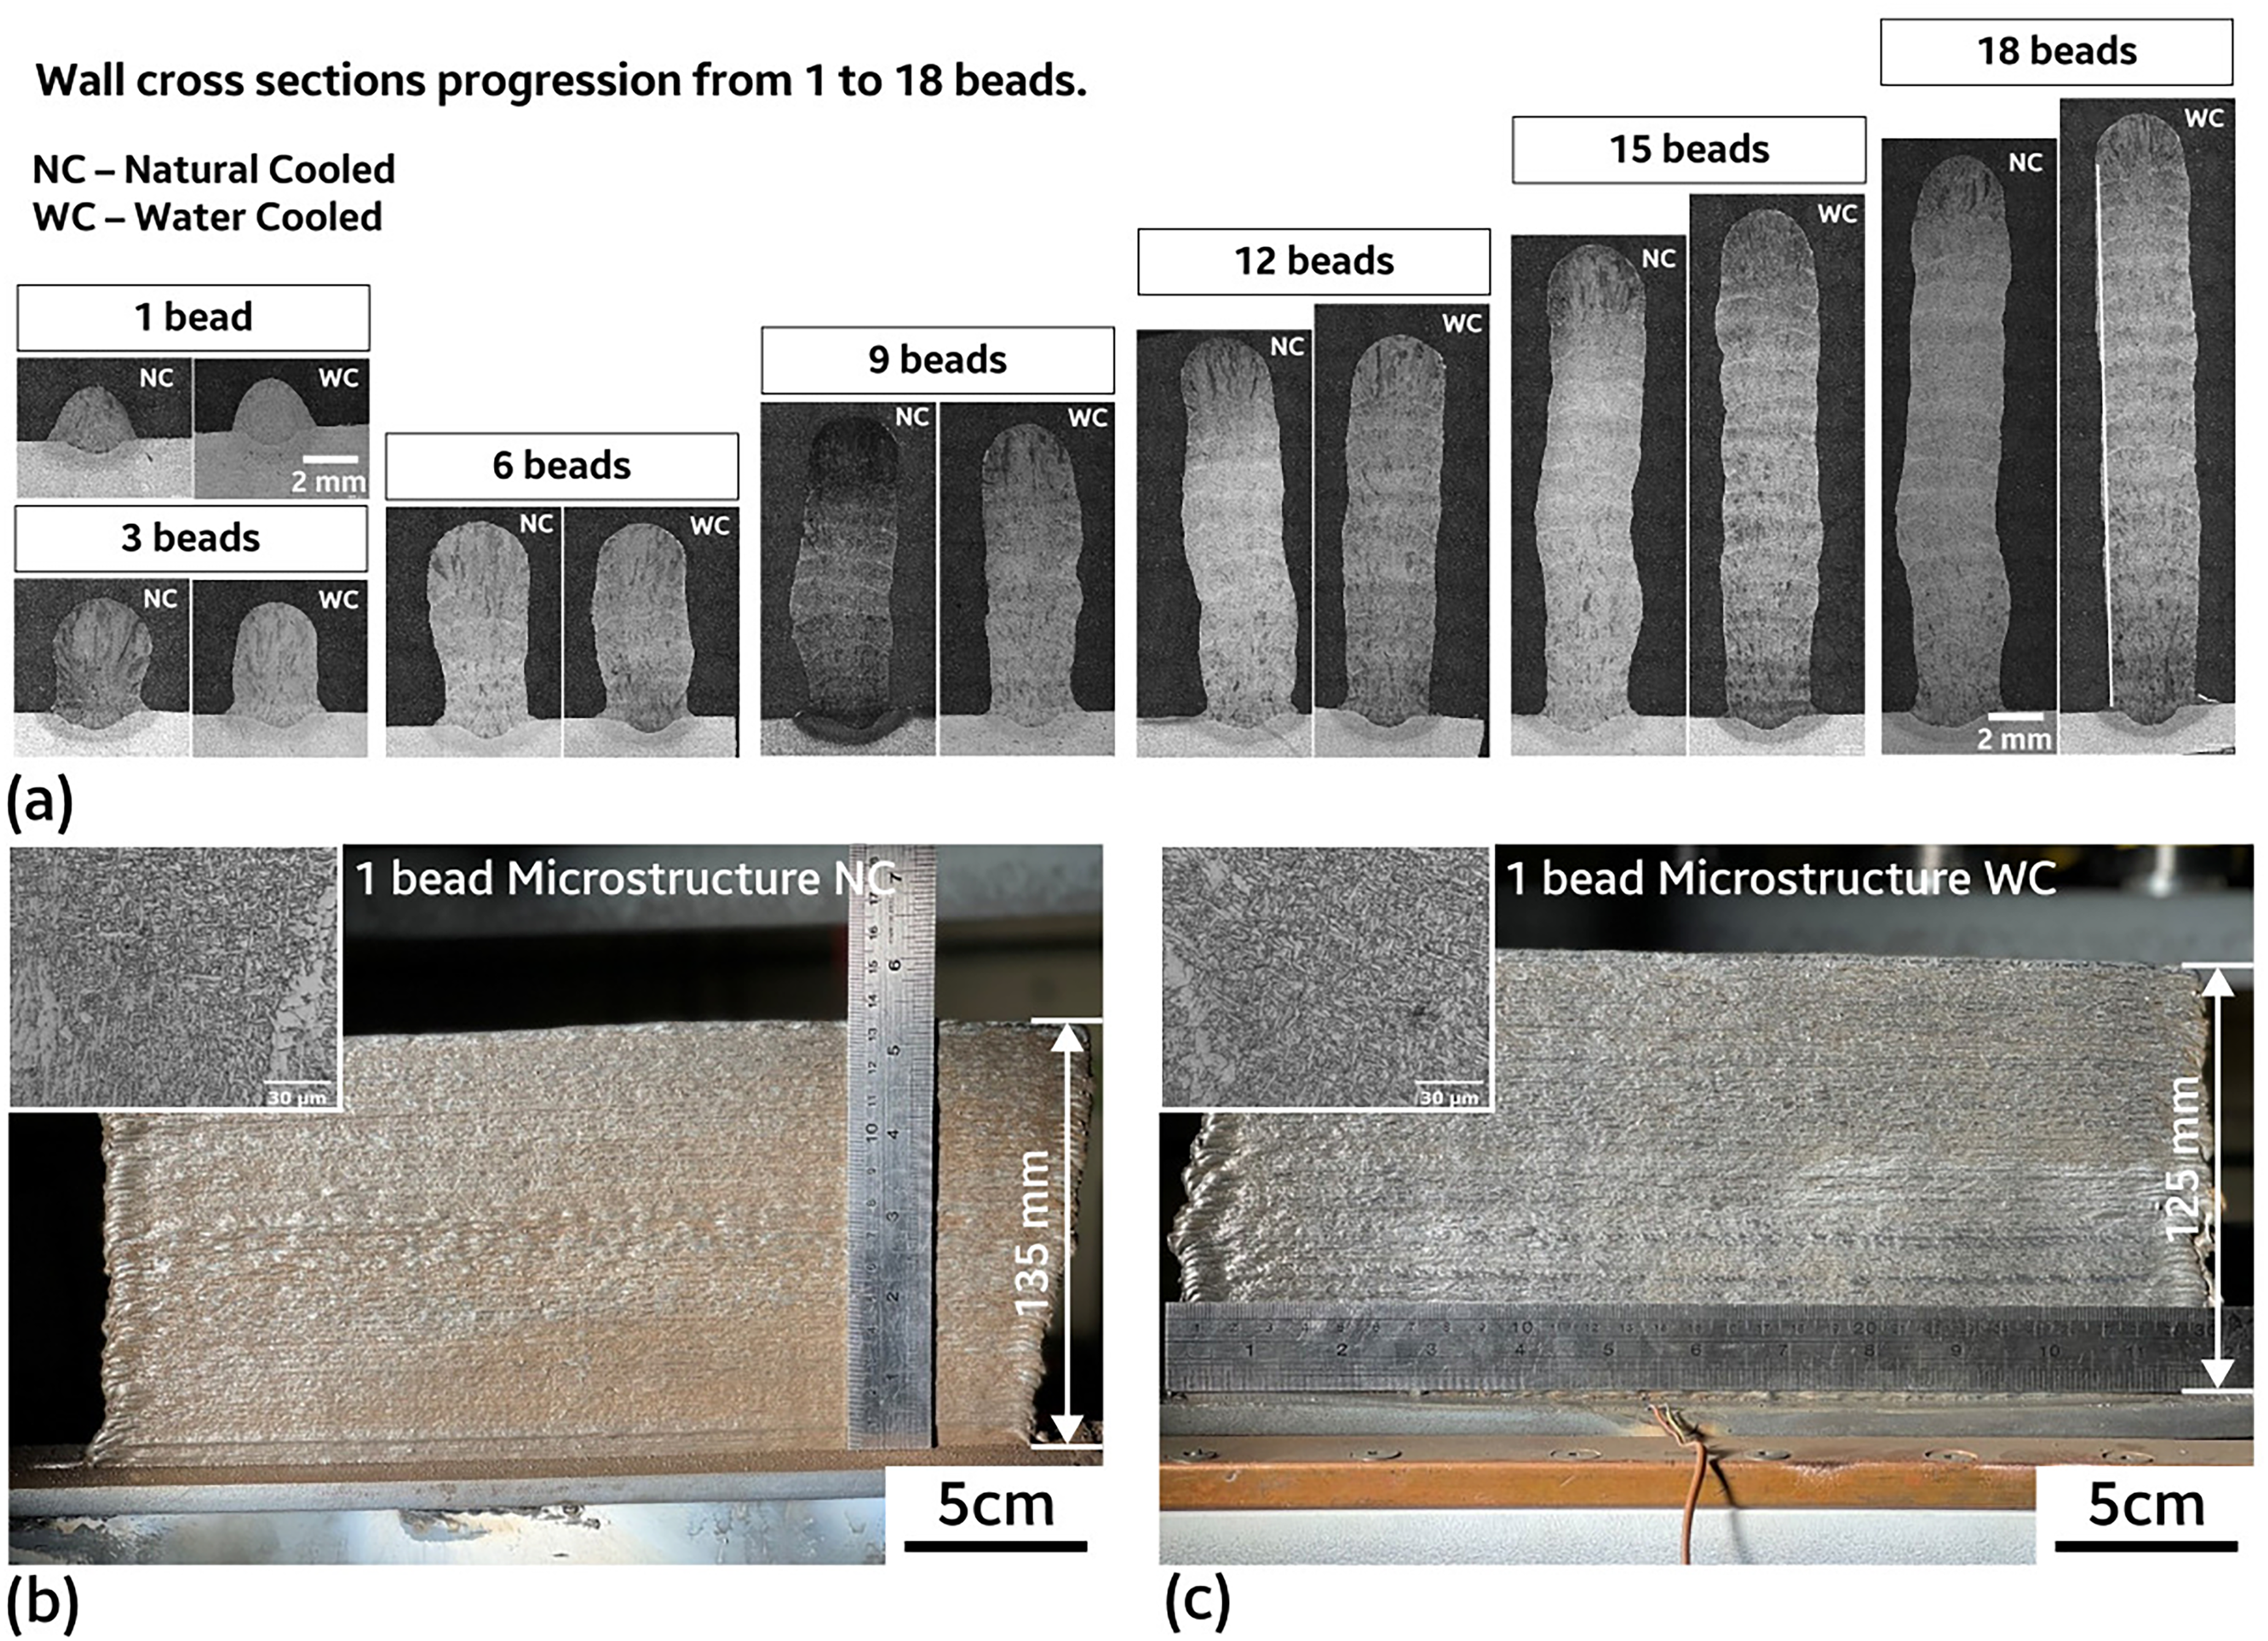
(A) Cross-sections of wall profiles after 1 to 18 beads were deposited for both the natural-cooled (NC) and water-cooled (WC) specimens. Completed wall appearance for (b) NC and (c) WC conditions.
Figure 4 shows the build-up progression from beads 1 to 18 and the final walls produced. To compare the uniformity during layer-by-layer bead deposition, the cross-section of the slender wall was compared after every three layers while depositing up to 18 beads. The progress of the wall build-up for both cooling conditions, NC and WC specimens, is shown in Figure 4(a). It can be noted that the WC specimen has a more uniform vertical profile. The increased cooling likely contributed to the slightly higher solidification rate, which in turn increased the uniformity of the wall. The layer height for the beads in the as-deposited beads was around 2.2 mm, while the remelted layers had a height of around 1.2 mm, and were similar to both cooling conditions.
When the deposition is continued for 100 bead passes, a wall with an overall height of 135 mm could be built, and rather uniform vertical and thickness dimensions for both conditions are achieved, as shown in Figure 4(b) and (c). Both walls presented an overall comparable surface quality. It should be noted that the starting and end conditions are somewhat non-uniform compared to the bulk, as the deposition control algorithm has not incorporated ramp-up during arc start and ramp-down parameters, since it was not the focus of this work.
To determine the influence of cooling conditions on the microstructures and properties, the microhardness and optical micrographs were observed in more detail after etching. The microhardness profiles for the first 18 beads (∼22 mm) are shown in Figure 5, and these indicate that the WC specimen has consistently higher hardness than the NC specimen throughout the wall structure. The higher cooling rates can be expected to increase the fraction of lower transformation products during the deposition and cooling of the deposited steel produced using the ER70-S6. In the most recent layers deposited at the top above the 20 mm distance, the hardness difference between the two structures is negligible, with overlapping scatter bands, since the cooling offered by the WC substrate is less affective at this larger distance. Likewise, near the substrate, where the first few layers were deposited, the difference in hardness between the two cooling conditions is most pronounced, with the WC specimen exhibiting more than a 25 Vickers hardness (HV) increase due to accelerated cooling compared to the NC specimen. This difference is also enhanced near the substrate due to some dilution with the substrate as well, which may have contributed to a slight increase in carbon content of the first few layers, since the substrate was composition was AISI 1045, which would have an approximate carbon content of 0.45%C, compared to the nominal carbon content in the range of 0.06–0.15%C in the ER70-S6 electrode. Thus, the increased hardenability will promote higher hardness values in the first few layers adjacent to the substrate.
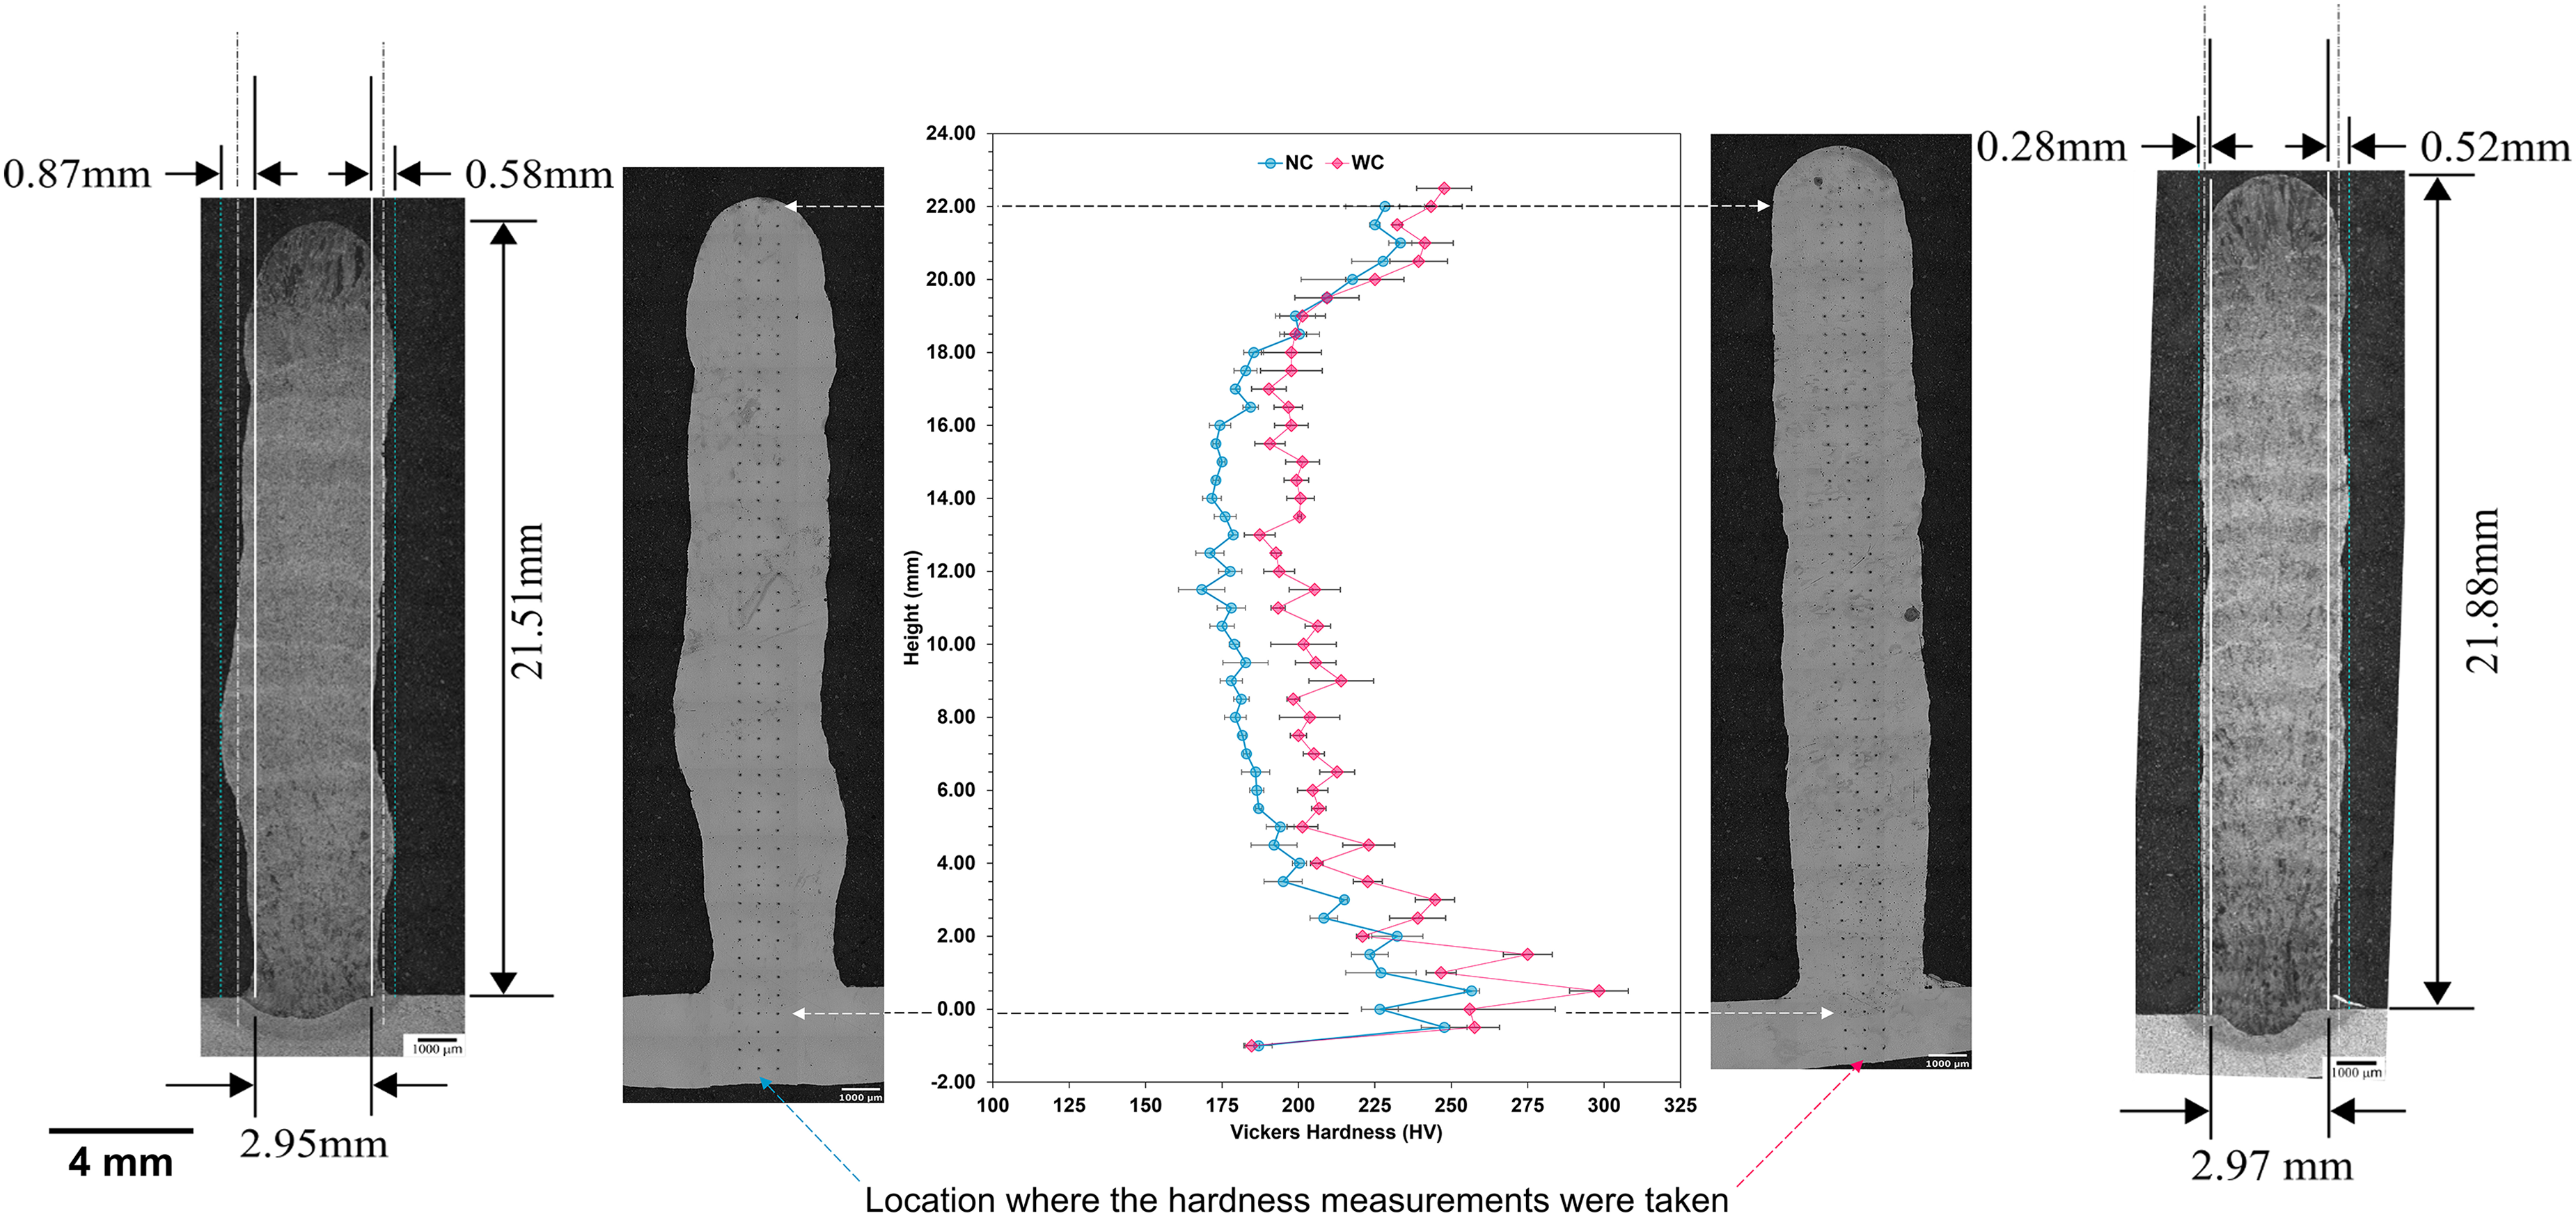
Hardness profiles for the first 18 beads (∼22 mm) for both conditions, and dimensional measurements for wall profiles. Left for natural-cooled (NC); right for water-cooled (WC) plate conditions.
In Figure 6, the typical microstructures for both deposits are shown after etching to reveal the microconstituents in the as-deposited and re-heated layers. The NC specimen, which experienced only air-cooling, had nearly identical microstructures to the WC specimen at the uppermost layer, since the influence of accelerated cooling was negligible in this location, far away from the chilled substrate of the WC specimen.
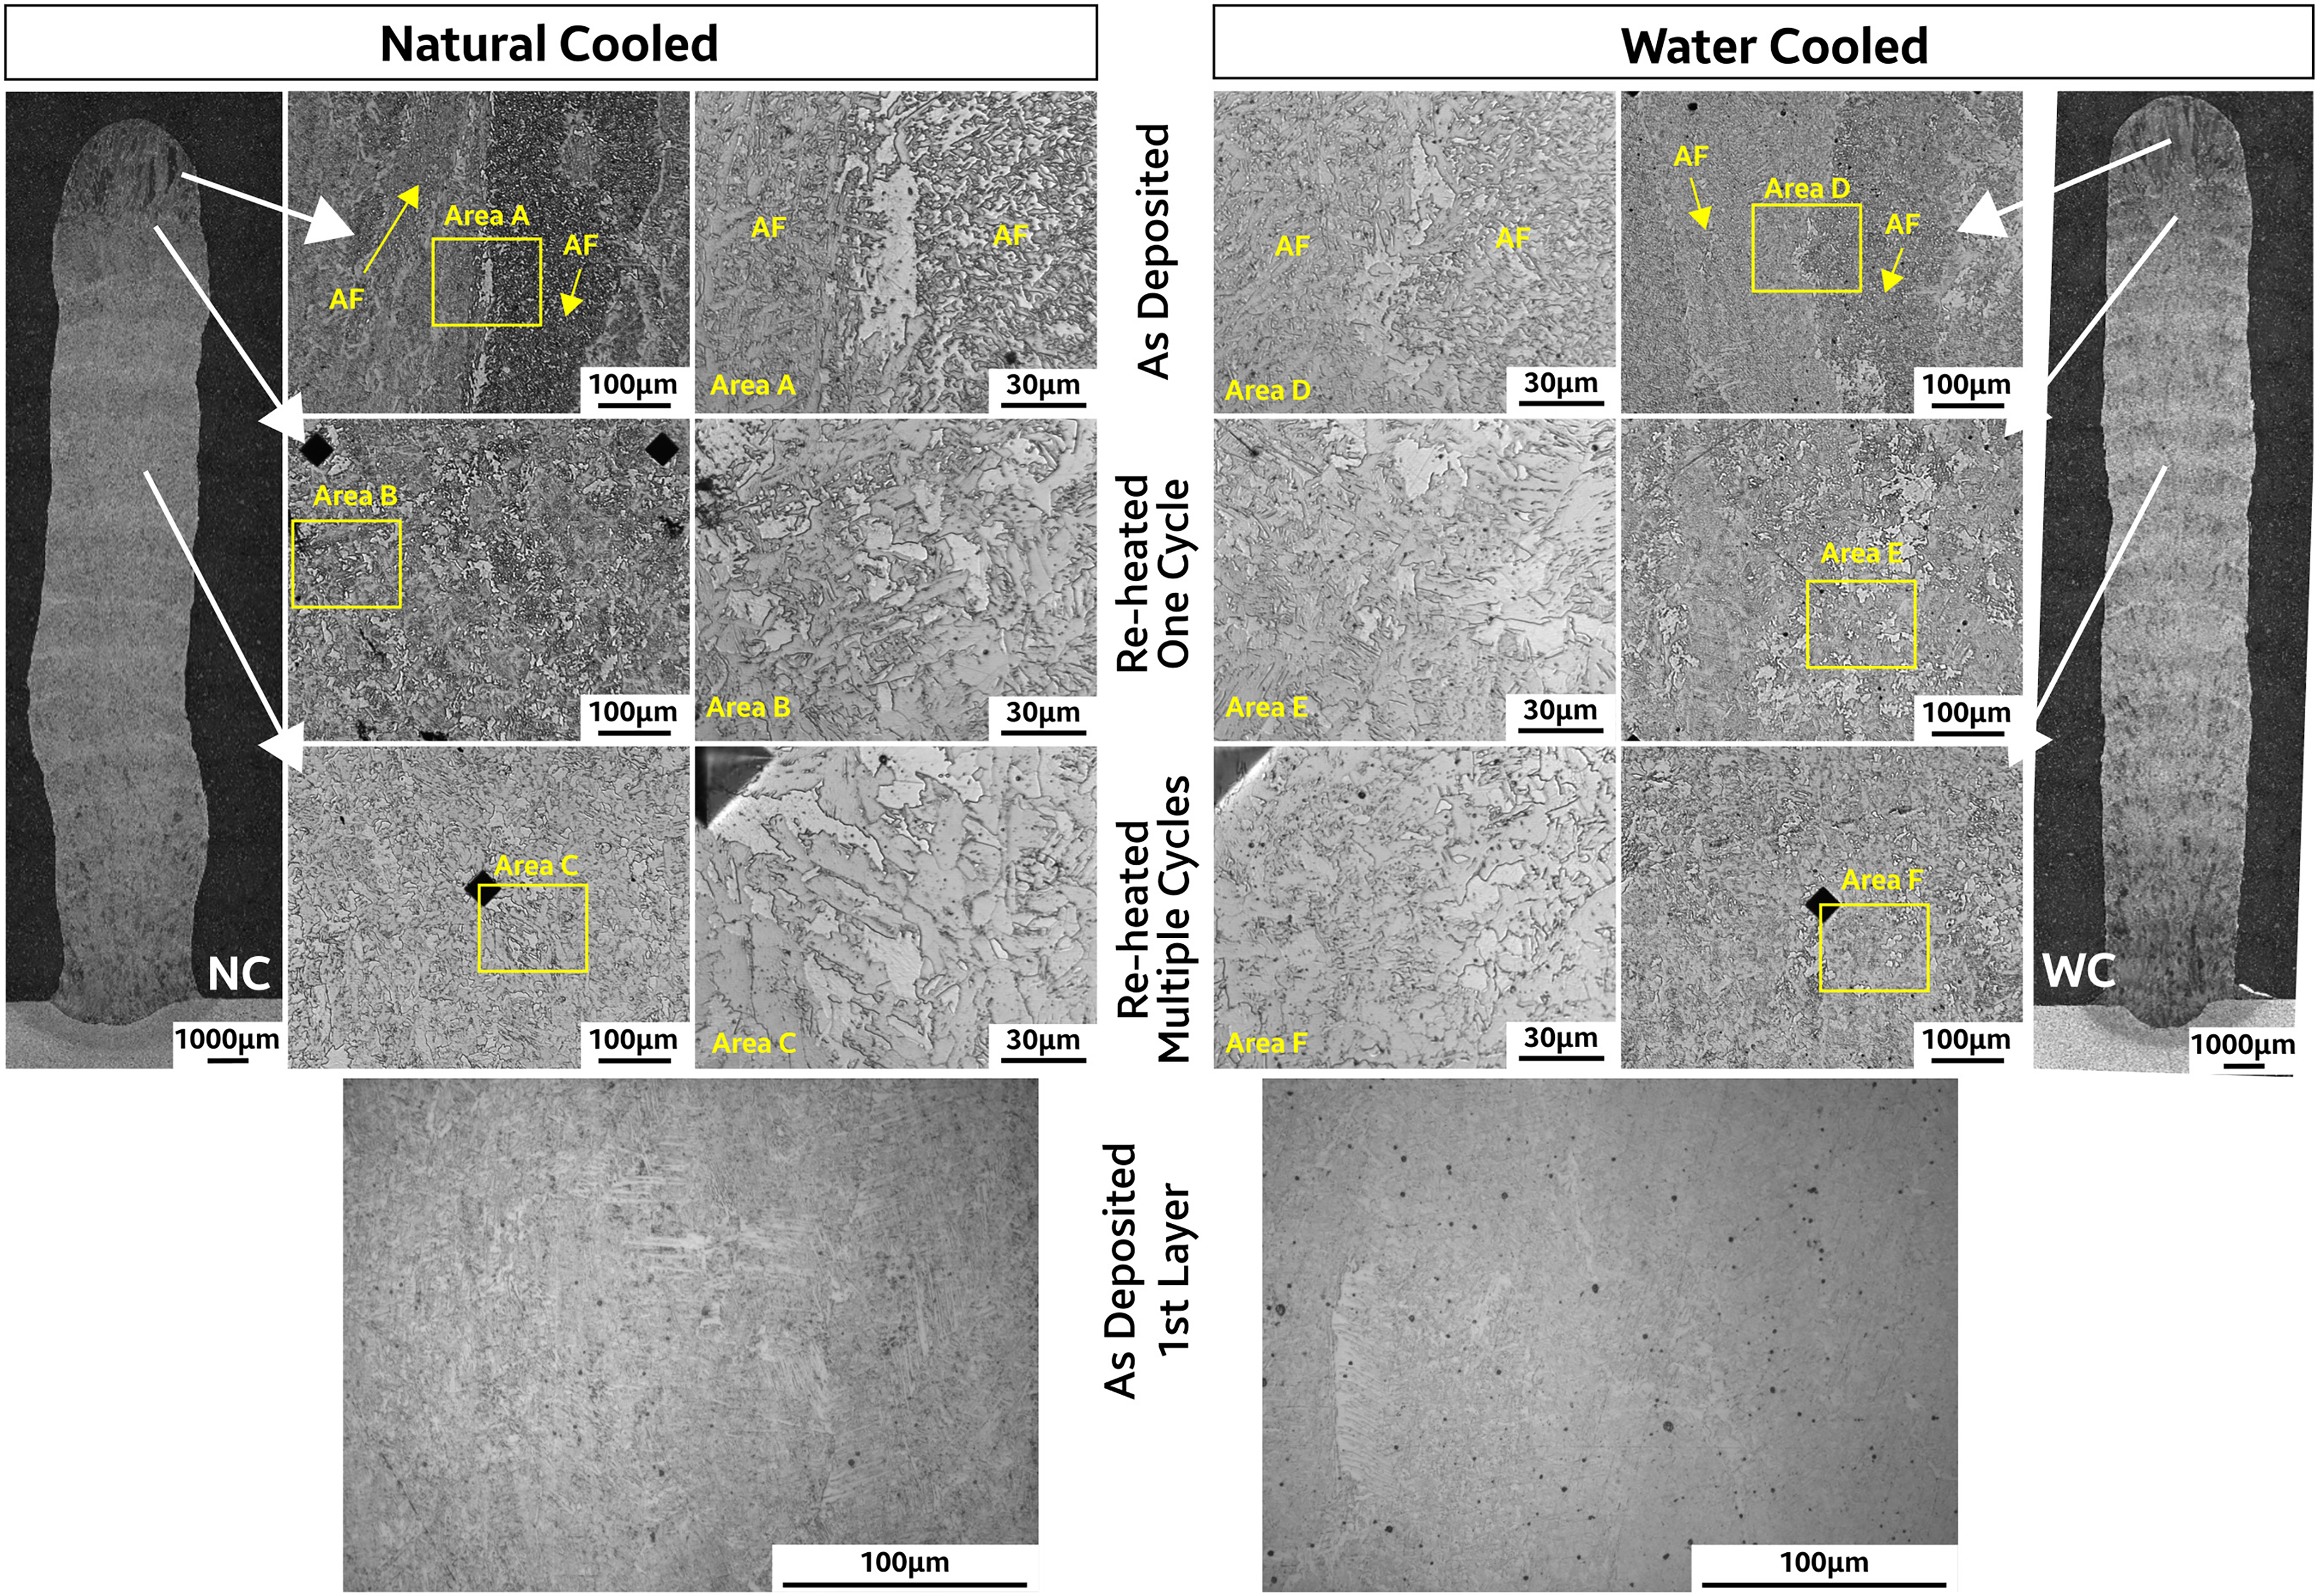
Typical microstructure for the as-deposited and re-heated weld metal.
The microstructures in these as-deposited locations in Figure 6 were for both conditions, consisting mainly of acicular ferrite, with a small fraction of grain boundary ferrite, which is typical of weld metal deposits made using ER70-S6 electrodes when low heat input is used. However, the fraction of acicular ferrite and grain sizes of the acicular ferrite laths are much finer than that previously reported for AM wall structures produced using conventional GMAW technology, which has been demonstrated with heat input values from 0.473 to 0.573 kJ/mm.18,19 The key reason for this is that the heat input applied in the present work is only 0.141 kJ/mm, since it utilises a more optimised droplet transfer method. This reduced heat input appears to contribute to a reduced fraction of grain boundary ferrite and increased refinement of the acicular ferrite laths due to the higher cooling rate, as is commonly observed in carbon steels.20,21 It should also be noted that the low 0.141 kJ/mm heat input used here is drastically lower than the 0.473 kJ/mm previously reported for ER70 wire by Ugalde et al., 19 while maintaining 86% of the mass deposition rate. It has been reported that the cold-metal transfer (CMT) process can be used to reduce heat; however, lack of fusion is reported when heat input values are below 0.2 kJ/mm. 10 Furthermore, when comparing the ‘as deposited 1st layer’ microstructure, one can see more clearly notice the difference between NC and WC plate conditions, since this is the layer most affected by the different cooling conditions, despite the multiple subsequent re-heating cycles.
If one compares the welding heat input to the amount of filler metal being deposited, the power ratio as defined as per the American Society of Mechanical Engineers (ASME), Boiler and Pressure Vessel Code (BPVC), provides a better measure of how the present process differs from other pulsed GMAW methods. The power ratio is defined as follows:
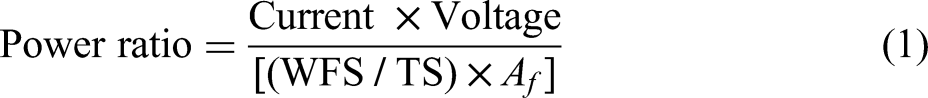
Power density as defined in ASME BPVC Sec. IX.
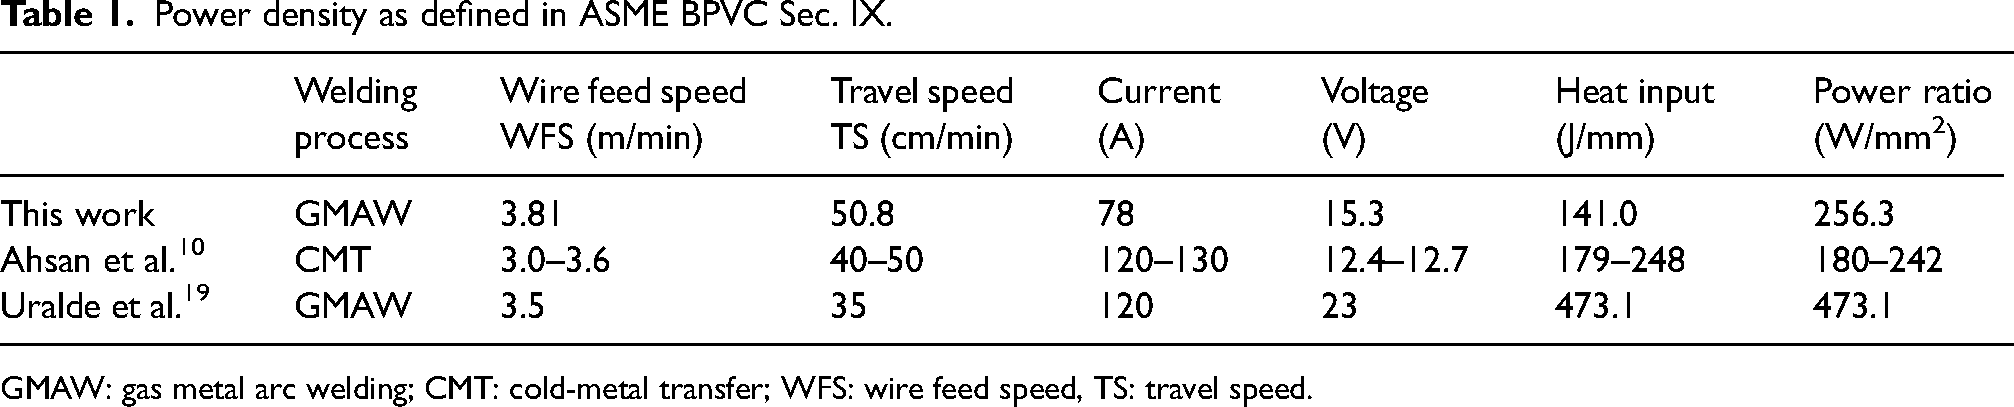
GMAW: gas metal arc welding; CMT: cold-metal transfer; WFS: wire feed speed, TS: travel speed.
Figure 7 shows the stress–strain curves for tensile coupons extracted from the indicated regions R1, R2 and R3, and Supplemental Table S3 provides the summary of the tensile properties, while Supplemental Table S4 provides the anisotropy measurements for the tensile properties. All the tested specimens exhibited discontinuous yielding, typical of carbon steel weld metal produced using ER70-S6 weld metal, with a minimum yielding strength of 460 MPa. Despite the samples tested transverse to the welding direction, and longitudinal to the building direction, presenting the lowest yield strength of 460 MPa, their yield strength values are 60 MPa above the minimum specified for this welding wire, as shown in Supplemental Table S1. The elongation values all exceeded 22% engineering strain, which is also the minimum specified for the ER70S-6 carbon steel wire as shown in Supplemental Table S1. Interesting to note that the ultimate tensile strength (UTS) value of the wall was comparable for the NC and WC in both the R1 and R3 locations; however, the R1 specimens exhibited the highest UTS values of 666 MPa for the NC specimens, compared to 655 MPa for the WC specimens.
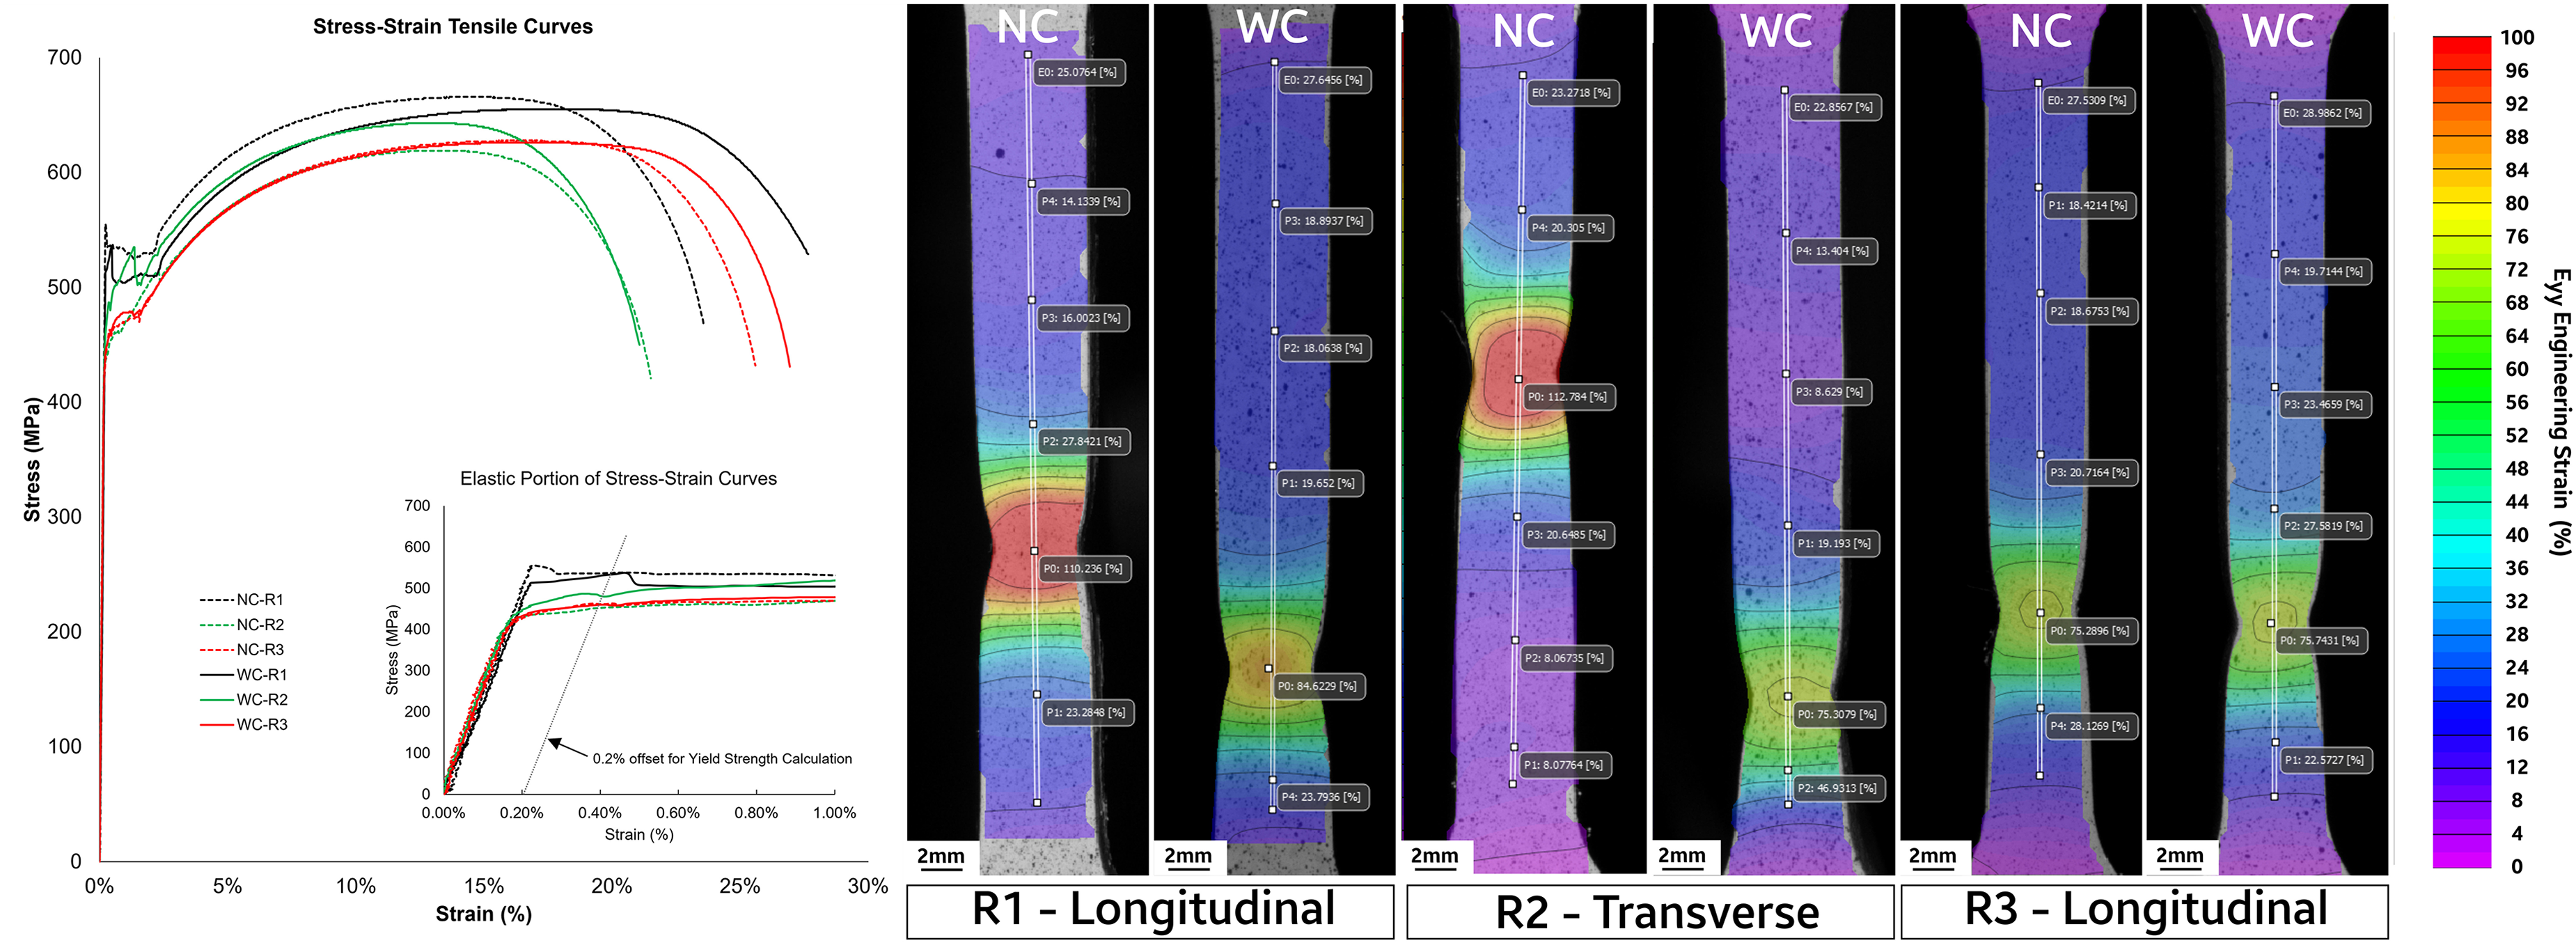
Stress–strain curves and syy engineering strain distributions for specimens from regions R1, R2 and R3 for natural cooled (NC) and water cooled (WC) conditions. The vertical lines in the middle of the sample are the DIC digital extensometer, and the points are local strain measurements.
In Figure 7, DIC images were taken at the frame prior to fracture, and as such, they show the strain distribution prior to fracture. By evaluating the local maximum strains around the necked region using DIC imaging, shown in Figure 7, it can be noted that the NC specimens reached higher local strains for the R1 and R2 locations, while similar peak strains occurred for both cooling conditions in the R3 location. This is consistent with the microhardness results, which also indicate that the hardness properties were nearly identical in the upper region near R3 due to the negligible impact that the cooled substrate would have at a large distance away from the top surface layers at R3. The slightly reduced ductility observed along the build direction in the R2 samples is consistent with widely reported anisotropy in properties measured for WAAM specimens,22,23 where reduced ductility along the build direction in carbon steel components has been associated with HAZ softening or defects between the deposited layers. 24 In the present work, there does not appear to be significant HAZ softening evident based on the hardness distribution along the vertical direction shown in Figure 6. In the present work, it appears that the slight reduction in the strength and ductility along the build direction is likely correlated to the average reduction in hardness and strength around the middle region of the build wall. 25 This suggests that the overall properties of larger structures built using WAAM with ultra-low heat input techniques will have improved uniformity in properties and less anisotropy than conventional GMAW-based AM methods.
Conclusions
The use of a power supply optimised for ultra-low heat input short-circuit droplet transfer is evaluated for deposition of carbon steel by WAAM methods, along with a WC substrate for increased cooling rate of the deposited samples. Based on an analysis of the processing behaviour and the material properties produced in a 30 × 13.5 cm-sized wall, the following has been observed:
Direct energy deposition-arc was demonstrated for the first time using a GMAW-based process with ultra-low heat input values of 0.141 kJ/mm without formation of defects such as internal porosity or inter-layer lack of fusion, while achieving a fabrication rate of 1.48 kg/h. The tensile properties of the as-built material are comparable to weld metals produced using an ER70-S6 steel electrode, with yielding strength and ultimate tensile strength, for all tested conditions, at least 60 and 139 MPa above the minimum requirement for this wire electrode, respectively. Tensile properties further away from the substrate were similar regardless of the cooling condition. Properties were uniform for the build reported in this work. Furthermore, the builds suffered anisotropy of > 10% for the ultimate tensile strength, which can be attributed to the very thin deposited beads, with an average height of 1.2 mm, using the ultra-low heat input deposition method. Excellent material ductility is observed; however, slightly higher tensile ductility is exhibited along the travel direction of the torch versus the build direction of the samples, as shown in Supplemental Table S4.
Supplemental Material
sj-docx-1-stw-10.1177_13621718251376850 - Supplemental material for Direct energy deposition via arc manufacturing using ultra-low heat input gas metal arc welding
Supplemental material, sj-docx-1-stw-10.1177_13621718251376850 for Direct energy deposition via arc manufacturing using ultra-low heat input gas metal arc welding by Emanuel Bruno Ferreira dos Santos, Paulo D’Angelo Costa Assunção, Nazmul Huda, Rami Hakim, Robert J Pistor, Jay West and Adrian P Gerlich in Science and Technology of Welding and Joining
Footnotes
Acknowledgements
The authors would like to acknowledge the support from Liburdi Dimetrics Corporation staff, including Kyle Zwiep, Gurav Nayak and Steve Soyka.
Declaration of conflicting interests
The authors declared no potential conflicts of interest with respect to the research, authorship, and/or publication of this article.
Funding
The authors disclosed receipt of the following financial support for the research, authorship, and/or publication of this article: This project has been supported by grants from the Federal Economic Development Agency for Southern Ontario and the Natural Sciences and Engineering Research Council of Canada.
Supplemental material
Supplemental material for this article is available online.
References
Supplementary Material
Please find the following supplemental material available below.
For Open Access articles published under a Creative Commons License, all supplemental material carries the same license as the article it is associated with.
For non-Open Access articles published, all supplemental material carries a non-exclusive license, and permission requests for re-use of supplemental material or any part of supplemental material shall be sent directly to the copyright owner as specified in the copyright notice associated with the article.