
Abstract
This study compares gas tungsten arc welding (GTAW) and gas tungsten arc welding (GMAW) for wire arc additive manufacturing (WAAM) using ER70S-6 steel and 316L stainless steel (SS) filler wires for single-wall deposition. Optimised parameters were determined through single-layer experiments, with GMAW, especially in synergy mode, showing better consistency and fewer defects than GTAW. GTAW walls had rough edges and height variations, while GMAW walls were smoother. Microstructural analysis revealed consistent ER70S-6 patterns, but significant variations in 316L SS, particularly in the heat-affected zone. Mechanical testing showed consistent hardness and tensile strength for ER70S-6, while 316L SS had higher hardness but greater variability, especially with GTAW. GMAW samples had higher tensile strength but lower elongation. The study suggests heat treatment to reduce mechanical property variations, especially for 316L SS.
Keywords
Introduction
Additive manufacturing (AM) has significantly revolutionised the manufacturing industry in recent years, primarily due to its ability to create complex-shaped products and parts in a time-efficient and cost-effective manner. 1 Wire arc additive manufacturing (WAAM), an efficient method for producing three-dimensional (3D) metallic parts, is particularly notable for its attractive combination of a higher deposition rate and greater energy efficiency compared to other AM technologies.2,3 WAAM utilises an arc welding process as the heat source to melt and deposit continuously fed filler wire layer by layer, gradually building up the desired shape or geometry.4,5 Various welding processes, including gas metal arc welding (GMAW), gas tungsten arc welding (GTAW), plasma arc welding and submerged arc welding, can serve as the heat source in WAAM.6–9 Furthermore, WAAM offers several advantages, including lower machine setup and maintenance costs, a user-friendly and open architecture and a broader range of manufacturable materials. However, heat accumulation and the complex, uneven thermal conditions including inter-layer temperature and cooling rate pose significant and inevitable challenges for WAAM. These factors strongly influence the dimensional accuracy of manufactured parts, particularly for larger components. 10 Moreover, the lack of a comparative database that evaluates geometrical accuracy, microstructural homogeneity and mechanical integrity across different WAAM processes further complicates the selection of the most appropriate WAAM process for specific applications.
WAAM is widely used for fabricating large steel components, with 316L stainless steel (SS) and ER70S-6 mild steel being commonly used materials due to their favourable properties and industrial relevance.11–15 316L SS, retains its mechanical properties at elevated temperatures and is readily available as feedstock materials for WAAM.16–18 While 316L SS offers good corrosion resistance and mechanical performance, issues like microstructural inhomogeneity and anisotropy along the build direction persist. 19 These issues arise primarily due to the highly directional solidification and thermal cycling.19,20 On the other hand, ER70S-6, a mild steel welding filler wire is widely used in applications such as shipbuilding, pipes, pressure vessels and automobile repair. 15 Similar to 316L SS, ER70S-6 parts exhibit significant ductility variation (up to 3 times higher in the horizontal than build direction) attributed to heterogeneous grain structures formed during deposition. 21 This difference is attributed to significant inhomogeneity in the microstructure along the build direction.22,23 High cooling rates and thermal gradients inherent to WAAM contribute to these microstructural challenges in both materials.14,24,25 In this regard, heat treatments of the manufactured parts and the use of low heat input welding processes are proposed as solutions to control the degree of inhomogeneity in WAAM parts and improve their mechanical integrity.26,27
There are two possible strategies for comparing two or more WAAM techniques: (i) deposition of geometrically identical layers and (ii) maintaining the same heat input for each variants. 28 The first strategy uses identical layer geometry to ensure equal deposition rates across techniques but may cause varying heat inputs, affecting microstructure and mechanical properties. The second strategy maintains constant heat input to promote similar properties, though it may lead to differences in geometry. Singh et al. 28 compared brazing processes at constant WFRs and recommended using identical heat input to better understand microstructural and mechanical differences across different arc joining methods, providing a foundational database for selecting techniques based on bead geometry requirements. Notably, no comparative database currently exists for WAAM using GTAW versus GMAW, highlighting a key research gap.
Each WAAM process can produce distinct layer geometries even under identical heat input or deposition rates, due to inherent differences in metal transfer modes and process synergies. The lack of comparative data on this fundamental variation forms the primary motivation for the present study. This work systematically compares two welding techniques (GTAW and GMAW) for both single-layer and single wall (multiple layers) depositions using two different filler wires: ER70S-6 and 316L SS. Subsequently, the geometry, microstructure and mechanical properties of the deposited walls were analysed and compared.
Materials and methodology
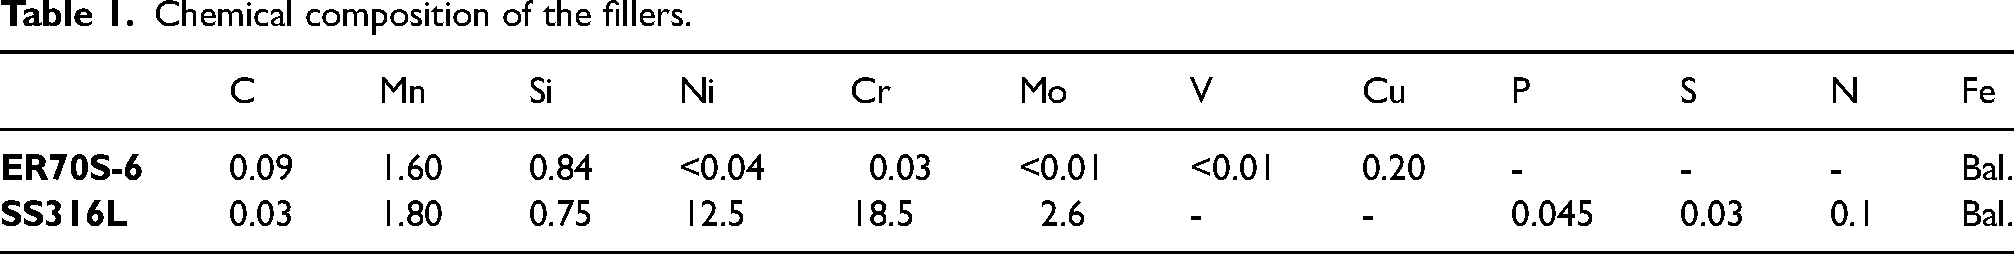
In this study, 1 mm diameter filler wires of low carbon steel (ER70S-6) and SS (316L) were employed. The chemical composition of both wires is provided in Table 1. Pure argon was used for the shielding (18 L/min) of molten pool in both processes.
Chemical composition of the fillers.
In this study, the identical strategy (approximately same deposition rate) was used to compare the WAAM capabilities of GTAW and GMAW processes for building a single wall. The heat input is calculated using equations (i).
where η represents the efficiency of the welding process (60% for GTAW 29 and 80% for GMAW 30 ), U the root mean square (RMS) value of voltage [V], I the RMS value of current [A] and TS the travel speed [mm/s], respectively.
A common motion system with a replaceable torch mount was used for both processes. GMAW employed a KEMPY Pro MIG 501 (feeder/control) and Pro MIG 3200 (power source) in conventional continuous wave mode, allowing independent voltage and wire feed speed (WFS) control. For GTAW, a TELWIN Technology AC welding machine was used. Parameters like WFS, TS and path were set via G-code using Repetier Host software.
Different approaches were employed for depositing the layers using both processes, as illustrated in Figure 1. In the case of GTAW, alternating deposition, similar to GMAW, required the feeder position to change from one side to the other after every layer, making it very challenging to maintain it at the exact same position. Consequently, unidirectional deposition was adopted for the GTAW process. Torches were kept perpendicular to the substrate in both processes, with material fed at a 30-degree angle from the substrate only in the case of GTAW, as depicted in Figure 1(a) and (b).
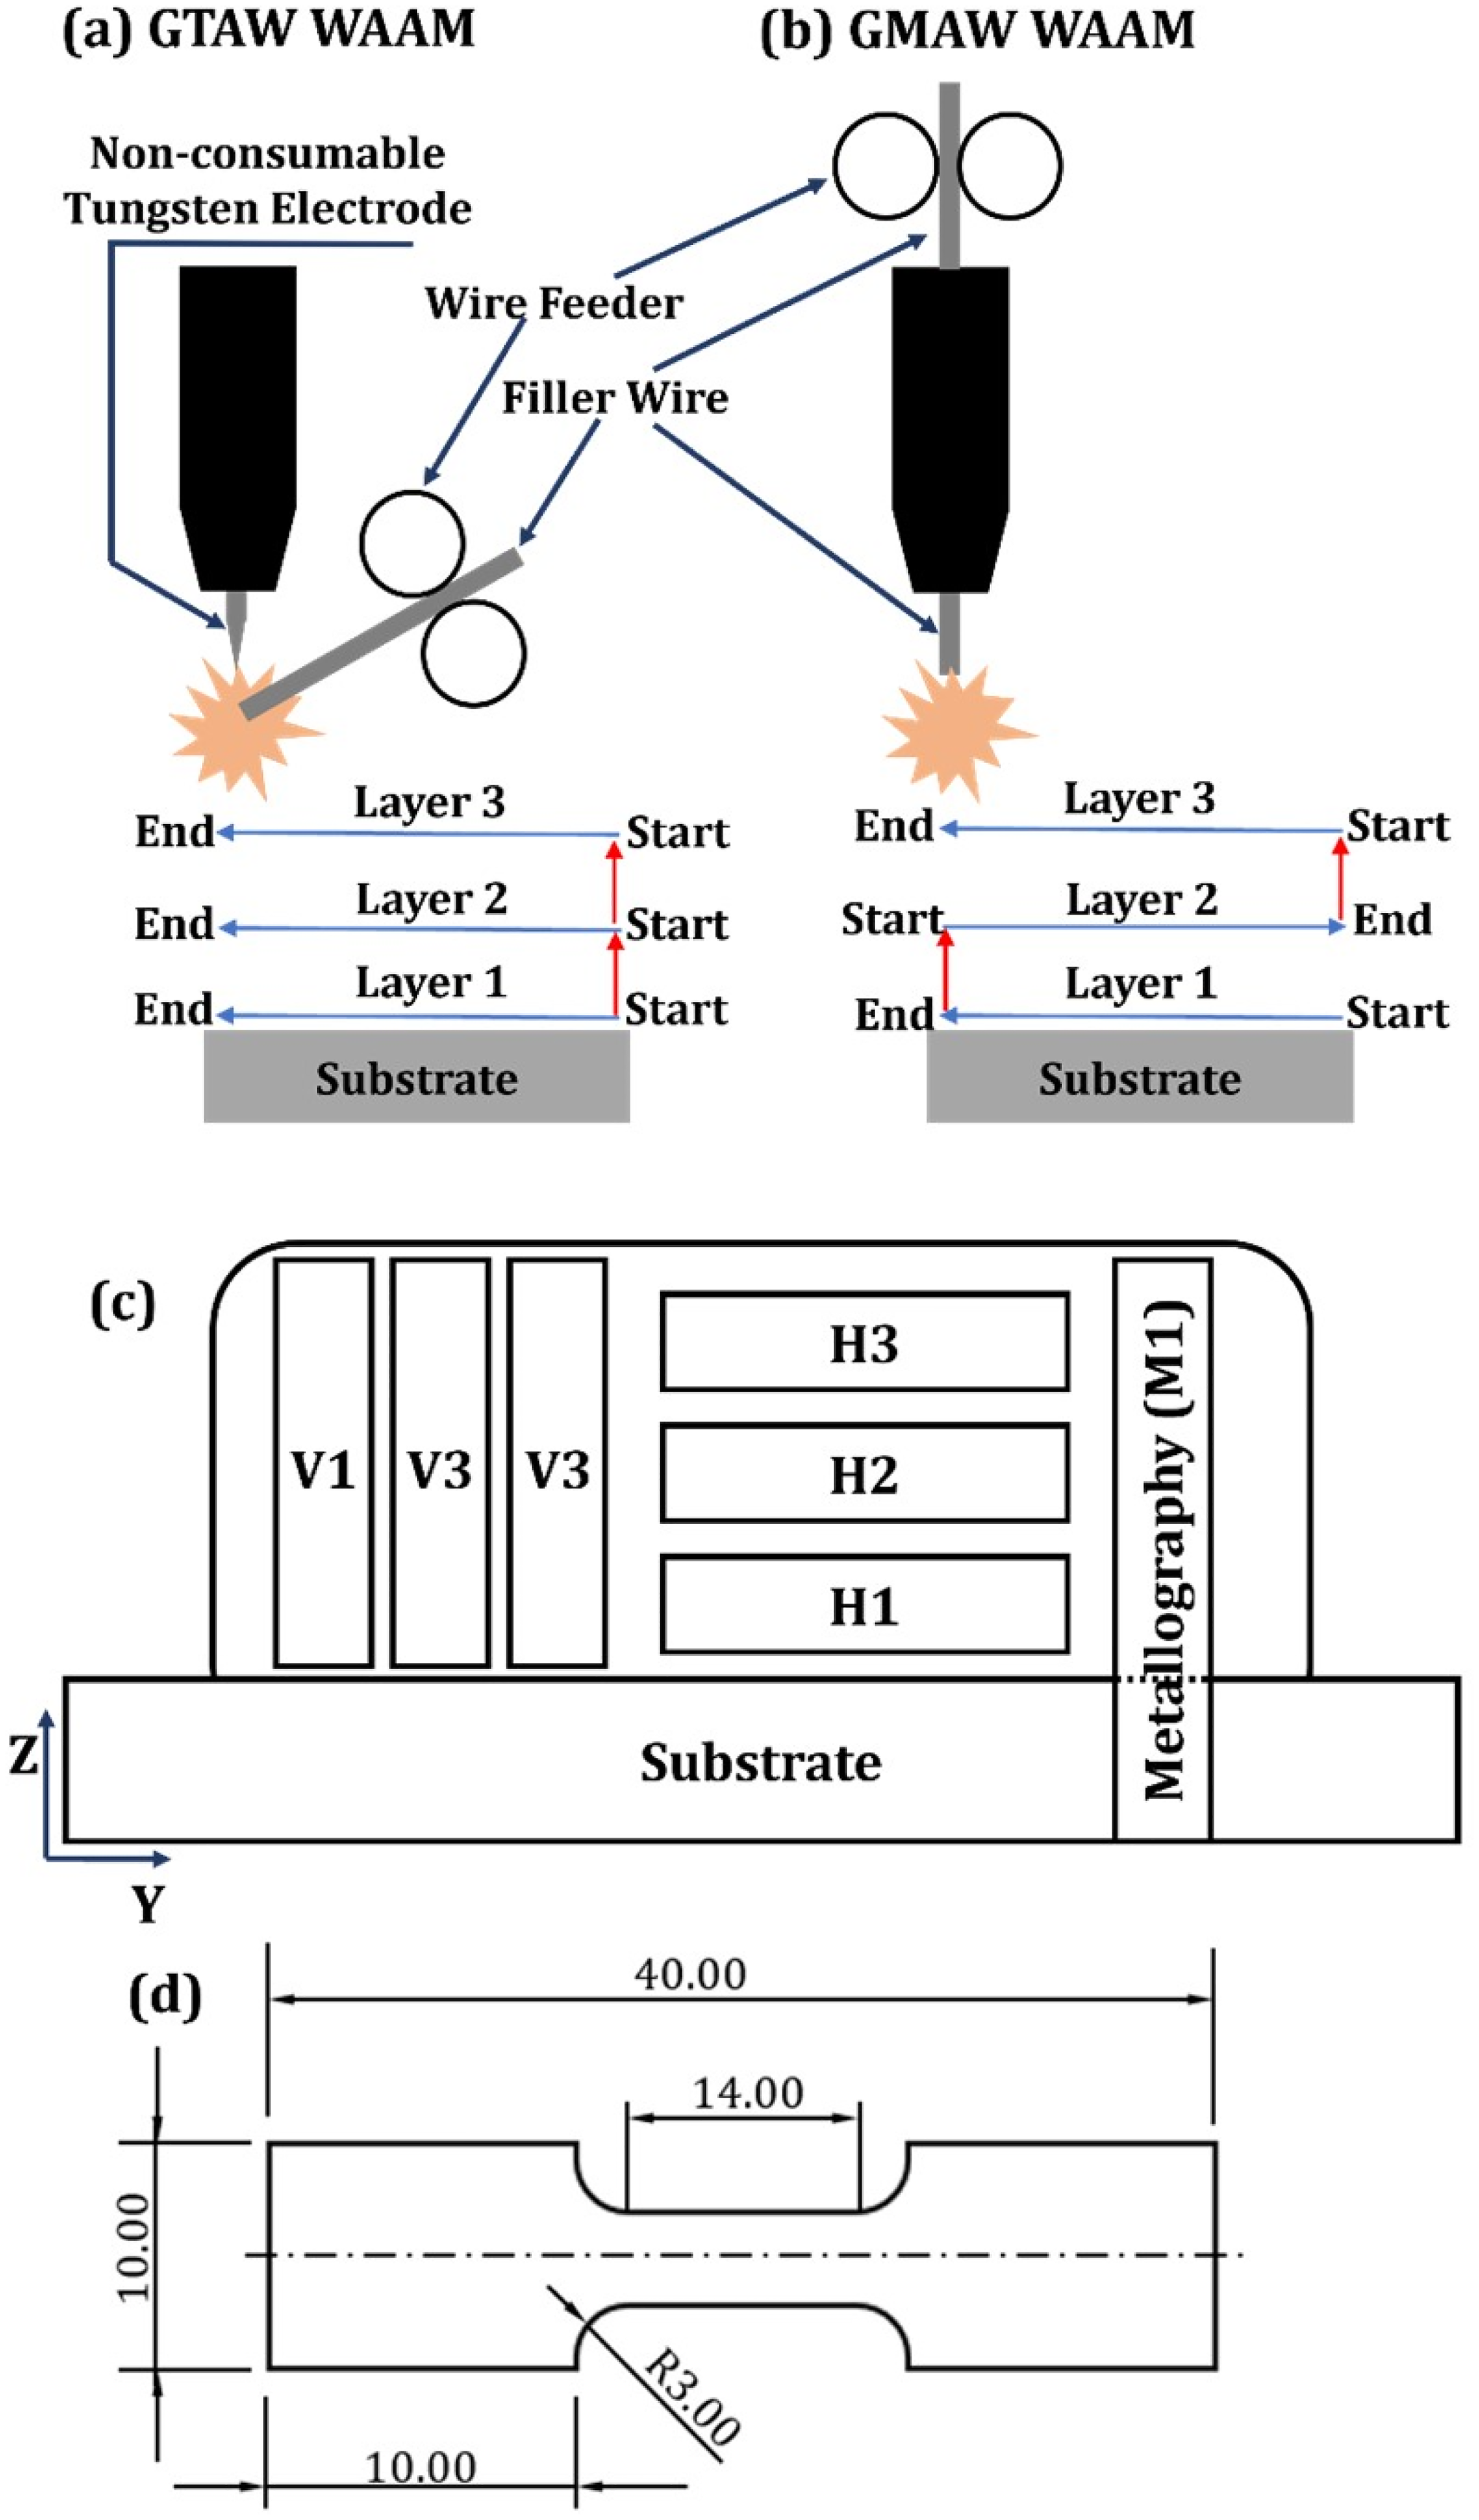
(a) and (b) Schematic representation of experimental setup showing the deposition strategies, (c) location of uniaxial tensile test specimens (V: vertical and H: horizontal), and (d) dimensions of tensile test specimen (all units are in mm). GMAW: gas metal arc welding; GTAW: gas tungsten arc welding; WAAM: wire arc additive manufacturing.
Pilot experiments for single-layer deposition were conducted using a one-factor-at-a-time (OFAT) approach to finalise the parameters for the deposition of geometrically identical layers for wall build-up. A total of 62 single layers and 4 walls are deposited using both processes and wires. Details of single-layer deposition parameters are given in S1 section of supplementary document. The criteria for parameter selection for wall deposition were established by choosing parameters that resulted in approximately the same reinforcement area during single-layer deposition experiments. The parameters for wall deposition are given in Table 2.
Parameters used for single wall deposition.
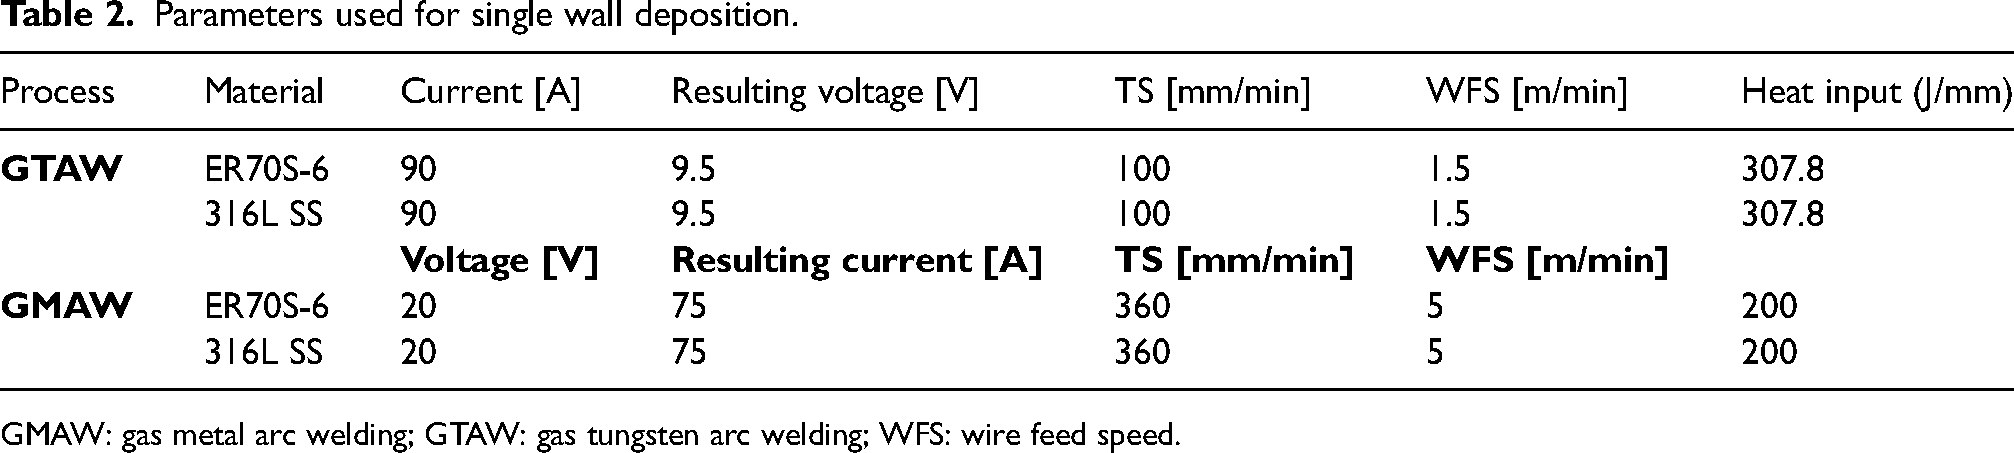
GMAW: gas metal arc welding; GTAW: gas tungsten arc welding; WFS: wire feed speed.
The deposited single-layer samples and walls were visually inspected for surface or geometric discontinuities. They were then cut, mounted in epoxy, ground, polished and etched for microscopic analysis using an Insize ISM-PM200SB digital microscope. SS samples were etched with Vilella's reagent, while low-carbon steel samples used a 2% Nital solution. SEM-EDS (ZEISS DSM 962 ESM) was employed for microstructural analysis of deposited walls. Tensile samples were extracted from the deposited wall in both vertical and horizontal orientations, with three samples each (V1, V2, V3 and H1, H2, H3) to assess mechanical anisotropy (Figure 1 (c) and (d)). In addition, microhardness testing (Mitutoyo HM-112) was performed with 5 N load, 10 s dwell time and 500 µm inter-indent spacing.
Results and discussion
Single-layer deposition
The cross-sectional micrographs of the deposited layers were captured and processed using ImageJ software to measure the cross-sectional area, that is, the area of reinforcement. The macro-images of the deposited layers are shown in Figure S2.1 and discussed in section S2 of the supplemental document. Figure 2 illustrates the variation of the reinforcement area concerning TS and WFS for both processes and filler wires. The reinforcement area exhibits a decreasing trend with increasing TS, attributed to the reduction in metal deposition rate per unit length per unit time of welding. Conversely, the reinforcement area demonstrates an increasing trend with rising WFS, as it corresponds to a greater volume of deposition per unit length per unit time. Based on the results of single-layer deposition experiments, parameters for wall deposition were finalised for both processes and fillers. The criteria for parameter selection for wall deposition were established by choosing parameters that resulted in approximately the same reinforcement area during single-layer deposition. The selected parameters for wall deposition are given in Table S2.1 of the supplemental document.
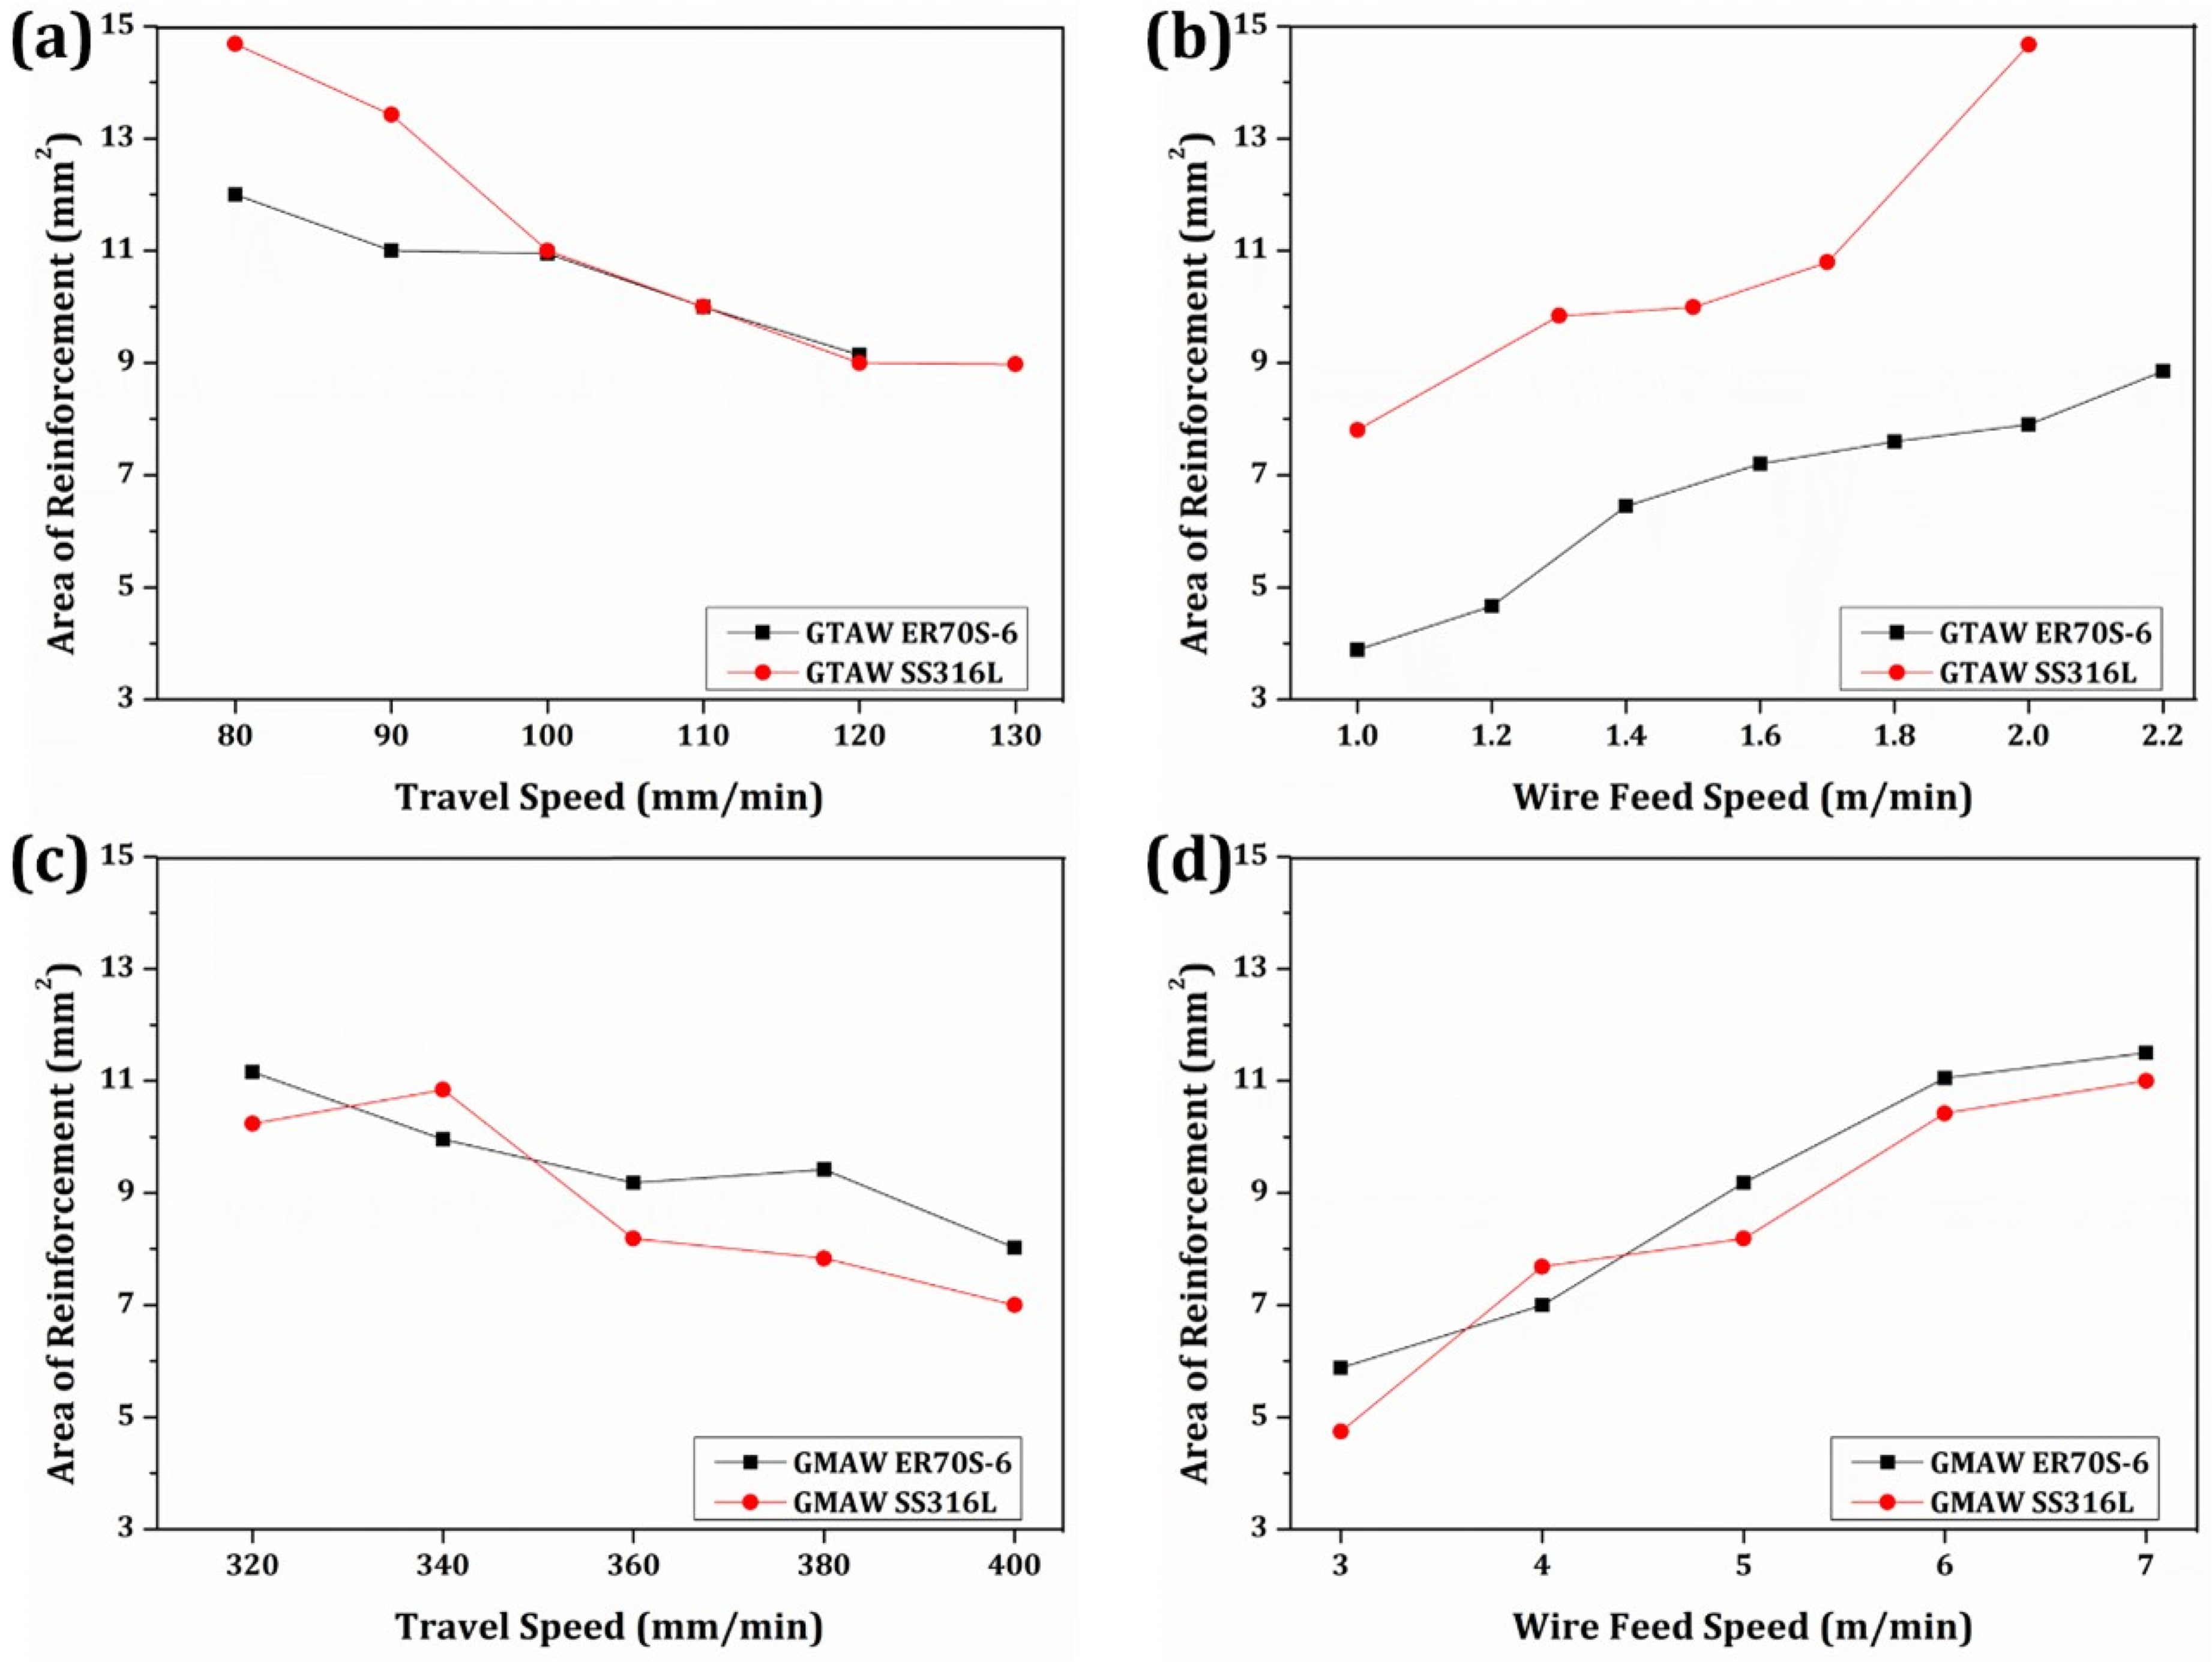
Variation of area of reinforcement with TS and WFS. GMAW: gas metal arc welding; GTAW: gas tungsten arc welding; WFS: wire feed speed.
Following the selection of parameter combinations for wall deposition from the single-layer experiments, an average approximation and rounding was done to keep them the same for both materials within each individual process (GTAW and GMAW). However, the parameters were different between the two processes, reflecting the distinct characteristics and requirements of GTAW and GMAW. Using different parameters for each material could have introduced additional uncontrolled variables, making it harder to interpret the results reliably. The final parameters adopted for wall deposition are provided in Table 2.
Single wall (multi-layer) deposition
Figure 3(a) to (d) illustrates the cross-section (front view) and side view of the deposited walls. A comparison reveals that GTAW walls appear comparatively bumpy with rough and wavy edges, whereas those deposited using GMAW exhibit smooth and uniform surfaces. This discrepancy is due to the higher heat input in GTAW (307.8 J/mm) compared to GMAW (200 J/mm) and different scanning strategy in GTAW (unidirectional) than GMAW (alternating/bidirectional), resulting in increased heat accumulation in GTAW-deposited walls at the arc extinguishment end. Despite lower process efficiency of GTAW (60%) compared to GMAW (80%), the unidirectional deposition process may have limited heat dissipation through previously deposited layers and the substrate as the wall rises. Consequently, this could lead to continuous widening of the wall towards the end (arc extinguishment location) section, owing to the increased fluidity and spreadability of the deposited molten filler material.
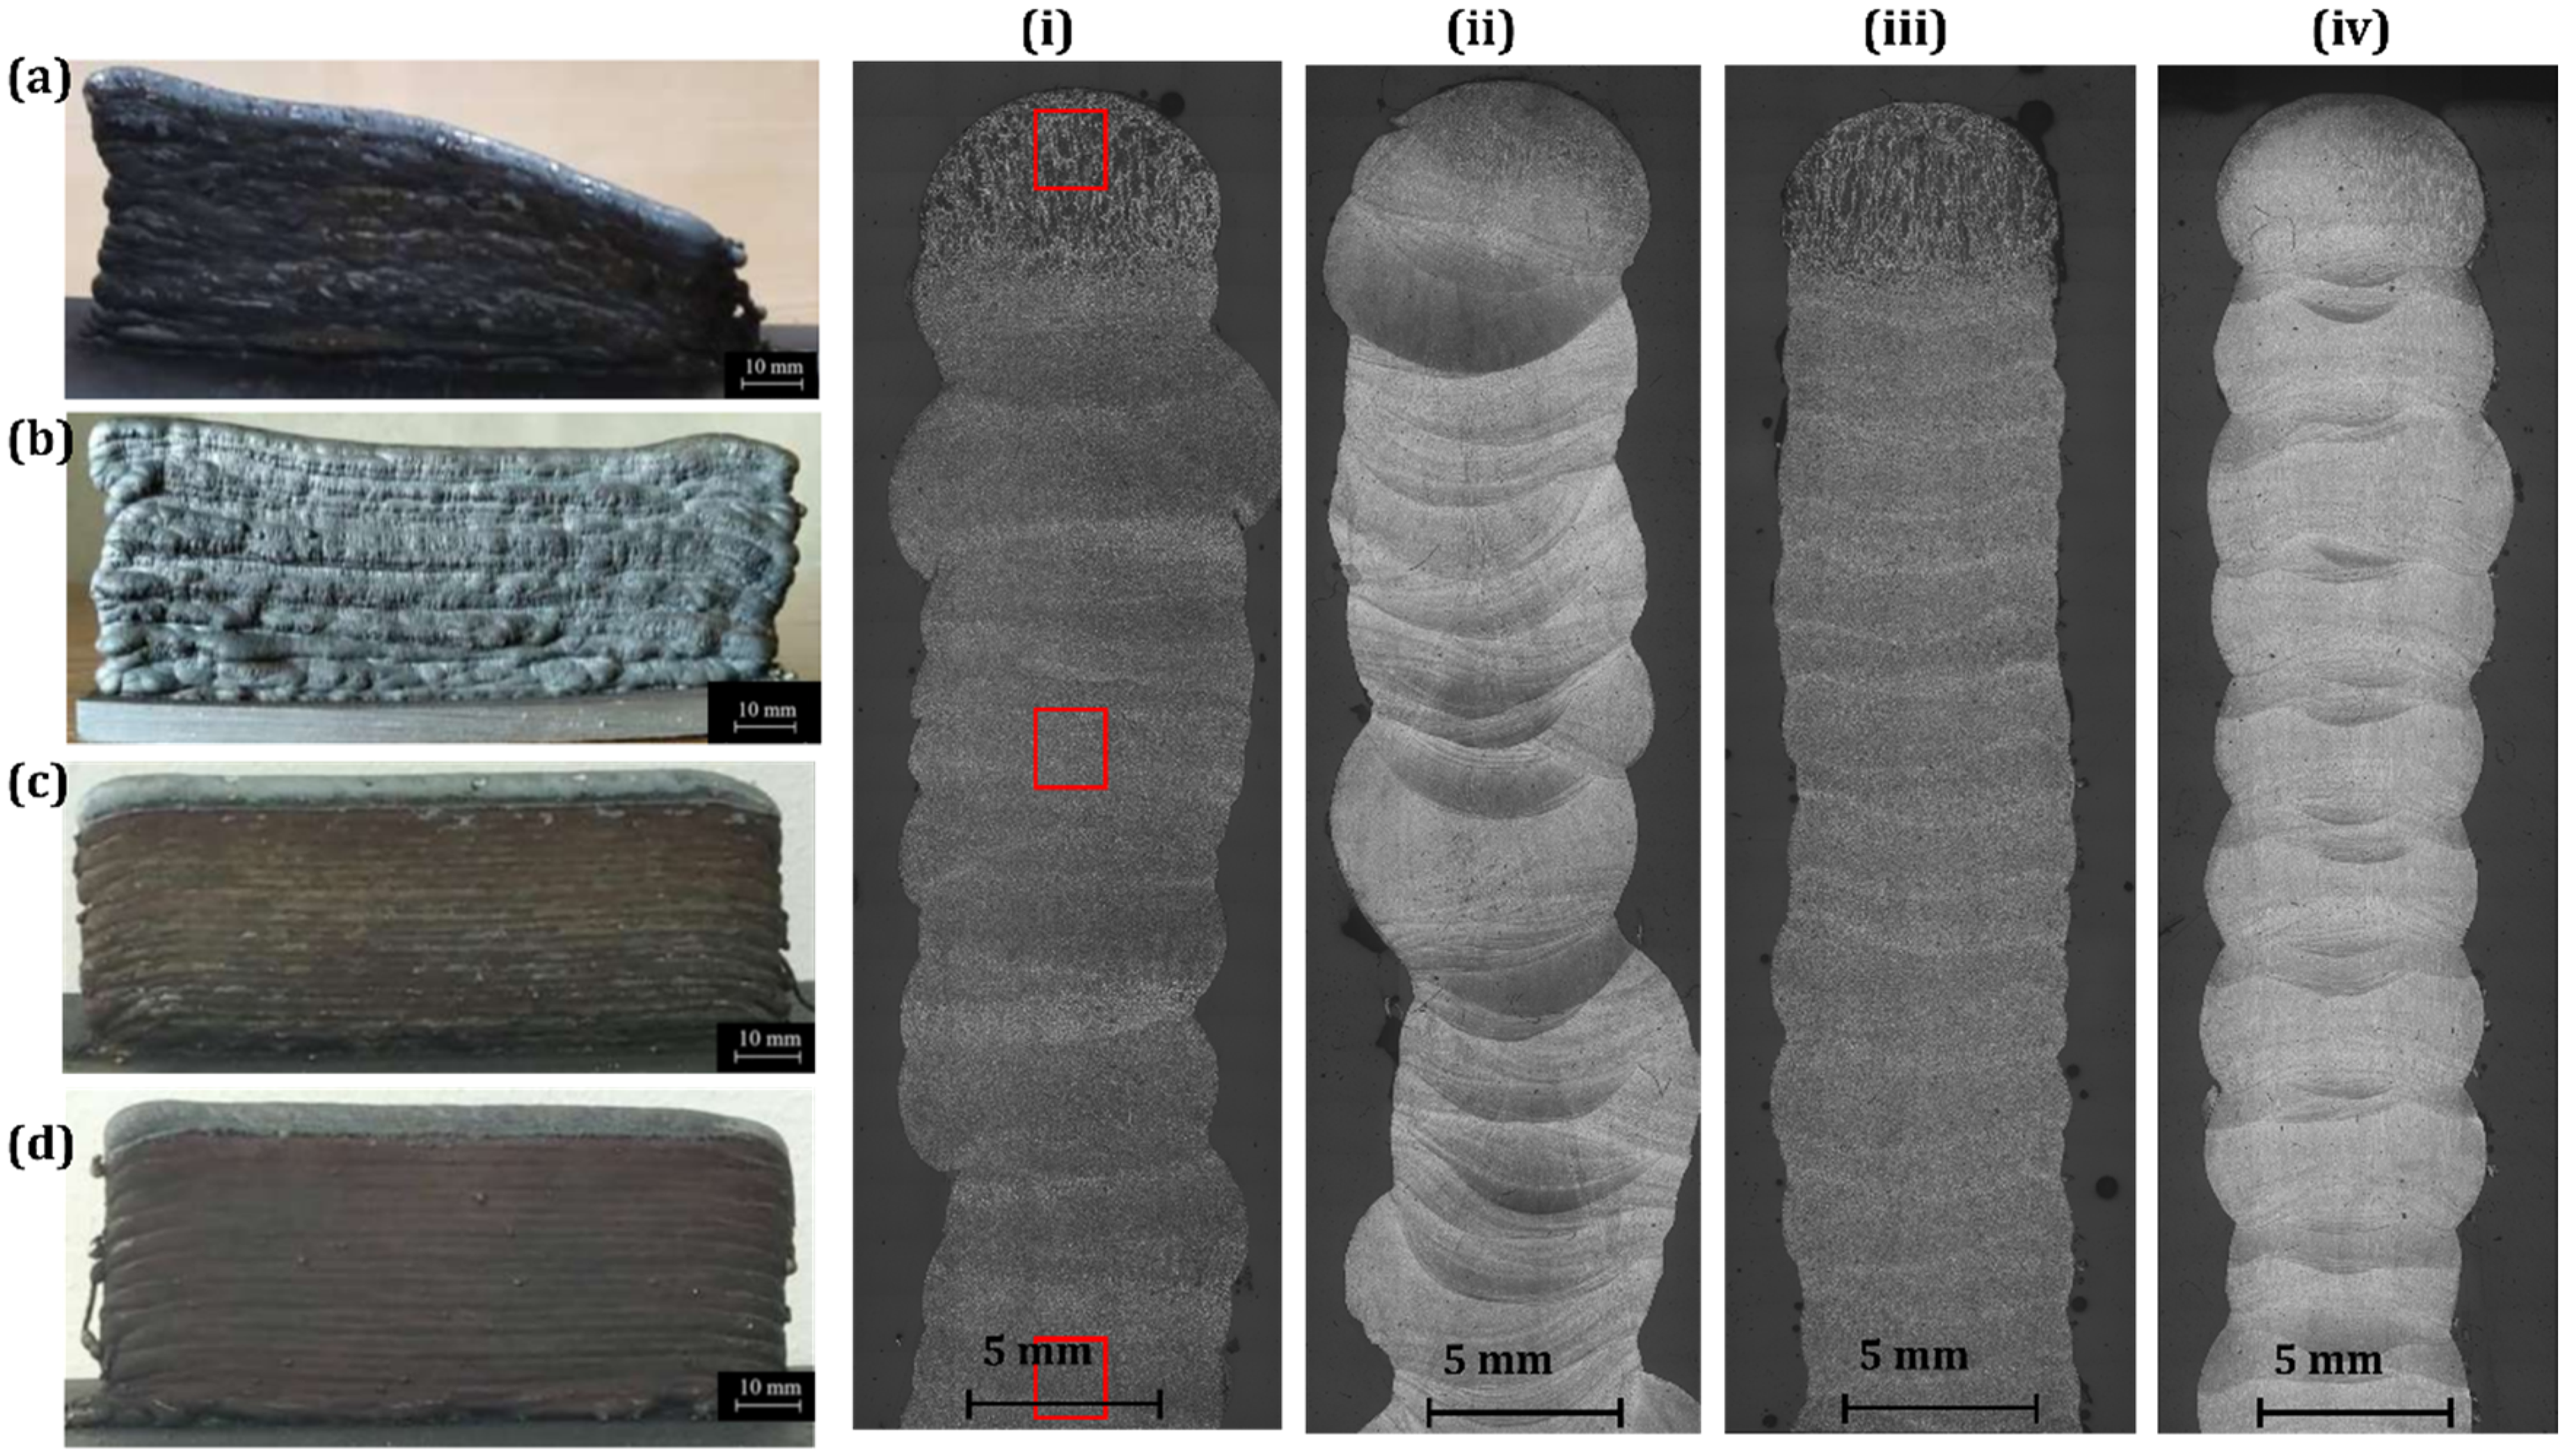
Side view and cross-sectional view of the deposited walls (a) and (i) GTAW ER70S-6, (b) and (ii) GTAW 316L SS, (c) and (iii) GMAW ER70S-6, and (d) and (iv) GMAW 316L SS. GMAW: gas metal arc welding; GTAW: gas tungsten arc welding; SS: stainless steel.
The first GTAW wall using ER70S-6 (Figure 3(a) and (i)) was deposited using a unidirectional strategy with constant parameters, resulting in a significant height difference of ∼15 mm between the arc striking and extinguishment ends due to heat accumulation. To achieve uniform height in the second GTAW wall (316L SS), the deposition strategy was modified by adjusting the TS via G-code, as the system could not alter the current alone. TS was reduced by 30% in the first quarter and increased by 25% in the last quarter to counteract height variations. These adjustments led to a smoother, more uniform wall (Figure 3(b) and (ii)), reducing the height difference by 250% to ∼6 mm.
On the other hand, employing an alternating/bidirectional deposition strategy in the GMAW process resulted in approximately uniform/horizontal walls (Figure 3(c), (d), (iii) and (iv)), with only ̴ 2 mm deviation in height at both ends. The height of GMAW wall is comparatively less at the edges than in the middle due to uneven distribution of the arc action range and shielding gas at the edges. When the torch is positioned close to the edges (with only half of the electrode pointing towards the material), the arc initiates between the consumable electrode and the adjacent/nearest metallic part (edge of the deposited wall), leading to the flow of shielding gas away from the arc at the time of arc establishment, primarily due to the sideways bending of the arc. A similar phenomenon occurs during arc extinguishment, resulting in a comparatively lower volume of shielding gas at the ends, which causes heat accumulation at these two locations, increasing the width and reducing the height. This phenomenon was also observed in the case of the GTAW process. Additionally, surface waviness was more pronounced in the GTAW process compared to GMAW due to the greater degrees of freedom in GTAW, particularly the angle between the deposition path and the externally fed filler wire, which led to larger variations in wall width. Differential thermal cycling effects resulting from the distinct deposition paths used in both processes may also contribute to the inferior surface quality of the GTAW walls. In contrast, GMAW benefits from integrated wire feeding and better process control, resulting in smoother, more uniform walls with minimal waviness. Although further process optimisation could potentially enhance the geometric quality of GTAW walls, this lies beyond the scope of the present study, which is primarily aimed at comparing GTAW and GMAW-WAAM processes under deposition conditions that produce nearly identical reinforcement areas.
Microstructure
Figure 3(i) to (iv) shows a magnified view of the cross-sections. Further higher magnification micrographs were captured at three locations (bottom, middle and top) as indicated in Figure 3(i), to investigate the microstructural inhomogeneity within the deposited walls. The micrographs are presented in Figure 4.
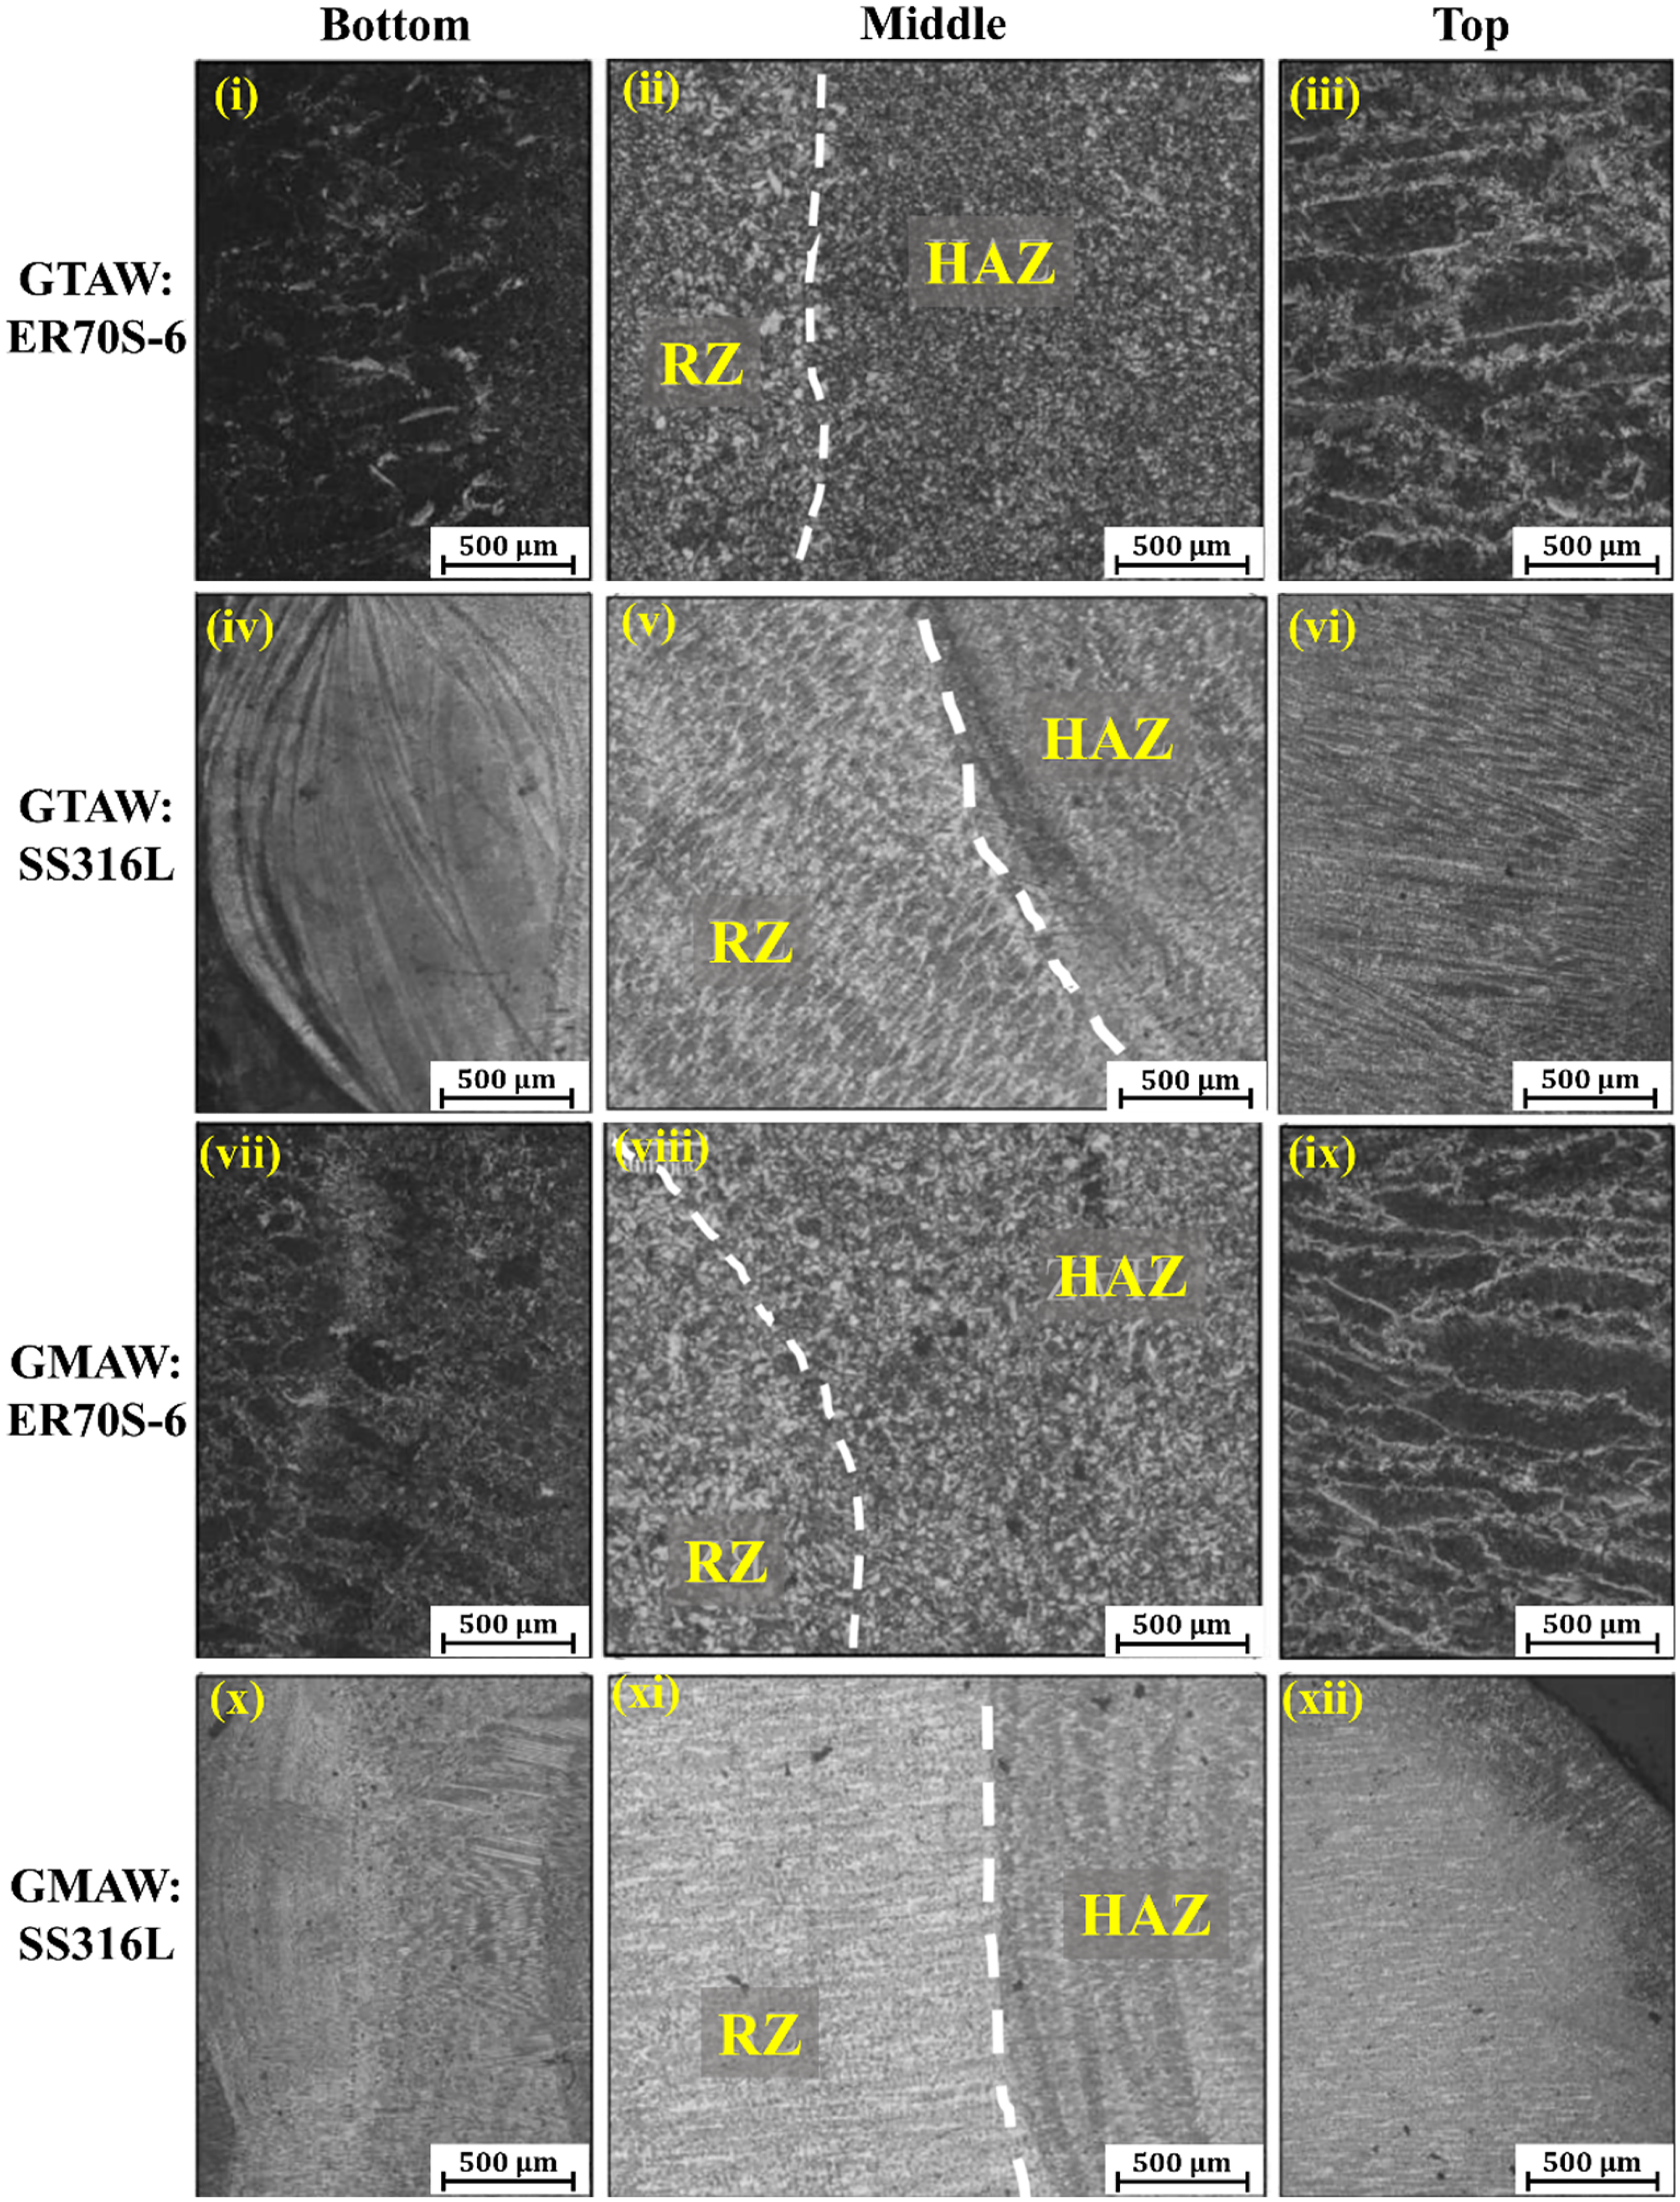
Microstructure of deposited walls at three different locations as mentioned in figure 3(i). GMAW: gas metal arc welding; GTAW: gas tungsten arc welding.
As observed in Figure 4(i) to (iii) and (vii) to (ix), the microstructure of the ER70S-6 wall consists of pearlitic/ferritic phases at the bottom, a ferritic middle zone, and a bainitic top region for both processes. Both the middle and lower regions display a mostly equiaxed microstructure Figure 4(i), (ii), (vii) and (viii), with a slight presence of columnar grains along the build direction, perpendicular to the isothermal curves and parallel to the heat flow direction. The upper region is predominantly composed of columnar grains with epitaxial growth. Additionally, the middle zone comprises two alternating subzones: a re-melted zone of a layer (RZ) and a heat-affected zone of the subsequent layer (HAZ). However, no significant differences were observed in the microstructure when comparing the two processes. In case of ER70S-6, the identical microstructural features in the walls deposited using both processes can be attributed to the consistent chemical composition of the filler material.
For 316L SS filler (Figure 4(iv) to (vi) and (x) to (xii)), the upper zone consists of more lamellar grains oriented perpendicular to the thermal curves. The middle region has two distinct zones, HAZ and RZ, similar to the ER70S-6 case. The lower region consists of a fine-grain structure with columnar growth, where heat input from the subsequent layers contributes to grain growth. The comparison between both processes for 316L SS revealed more pronounced columnar growth in the upper region of the GTAW wall, along with a more pronounced HAZ. Albannai et al. 31 observed similar columnar grains oriented in the build direction during GMAW-WAAM of austenitic SS 316L, particularly in the middle region. In the present work, the increased HAZ area in the middle region is attributed to cumulative heat build-up resulting from continuous unidirectional deposition, which limits cooling time between successive layers. As a result, the middle region experiences prolonged thermal exposure, leading to an expanded HAZ.
Microhardness and tensile testing
The microhardness measurements were conducted in the middle of the walls along the height. The results are depicted in Figure 5(a) and (b). The wall is divided into three hardness zones. The first (near the substrate) and last (near the top surface) zones show higher hardness than the middle zone due to differences in cooling rates. The first layers cool rapidly on the cold substrate, while the top layers remain unaffected by subsequent thermal cycles. The average microhardness for GTAW and GMAW using ER70S-6 filler is 154.16 and 163.52 HV, respectively, and for 316L SS filler, 171.02 and 180.98 HV. A discrepancy of ∼9.35 HV (ER70S-6) and ∼9.96 HV (316L) arises from variations in thermal cycles and heat input. These values are calculated for the middle zone, excluding the first and last zones. The higher heat input in GTAW results in coarser grains, leading to lower hardness.
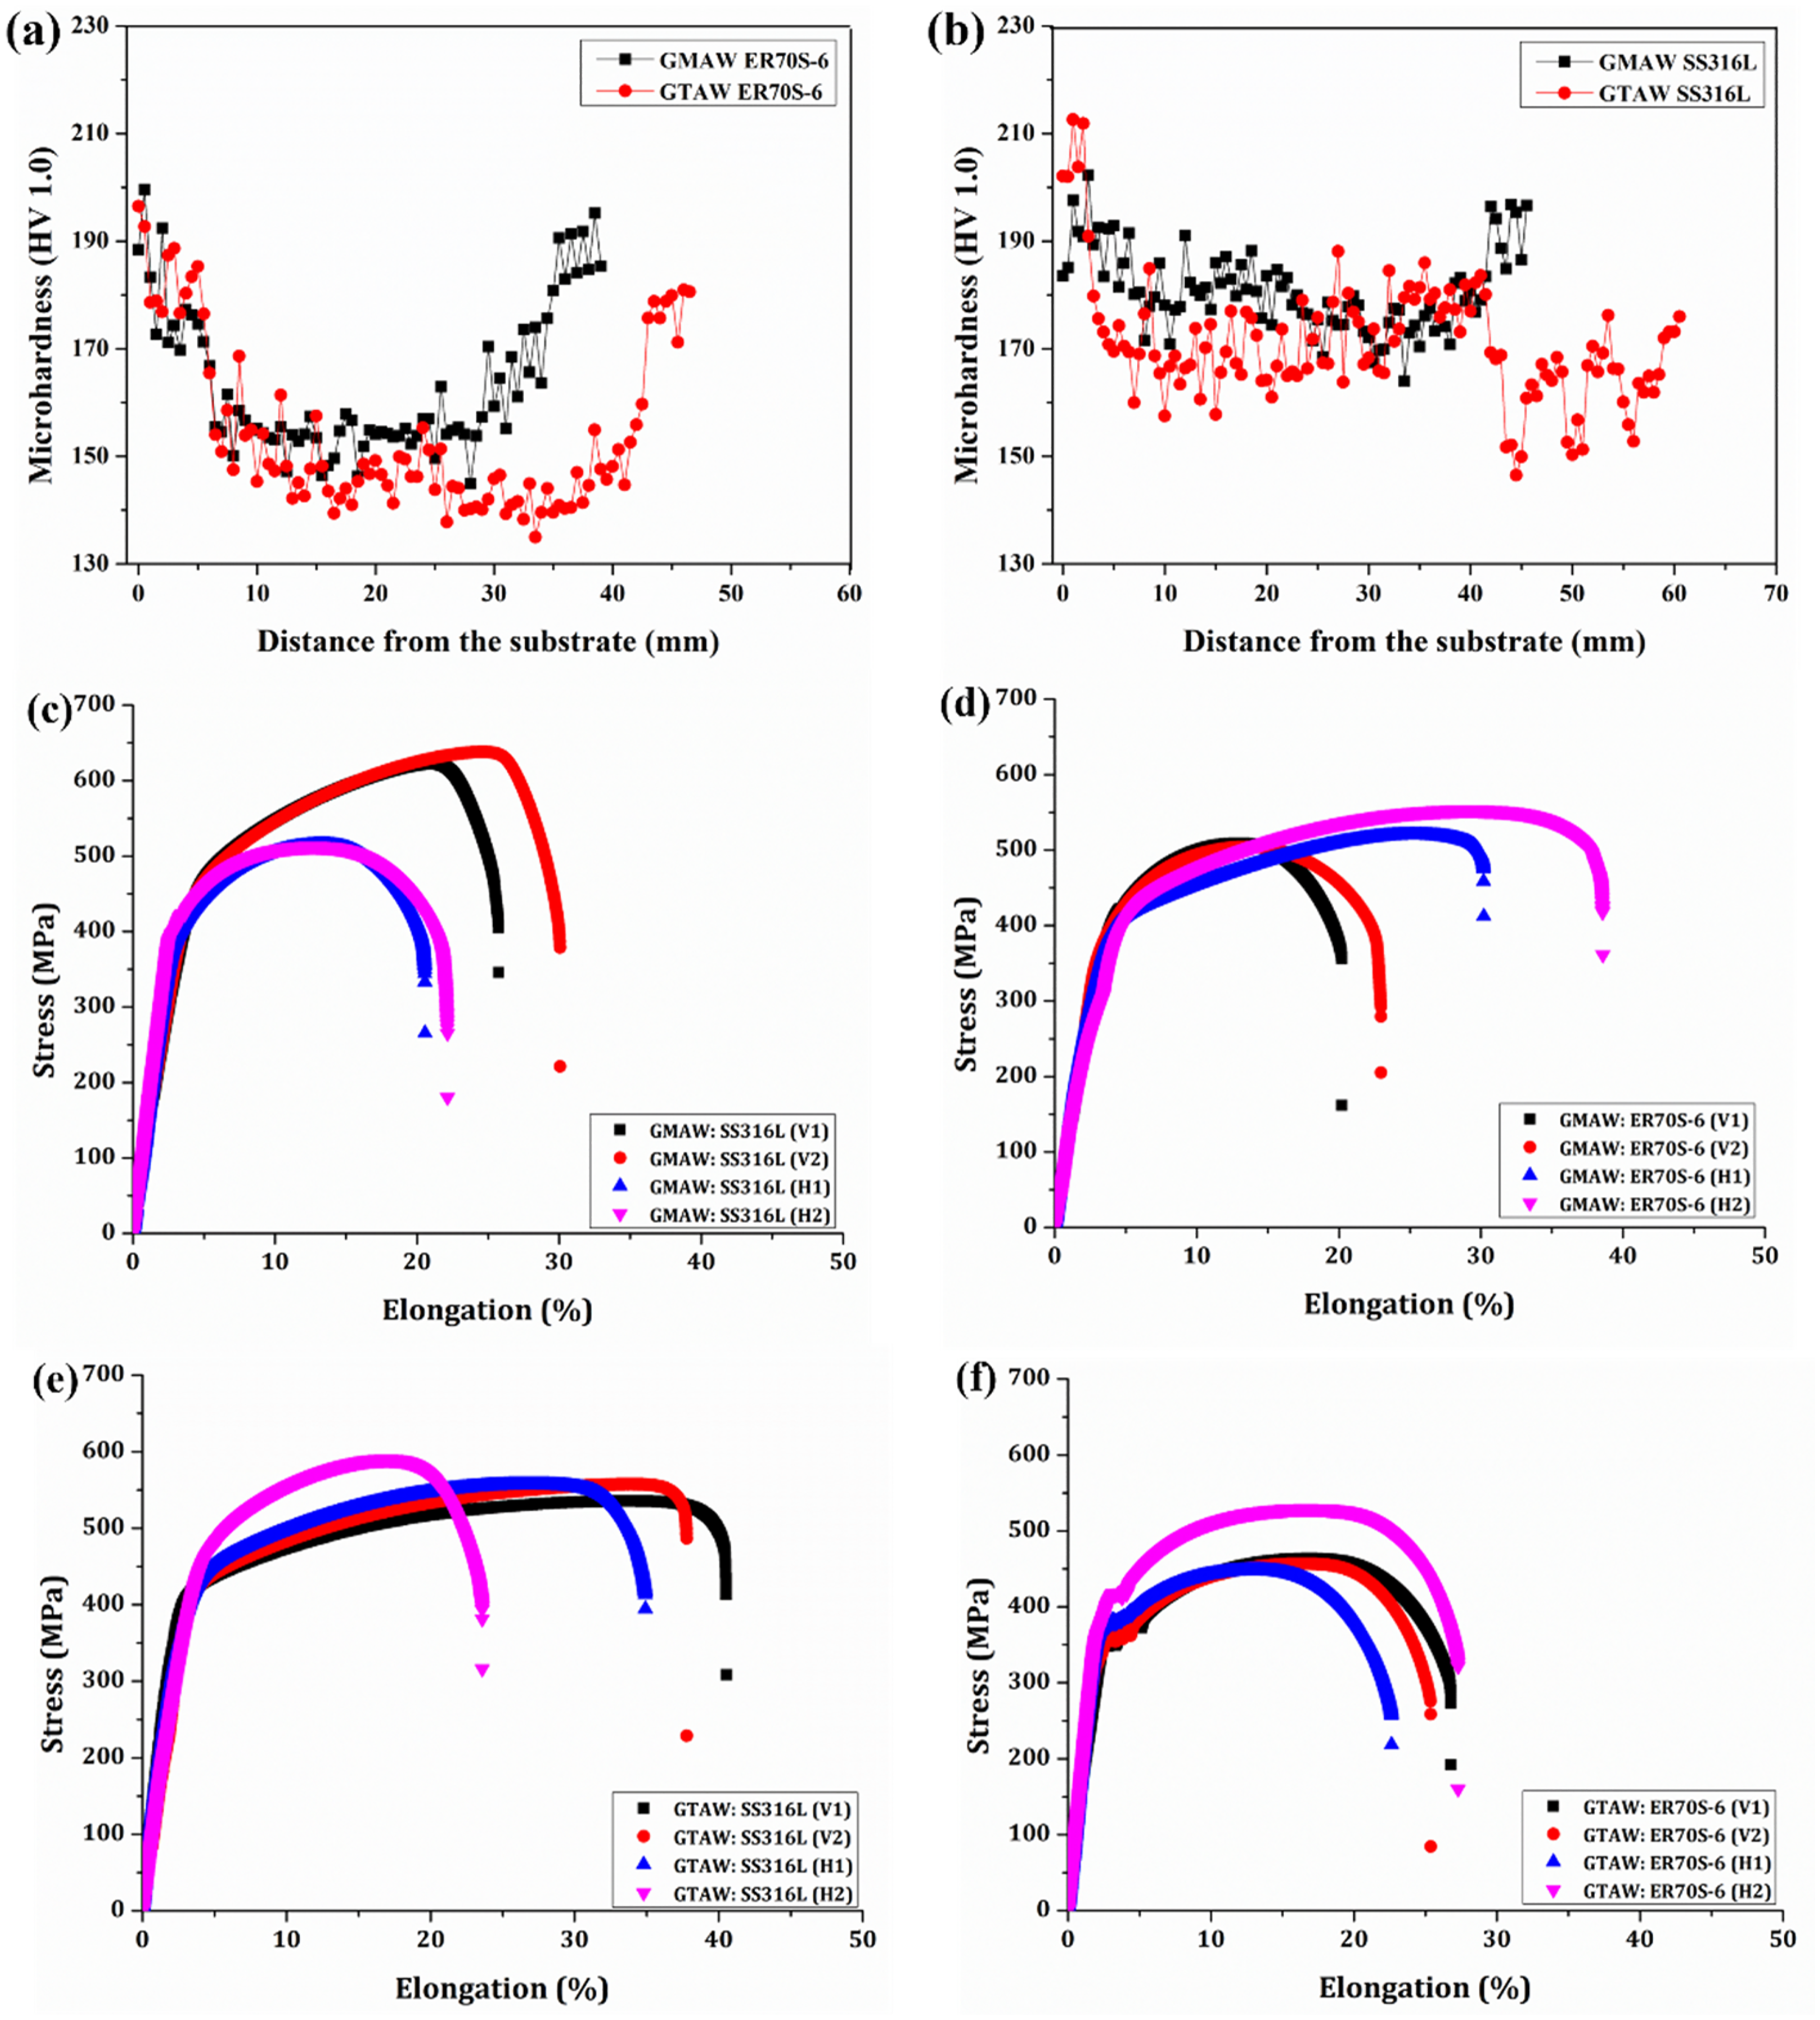
Microhardness variation and stress versus percentage of elongation curves obtained from uniaxial tensile testing (a) and (c) ER70S-6, and (b) and (d) 316L SS. GMAW: gas metal arc welding; GTAW: gas tungsten arc welding; SS: stainless steel.
Figure 5(c) to (e)) shows the stress-strain curves for both horizontal and vertical samples extracted from deposited walls. Stress-strain curves from the two most consistent samples per orientation were presented. Vertical GMAW samples deposited with 316L SS filler exhibited higher UTS and YS but lower elongation (Figure 5(c)), consistent with their higher hardness. Vertical samples showed greater repeatability, with minimal deviation up to the UTS point, while horizontal samples exhibited significant variability due to differing thermal cycles along the wall height. For vertically oriented ER70S-6 samples (Figure 5(d) and (f)), the average UTS and elongation were 483.6 ± 27 MPa and 24.5 ± 3%, with maximum values of 509.2 MPa (GMAW) and 27.5% (GTAW). For 316L SS (Figure 5(c) and (e)), the average UTS and elongation were 563.4 ± 40.5 MPa and 34.2 ± 6.7%, with maxima of 622.5 MPa (GMAW) and 41.3% (GTAW). Horizontally oriented 316L samples had lower strength and ductility (543.8 ± 37 MPa, 26.3 ± 6.5%) due to varied thermal cycles at different heights. All vertical samples failed at the centre, while horizontal samples fractured at different locations, indicating microstructural inhomogeneity and anisotropy in the walls.
In ER70S-6 walls, the presence of fine ferritic/pearlitic structure at the bottom and bainitic top region, along with equiaxed grains in the middle zone, contributed to a balance between strength and ductility. Similarly, for 316L SS walls, the columnar grain growth, especially more pronounced in GTAW samples, led to microstructural anisotropy, influencing mechanical performance. Higher hardness and strength observed in GMAW samples for both materials can be attributed to their finer grain structures resulting from faster cooling rates. In contrast, GTAW samples exhibited coarser grains due to higher heat input, resulting in slightly lower hardness and strength. Additionally, the variation in mechanical properties between vertical and horizontal samples reflected the thermal gradients and microstructural inhomogeneity across the wall height. The UTS and percentage of elongation exhibited by both ER70S-6 and 316L SS, regardless of the deposition process, are comparable to values reported in the literature.20,23,32
The fractured surfaces of vertical tensile samples were analysed using SEM to examine the morphology and fracture mode. The fractographs of both processes and fillers, as shown in Figure 6, consist of dimples, which is an outcome of plastic deformation at the boundaries of solidified grains and indicate ductile fracture. There was no evidence of trans-granular fracture in any of the samples, and all regions exhibited a homogeneous distribution of dimples. A comparative analysis of dimple size and density per square mm on the fractured surfaces of both processes using the same wire, at the same resolution, revealed larger grain sizes in GTAW-manufactured walls, which can be attributed to differences in thermal cycles. This observation aligns with the comparatively lower strength and higher elongation of GTAW 316L SS samples, as larger grains result in fewer crystallographic dislocation planes and increased elongation of individual grains and their boundaries due to their larger size and surface area. Additionally, spherical inclusions were detected within the dimples on the fractured surface of the GTAW 316L SS sample (Figure 6(i)). Although the experiments were performed using argon as an inert gas for shielding, the silicon present in the filler has a higher tendency to react with oxygen and form oxides. Therefore, it is possible that a small fraction of oxygen in the vicinity of the molten pool caused the formation of these oxide inclusions. Sohrabpoor et al. 33 reported formation of similar Si rich spherical nano-sized oxide inclusions during LPBF of 316L SS.
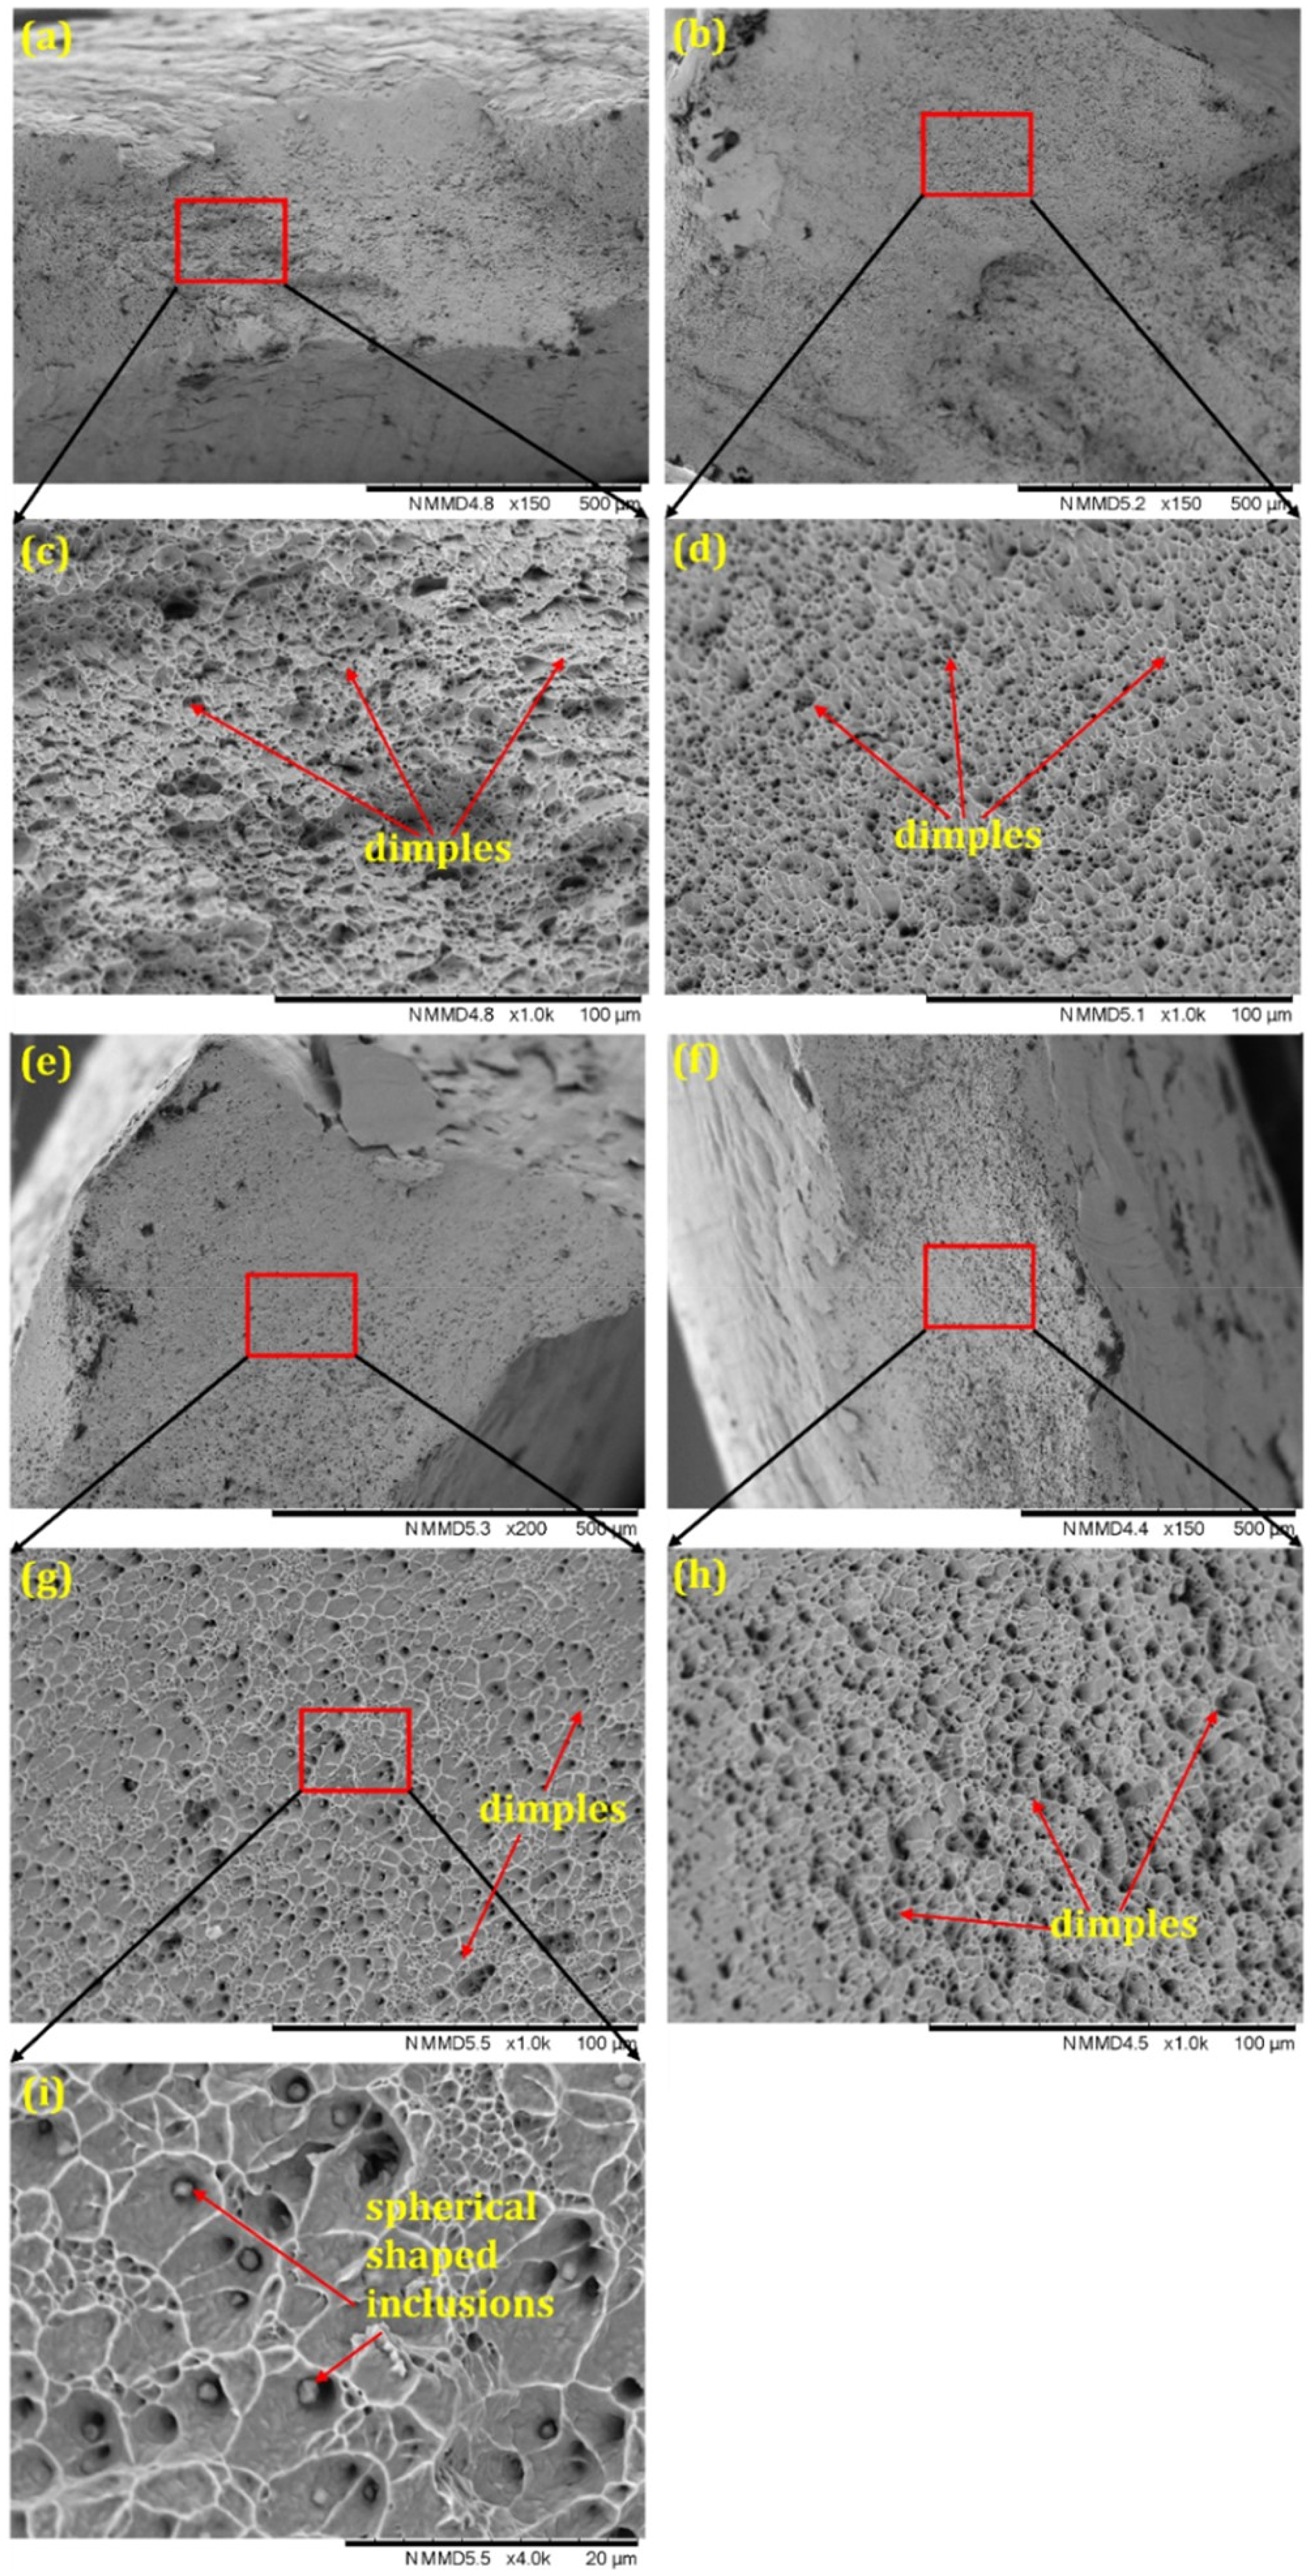
Fractured surfaces of ER70S-6 specimens: GMAW (a) (c), GTAW (b) and (d), and of 316L SS specimens: GMAW (e), (g) and (i), and GTAW (f) and (h). GMAW: gas metal arc welding; GTAW: gas tungsten arc welding; SS: stainless steel.
Conclusions
Single-layer OFAT experiments optimised parameters for GTAW and GMAW with ER70S-6 and 316L SS fillers. GMAW, particularly in synergy mode, provided better consistency with fewer defects, while GTAW struggled with wire feed alignment, leading to surface imperfections. Reinforcement area decreased with higher TS and increased with higher WFS.
GTAW walls exhibited wavy edges and height variations due to high heat input and unidirectional deposition, but process adjustments improved uniformity by 250%. GMAW walls, with bidirectional scanning and lower heat input, showed smoother, more consistent surfaces due to better process control and stable wire feeding.
ER70S-6 filler produced consistent microstructures across both processes, while 316L SS exhibited lamellar grains in the upper region and a larger HAZ in GTAW due to higher heat input. GTAW led to greater microstructural variations in 316L SS compared to ER70S-6.
ER70S-6 showed consistent hardness, while 316L SS had higher hardness and variability, particularly in GTAW due to coarser grains. GMAW-processed samples with 316L had higher tensile strength but lower elongation. Fractography confirmed ductile fracture modes, with larger grain sizes in GTAW correlating with lower strength and higher elongation.
This study provides practical guidance for optimising GTAW and GMAW, offering a comparative database that underscores the importance of process control in reducing defects and enhancing surface quality.
Footnotes
Declaration of conflicting interests
The authors declared no potential conflicts of interest with respect to the research, authorship, and/or publication of this article.
Funding
The authors disclosed receipt of the following financial support for the research, authorship, and/or publication of this article: This work was supported by the Fundação para a Ciência e a Tecnologia, (grant number LA/P/0037/2020, UIDB/00667/2020, UIDB/50025/2020 , UIDP/00667/2020, UIDP/50025/2020).
Data availability statement
The datasets analyzed during this research are available from the corresponding author to the extent possible.
Supplemental material
Supplemental material for this article is available online.
References
Supplementary Material
Please find the following supplemental material available below.
For Open Access articles published under a Creative Commons License, all supplemental material carries the same license as the article it is associated with.
For non-Open Access articles published, all supplemental material carries a non-exclusive license, and permission requests for re-use of supplemental material or any part of supplemental material shall be sent directly to the copyright owner as specified in the copyright notice associated with the article.