
Abstract
This study investigates the occurrence and mitigation of liquid metal embrittlement occurring during resistance spot welding in deep-drawn automotive components, specifically focusing on an S-Rail made from advanced high-strength steel. A simulation-based liquid metal embrittlement risk criterion based on local major component stresses was established and used to quantify and compare liquid metal embrittlement risks between different tests. Experimental and numerical analyses were conducted, revealing that springback significantly impacts liquid metal embrittlement formation. Adjustments in electrode geometry and hold time post-welding were found to mitigate liquid metal embrittlement risks. The effects of stack-up configuration and related parameter settings on liquid metal embrittlement occurrence were identified and liquid metal embrittlement was effectively prevented across both stack-up configurations. These findings advance the understanding of liquid metal embrittlement mechanisms and provide practical approaches to enhance the spot weld quality in AHSS-based body-in-whites.
Keywords
Introduction
The automotive industry relies on consistent implementation of lightweight construction concepts to enhance crashworthiness while simultaneously reducing greenhouse gas emissions. 1 Advanced high-strength steels (AHSS) effectively support this strategy because their superior combination of elongation and tensile strength enables a reduction in body-in-white mass by reducing the sheet thicknesses. 2 Resistance spot welding (RSW) is most frequently utilised to join these steels during production. 3 During RSW, cracks may form due to liquid metal embrittlement (LME), which occurs when the zinc coating, intended for corrosion protection, melts and diffuses into the steel substrate. 4 Understanding the causes and influencing factors that lead to the formation of cracks is desirable, especially at the production-scale, to avoid potential quality issues due to cracking.
The temperature range in which LME occurs is referred to as the ductility trough. The lower end of the ductility trough for a DP1000 HD was determined to be 700 °C through hot tensile tests by Bhattacharya et al. 5 This lower end may be associated with high zinc availability, as predicted by the Zn–Fe binary-phase diagram, which indicates the melting point of intermetallic Zn–Fe phases at around 782 °C. 6 Wintjes et al. 7 utilise the elemental zinc melting temperature, that is, 420 °C, to locate the start of the LME region.
In the context of the RSW process, the type of material combination appears to fundamentally influence crack formation. Several studies indicate that dissimilar combinations, particularly those with higher sheet thickness or welding more than two sheets, exhibit increased LME susceptibility.7–9 This phenomenon is attributed to two effects: first, as the total sheet thickness increases, a greater amount of energy must be introduced into the joint to form a sufficiently large weld nugget. Second, in dissimilar combinations, nugget formation shifts toward the AHSS joining partner due to its higher resistivity. Both effects contribute to increased thermal loading on the AHSS, which several studies have linked to heightened crack formation.10,11 The weld current is the main factor driving the heat input, promoting cracking close to 12 or beyond the expulsion limit. 13 In addition, the use of excessive weld times further increases the heat input, leading to increased availability of liquid zinc and thus favouring the formation of LME cracks. 14 Several studies focus on process optimisation for LME mitigation and recommend using larger tip face diameter electrode caps,15–17 pulse schedules 18 and longer hold times after welding. 19
The inaccessibility of the weld zone in RSW makes it challenging to observe the occurrence of LME cracks directly. Given that LME crack formation depends on temperature, stress, and strain conditions, finite element (FE) simulation of the welding process has become a commonly employed approach for predicting and evaluating LME occurrence. Previous studies utilised FE simulation to analyse and compare welding processes based on the calculated stress development over time20,21 and correlate their results with experimentally observed crack quantity. Recent work by Okigami et al. 22 used local stress in relation to temperature-dependent material strength as an indicator for LME formation and tested their criterion against experimentally observed LME.
Given that most current studies are based on laboratory flat specimens and, therefore, overlook the manufacturing history of actual components, particularly the deep-drawing process, this research advances the understanding of LME occurrence and prevention by investigating a deep-drawn component. The component is a so-called S-Rail, formed from an AHSS and afflicted with springback and plastification-zones from manufacturing. Stack-ups with similar and dissimilar joining partners are investigated and the applicability of common LME avoidance methods is evaluated. In addition to the experimental investigations, numerical simulations are used to assess the crack risk based on local stresses and temperatures.
Materials and methods
Materials
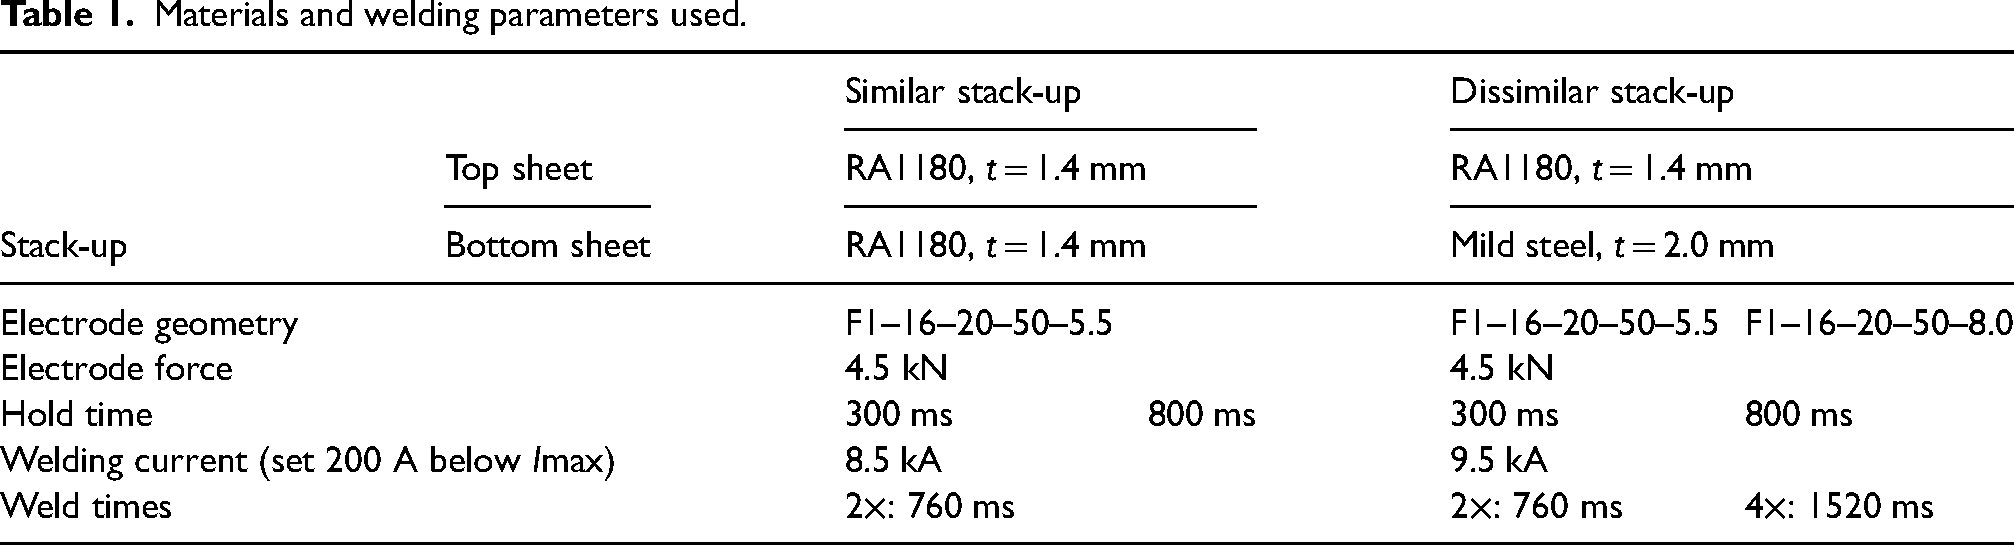
An electro-galvanized (EG) retained austenite (RA) steel of the strength class 1180 MPa (hereinafter called RA1180) is used as the third-generation AHSS material for the experiments. It has a yield strength of 890 MPa, an ultimate tensile strength of 1230 MPa and a sheet thickness of 1.4 mm. The RA1180 is joined with a hot-dip galvanized (HDG) 2.00-mm thick mild steel (hereinafter called mild steel) with a yield strength of 155 MPa and an ultimate tensile strength of 280 MPa. Based on these materials, a two-sheet stack-up is formed consisting of the RA1180 as the top sheet and using the mild steel for the base sheet (Table 1) for the ‘dissimilar’ welding and a stack-up using the RA1180 both as the top sheet and base sheet for ‘similar’ welding setup.
Materials and welding parameters used.
The top sheet is formed into the shape of an S-Rail by a single-stroke deep drawing process with the resulting geometry shown in Figure 1. The flanges were not further optimised to create a maximum amount of springback, amounting to an average angle of ∼16°.
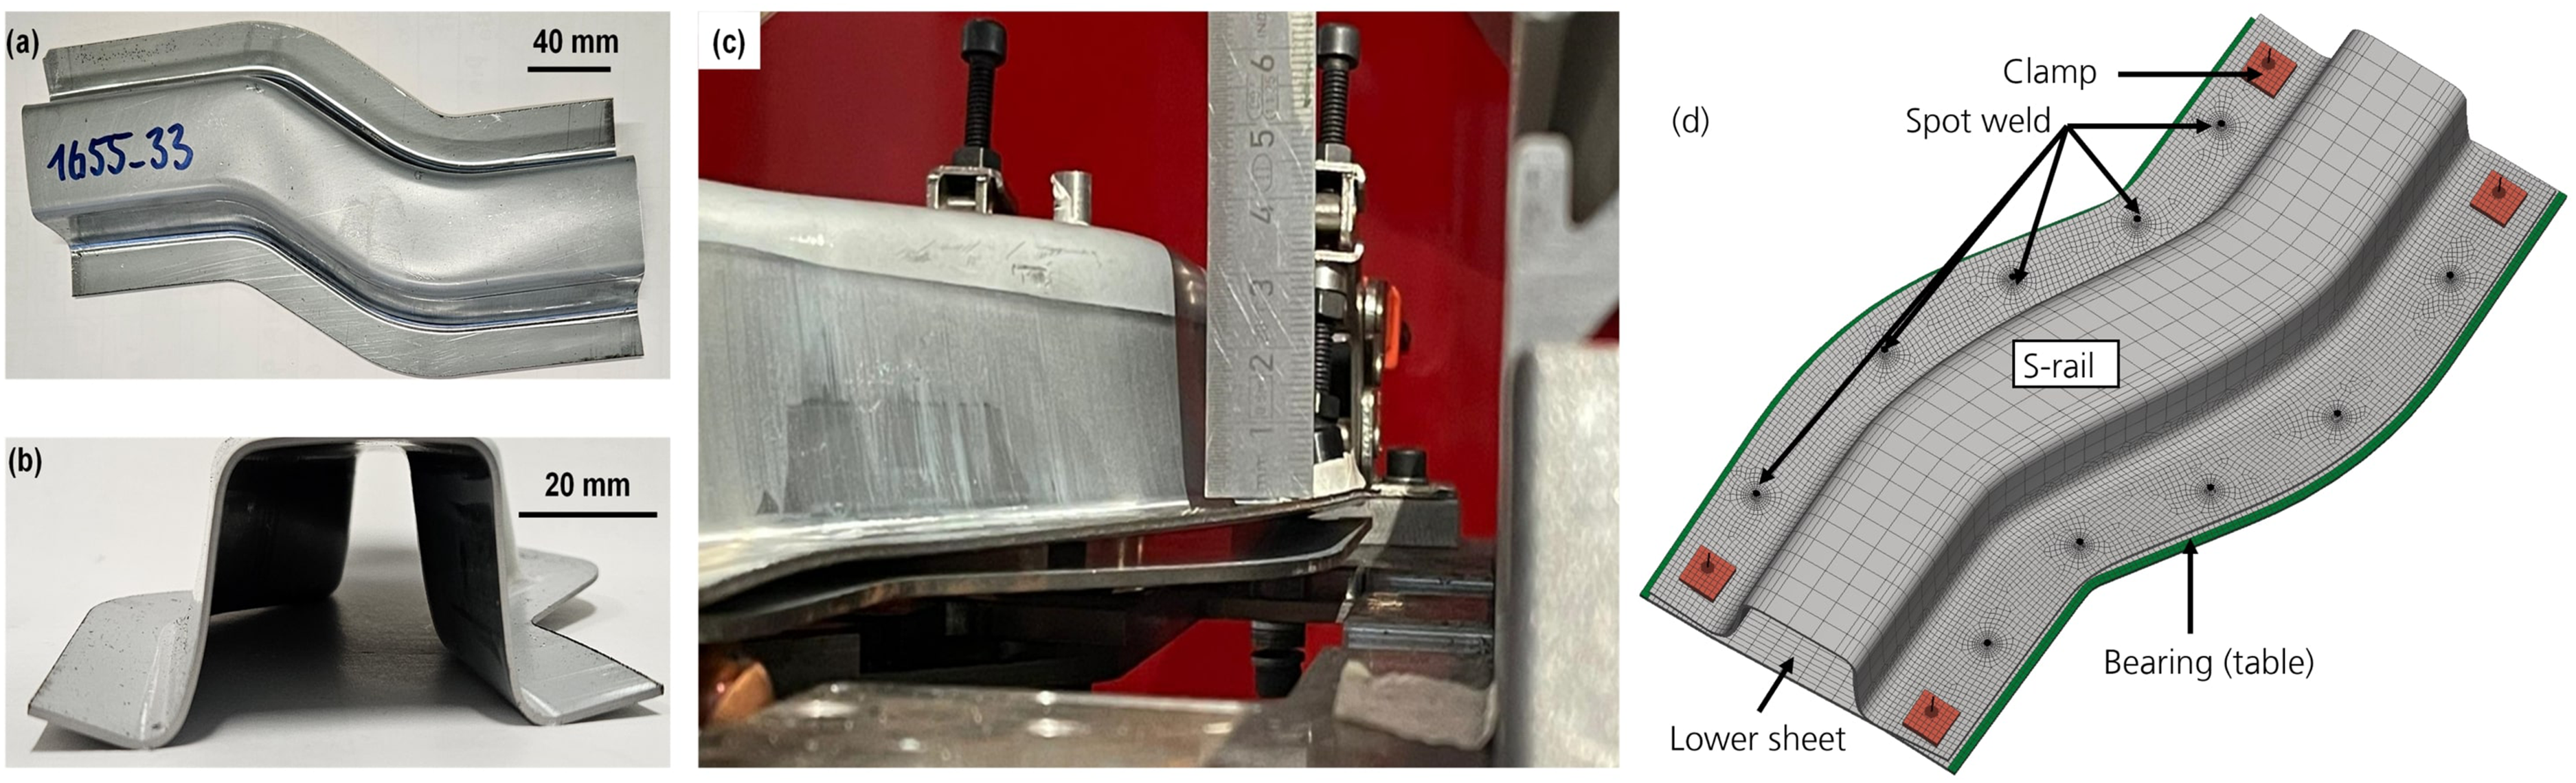
(a, b) Top and side view of stamped S-Rail, (c) clamped S-Rail with visible springback, and (d) simulation model based on the experimental procedure.
Welding equipment and experimental design
The RSW was conducted using a servo-electric pedestal C-type welding gun with a 1000 Hz medium frequency direct current (MF-DC). An external weld process recorder, along with various sensors, documented the history of current, voltage, force, and displacement during the welding processes. The electrodes were water-cooled at a rate of 4 L/min. Electrode caps of type F1–16–20–50–5.5, as specified in ISO 5821, were utilised. 23 The experimental design, shown in Table 1, was based on welding conditions typically associated with LME formation, such as prolonged weld times of 760 and 1520 ms. 24
Throughout all trials, an electrode force of 4.5 kN, along with a squeeze time of 300 ms and a hold time of 300 or 800 ms, was applied. The minimum (Imin) and maximum (Imax) spatter-free weld currents were determined based on common industry standards. 25 To ensure spatter-free welds, the weld current used was set to 200 A below Imax to 8.5 kA and 9.5 kA, respectively. Investigations for weldability according to DIN EN ISO 14327:2004-06 were conducted on 45 × 45 mm² specimens, with 10 repetitions per current level. To confirm LME as the cause of crack formation, reference welds were performed on dezinced sheets under identical conditions 19 by removing the zinc with 20% hydrochloric acid. All reference welds were completely free of cracks, indicating that LME is the underlying cracking mechanism.
For S-Rail investigations, the samples were clamped onto a robot-mounted table by two clamps per side (Figure 1(c) and (d)). Five-spot welds were carried out with the same static weld gun as for the coupon tests. Welding was performed on each side starting at one clamp and moving equidistantly to the other clamp before turning the sample and welding the other side. A total of three S-Rail samples were welded for statistical analysis with similar and dissimilar material thickness combinations, respectively. After welding, the sample was unclamped. To verify cracks, the zinc coating was removed around each spot weld using 20% hydrochloric acid. Visual inspections and photographic documentation were conducted. The specimens were cross-sectioned through the middle region of the observed cracks based on surface crack appearance. If no cracks were visible on the surface, the direction was chosen to match that of samples showing cracks. An analysis of the accumulated visible surface crack length was performed using image editing software (ImageJ) to quantify the intensity of cracking within the specimens. Only cracks outside of the welding indentation but in the heat-affected zone, corresponding to Type C according to Murugan et al. 26 were counted towards this analysis.
To study the influence of springback without changing the stamped component itself, an experimental setup using additional clamps was devised and is shown in Figure 2. Using clamping around the spot weld location, the flange was bent down to lie flat on the joining partner. The clamps were kept during welding and directed the forces arising from springback away from the RSW process. All 10 welds were conducted as before with the additional clamping and the test was repeated 3 times.
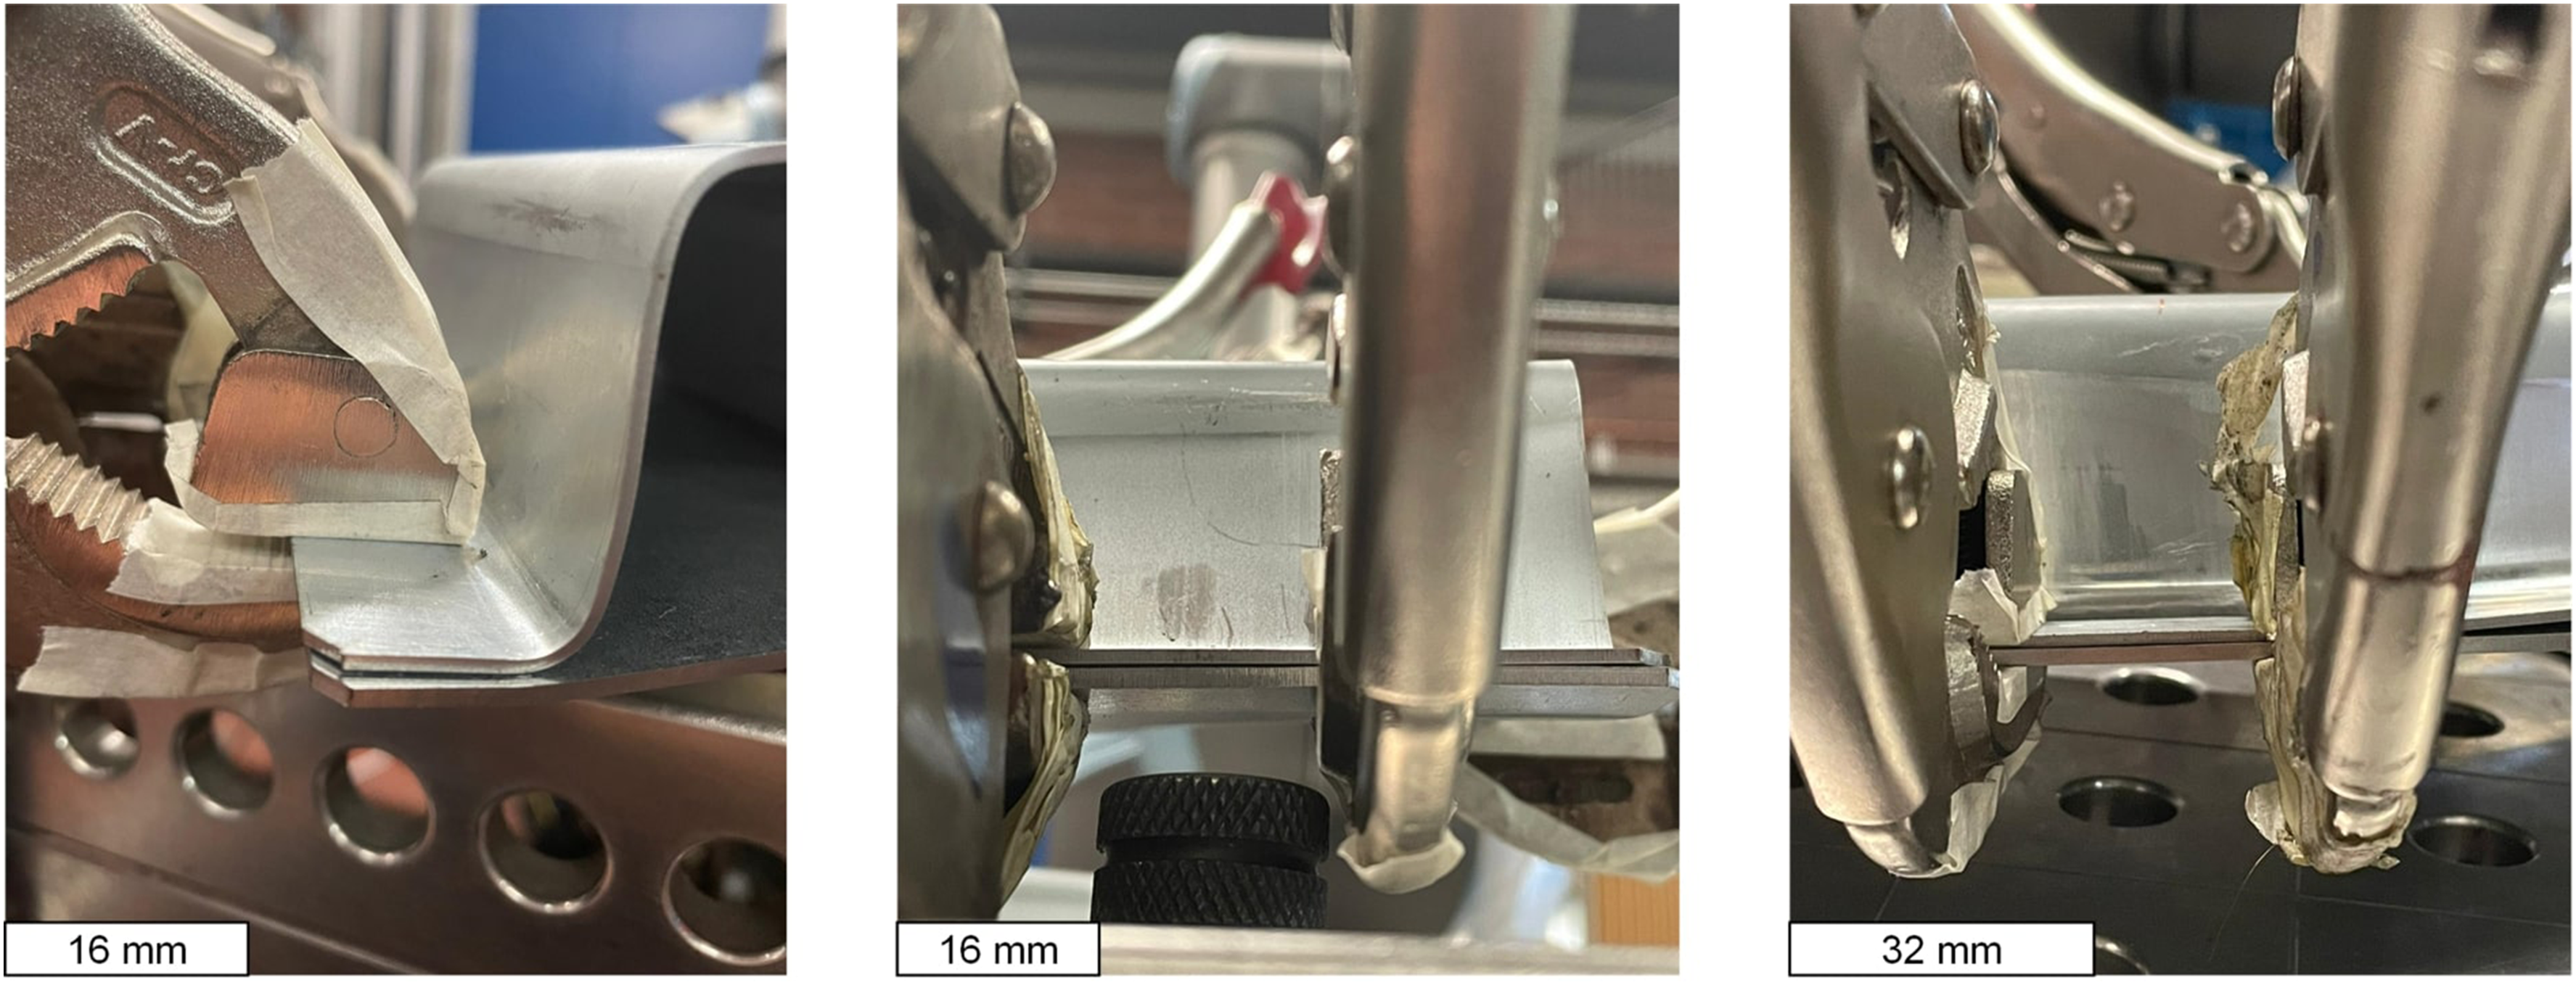
Clamping procedure to test a springback-free geometry. From left to right: front view, side view for the first spot and side view at the radius of the S-Rail.
Two parameters were changed to investigate the avoidance of LME cracks, that is, extending the hold time from 300 to 800 ms and utilising electrodes with an increased tip face area. The tip face diameters were increased from 5.5 to 8 mm while keeping the same shaft length and size.
Simulation method
The commercial FE simulation software Simufact Welding 2022 was utilised for the numerical simulations of the resistance spot welding process. The three-dimensional (3D) electro-thermomechanical model was validated against experimental temperature measurements and metallographic cross-sections in a previous publication. 27 To adjust the model for the welds in this publication, the material properties determined by Prabitz et al. 28 were utilised together with the contact resistance determined for the stack-up at room temperature according to the DVS 2929 29 guideline, determining resistances as 33 µΩ for the electrode/RA1180 contact, 6 µΩ between the sheets and 14 µΩ for the electrode/mild steel contact. With the material and contact resistance input data, the experimental welding parameters were input into the simulation model with the parameters from Table 1.
The S-Rail simulation model was developed based on 3D scans of the as-delivered S-Rail components using a patterned-light 3D scanner (GOM ATOS). The resulting file was cleaned and transferred to a FE mesher (MSC APEX). The model is shown in Figure 1(d). Following the previous studies, the joining areas were meshed using hexahedral elements in a circular pattern to account for the axis-symmetrical nature of the RSW process. Other areas of the component were meshed with progressively larger elements as they moved away from the weld zones. Two elements were used over the thickness of the part, with two additional local refinement steps in a diameter of 6 mm around the weld zones, resulting in a total of eight elements over the thickness in the weld areas. In total, 17,628 elements were used for the S-Rail and 11,894 elements for the base plate before refinement.
For temporal resolution, a constant time-stepping of 9 ms was chosen for both the welding and cooling periods. Figure 1(d) shows the assembled simulation model before calculations commenced. The bottom sheet was supported using bearings in the central areas and at the edges to simulate the experimental clamping device. Clamps were positioned at the four edges of the S-Rail, assigned a clamping force of 2 kN and a stiffness of 1 kN/mm. The clamps were deactivated 5 s after the last weld to capture residual deformations and stresses. Numerically, two different models are investigated: the so-called “Actual geometry” is based on the 3D-scanned deep-drawn component. The “Idealized CAD” geometry utilises the same base scan data but the flanges are straightened to a 0° springback angle by projecting them onto a z-parallel plane. The S-Rail model was calculated on a workstation equipped with an Intel XEON 2295 CPU and 64 GB RAM, taking 93.1 h.
LME crack risk was evaluated according to a modified method published by Okigami et al.
22
and described in equation (1). In their work, Okigami used the peak value of the maximum principal stress divided by the temperature-dependent yield stress to simulate crack growth. In this work, this value was integrated over the weld time, in the ranges where temperature exceeded zinc melting temperature, to evaluate a location-specific, accumulated crack risk. Both the behaviour over time before integration and the integrated LME risk are used throughout this work.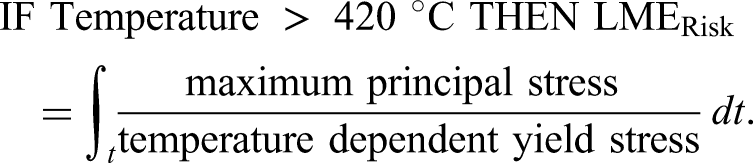
For all investigations, the LME crack risk was evaluated at a measuring point located 0.5 mm from the edge of the indentation, that is, in the region where cracking is believed to be most influential on the performance of the resistance spot weld. 30
Results and discussion
Experimental observation
The experimental results of the S-Rail weld trials are shown in Figure 3. The resulting accumulated and averaged crack length over three samples is depicted in Figure 3(a) for the similar and in Figure 3(b) for the dissimilar stack-up. Figure 3(c) and (d) shows the crack length measurement for F1 of the dissimilar stack up, Figure 3(e) and (f) shows the crack-depth measurement from the cross-section of the same weld. Classification of the LME severity is done via crack length, as this parameter can be assessed without cross-sectioning each weld. For the component-scale investigation with 10 welds per trial, the effort for cross-sectioning would be prohibitive.
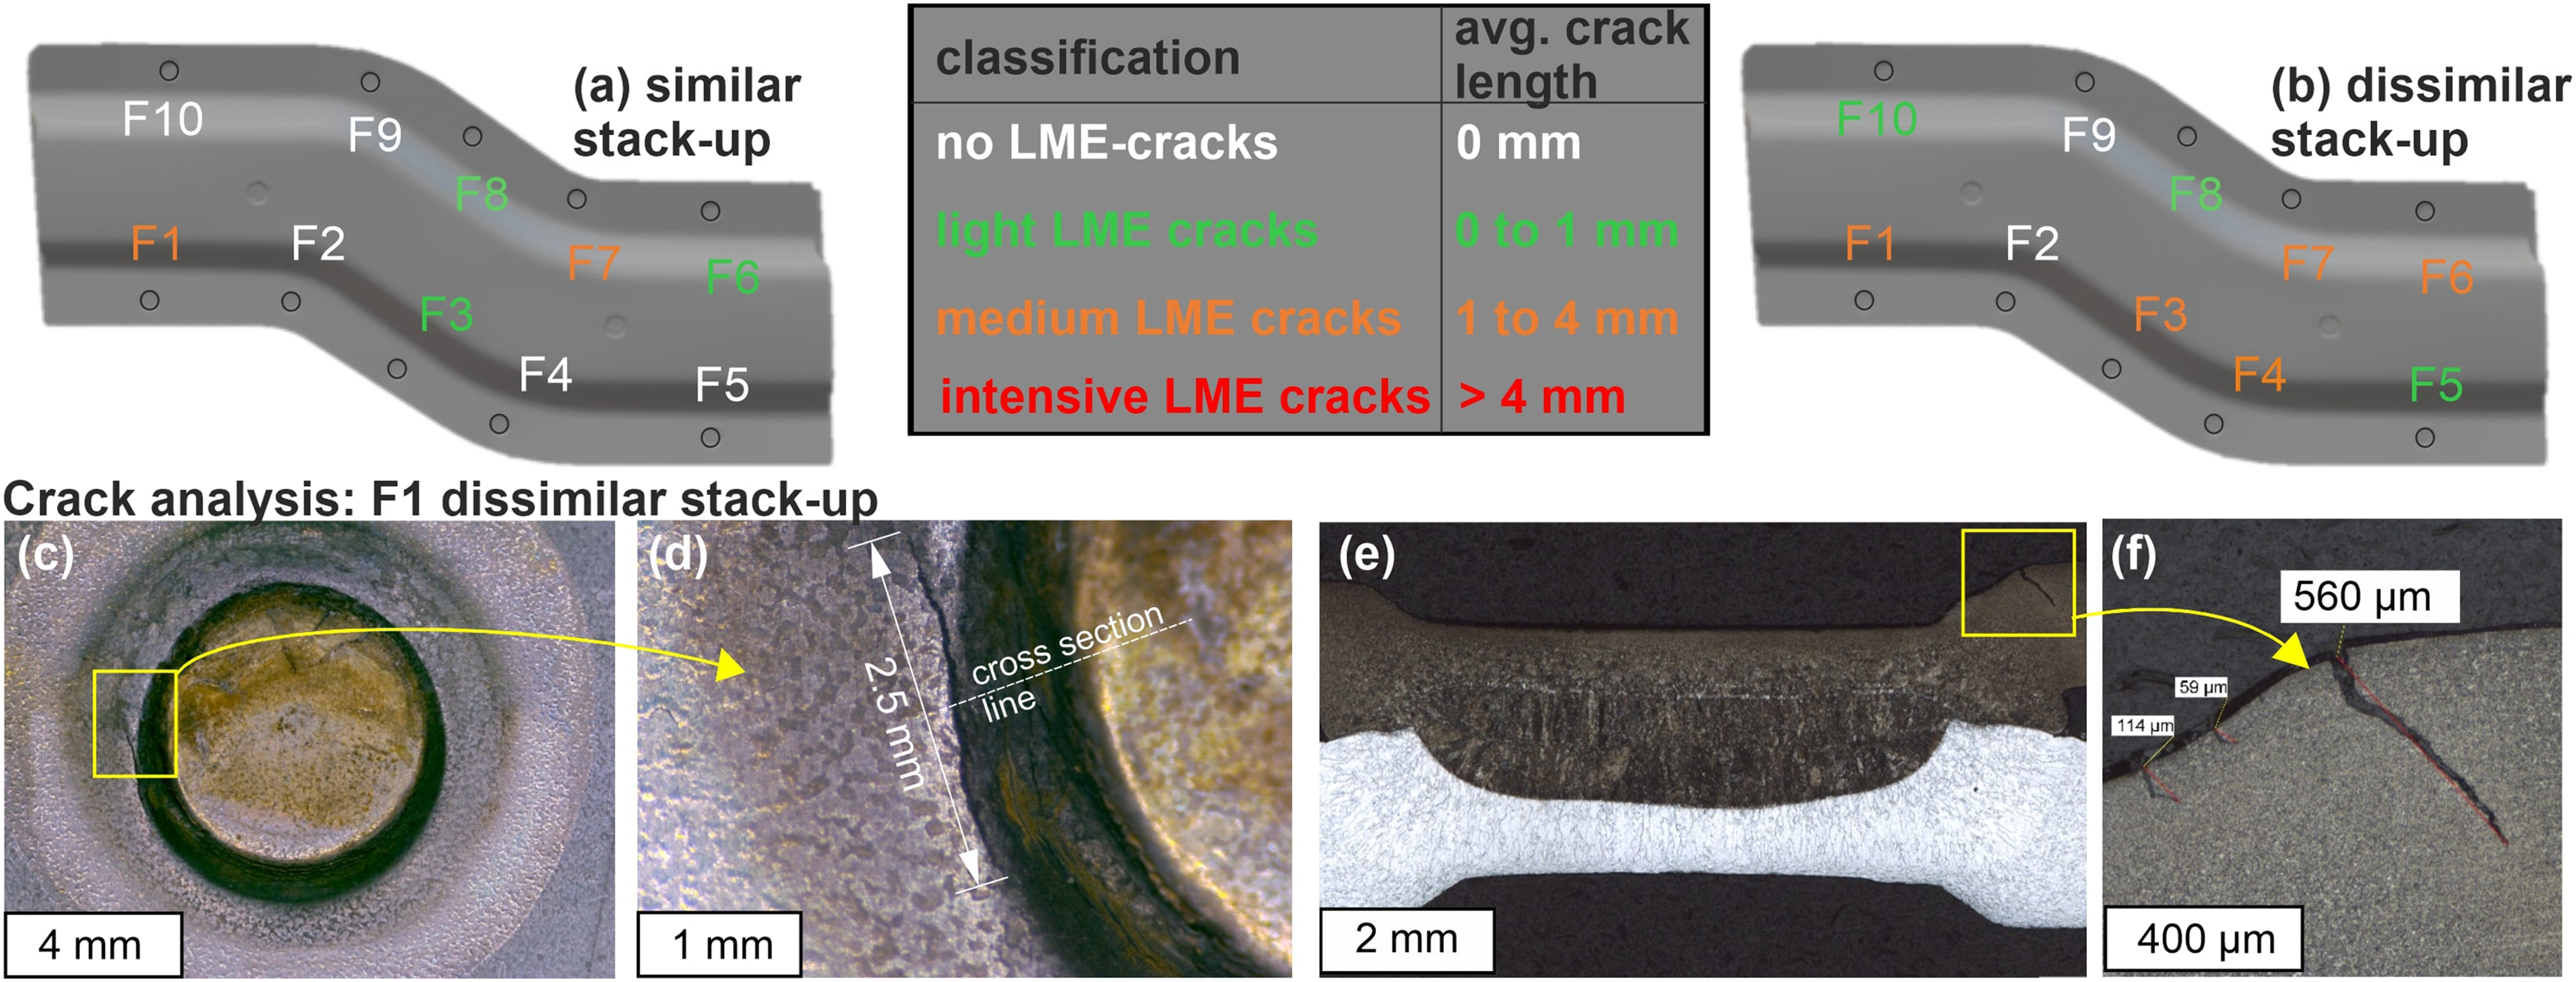
Experimental analysis of crack occurrence for (a) similar stack-up and (b) dissimilar stack-up with 760 ms weld time in a top-down view. The clamping system according to Figure 1 was used. The weld spots are numbered according to their welding sequence and coloured to reflect the average crack occurrence over three samples. (c–f) The crack length and depth measurement in macrographs and cross-sections.
Whereas both material thickness combinations exhibit cracking with the selected high current and weld time, the similar stack-up is markedly less sensitive to LME. Five of the ten welds are completely LME free for all three replicated S-Rail samples, three welds exhibit < 1 mm average crack length and only two spots exhibit between 1 and 4 mm in average crack length. For the dissimilar stack-up, two welds are LME free, three show light and five medium crack occurrences. As a certain amount of crack occurrence is necessary to study the LME risk criterion, all further tests throughout this work will be conducted using the dissimilar stack-up.
To investigate the influence of springback on LME formation, the springback-afflicted flanges were held down with external clamping devices during welding as shown in Figure 2. LME occurrence was analysed for these welds and no LME occurrence could be detected for all 10 resistance spot welds per sample over three repetitions both for similar- and dissimilar stack-ups.
Simulation results
The S-Rail welds were simulated using the numerical simulation procedure described above. In the first step, the springback-afflicted “Actual geometry” is compared to the “Idealized CAD” geometry with straightened flanges. For each spot weld, the LME risk is calculated according to equation (1) at 0.5 mm distance from the electrode indentation edge in the direction of the S-Rail geometry. Figure 4(a) depicts the evolution of the LME risk criterion over time before integration and Figure 4(b) compares the values after integration. In the plot over time, it is visible that the maximum principal stress divided by the temperature-dependent yield stress rises significantly during holding and after the electrode lift during cooling. The maximum value occurs directly after electrode lift-off, where the temperature gradients are high, and the removal of the electrodes creates a peaking of the internal forces. A similar behaviour was also observed by DiGiovanni et al., 16 although the authors did not normalise the stress by the temperature-dependent yield stress.
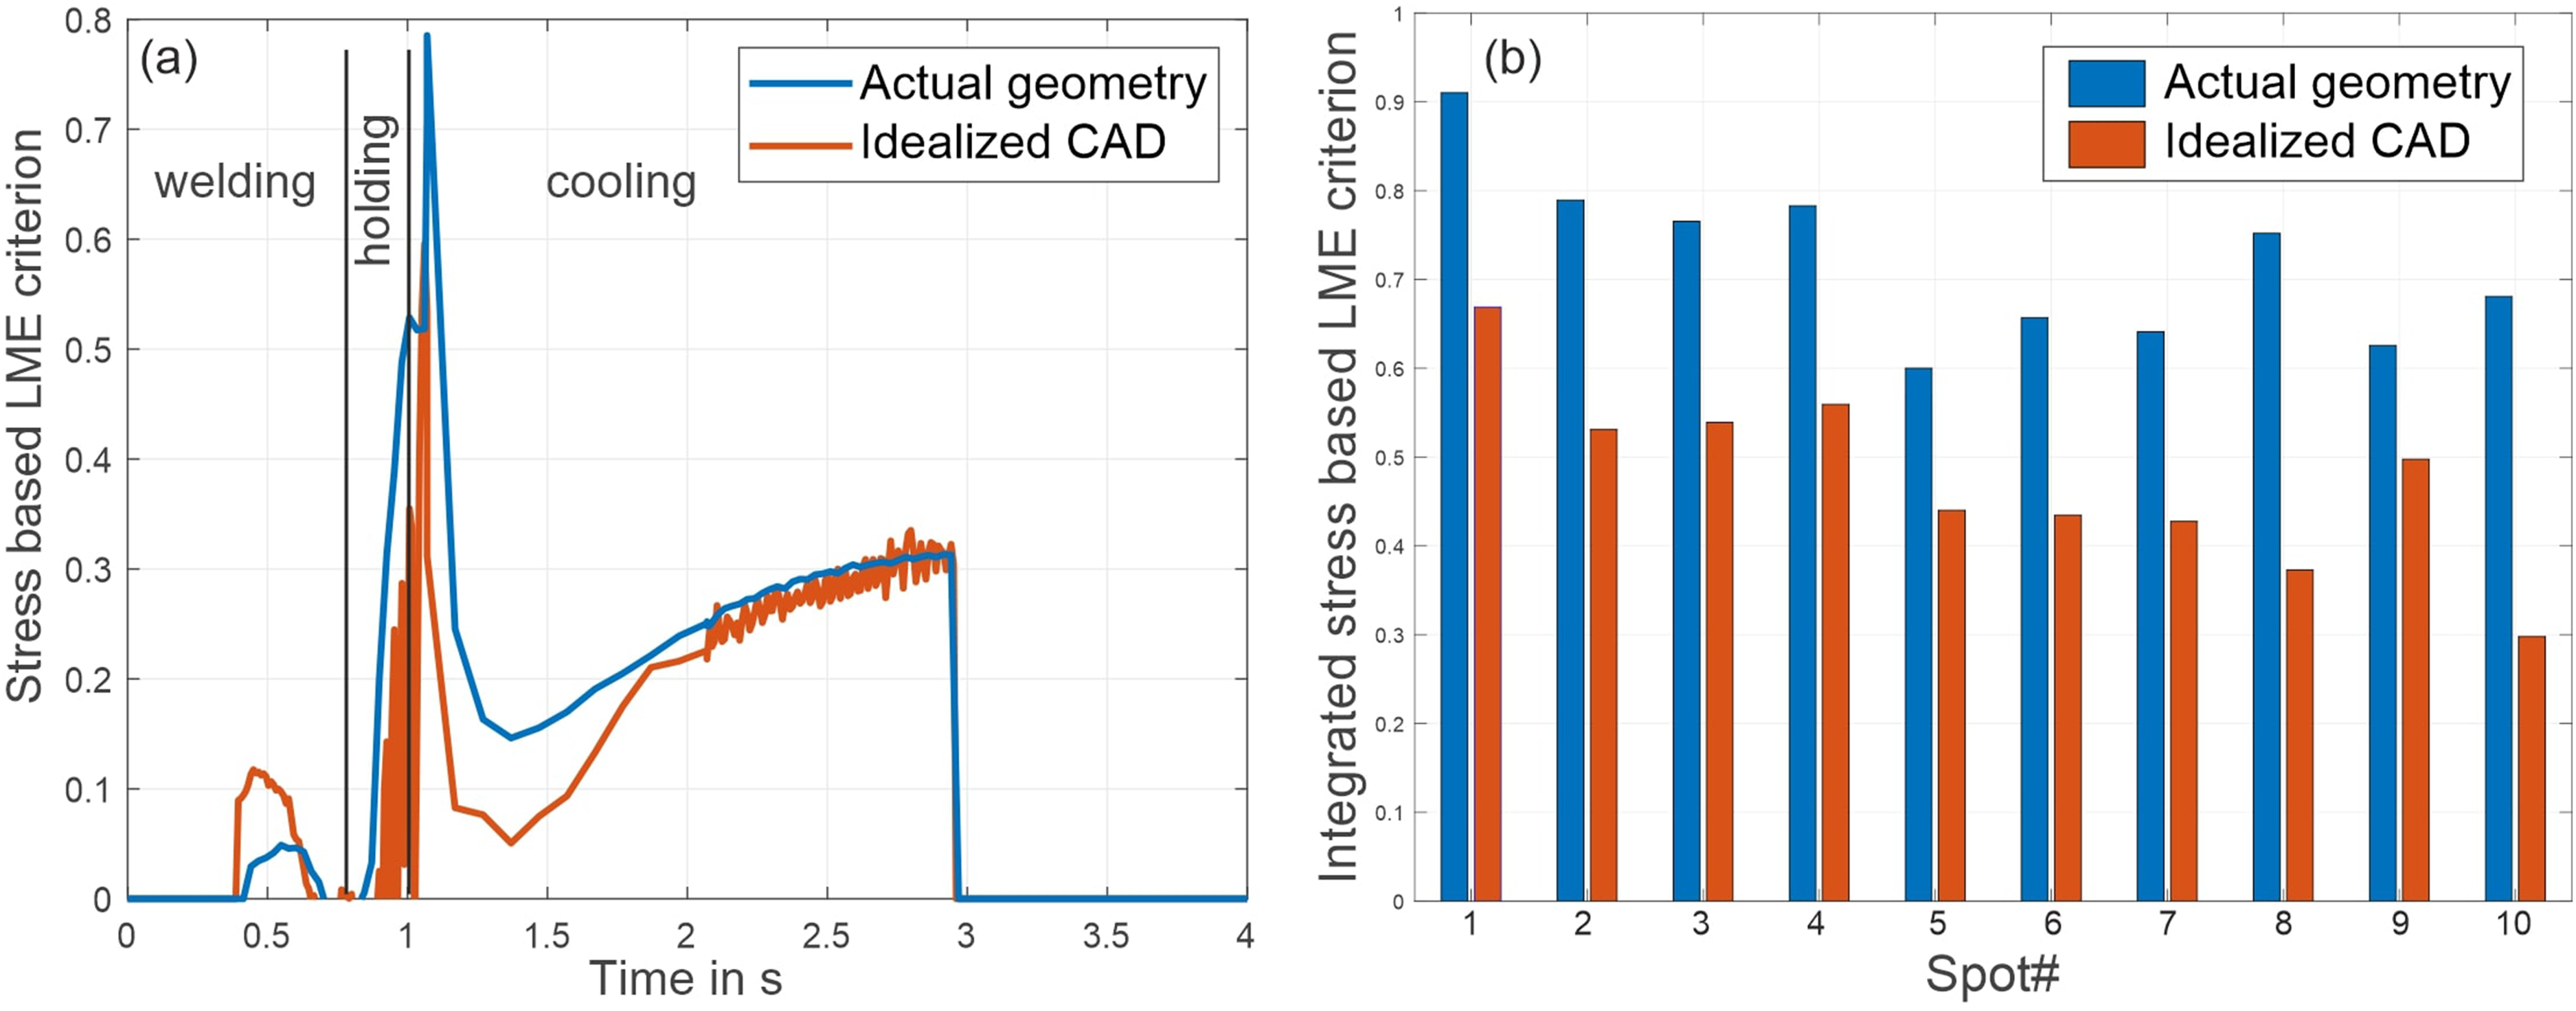
(a) Plot of the LME criterion over time before integration for spot number 5 of the “Actual geometry” and the “Idealized CAD” geometries. (b) Bar graph of the integrated LME criterion at each resistance spot weld on the S-Rail for the “Actual geometry” and the “Idealized CAD.” Both plots are extracted from the dissimilar stack-up welds.
After a dip during cooling, the LME risk value rises again until the value drops to 0 because the surface temperature cools below the zinc melting temperature of 420 °C and the LME risk criterion from equation (1) is defined as 0 below zinc melting temperature. In Figure 4(b), the integrated LME risk according to equation (1) is shown. The values range between 0.6 and 0.91 for the “Actual geometry” and 0.25 and 0.67 for the “Idealized CAD” geometry. In comparison, the values for the “Actual geometry” are consistently higher than for the “Idealized CAD” geometry, hinting at a higher LME risk for the springback-afflicted geometry.
For each spot, the “Actual geometry” shows a higher LME risk, that is, higher principal stress acting in the temperature range where liquid zinc is available on the surface. This simulation result is consistent with the experimental observation that cracks are only formed when the springback acts on the resistance spot welding electrode.
The observed variance of the LME criterion result between spots in the simulation could not be verified with experimental results. In the experiments, it was not possible to consistently observe different LME sensitivities according to the weld's location on the component. The crack occurrence appeared random with several spots showing LME across samples but also LME only materialising in single samples. To undertake a comparison of location-specific LME susceptibility and correlate the calculated LME risk to a quantitative LME occurrence on component-scale parts, a larger number of welded samples is required for statistical analysis. Within the data pertained in this study, no statistical relevance could be discerned experimentally but only observed in simulated investigation. Therefore, this phenomenon is not further investigated here and all other tests in this article use spots 4, 5 and 6 for reference. These particular spots were chosen, because they represent a good selection of the location on the S-Rail. As shown in Figure 3, Spot 4 is located along the flange's side and spots 5 and 6 are next to the clampings. With spot 5 being the last weld of one side and spot 6 being the first weld of the other side.
The result that springback exacerbates LME conforms to the investigations of the effect of electrode misalignment and tilt by Patel et al. 18 and Okigami et al. 22 The authors conclude that electrode misalignment creates additional surface tension stresses, increasing the LME risk. It is hypothesised that springback creates a comparable state to electrode angular misalignment, where the electrodes touch the substrate at an angle and force is not applied equally over the contact area.
LME mitigation measure evaluation
Focusing on the dissimilar stack-up, two LME mitigation measures were tested for their viability on the S-Rail geometry, that is, increasing the electrode hold time after welding and increasing the electrode tip face diameter. Due to the limited number of S-Rails available, the experimental test could only be conducted with combined mitigation strategies, that is, with 800 ms hold time after welding and using an 8-mm tip face diameter electrode. The result of this test is shown in Figure 5. In this figure, it is visible, that none of the welds showed any LME cracking even though the samples were afflicted with springback and an extremely elevated weld time of 1520 ms was used.
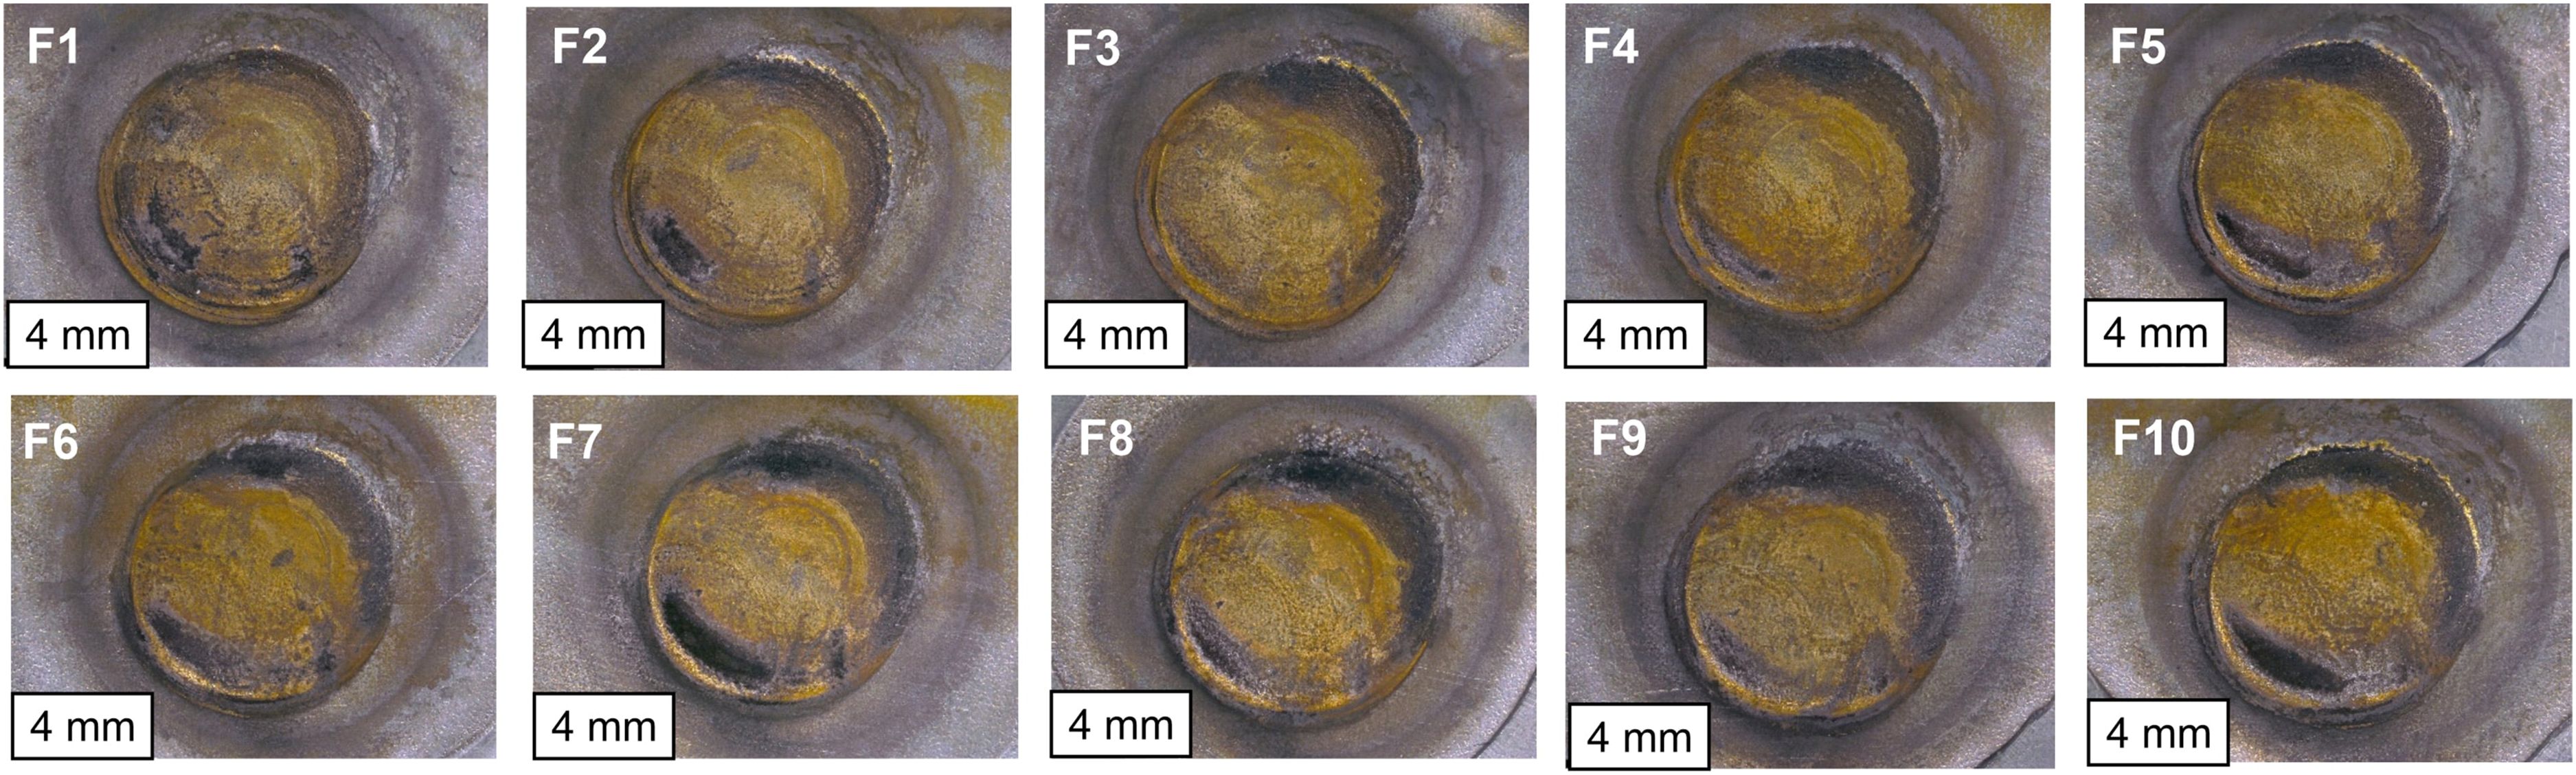
Macrographs of all 10 welded spots for the dissimilar stack-up, using 800 ms hold time and 8 mm tip face diameter mitigation strategies. No cracks are visible although the weld time was set to 1520 ms and the same 9.5 kA current was used on the springback-afflicted S-Rail geometry.
Using the numerical simulation with the crack-risk criterion, the efficacy of the mitigation measures could be investigated further.
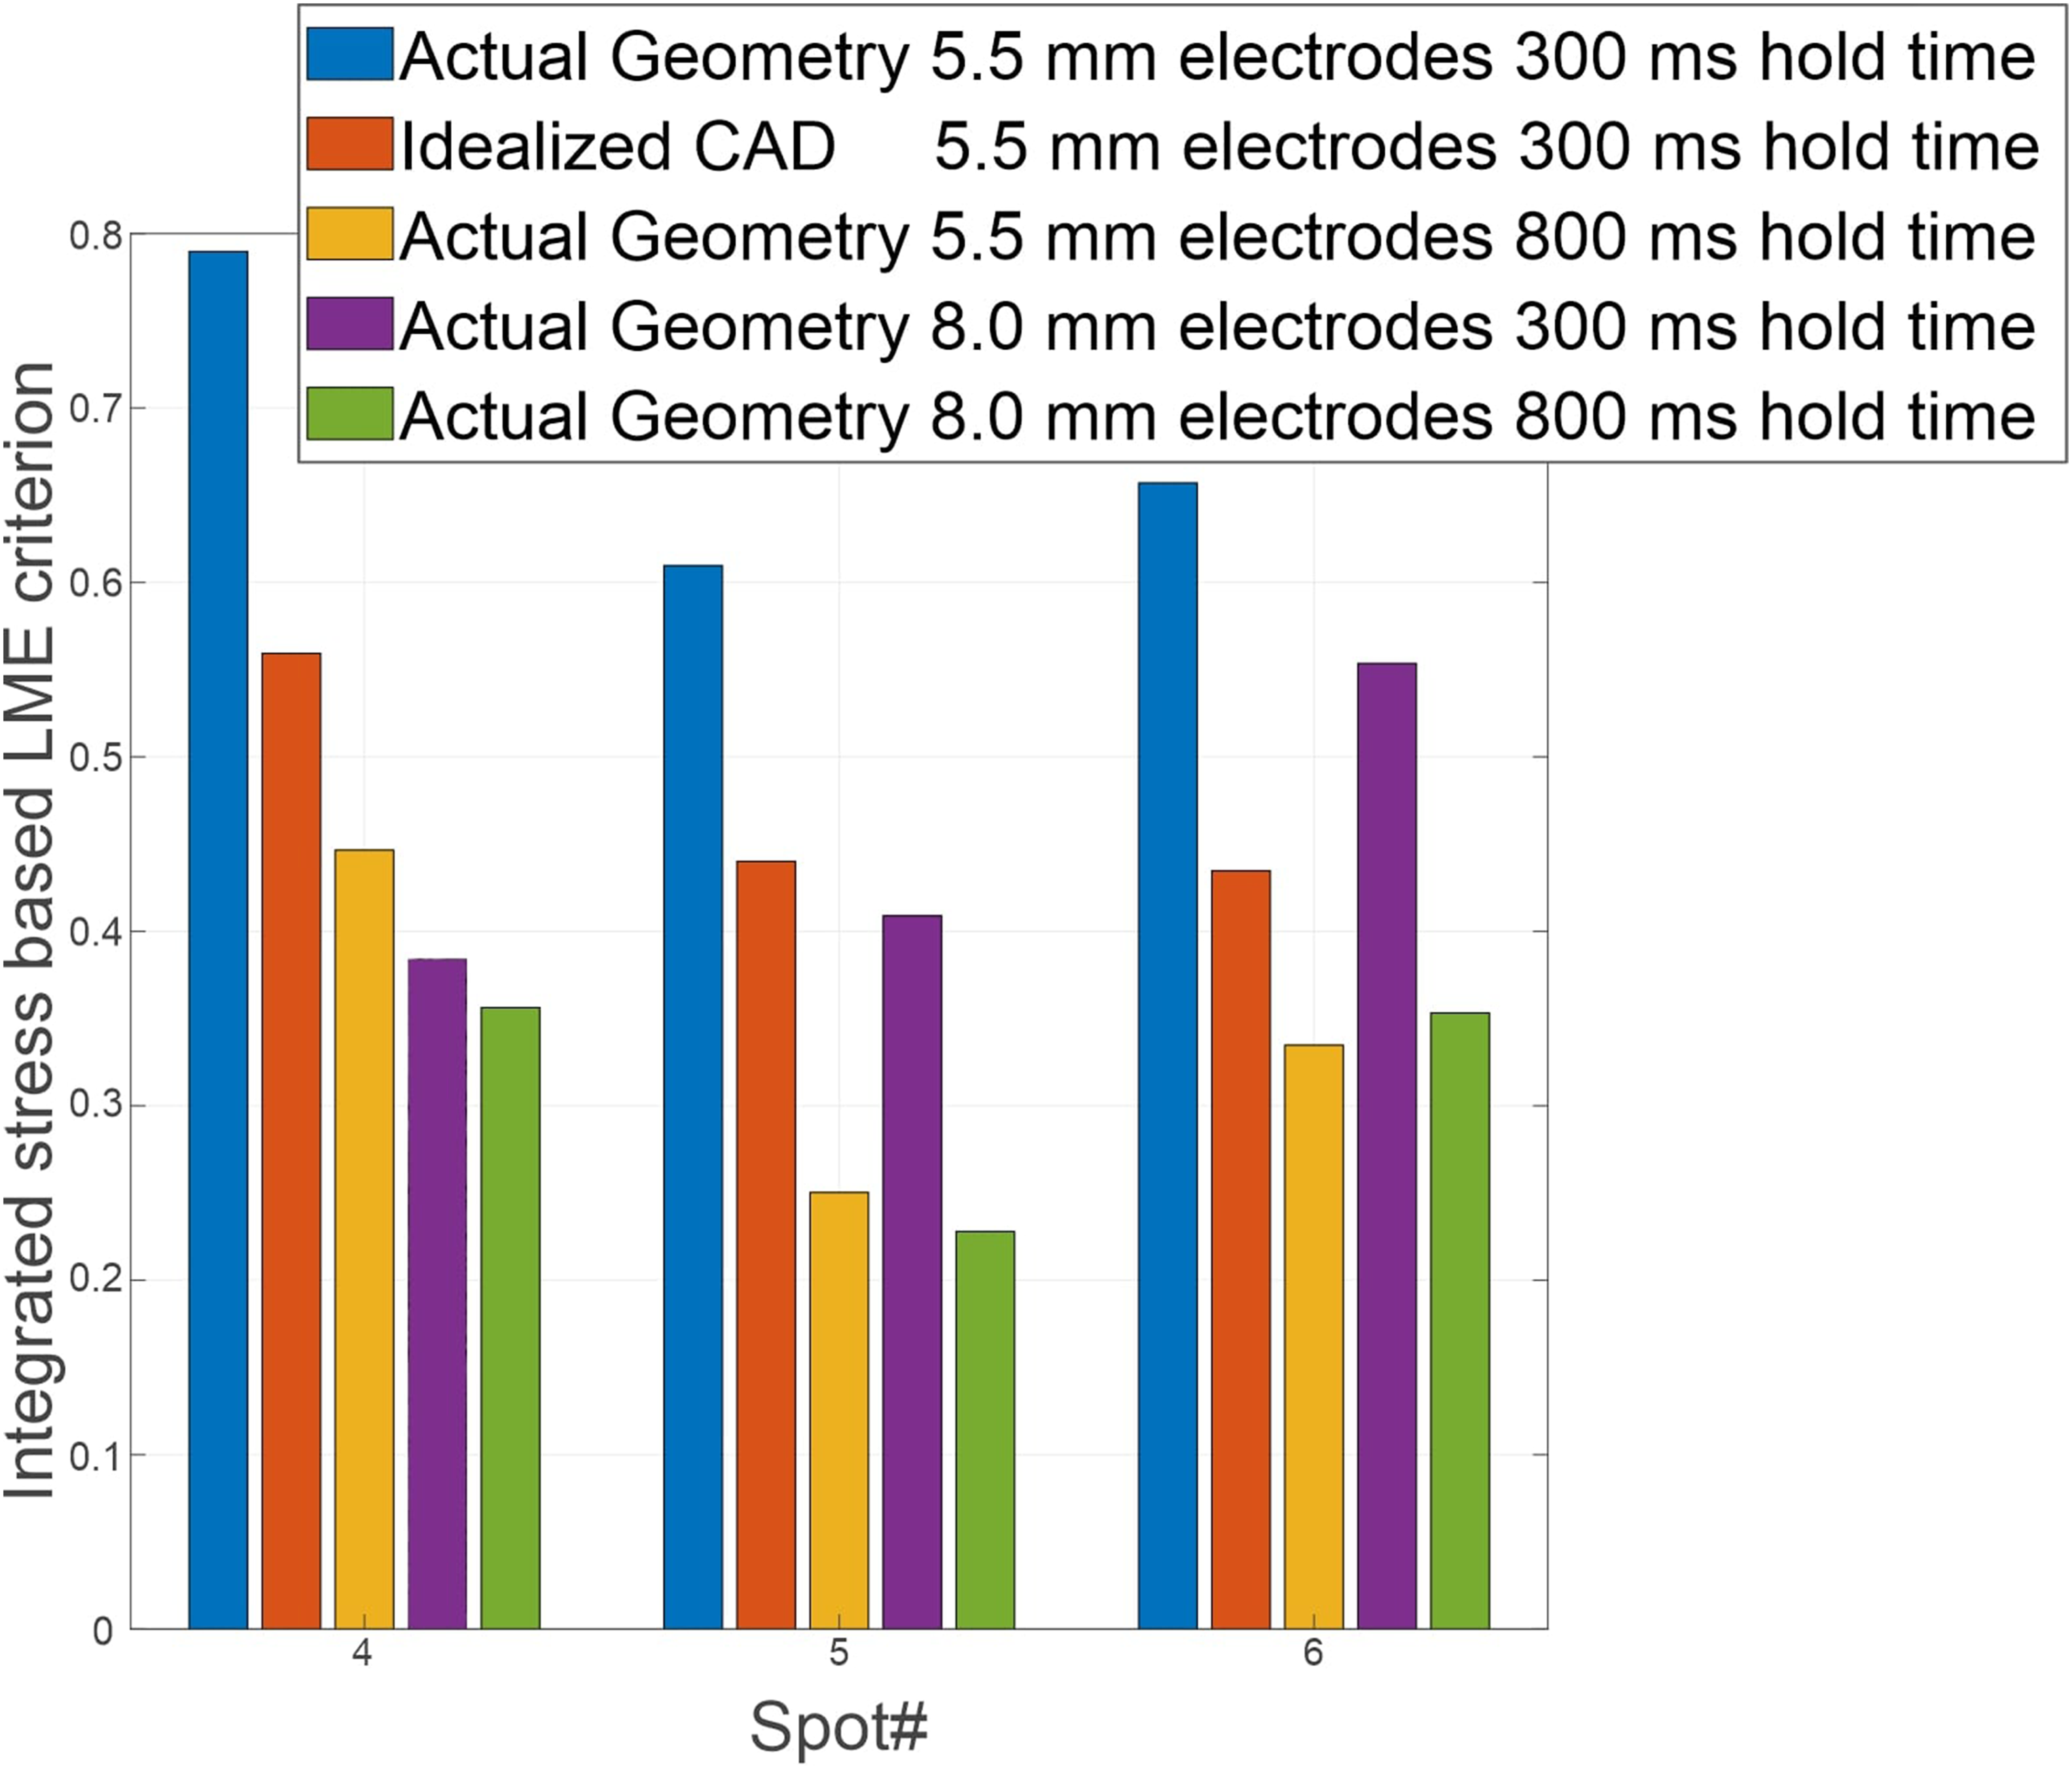
In Figure 6, the results are shown for the “standard” setup initially shown in Figure 4 together with the mitigation strategies: increasing hold time in yellow, larger tip face diameter electrodes in purple and a combination of both measures in green. It is clearly visible that the mitigating measures reduce the calculated LME risk even below the crack-free “Idealized CAD” no-springback geometry.
Comparison of calculated liquid metal embrittlement (LME) risk for S-Rail welds with different LME mitigation strategies. All welds were performed on the dissimilar stack-up material thickness combination.
Whereas increasing the hold time and the tip face diameter reduce the calculated LME risk significantly, combining the measures does not yield an additional reduction in LME risk. It can therefore be deduced, that there is a certain limit to the LME reduction potential of welding strategies and that combining different working strategies does not necessarily add up to their mitigating factors.
These results confirm LME mitigation studies conducted on coupons for part-sized welds. DiGiovanni et al. 16 and Dupuy 17 found that increasing the electrode tip face diameter lowers LME. Böhne et al. 19 found a comparable LME mitigation effect for elongating the hold time dependent on the weld heat input.
LME risk comparison for similar and dissimilar stack-up
As a final test of the study, the simulated LME risk for the similar and dissimilar stack-ups are compared. In Figure 3, it was shown that the similar stack-up exhibits significantly reduced LME although it utilizes the same RA1180 AHSS only welding it to a different joining partner.
The LME risk derived from the simulation for these samples is shown in Figure 7. The calculated LME risk is significantly lower for a similar stack-up, even without using a mitigation measure. The risk can be further lowered by utilising an elongated hold time so that LME crack occurrence can be completely avoided for a similar stack-up as well. The likely explanation of this behaviour is that LME susceptibility is on the one hand governed by the used steel but also by the joining partner and the welding parameters needed to weld the stack-up according to the required quality standards. By utilising a thicker joining partner, more heat can be absorbed by the weld and larger indentations can be formed, increasing LME susceptibility. Using the LME risk criterion presented in this work, LME susceptibility for the similar and dissimilar stack-up welds can be compared even though a different nugget is formed, and different parameters are used. This is because the surface stress states and the heat in the material allow for comparative values across different welding setups as long as the same steel is used for the “LME sensitive” joining partner.
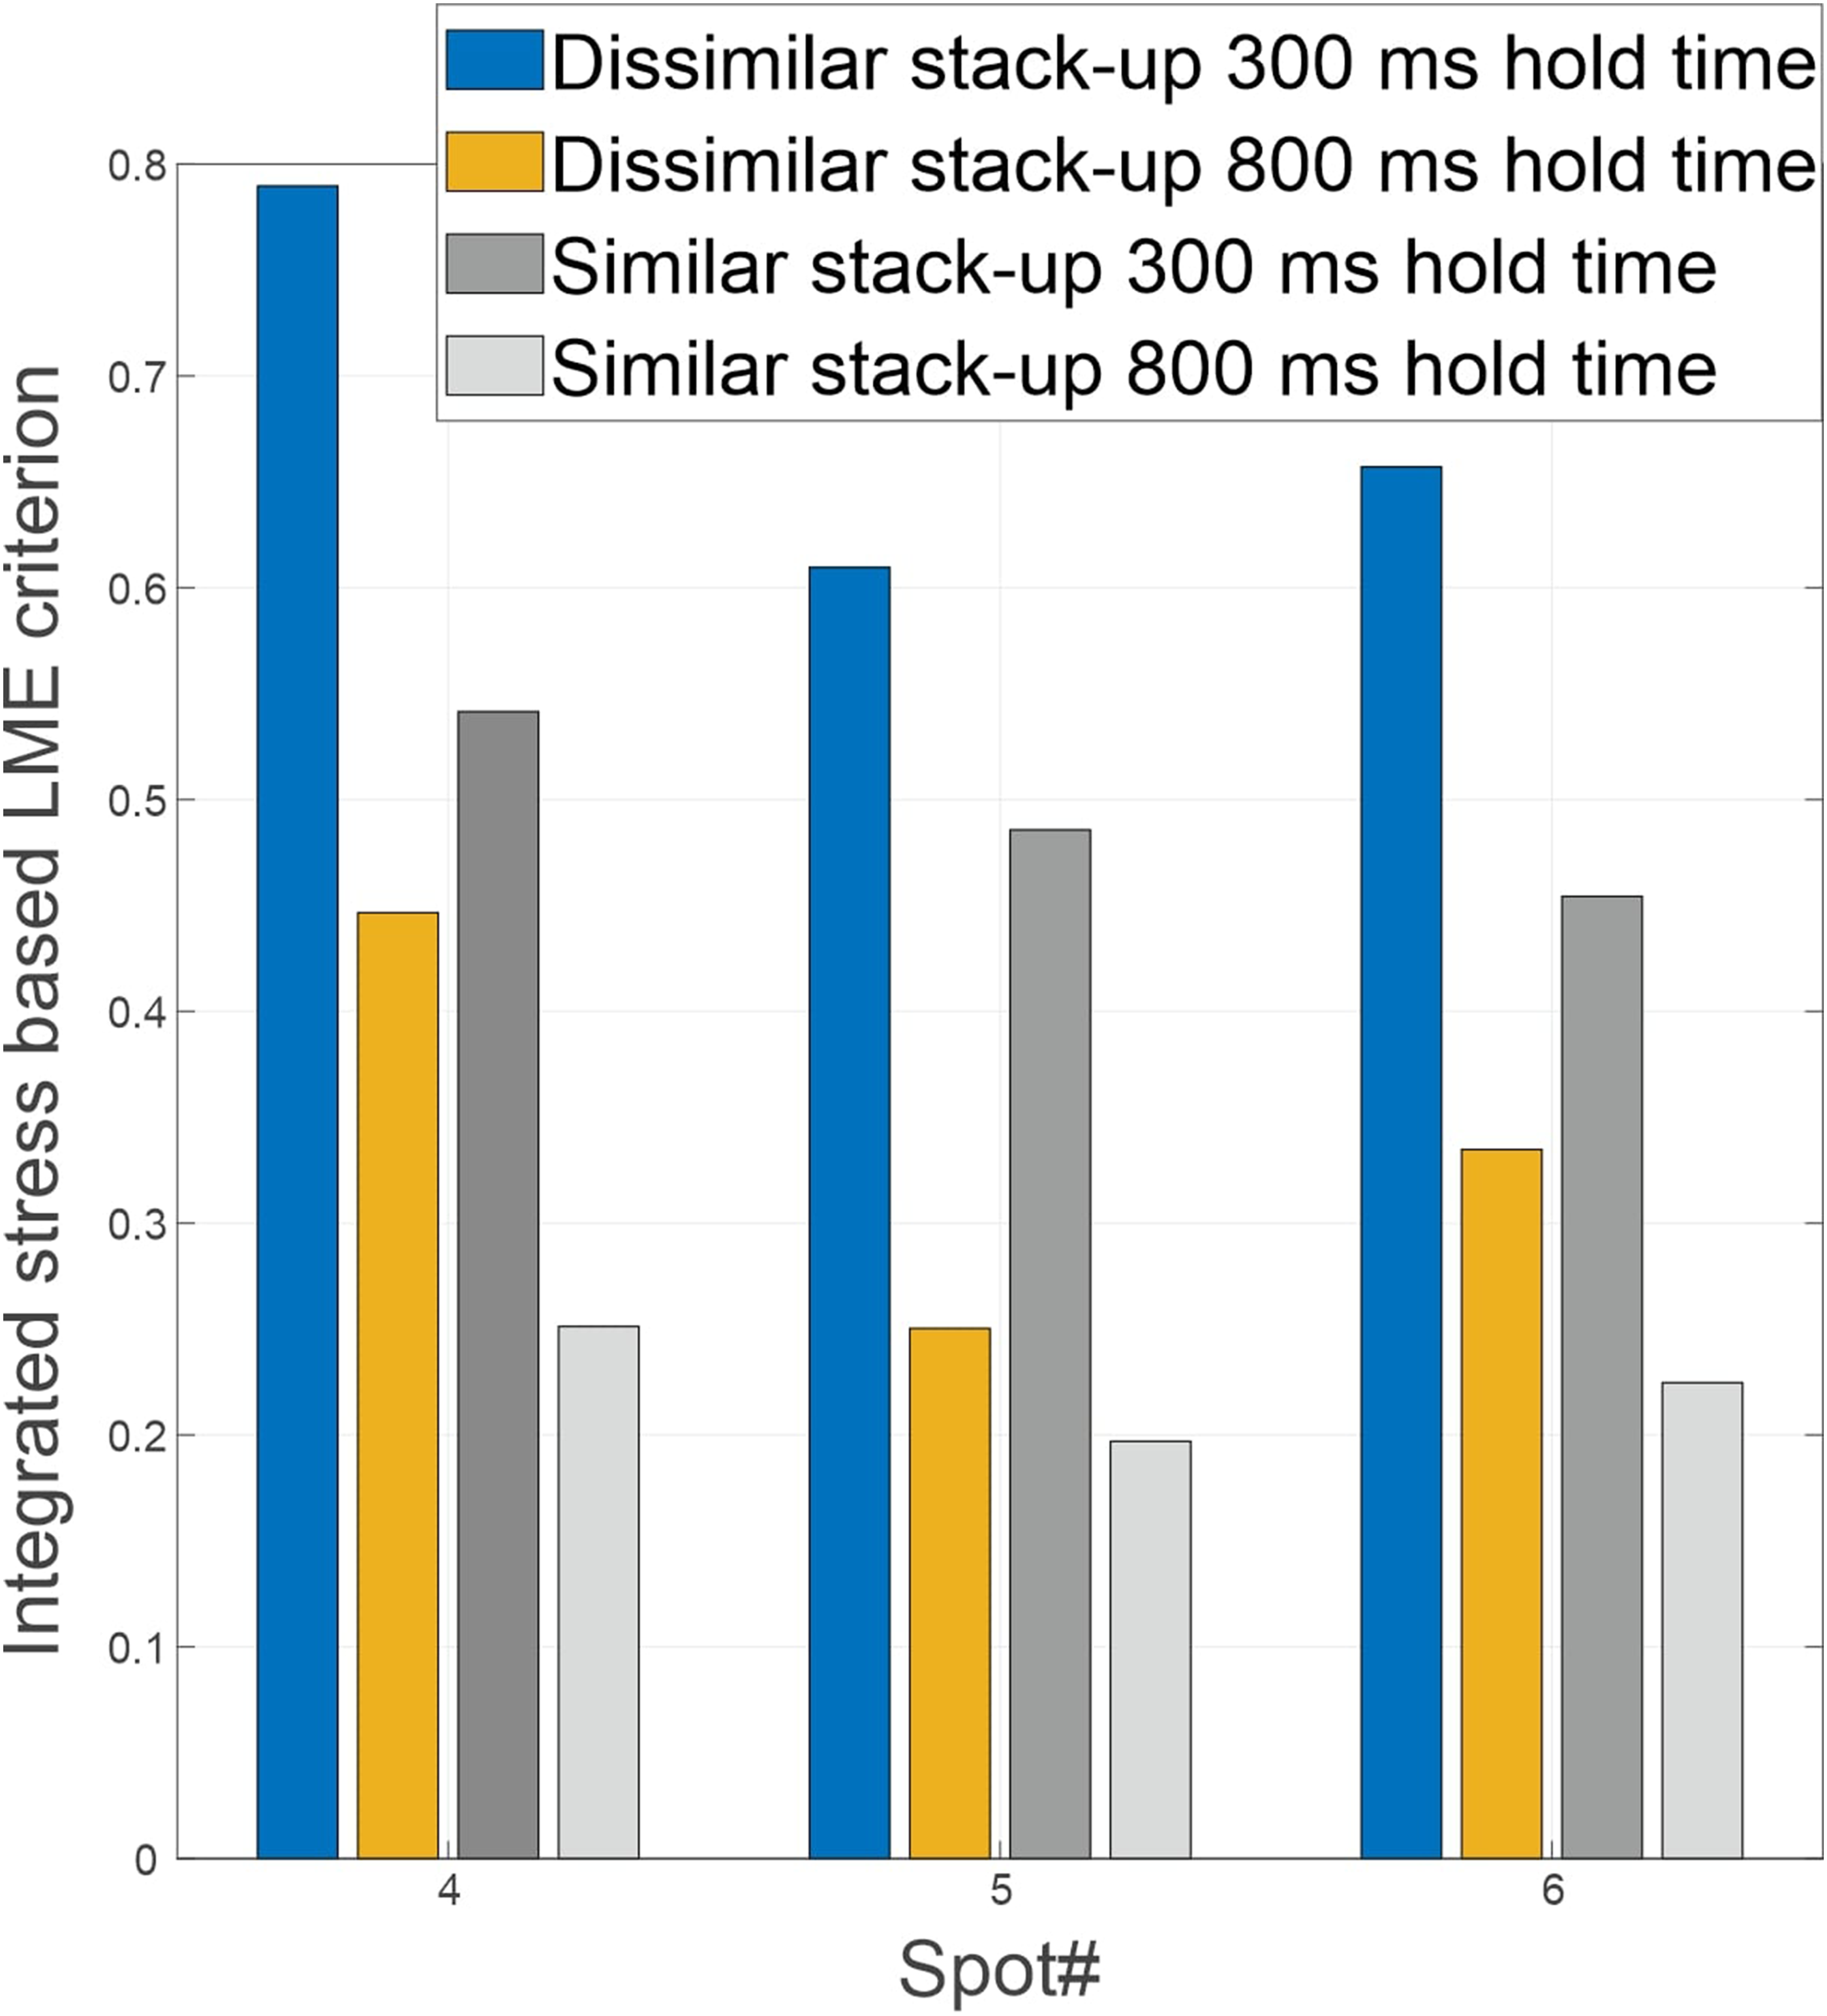
Comparison of calculated LME risk on dissimilar- and similar-stack-up welds with 300 and 800 ms hold times.
A stack-up-dependent behaviour of LME was observed in previous work by the authors on coupon level 31 and attributed to different electrode sink-in velocities dependent on the heat input and material thickness parings. Other authors have investigated this behaviour and correlated the lower LME risk for similar stack-ups to the position of the nugget between the sheets.7,9
Conclusions
In this work, a deep-drawn, springback-afflicted S-Rail component is tested for liquid metal embrittlement susceptibility. Mitigation strategies are evaluated for their applicability to a production-scale component. It could be shown that LME can be forced on a real-life component and that avoidance strategies developed on academic samples are applicable to deep-drawn components.
The welding stack-up was chosen as a thick mild steel joined to an RA1180 AHSS with artificially increased weld time. A thick weld partner, uncharacteristic for current car body production, and heightened weld time were chosen to artificially increase LME sensitivity to a level necessary for the study. Springback was identified as an LME risk factor on the component-scale. Inversely, when springback is avoided or suppressed through clamping, LME formation is reduced. Even without suppressing springback, LME could be completely avoided by adjusting electrode geometry and hold time after welding. Modifying an existing LME modelling approach, an LME risk-factor was calculated for each spot of the assembly and the results aligned well with experimentally observed cracks. Evaluating two different material thickness combinations, a comparison of the effect of sheet thickness and stack-up design on LME showed that LME formation is dependent on the joining partner. LME could be avoided with countermeasures for all investigated stack-ups during this work.
Footnotes
Acknowledgements
This work was supported by the WorldAutoSteel consortium and was performed as part of a transnational study to further understand the basis for LME and develop parameterisation that achieves prevention or mitigation in BIW stack-ups involving AHSS.
Declaration of conflicting interests
The author(s) declared no potential conflicts of interest with respect to the research, authorship, and/or publication of this article.
Funding
The author(s) disclosed receipt of the following financial support for the research, authorship, and/or publication of this article: This work was supported by the WorldAutoSteel Association.