
Abstract
Although the Scandinavian countries are often considered to epitomize social democratic governance, Scandinavia’s profound wealth inequalities, seen in relation to the more modest income differences, constitutes a fascinating paradox. Drawing on class theoretical concerns with strategies for reproduction and a Bourdieusian emphasis on class fractions, we explore how class-origin wealth gaps evolved over the past 25 years in Norway, and how they compare to class-origin income gaps. First, we find that class-origin wealth gaps have increased in recent years, whereas income inequalities are fairly persistent among men, and increasing among women. We find that educational attainment is important for channeling income inequality, but that education is less important for understanding wealth gaps. Second, we document differences between people whose family contexts were most highly endowed with economic capital and those who grew up in families that were engaged in cultural fields or the professions. Finally, we highlight how analyses based solely on net worth neglect important ways class origin perpetuates and accelerates wealth inequalities via the acquisition of debt. We argue that recent decades have fostered new instruments for opportunity hoarding that are most successfully used by the sons and daughters of the economic upper class.
Keywords
At a time when the high-end concentration of income and wealth is a pressing question in contemporary society, the field of class analysis has been curiously silent. Recent work has stressed the importance of linking increasing economic inequalities to the class structure, but such efforts are mostly confined to mapping the unequal distribution of income and wealth between different classes (Weeden et al. 2007; Wodtke 2016; Wolff and Zacharias 2013). The question thus remains whether and how renewed wealth inequalities are linked to opportunity hoarding in an intergenerational perspective. Accordingly, reviving the class analytical emphasis on how societal change facilitates altered strategies for class reproduction and opportunity hoarding seems long overdue.
A central tenet in Piketty’s (2020) analysis of intensified inequalities is the emergence of neo-proprietarism and the replacement of social democracy as a governing strategy in advanced societies. According to Piketty, the heyday of the social democratic era, lasting roughly from the 1950s to the 1980s, involved important efforts to achieve greater equality through instruments of taxation and education reforms to ensure democratic participation. Since the 1980s, however, many of these policies have been replaced by more market-oriented solutions, and economic inequalities have grown rapidly during the past decades. Economic inequalities are also increasingly legitimized by a “competitive market ideology,” even if they are produced by “noncompetitive processes”(Grusky and MacLean 2016:43; Piketty 2020). Within the context of such discussions, we believe insights from trends in intergenerational inequalities in Norway are of particular interest. Often considered to epitomize social democracy, Norway and the other Scandinavian countries are known for their political efforts to reduce inequality and promote social mobility (Beller and Hout 2006; Corak 2013; Jäntti et al. 2006; Landersø and Heckmann 2017). Universal welfare services, universal provision of economic support for students, and small disparities in income (Corak 2013; Jäntti et al. 2006; Salverda et al. 2014) are core features of the Nordic welfare regime (Esping-Andersen 1990).
Although inequalities in income are comparatively modest, the distribution of wealth is highly unequal, and generally higher than in many other European countries (Fochesato and Bowles 2015; Maestri, Bogliacino, and Salverda 2014; Skopek, Buchholz, and Blossfeld 2014; Wiborg 2017). Thus, Scandinavian patterns of inequality display paradoxical features. Norway has one of the world’s highest proportions of billionaires per capita (Henrekson and Sanandaji 2014); in many respects, it is a social democratic country with a distribution of wealth reminiscent of neo-proprietarian governance. In tandem with the continuation of the provision of universal welfare services, such as educational institutions and healthcare services, market solutions have gradually become more common in Norway since the 1980s. Important policies include the liberalization of housing and credit markets, and the privatization of key sectors previously dominated by state ownership, as well as the implementation of new public management in publicly owned companies (Fagerberg et al. 1990; Tranøy 2009). Since the political turn to marketized policies in the 1980s, economic inequalities have increased in Norway (Aaberge and Atkinson 2010; Aaberge and Stubhaug 2018), raising questions about the ramifications of wealth in structuring class inequalities over time in Scandinavian countries.
Broadly defined, opportunity hoarding is a concept derived from Weberian ideas about social closure, where access to economic opportunities is limited by exclusionary devices that regulate who can enjoy such privileges and who are excluded from economic opportunities (Tilly 1999). In most strands of closure theory, educational credentials and private property constitute the most important exclusionary devices (Murphy 1988; Parkin 1979). To date, the class analytical framework for understanding reproduction largely emphasizes the key role educational institutions play in life chances. Notwithstanding the enduring importance of education, we believe strategies that rely on economic capital are of increasing relevance today. According to a recently proposed “marketization narrative,” processes of marketization and neo-liberalism not only ease the concentration of high-end income and wealth, but they can also intensify intergenerational class inequalities (Grusky and MacLean 2016). Thus, it seems timely to address how the advent of increased marketization and growing high-end inequalities have laid the groundwork for new modes of opportunity hoarding (Tilly 1999) and for transmitting class privilege (Bourdieu 1984, 1996, 2014).
Mapping trends in class-origin income and wealth gaps within complete birth cohorts in Norway from 1993 to 2017, we ask: Has the association between class origin and the attainment of wealth increased over time? Are there differences between income and wealth trends? To what extent are class differences in the accumulation of economic resources mediated by education?
Our results support the notion that class-origin differences in wealth accumulation have indeed increased in recent years in Norway, whereas income inequalities remain fairly persistent among men, and are increasing among women. Thus, alongside the continuing presence of social democratic instruments for redistribution within the labor market and welfare services, we find emerging conditions for wealth-based opportunity hoarding that have intensified class inequalities in recent years.
We draw on a Bourdieusian class scheme that treats class as a two-dimensional structure of the distribution of capital in society, which generates different capabilities and inclinations for practice and action (Bourdieu 1984, 1990). This theoretical approach not only permits the investigation of whether class differences in reproduction differ between those most and least endowed with capital (the upper class versus the unskilled working class), but it permits us to analyze whether there are intra-class divisions among fractions of the upper class. Significantly, our findings suggest that, just as Norwegians from culturally privileged families are the most successful in the education system (Andersen and Hansen 2012; Hansen and Mastekaasa 2006), Norwegians from economically privileged families are the most economically successful. We find that education is important in channeling class-origin income inequalities, yet less important in mediating class-origin differences in wealth. This, we argue, points to the return of a “family mode of reproduction” (Bourdieu 1996), a strategy that seems relatively unaffected by social democratic efforts to regulate labor markets and educational institutions, and one that is possibly even enabled by the relative turn to a marketized political economy.
Finally, we highlight how analyses based solely on net worth neglect important ways class origin perpetuates and accelerates wealth inequalities. Here, we address an undertheorized understanding of the way debt is linked to class differences in access to credit, accumulation strategies, tendencies for risk-taking, and possession of knowledge of investment strategies (Dwyer 2018; Fourcade and Healy 2013). We show important class-origin differences in the tendency for accumulating liquid assets, and we highlight the extensive wealth that is tied up in finance capital.
Wealth and Intergenerational Inequalities
Wealth inequality and its consequences constituted a blind spot in sociological research before the turn of the century (Spilerman 2000). Partly reflecting a new awareness of large wealth inequalities in the twenty-first century (Keister and Moller 2000), sociologists have recently begun paying considerable attention to the accumulation of wealth, as well as the consequences of the distribution of wealth for life chances across generations (Albertini and Radl 2012; Boserup, Kopczuk, and Kreiner 2018; Carruthers and Ariovich 2004; Hansen 2014; Karagiannaki 2017; Keister 2007; Keister and Lee 2014; Korom, Lutter, and Beckert 2017; Pfeffer 2011; Raffalovich, Monnat, and Tsao 2009; Toft and Friedman 2021).
Studies from the United States show that more than half of people with parents in the highest wealth quintile end up in that quintile themselves (Pfeffer and Killewald 2015), and there is a strong association between parental wealth and children’s educational attainment, which has increased over time (Pfeffer 2018). Studies also show multigenerational dimensions to wealth, as grandparent-child associations are detectable over and above parent-child associations (Pfeffer and Killewald 2018). The effect of parental and grandparental wealth is also seen more indirectly, such as in living and housing standards (Spilerman 2004; Spilerman and Wolff 2012). Aligning with findings from the United States, high levels of parent-child associations are evident in Scandinavian studies (Adermon, Lindahl, and Waldenström 2018). Parental wealth is linked to educational attainment in Sweden (Hällsten and Pfeffer 2017) and Norway (Wiborg 2017) and to opportunities within “elite” segments of the Norwegian labor market (Toft and Friedman 2021). Multigenerational wealth is also linked to housing tenure and housing value (Galster and Wessel 2019).
Previous studies that address trends in intergenerational associations in Scandinavia primarily focus on the top of the wealth distribution. Some studies indicate that class origin has become more decisive in recent years, as increasing proportions of those possessing top wealth originate from the wealthiest family backgrounds (Gustavsson and Melldahl 2018; Hansen 2014). However, these studies deal with outliers (i.e., the super-rich), and trends in such groups might be different from those of the broader classes on whom we focus in this study. Wiborg and Hansen (2018) use sibling correlations to assess intergenerational associations among the population at large. They find that sibling correlations in wealth and earnings are increasing over time in Norway, whereas the correlations in education are declining. Whether such trends vary by class origin remains unexplored. In fact, wealth inequalities are rarely studied from a class-analytical perspective.
Strategies of Class-Based Opportunity Hoarding
Given the growing awareness of wealth inequalities in recent research, the lack of attention among class analysts to wealth-based opportunity hoarding remains puzzling. A key idea in class analysis is that families use reproduction strategies to retain or improve their resources, both over their lifetimes and across generations (Bourdieu 2014; Goldthorpe 2000; Scott 1982). Different forms of resources—social, cultural, and economic—serve as devices that families can draw on to hoard opportunities.
With the advent of mass education and changes in the economy (e.g., the rise of impersonal ownership structures and the expansion of the joint-stock company, with a corresponding increase in managerial positions), credentials and the importance of the education system in mediating class reproduction have come to dominate class mobility research (Bourdieu and Passeron 1990; Collins 1979; Goldthorpe 2000; Scott 1997). A key idea in one strand of this scholarship has been that cultural capital inculcated in privileged families becomes embodied as a sense of “ease” that is advantageous in the school system (Khan 2010) and helps forge a successful elite career (Friedman and Laurison 2019; Rivera 2011, 2012). By rewarding the inculcated dispositions of privileged students with school diplomas (Calarco 2018; Lareau 2003), the education system allows for class reproduction to be attributed to “meritocratic” selection processes in the labor market. Although such “school-mediated modes of reproduction” are salient among business elites (Bourdieu 1996; Melldahl 2018; Useem and Karabel 1986), evidence suggests educational credentials are more important in forging careers for cultural elites than for business elites, in both the United States (Brint et al. 2020) and Denmark (Ellersgaard, Larsen, and Munk 2013).
Such findings suggest different strategies promote class reproduction within cultural fields and business fields. As Bourdieu argues, classes and cultural and economic class fractions are inclined to pursue different types of mobility strategies (e.g., education strategies, inheritance strategies, business takeovers). Cultural fractions rely more heavily on scholastic instruments of reproduction, not only because their dispositions are positively sanctioned within the school system, but also because reproduction within the cultural fraction relies to a greater extent on scholastic “success.” The economic fraction has “other means and other routes to [its] success,” making the pursuit of educational credentials less important (Bourdieu 2014:256–59).
We believe the closure mechanisms based on private property have been given insufficient attention in class mobility research. Strategies for opportunity hoarding geared toward economic investments and the accumulation of wealth may become more important and effective at times of rising inequality and marketization. Such strategies may first involve transferring wealth to children. Whereas “the school-mediated mode of reproduction” is a time-consuming and risky strategy (Bourdieu 1996:287f), inter-vivos transfers are highly effective devices for opportunity hoarding, as they can be transferred directly to children (Hansen 2014; Pfeffer 2011). New evidence suggests there are class-specific inclinations for relying on such “truly economic strategies” for reproduction (Bourdieu 2014:253). Within European countries, directly transferring assets is most persistent within the service class (Albertini and Radl 2012), and, in Norway, it is most common among an economic fraction of the upper class consisting of large proprietors, owners of single enterprises, investors with diversified portfolios, and top managers and directors (Hansen and Wiborg 2019).
However, directly transferring assets, either as inter-vivos gifts or bequests, is only one way class origins may generate wealth gaps. We assume variations in wealth-based opportunity hoarding result not only from differences in gifting, but also from values, cultures, and knowledge associated with class origins (Bourdieu 2005; Pinçon and Pinçon-Charlot 1999). Children who grow up in certain business environments may gain useful knowledge about accumulating wealth (Kuusela 2018), a familiarity with investment cultures in elite segments of the financial industry (Ho 2009; Neely 2018), useful social networks that promote wealth attainment, or simply develop profit-driven inclinations that shape their aspirations and aptitudes in adulthood (Hartmann 2000; Kuusela 2018). An “insurance function” of parental wealth, which protects against potentially negative consequences of making risky choices, such as educational or occupational investments with uncertain future prospects (Friedman and Laurison 2019; Pfeffer and Hällsten 2012; Toft and Friedman 2021), would also apply to economic investments (e.g., in real estate, business, or the stock market). In addition, parents can provide advantageous network ties and help with financing and accessing professional legal, consultancy, or wealth management services that bolster wealth accumulation (Glucksberg and Burrows 2016; Harrington 2016).
One investment strategy involves raising debt to first invest and then later reap any returns. Raising debt can therefore be regarded as a sign of having superior access to credit (Dwyer 2018; Dwyer, McCloud, and Hodson 2012; Killewald 2013), or of possessing the security, ease, or knowledge that might make one inclined to invest. Class differences in creditworthiness may generate multiplier effects, as credit acquisition allows for additional accumulation of wealth at a lower cost (Fourcade and Healy 2013). Wealth is usually measured as net worth, defined as the sum of financial assets and real property, with debts deducted (Davies 2009; Keister and Moller 2000; Killewald, Pfeffer, and Schachner 2017). If raising debt is regarded as an investment strategy, relying solely on net worth may not provide a complete picture of class-origin wealth gaps. In our analyses, we therefore compare class-origin wealth gaps when measuring net worth compared to a measure of gross worth.
Conceptualizing Class: Forms of Capital
To investigate more systematically whether intergenerational wealth associations differ by social class, and whether there are different strategies for hoarding opportunities between classes and class fractions, we find Bourdieusian readings of class divisions particularly useful.
Bourdieu conceptualizes the class structure as a multidimensional social space, flowing from the distribution of multiple “capitals.” 1 Such capitals, due to different conditionings, produce different inclinations for perception, appreciation, and practice (Bourdieu 1984, 1990). In advanced societies, cultural and economic capital are the most “efficient” forms of capital (Bourdieu 1991:631). Cultural capital denotes the embodiment of the legitimate culture in modes of behavior, expression, and appreciation; institutionalized educational credentials; and objectified pieces of esteemed art, whereas economic capital denotes material assets and money. In Distinction, Bourdieu (1984) identified three dimensions that structure social space: a volume dimension that separates the most highly endowed from the most deprived, a capital composition dimension that separates groups or individuals by their “asset structure” (i.e., the relative preponderance of economic compared to cultural capital), and a trajectory dimension (i.e., the changes in the amount and types of capital over time). The first two dimensions, volume and composition, constitute the most highly “determinant” properties of class (Bourdieu 1984:106). 2
In our application of these ideas about class and forms of capital, we draw on the novel Oslo Register Data Class scheme (ORDC), which rests on a theoretically informed classification of occupations along the two dimensions of capital volume and capital composition (Hansen, Flemmen, and Andersen 2009). Occupations, Bourdieu (1987:4) argues, are “good and economical” indicators of positions in social space, not only because occupational entry and rewards are immanently associated with economic and cultural capital, but also because they carry information about “occupational effects,” such as the “effects of the nature of work, of the occupational milieu, with its cultural and organizational specificities.” Using occupations to categorize class relations is, of course, widespread in conventional classifications (e.g., Erikson and Goldthorpe 1992).
Occupations are ordered hierarchically, into upper-, middle-, and lower-level classes (e.g., skilled and unskilled workers), as well as horizontally into class fractions, according to the relative preponderance of cultural versus economic capital. The upper class is divided internally between those who dominate the fields of cultural production and have a mastery of symbolic forms (e.g., academics, architects, artists)—they have more cultural capital but relatively less economic capital—and those who dominate in business and the economic field (e.g., managers, executives, proprietors, financial brokers), who have more economic capital but less cultural capital. In between these fractions, we find groups who possess high volumes of capital but with a more balanced capital portfolio, typically expressed as high salaries and exclusive educational credentials, such as professionals (e.g., lawyers, doctors, civil engineers). Economic and cultural fractions are also found in the middle classes who have relatively less capital than the upper class. Figure 1 shows the classes in the scheme, with examples of the most dominant positions (see Appendix Table A1 for a more detailed list of major occupations within each class, and the online supplement for a version of the classification based on four-digit ISCO codes).
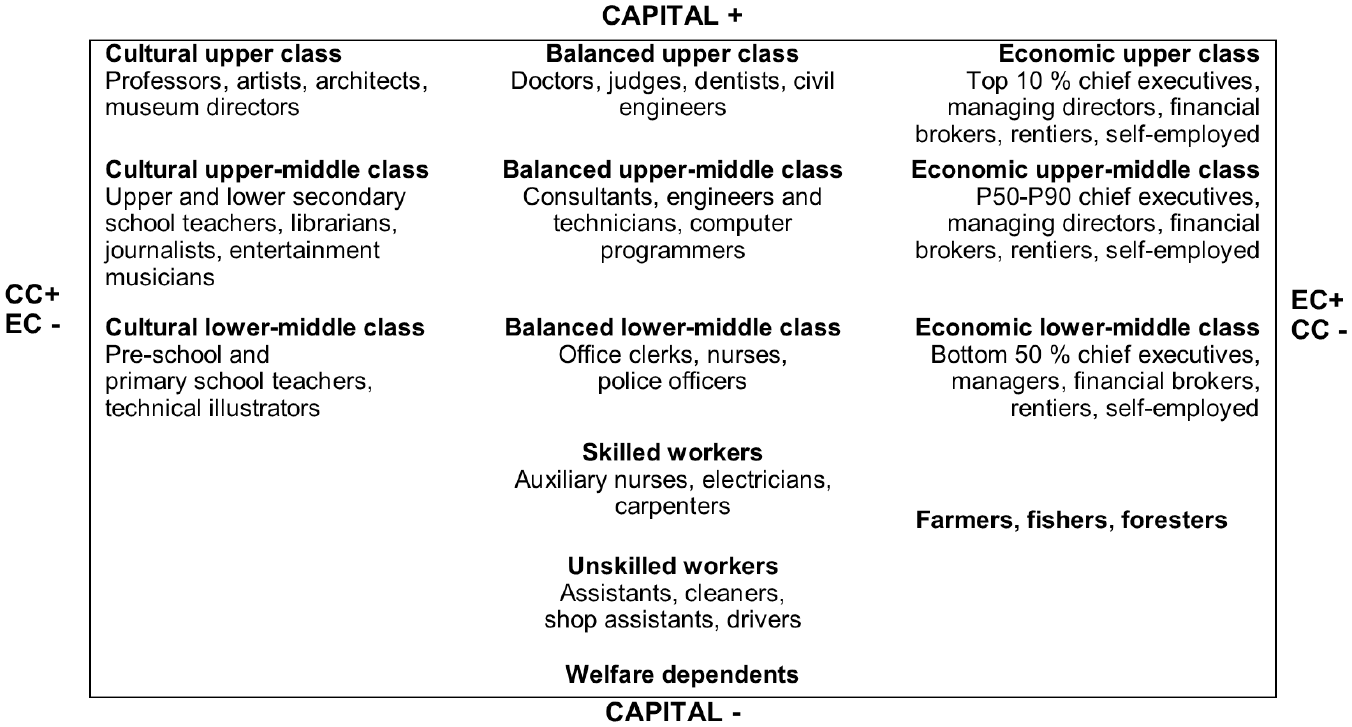
Oslo Register Data Class Scheme (ORDC) with Example Occupations
In addition to occupational categorization, the ORDC scheme relies on data about income to offer an approximation of the self-employed, rentiers, and proprietors, and to pinpoint a capital volume principle within the economic fraction. 3 The self-employed, rentiers, and proprietors are approximated as those who are not employees but who derive their livelihoods from capital income and self-employed income. In our view, this is a beneficial feature of the ORDC scheme vis-à-vis alternative classifications that identify divisions solely between employees, at least in empirical applications (see, e.g., Breen and Müller 2020; Bukodi and Goldthorpe 2019; Jonsson et al. 2009). Recent studies have demonstrated the need for a class analytical perspective that acknowledges property ownership when studying high-end income (Wodtke 2016; Zhou and Wodtke 2019). The scheme offers this potential in that it moves beyond divisions between employees to include individuals whose livelihoods are derived from assets.
The ORDC scheme uses income to pinpoint an internal volume dimension within the economic fraction. Arguably, the volume dimension within the cultural fraction is more readily derived from the occupational categorization; the persistence of credentialist closure among dominant positions within the cultural sphere—most clearly articulated in the case of professors—means the length of one’s education, a signifier of the volume of cultural capital, is built into the scheme. As far as positions within business are concerned, this volume dimension cannot be neatly read from occupational titles. For instance, titles like “manager” or “financial broker” may denote peripheral, small-scale positions or highly dominant positions in the economy, and the same holds true for proprietors, the self-employed, and rentiers. Within the economic fraction, earnings, self-employed income, and capital income are summarized, and the top 10 percent are assigned to the upper class, the next 40 percent to the upper-middle class, and the lowest 50 percent of earners to the lower-middle class. This allows us to include, for example, financial brokers who accrue considerable rewards within an upper class, whereas small-scale and less dominant players in finance are placed in the middle classes, according to their rent-extracting opportunities.
Advantages of Conceptualizing Class Fractions for Our Study
Thus far, we have argued that wealth-based opportunity hoarding may constitute an emerging device for intergenerational opportunity hoarding at times of rising economic inequality and marketization, particularly for the children of dominant business families. A major advantage of the ORDC scheme is that it allows us to study whether class fractions draw on different devices to strengthen their position in society, and whether such strategies vary over time.
Such horizontal dimensions to class remain largely unrecognized in the theoretical ideas underpinning conventional schemes, such as the Erikson-Goldthorpe-Portocarero (EGP) scheme (Erikson and Goldthorpe 1992). This is not only the dominant tool among sociological class analysts, but it also features as the official measure of class in the European Union, the European Socio-economic Classification (ESeC) (Rose and Harrison 2014). Nor have we found that the neo-Marxian alternatives associated with Wright (1997, 2015), wherein divisions along exploitative relationships are highlighted, attend to the oppositions we have described. Moreover, as Wright (2015) notes, a Bourdieusian take on class bears a greater resemblance to the neo-Weberian emphasis on class relations as forms of exclusion and social closure, rather than the Marxian notion of exploitative relationships.
Premised on a neo-Weberian emphasis on employment relationships, the EGP scheme separates those who enjoy a service relationship with their employer, and those whose employment is regulated by a labor contract. The EGP approach and the Bourdieusian approach share important traits, especially because questions about life chances are fundamental in both, and more so than in other approaches to class analysis (Wright 2005). Symbolic power is more essential in the Bourdieusian approach, however. This leads us to draw the horizontal class divisions described earlier, where the upper class, for example, is divided into economic, balanced, and cultural fractions (see Figure 1). The dominant class in the EGP-scheme consists of large employers, higher-grade professionals, and managers; this is not only a much more inclusive group than the ORDC scheme captures, but it arguably conflates the intra-class dynamics that are our point of interest here (see also Savage 2015:228–32).
Bourdieu’s theory of class fractions tends to be associated with studies of cultural consumption (e.g., Lizardo 2006), but an emerging body of research pinpoints horizontal class fractions as important divisions in the class structures of contemporary societies (for a general overview, see Vandebroeck 2018; for a recent comparative undertaking, see Atkinson 2020). For sociological understandings of class dynamics in Norway, the fractional divisions in the ORDC class categories are associated with marital homogamy (Toft and Jarness 2021), school performance (Andersen and Hansen 2012), inter- and intra-generational mobility (Flemmen et al. 2017; Toft 2018, 2019), political outlooks (Flemmen and Haakestad 2018), and residential segregation (Ljunggren and Andersen 2015). Thus, previous research demonstrates the validity of the ORDC scheme in capturing intra-class dynamics that structure social, political, cultural, and spatial divides in Norwegian society.
The Norwegian Context
The marketization narrative, as posited by Grusky and MacLean (2016:44), contends that the consequences of the high-end concentration of wealth and income for class inequality are contingent on the institutional formation of national contexts. In countries where the market has penetrated key welfare functions such as schooling, care for the elderly, and childcare, the “social fallout” will be more extensive than in more “decommodified” institutional contexts, where such services are safeguarded from market whims (see also Torche 2015).
Norway and the other Scandinavian countries constitute such decommodified contexts, as evident in the region’s universal and egalitarian policies, known as the “Nordic model” or the “social democratic welfare regime” (Esping-Andersen 1990). Significantly, the Scandinavian context is characterized by powerful unions and centralized wage bargaining, underpinning the relatively compressed wage structure compared to other countries (Barth, Moene, and Willumsen 2014). Yet Scandinavian societies do feature high wealth inequalities, seemingly a paradox in countries considered to be prototypically social democratic. How is one to make sense of this paradox?
We use the concept of “marketization” widely, encapsulating policies aimed at deregulating markets previously controlled and constrained by the state, and that encourage the privatization of public ownership, as well as market-based ideologies for managing services and companies within the public sector. During the 1980s, the Norwegian political economy changed course significantly from state interventionist instruments of regulated credit policies, redistributive tax policies, and a tightly regulated housing market, to the widescale deregulation of housing, finance, and credit markets, as well as tax relief for top earners and the business sector. According to Fagerberg and colleagues (1990:83), these initiatives gave birth to a “new speculation economy,” with ample opportunities for investment and wealth accumulation. Since then, marketized policies have been an enduring feature of Norwegian governance, and erstwhile state-run companies have been partly privatized, thus providing career and wealth accumulation opportunities for people in the highly paid, top jobs of these companies, as well as their investors. Within the public sector, there has been a turn toward new public management, and the accompanying expansion of a high-paying managerial branch has increased public sector pay inequalities since the 1990s, at an even higher rate than within the private sector (Geier and Grini 2018).
Historical trends in high-end income in Norway exhibit a u-shaped pattern, linked to growing inequalities following the deregulation of financial markets and the relaxation of taxation on capital income in the early 1990s (Aaberge and Atkinson 2010:459). Wealth inequalities have also intensified, with particular growth since the 2000s. The increase in the proportion of high-end wealth during the past two decades largely reflects the growing value of shares and other securities that are owned by the wealthiest in Norway (Aaberge and Stubhaug 2018). The accumulation of liquid assets drives high-end wealth inequalities, but the marketization of housing has arguably had the greatest effect in fostering wealth-based inequalities for the population at large. 4 Today, only one-fifth of Norwegian households own shares and other securities, whereas nearly 70 percent own their own home (Aaberge and Stubhaug 2018).
The extensive liberalization of credit and housing markets initiated in the 1980s has left Norway with a housing regime that distinguishes it from the other Nordic countries (Schwartz and Seabrooke 2009). In the 1980s, the government abandoned price regulation and low interest policies (Poppe, Collard, and Jakobsen 2016). Such conditions fostered new opportunities for debt-based consumption and stimulated asset price inflation and new inequalities related to risk and wealth accumulation. This not only propelled lucrative opportunities for the wealthiest to invest in real estate, 5 but it also means the opportunity to purchase housing and the availability of different types of housing largely depend on parental financial aid, either directly or with parents as guarantors of loans. In 2018, Norway ranked ninth globally in price-to-income, and first on rent unaffordability, in the OECD (Tranøy, Stamsø, and Hjertaker 2020). Thus, as shown in many other countries, the Norwegian housing market has witnessed a “re-familialization” of housing wealth (Adkins, Cooper, and Konings 2020; Flynn and Schwartz 2017; Galster and Wessel 2019; Tranøy 2009; Tranøy et al. 2020).
Norwegian households are also heavily in debt. The proportion of people with negative net worth is particularly high in Scandinavian countries and in the Netherlands (Maestri et al. 2014; Van Gunten and Navot 2018), and this may have a polarizing effect on inequality. On the one hand, unequal acccess to favorable types of credit has led to the concern that the Norwegian credit market “supplies already exposed households with expensive, revolving credit” and consumer loans (Poppe, Lavik and Borgeraas 2016:28; see also Fourcade and Healy 2013). On the other hand, young Norwegian adults from wealthy origins tend to have more debt than their peers from poorer families, suggesting that raising debt constitutes an investment strategy requiring access to credit (Bennetzen 2018; see also Wagner, Boertien, and Gørtz 2020).
Arguably, taxation has accelerated investment opportunities from credit-based wealth accumulation; there are generous tax deductions for mortgages, and property tax is much lower than the OECD average (Tranøy et al. 2020). Tax on dividends was introduced in 2006, but the rich have been successful in juggling types of income to ensure they face minimum taxation (Alstadsæter and Fjærli 2009). Recent tax policies will also probably stimulate wealth-based opportunity hoarding, as inheritance tax was abolished and the wealth tax was reduced in 2014.
Empirical Expectations
Norway’s turn to marketized policies may have broadened the possibilities for wealth-based opportunity hoarding. Marketization policies extended throughout the study period, and wealth inequalities in housing and liquid assets have grown rapidly since the early 1990s. We expect that these emerging conditions for wealth accumulation affected intergenerational inequalities gradually in the following decades, and that the class-origin differences will be larger in periods when wealth is more unequally distributed, that is, from the 2000s onward.
The theoretical underpinnings of our class scheme stress a capital volume dimension, as we anticipate that top income earners in the economic fraction will be the most successful in securing their children’s economic success. 6 We therefore expect individuals from upper-class economic family contexts will exhibit the strongest inclination for engaging in wealth accumulation, although the re-familialization of housing wealth could mean class-origin wealth gaps persist across the class structure.
Given the “insurance function” that may well flow from economically privileged origins, we expect such children to be additionally cushioned from the inherent tension between investment and risk that is emblematic of credit acquisition (Beckert 2016). Thus, we anticipate that measures of gross worth will be more informative when attempting to understand class-origin wealth gaps than net worth.
The importance of educational credentials in mediating class reproduction may also be effective in wealth accumulation; not only can educational credentials ease access to the highest-paying jobs and opportunities for savings, but within selective business schools, children of the economic upper class may gain useful knowledge about investment practices and form social ties with fellow alumni that subsequently propel wealth holdings (Pinçon and Pinçon-Charlot 1999:222). Moreover, educational credentials may have a signaling effect that could ease economic investment opportunities or the acquisition of credit from banks. However, because income inequalities are conditioned to a greater extent on the labor market and thus on credentials, we expect the mediating function of education to be greater in understanding class-origin income gaps than class-origin wealth gaps.
Data, Variables, and Analytic Strategy
The richness of the population-wide Norwegian administrative data we have available offers an unprecedented opportunity for analyzing the relationship between class origins and income and wealth attainment over a quarter of a century, from 1993 to 2017. This period starts in the wake of the deregulation of housing, financial, and credit markets, as well as strategic sectors, and extends to a period during which inequalities in income and wealth increased.
Our analyses are based on Norwegian cohorts born 1955 to 1980. We compiled information from four main registers recording wealth, education, occupation, and income, and the data include demographic parent-child linkages. 7 For each birth cohort, we observe income and wealth as the three-year average at ages 37 to 39. This means, for example, that for the year 2000, we calculate the 1999 to 2001 mean income, or the wealth of individuals born in 1962. 8 We chose these ages because people tend to be established in their careers by then, and we can still link the oldest cohort to their parents in the datasets we have available. Arguably, these ages are better to use if one wishes to grasp inequalities in income (rather than wealth, which is more likely to accelerate over the life course), so we perform sensitivity analyses among people who are 10 years older (age 47). These analyses are restricted by the information available about parents, and allow for analyses only for years 2002 to 2017. The main patterns are corroborated by the restricted sample at older ages, suggesting class-origin differences in wealth manifest by the late 30s (see Appendix Figures A1, A2, and A3).
In contrast to self-reporting surveys, the data reflect unusually high levels of reliability, as they rely on information reported by banks, employers, education institutions, and public officials. The richness of the data from these population registers allows us to study potentially important groups, such as the top-level classes, that are too small to be identified by ordinary-sized surveys.
Dependent Variables: Income and Wealth
To enable comparisons of class-origin income and wealth gaps over time, we relativize all outcome variables separately for men and women, and study the percentile position, or rank, attained at ages 37 to 39 in the same birth cohort.
The measure of income includes earnings, business income, and capital income. Not only may economic remunerations from the labor market consist of other forms of income than wages or salaries (Hansen 2001), but one may also earn a living on capital investments. We assembled this information from the register on taxable income. Both business income and capital income may take negative values, and we omitted observations if the composite income measure was zero or below. However, this applies to a very low proportion of the population, especially because income is averaged over three years and includes interest income from bank savings. Less than 1 percent of the men and less than 3 percent of the women have incomes at zero or below. Information about wealth comes from the Norwegian tax register, which offers many advantages in a comparative perspective. Incomplete information is a frequent difficulty with tax data, for instance, if reporting is limited to individuals whose wealth is large enough to be subject to taxation (Medeiros and de Souza 2015). Such issues are avoided here: even small amounts of wealth are registered in the Norwegian wealth register, because banks report all values in people’s accounts to the tax authorities. The vast majority of adults have bank accounts, so we have wealth data on more or less the whole population.
We include two main types of assets: taxable real capital and finance capital. Real capital includes real estate, land, and ownership of unincorporated businesses. Finance capital includes holdings of bank accounts, stocks, and bonds. All debts are also included. Neither consumer durables nor the value of future pensions are included in the wealth register.
As outlined earlier, there may be important class-origin differences in the likelihood of debt channeling wealth accumulation. Therefore, we analyze class-origin differences in gross and net worth. Gross worth is the sum of real capital and finance capital, as they appear in the tax register. Net worth is the same sum after debt (including mortgages) is deducted.
As with most other data on wealth (see Davies 2009), undervaluation is a problem in the Norwegian wealth register. Importantly, the taxable value of real estate does not reflect its market value, and the value of unlisted stocks is underestimated. To correct as far as possible for the undervaluation of real estate, the value is adjusted upward, based on estimates of the relationship between the taxable value and the market value of real estate. 9 The undervaluation of stocks is not adjusted, so the wealth of the richest is most likely underestimated.
Classification of Class Origin
Following the theoretical reasoning outlined in the previous sections, we use the Oslo Register Data Class scheme (ORDC) to measure class origin (see Hansen et al. 2009). The online supplement provides the ORDC classification when relying solely on ISCO; this allows for an operationalization of the class scheme for international and survey data. Depending on parental age, we measure class origin by drawing on either the 1970 or 1980 census, or the registry data on occupations from 2003. 10 Class classification for the censuses relies on the Nordic Classification of Occupations (Nordisk Yrkesklassifisering [NYK]), which has now been replaced by the Norwegian version of ISCO. There may be some comparability issues, as our registry data and census data draw on different occupational classifications. To assess such issues, we performed sensitivity analyses that rely on only one occupational classification for the limited time periods in which each classification can be applied to people at the end of their 30s. These sensitivity analyses corroborate our conclusions based on combining data from different sources.
We use a “dominance approach,” so class origin is based on the parent with the highest class (Erikson 1984). We thus avoid classifying families based solely on fathers, which reduces the effect of class origin (Beller 2009). If parents belong to different fractions of a class, an economic dominance approach favors the economic fraction over the cultural or balanced fractions. Because we are interested in class-origin differences, all results are limited to the Norwegian-born population due to a lack of parental data on immigrants.
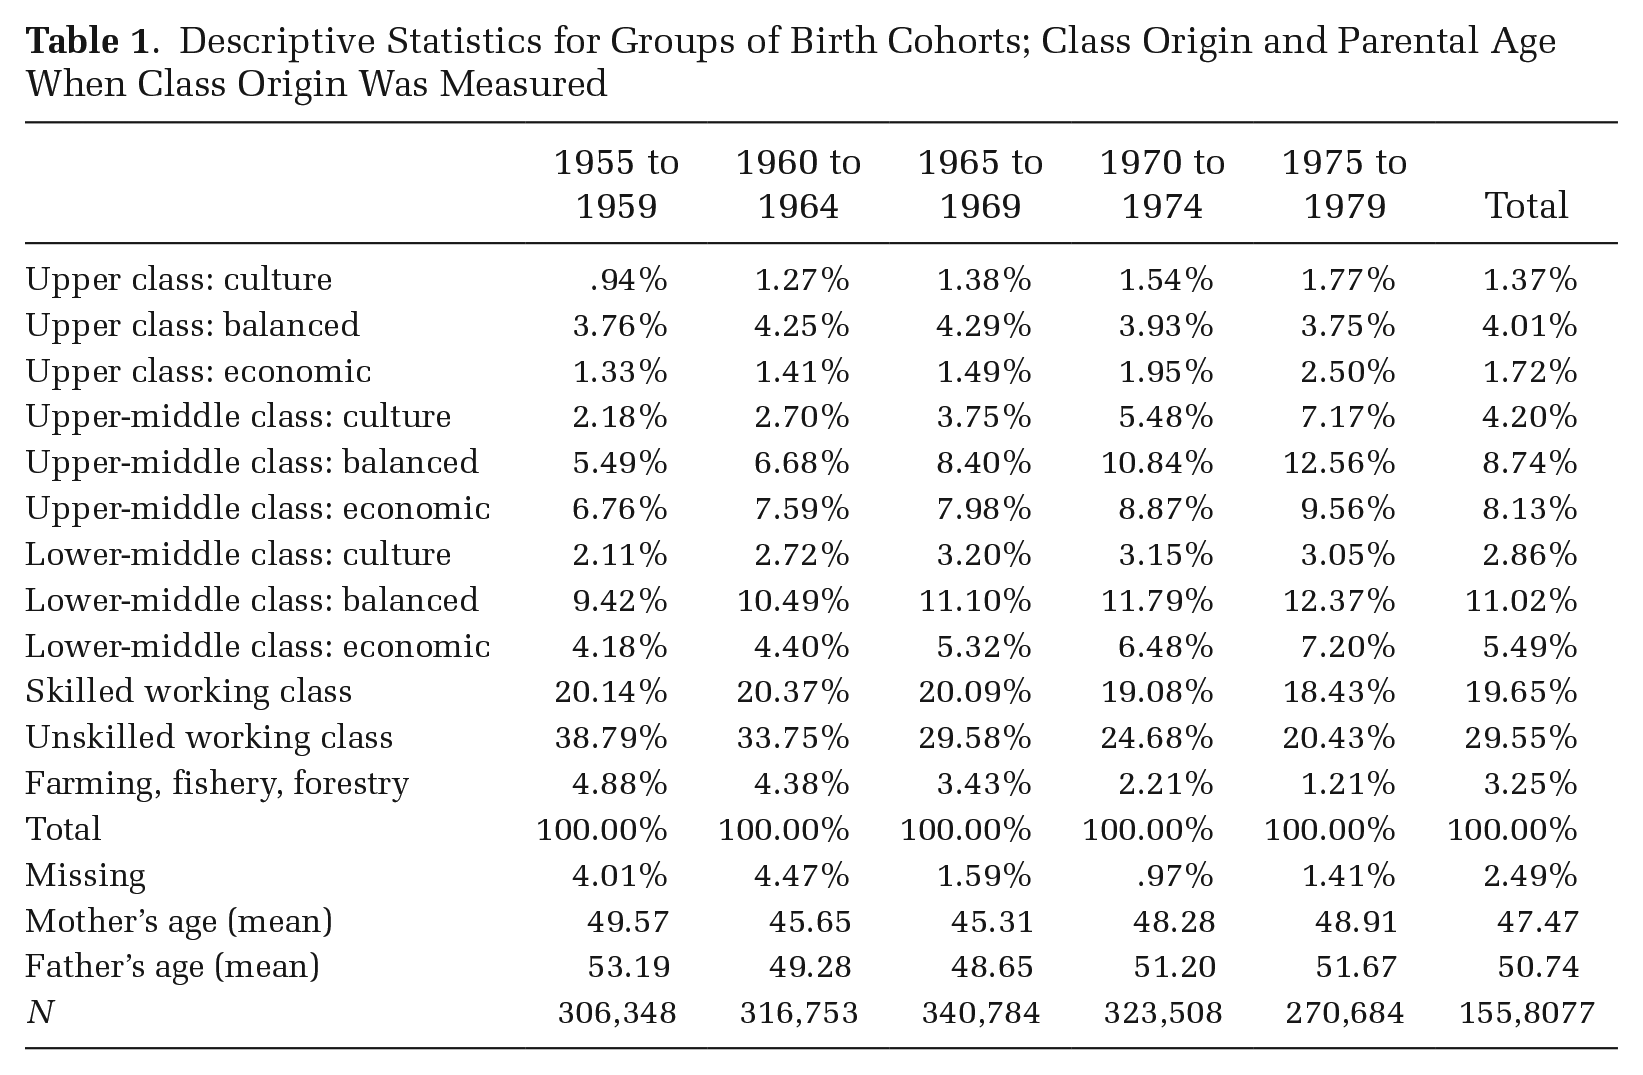
Table 1 shows the distribution of classes across cohorts, as well as parents’ mean age when class is measured. Individuals with missing occupations are not included—about .4 to 3.3 percent, varying somewhat between cohorts. The class structure has changed over time: the proportion whose parents are unskilled workers or engaged in the primary industries has steadily declined, and there is a systematic increase in the upper- and upper-middle-class fractions.
Descriptive Statistics for Groups of Birth Cohorts; Class Origin and Parental Age When Class Origin Was Measured
Analytic Design
To assess change over time, we estimate, at the same ages and separately for each birth cohort, the class-origin gaps in the percentile rank of income, gross worth, and net worth. All analyses are performed separately for men and women to take heed of gender differences in the labor market and possible differences in tendencies for wealth accumulation between the genders. As the outcome variables are continuous, we use ordinary least squares regression (OLS). Information about class origin is available for a restricted set of years, and because parents’ class positions are likely to be linked to their occupational careers, we control for parental age (and age squared). Our results plot the class-origin coefficient from the 25 regression analyses (one for each of the 25 birth cohorts), with unskilled working-class origin as a baseline.
First, we study vertical class differences to assess whether intergenerational inequalities increased over time, and whether these trends diverged in terms of income and wealth. In the first step, we only differentiate between the upper class, the upper- and lower-middle class, and the skilled working class compared to the unskilled working class. In the second step, we study whether such trends diverged between individuals who grew up in families privileged by cultural as opposed to economic capital by studying intra-class differences within the upper and upper-middle classes. Here, we visualize the fraction-specific estimates for the upper and upper-middle classes, relative to the unskilled working class.
We then investigate how educational inequalities mediate wealth and income gaps and how this has evolved over time. We map the relative importance of such educational strategies for the sons and daughters of the three upper-class fractions compared to the unskilled working class. We account for both the level and field of study, which prior work shows are important channels for understanding class-origin pay gaps (Hällsten 2013; Hansen 2001). As far as level is concerned, we distinguish between primary schooling, some secondary schooling, secondary-level diplomas, and university-level degrees, attained by age 30. We further distinguish between the following fields in university-level education, based on the Norwegian standard classification of education: (1) humanities and arts, (2) education, (3) social sciences and law, (4) economic and administrative fields, (5) natural science and engineering, (6) health and welfare, (7) agriculture, forestry, and fishing, (8) transport and security, and (9) undefined fields (including cross-disciplinary degrees). The combination of level and field amounts to 27 specific types of education.
By analyzing class-origin differences in the percentile rank, we can study trends while disregarding differences in the evolution of income and wealth distributions over time. To study inequalities in the amounts of assets accrued by individuals of different class origins over time, we logarithmically transform the variables instead of relying on the percentile ranks. We then calculate the annual percentage differences in income, finance capital, and gross worth for the children of the three upper-class fractions relative to the unskilled working-class baseline. We pay particular attention to the accumulation of liquid assets, as the increase of high-end wealth in recent years is driven by the value of shares and other securities.
Results
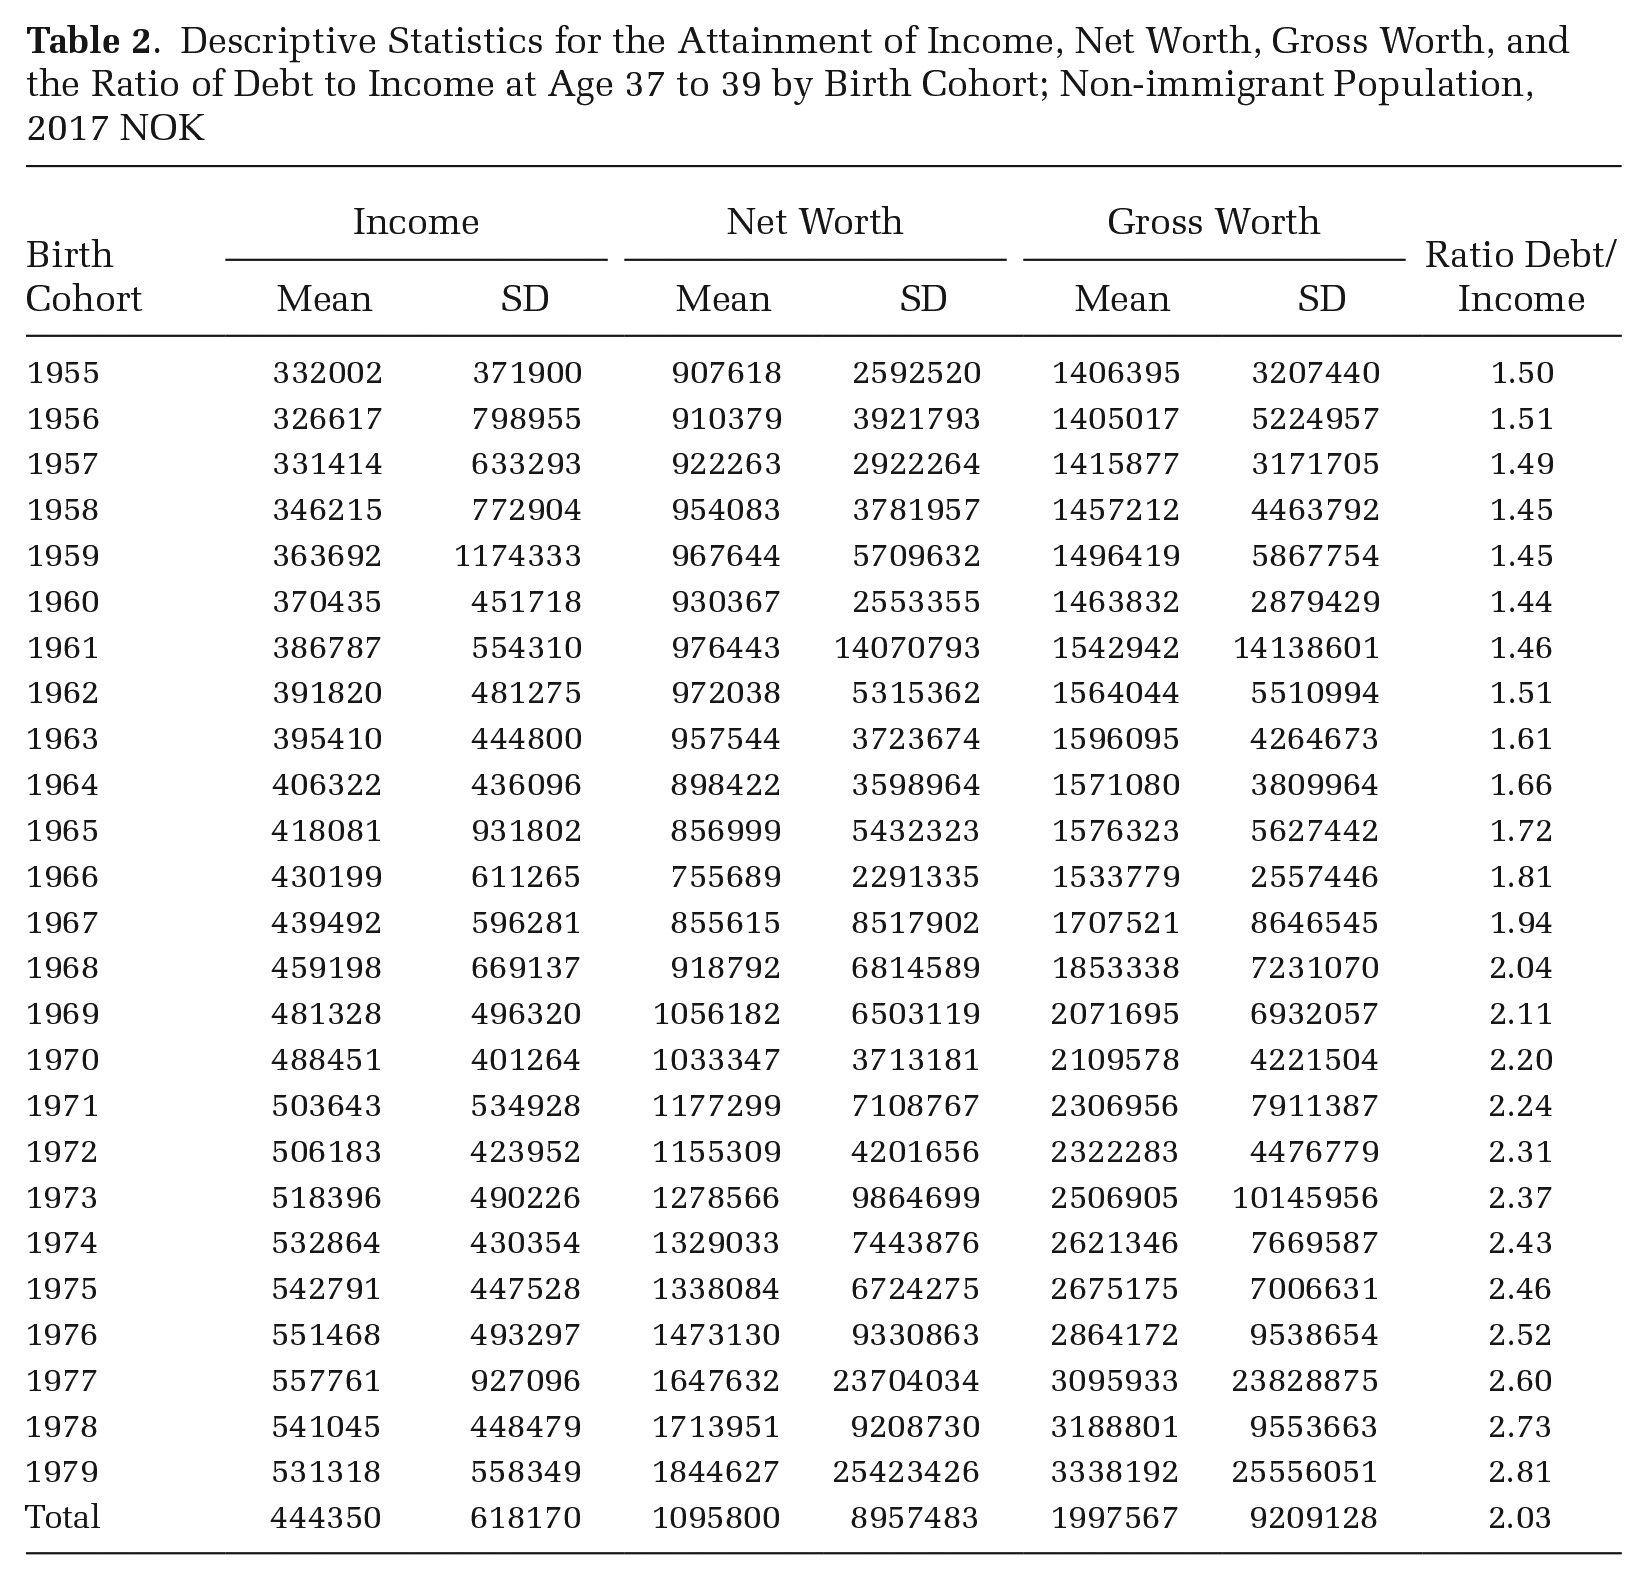
Table 2 shows changes in the mean levels of income, net and gross worth, and their standard deviation, attained at the age of 38 (mean values 37 to 39) for all 25 birth cohorts (adjusted to 2017 currency values). We also estimate the ratio of debt to income. The mean values tend to increase steadily across birth cohorts. The standard deviations are quite large for some cohorts, indicating the distribution of wealth is especially unequal in these groups, due to the presence of some very rich individuals. The effect of such outliers is minimized in our analyses based on percentile positions, because the position is the basis of comparison, not the levels of income or wealth. As for the debt/income ratio, 38-year-olds are increasingly in debt during this period, with a ratio of 1.5 in 1993, and a ratio of 2.8 in 2017.
Descriptive Statistics for the Attainment of Income, Net Worth, Gross Worth, and the Ratio of Debt to Income at Age 37 to 39 by Birth Cohort; Non-immigrant Population, 2017 NOK
Vertical Class Differences
Figure 2 shows how class-origin income and wealth gaps evolved for men and women over time when differentiating between vertical class levels. The lines illustrate the difference between estimated levels attained by individuals originating in the upper class, upper-middle class, lower-middle class, and the skilled working class relative to unskilled working-class origins. Figure 2 clearly illustrates that the past 25 years saw a steady increase in class-origin wealth inequalities as a distinct feature of the opportunity structure in Norway. For example, by 2017, the sons of the upper class rank about 21 percentile points higher than the sons of the unskilled working class in gross worth, an 11 rank-point increase since 1993. Among daughters, the differences are slightly larger, amounting to a 25 percentile rank advantage, which is a 10 rank-point increase since 1993.
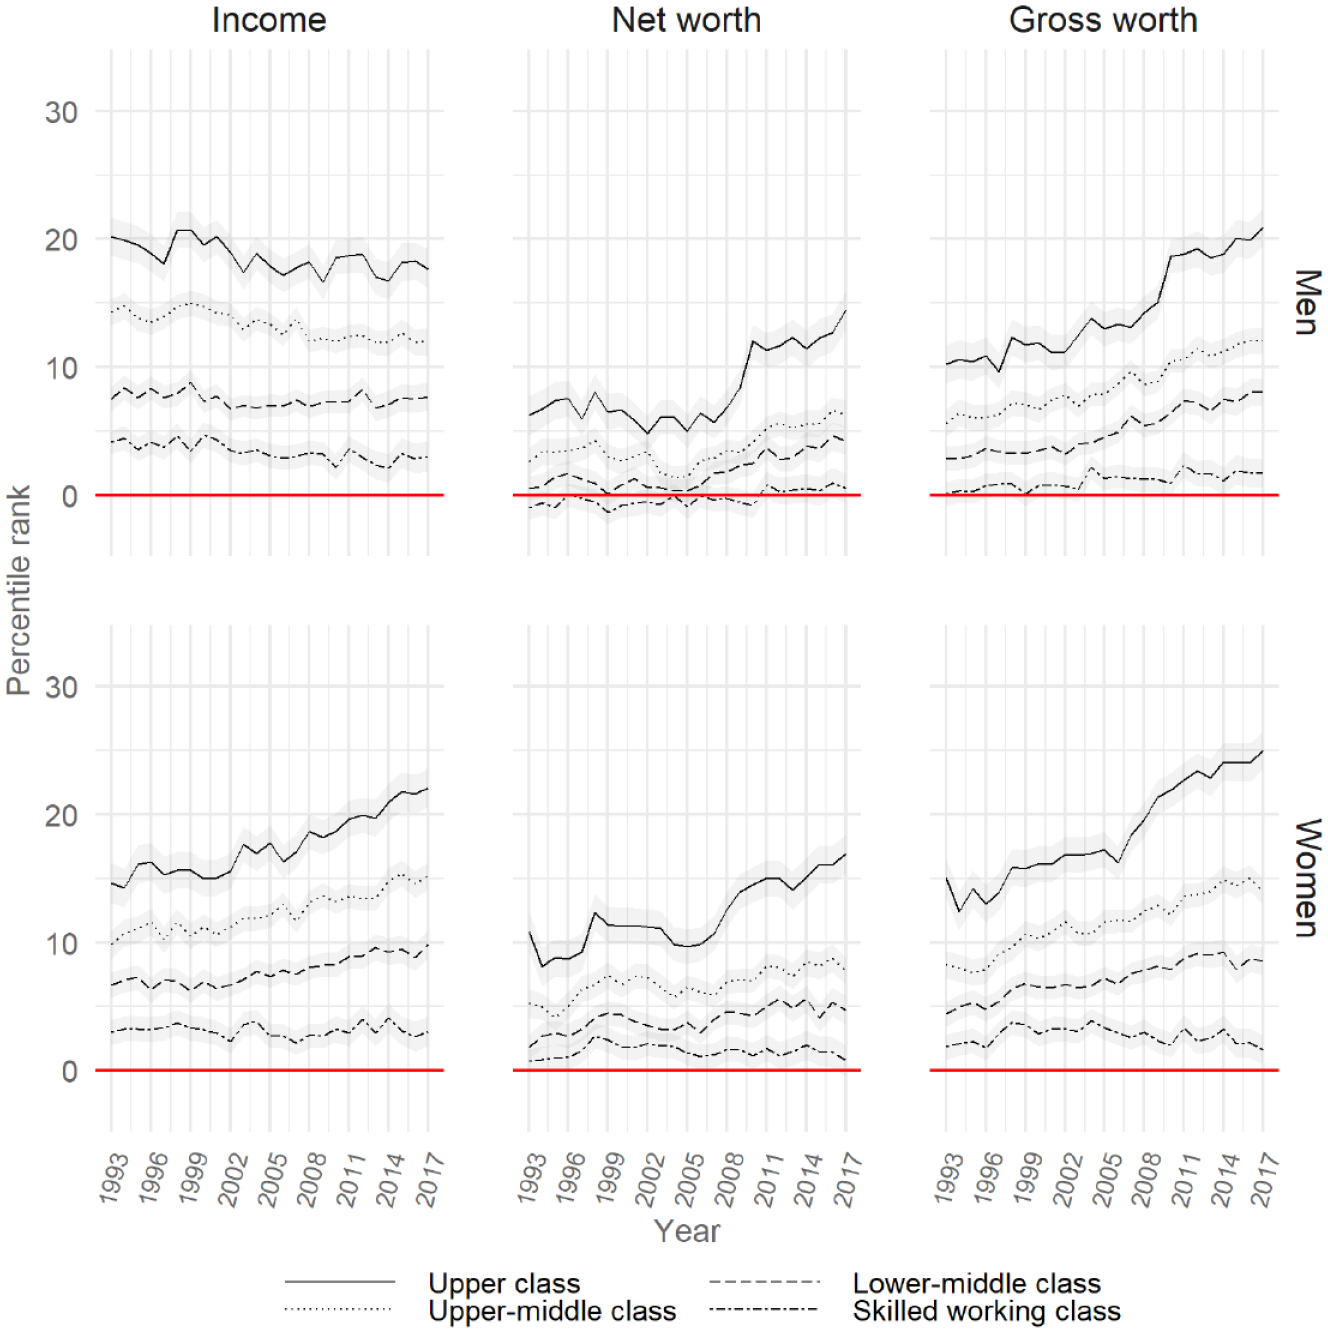
Vertical Class-Origin Differences in the Attainment of Income, Net and Gross Worth
The results testify to the association between class backgrounds and economic rewards; we see that the volume dimension in class origins is associated with higher attainment of income, net worth, and gross worth. However, the trends are different for income and wealth. At the beginning of the period, class-origin gaps in wealth attainment were much lower than for income attainment, whereas at the end of the period, class differences in gross worth are significantly higher than those observed for income. Moreover, class-origin income gaps seem fairly stable over time among men, whereas income attainment among women became more stratified by class origin during this period. Notwithstanding this upward trend, we find the relative growth in wealth inequalities to be more profound among women. Over and above this difference, however, the trends and sizes of the estimates are remarkably similar for both genders.
The trend in class-origin differences grew over the period, but we see a particularly steep increase after 2005, probably due to class-origin differences in responses to the 2006 tax reform that introduced taxation on shareholder incomes. This reform was announced in advance, so there was a huge increase in dividend payments; this had a large effect on measurements of economic inequality in Norway (Aaberge and Atkinson 2010; Alstadsæter and Fjærli 2009). Individuals from upper-class families may be more likely than others to receive dividend payments or be beneficiaries of inter-vivos transfers from shareholder parents who had received large payments. After this increase, however, the class-origin gaps in gross worth remain high in the following years.
Finally, Figure 2 suggests class-origin differences in wealth attainment are more pronounced when gross worth, rather than net worth, is studied. Arguably, this points to the uneven likelihood of having debt, and suggests children of the upper, upper-middle, and lower-middle classes are disproportionately more likely to be in debt compared to children of the unskilled working class.
Horizontal Class Differences
To shed light on horizontal class differences, Figures 3 and 4 zoom in on upper-middle and upper-class origins for men and women, respectively. We find that important differences are glossed over in Figure 2. For both measures of wealth, sons and daughters of economically privileged families accumulate the most wealth. A turn to wealth-based opportunity hoarding seems evident for all classes relative to individuals from unskilled working-class origins, but the assets accrued are much larger among children of the economic fractions. Among men, we also find a clear horizontal logic to class-origin differences in income attainment, whereas income attainment for daughters is not stratified by horizontal class divisions.
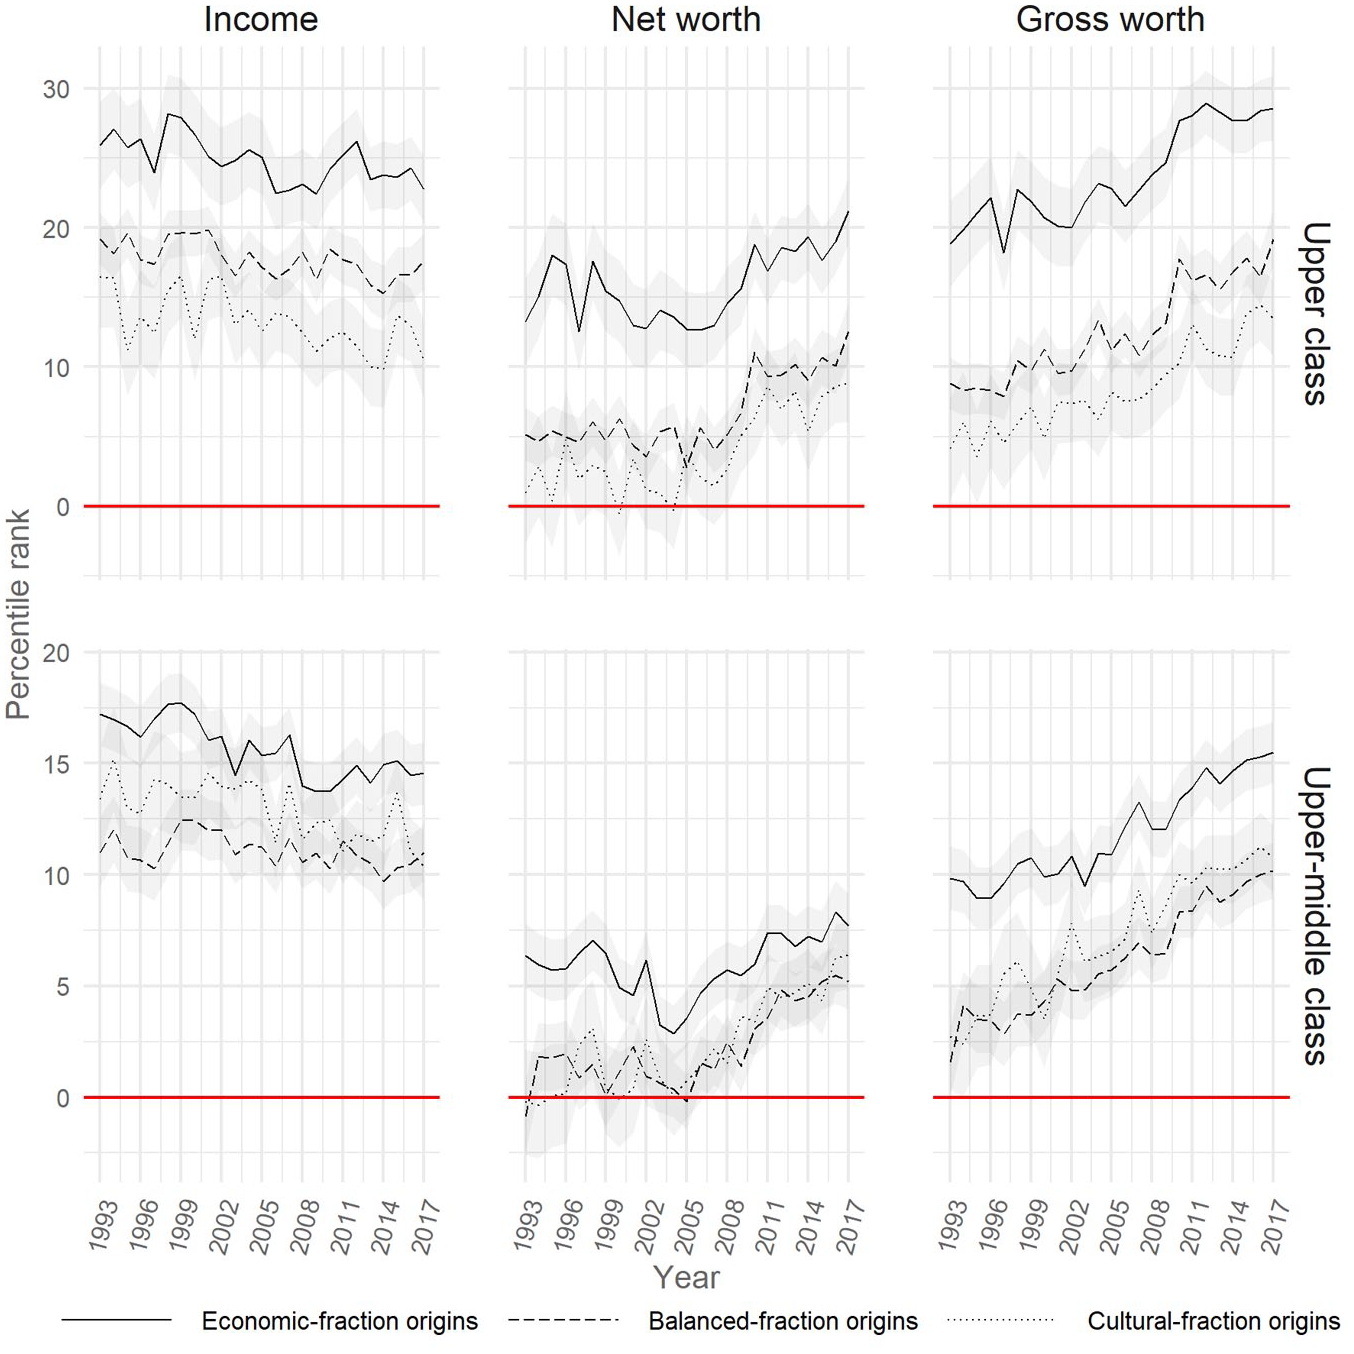
Horizontal Class Differences in the Attainment of Income, Net and Gross Worth for Men
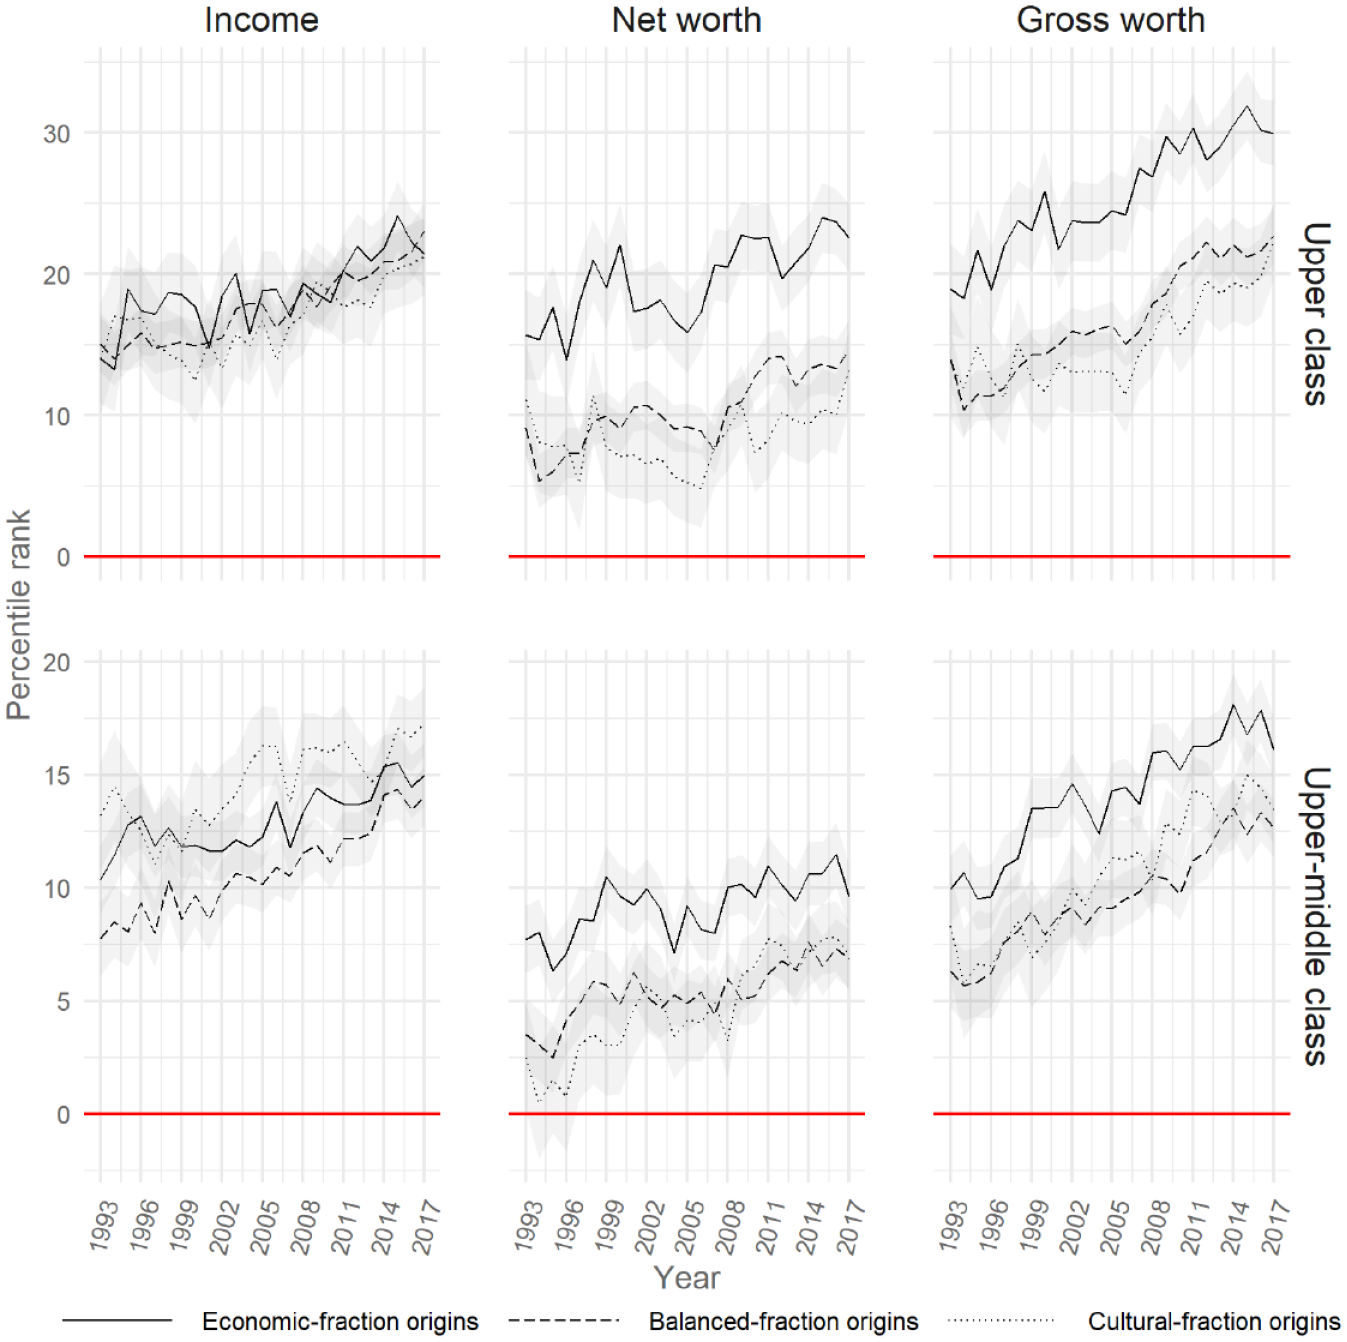
Horizontal Class Differences in the Attainment of Income, Net and Gross Worth for Women
Figures 3 and 4 suggest that, during these 25 years, children of the economic fractions of the upper-middle and upper classes were particularly successful in wealth-based opportunity hoarding. From 1993 to 2017, their relative ranking in the distribution of gross worth increased steeply compared to the wealth attainment of individuals from unskilled working-class origins (for both genders with economic upper-class origins, the rank advantage increases from about 20 to about 30). However, the wealth gaps between the upper-middle and unskilled working classes also systematically increased during this period.
The Mediating Importance of Educational Attainment
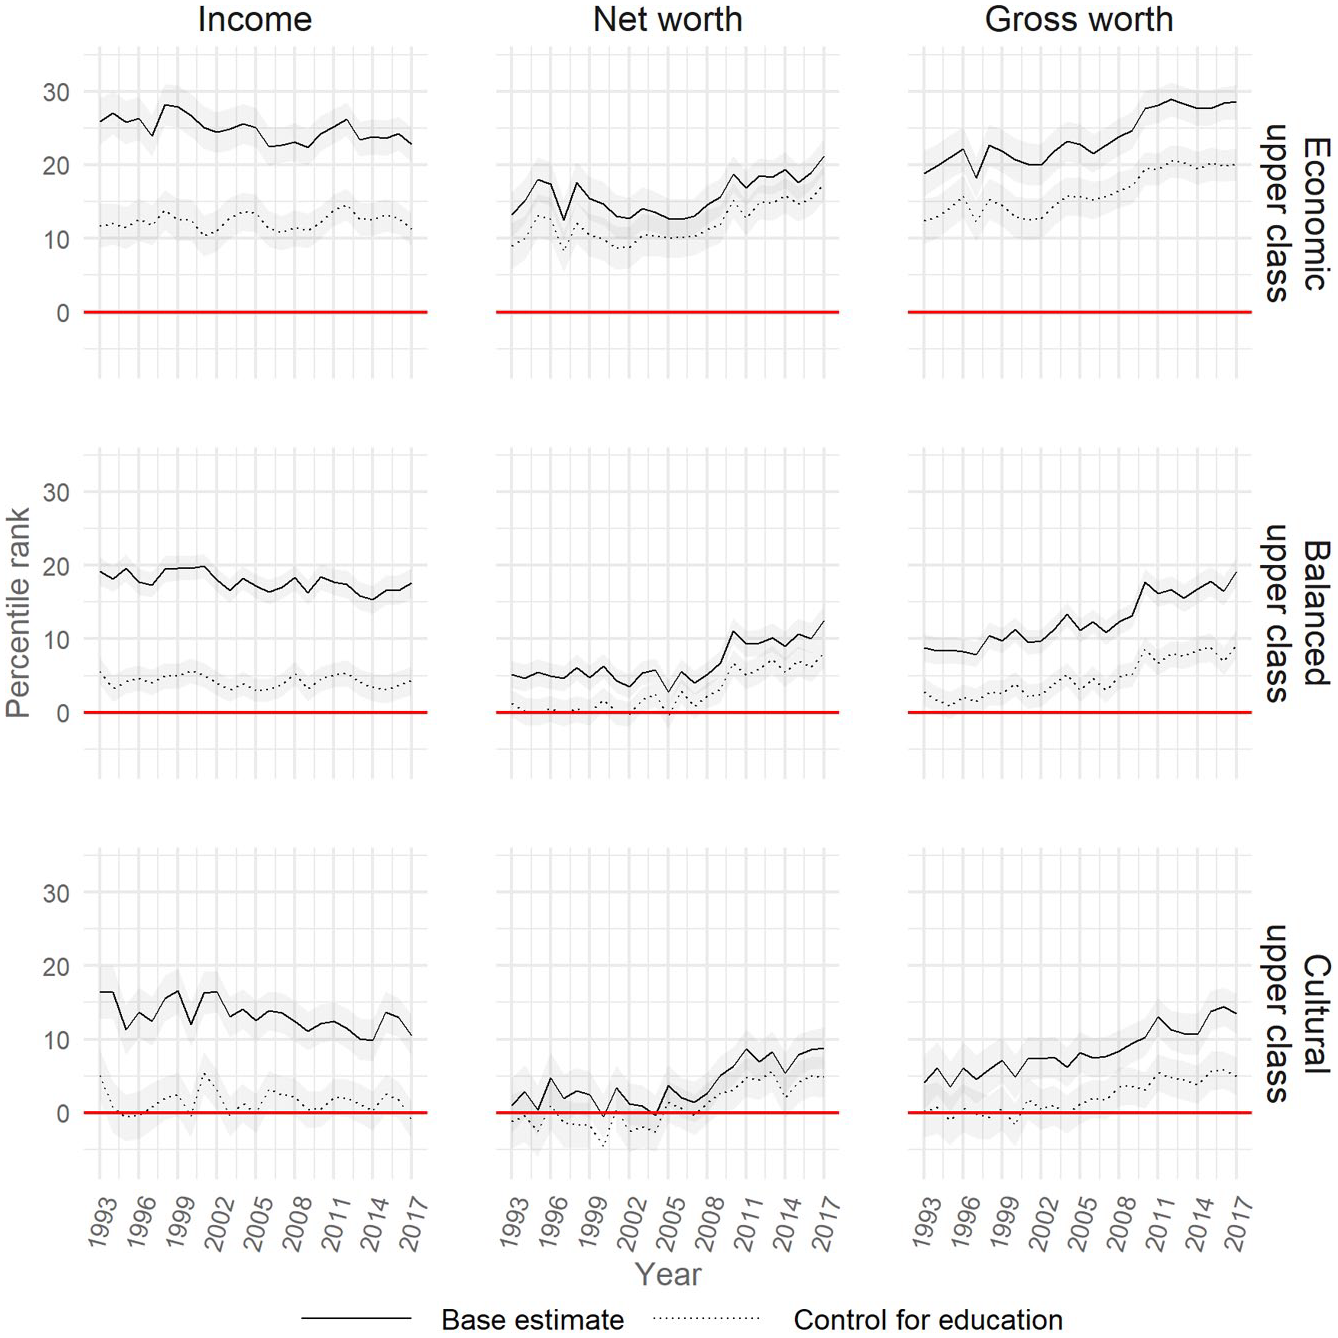
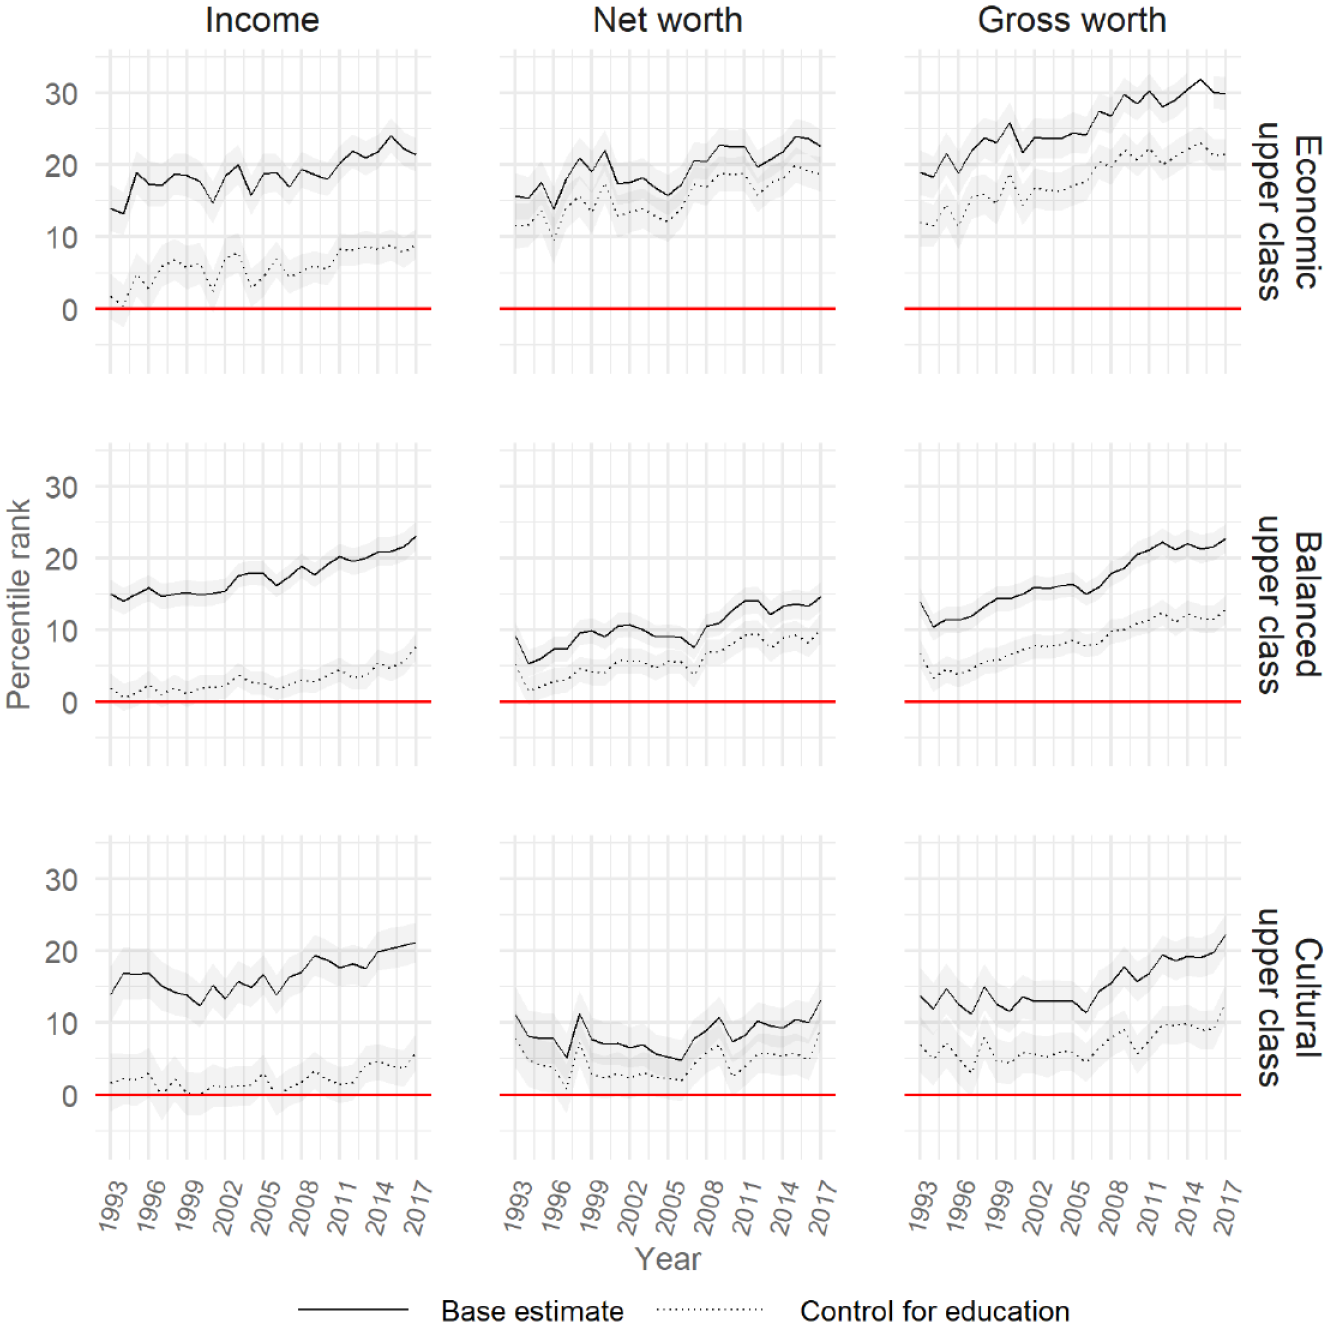
We now turn to the question of educational credentials in channeling class-origin differences in economic attainment. We have established clear vertical differences, where upper-class origins are distinct in all outcomes, as well as important horizontal divisions along class fractions, so we shall now zoom in on the relative advantages accrued by children of the upper class. Figures 5 and 6 show, respectively for men and women, how estimates for class-origin wealth and income gaps are affected by controlling for the level and field of education.
Percentile Rank of Income, Net and Gross Worth for Men, Controlling for Education
Percentile Rank of Income, Net and Gross Worth for Women, Controlling for Education
Again, we find remarkable similarities for women and men. Figures 5 and 6 reveal two main findings. First, class-origin inequalities in wealth attainment are barely channeled by educational credentials, whereas differences in income are driven to a larger extent by educational differences. Moreover, additional analyses indicate that personal earnings are no more efficient than education in explaining class-origin wealth gaps (see Appendix Figure A4). The mediating effect of education on income attainment seems fairly stable over time. To some extent, the differences between income and wealth attainment appear unsurprising. Given that credentials through licensing constitute a key closure mechanism used by occupational groups in high-paying positions (Weeden 2002), it is understandable why income attainment, to a larger extent than wealth attainment, is channeled through educational differences. When comparing gross and net worth, however, education seems to increasingly mediate one’s capacity for debt-driven wealth accumulation. This appears particularly so for children of the balanced fraction (e.g., elite professionals and senior civil servants).
Second, for income, Figures 5 and 6 also suggest the mediating function of educational credentials differs for individuals from different fraction-specific origins. For instance, education seems particularly important in understanding income discrepancies between people from unskilled working-class origins and the children of parents privileged by cultural capital or a more balanced capital portfolio. For most years, the economic advantages accrued by children of the culturally privileged upper class become insignificant when educational attainment is controlled for.
Beyond Rank: Percentage Differences in Assets and Income
Thus far, we have relativized the distributions of each outcome to compare class-origin differences over a 25-year period and across different economic outcomes. Our analyses testify to notions of increasing class-based opportunity hoarding via wealth accumulation. To shed light on the levels of assets accrued by children of the upper class, we next logarithmically transform income and wealth, and we explore how intergenerational inequalities are expressed in percentages. To study differences in the accumulation of liquid assets, we decompose our wealth measure into finance capital and compare it to gross worth and income.
Three main findings emerge from Figure 7. First, the figure demonstrates the vast distributional differences between the different types of economic capital. In particular, it underscores the enormous values found in liquid assets. For instance, in 2017, sons of the economic upper class ranked 23 percentile points higher in the distribution of income than sons of the unskilled working class. This amounts to a difference of about 130 percent. In the distribution of gross wealth, the rank discrepancies amount to 29 percentile points, yet we find very large differences in percentages, particularly for assets held in the form of finance capital. In their late 30s, sons of the economic upper class owned finance capital worth 700 percent more than the average held by sons of the unskilled working class. Such discrepancies are much smaller for income.
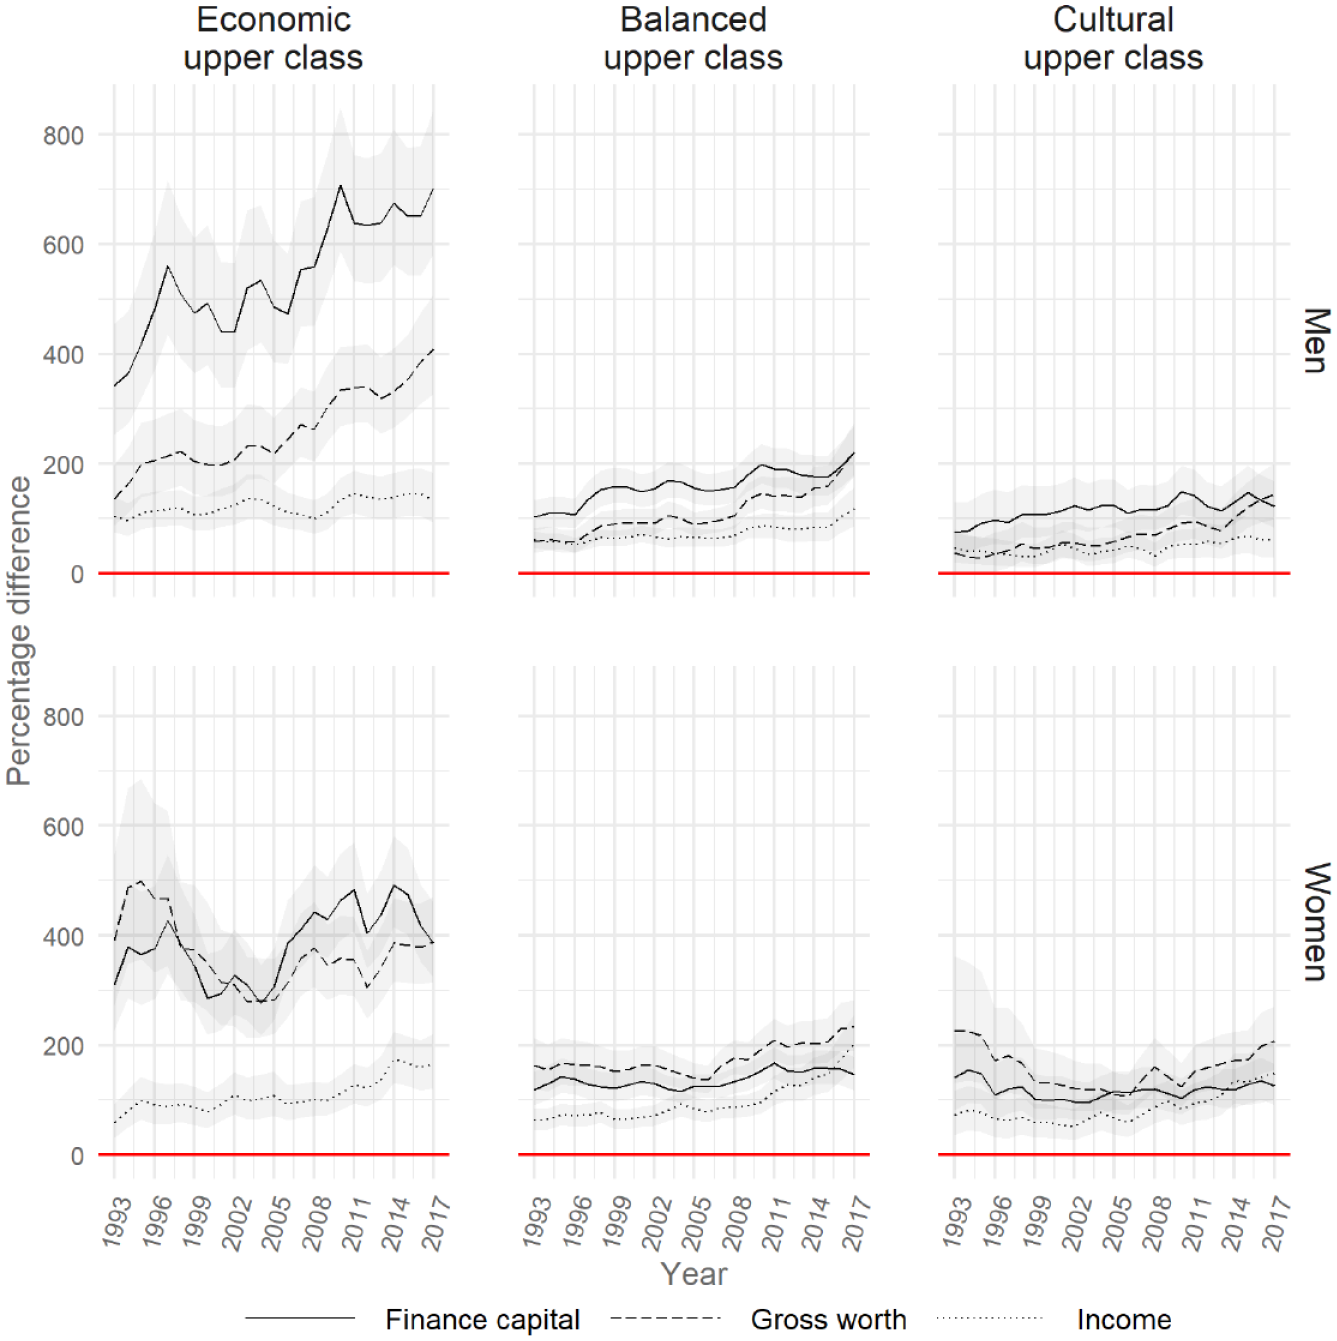
Percentage Difference in Income, Finance Capital, and Gross Worth for Sons and Daughters of the Three Upper-Class Fractions Compared to Unskilled Working-Class Origins
Second, Figure 7 reveals important differences between children born to families privileged by economic or cultural capital. In particular, it is children of the economic upper class who accumulate the most finance capital and gross worth, and their tendency to do so increased enormously in recent years. Finally, we find interesting gender dynamics. Daughters of the economic upper class are distinct from the remaining upper-class fractions in the size of their relative holdings of economic capital, but in contrast to sons of the economic upper class, this is not particularly the case for financial capital.
Discussion and Conclusions
In light of the concentration of affluence documented by interdisciplinary research, we agree with Grusky and MacLean’s (2016) call to abandon the dominant framework of “modernization theory” as a yardstick for understanding the nature of contemporary inequalities. Their proposed “marketization narrative” brings market dynamics to the very heart of understanding why inequalities arise and how intergenerational inequalities play out. Whereas they emphasize class inequalities in accessing services, and the dire social consequences this leads to, we place more emphasis on the way marketization may broaden opportunities for wealth accumulation in a country such as Norway. To date, most key services, such as education and health, remain universal and are thus decommodified, yet a significant shift in governance toward the market has been persistent over the past three decades, and these conditions, we argue, raise questions about wealth-based opportunity hoarding.
Since the 1990s, wealth and income gaps have been clearly stratified by class origin; children of the upper classes, followed by those of the upper-middle and lower-middle classes, tend to achieve higher income and wealth than do children of the unskilled working class over the period. In particular, children whose parents are directors, chief executives, proprietors, rentiers, or who have other senior positions in business or finance, accumulate the most wealth and have the highest incomes. Thus, just as families rich in cultural capital are the most successful in educational attainment (Andersen and Hansen 2012; Hansen and Mastekaasa 2006), families rich in economic capital are the most successful in reaping economic rewards. Our analyses also draw attention to the way inequalities are channeled through debt, as our comparison of gross and net worth clearly demonstrates. Debt is likely to propel inequalities by providing high-interest consumer credit to the most vulnerable and by facilitating debt-based accumulation by the advantaged.
Class-origin differences in wealth have expanded over the period, in particular since the mid-2000s, while class-origin differences in income have changed less dramatically. The findings for income among men corroborate existing research on the relationship between growing inequalities and intergenerational mobility (DiPrete 2020), and we contribute to this literature by highlighting the centrality of wealth for propelling inequalities in recent times.
In 2017, men and women in their late 30s originating in the economic upper class could, on average, expect to rank almost 30 percentiles above people with unskilled working-class origins in the distribution of gross worth. A quarter of a century earlier, the class-origin gap in gross worth amounted to two-thirds of this gap. These trends seem to particularly reflect liquid assets, as the worth tied to fixed assets, such as real estate, is much less than the profound levels of worth owned as finance capital. The sons and daughters of the economic upper class are particularly likely to accumulate finance capital; by 2017, their financial assets were worth 700 percent more than those of sons of the unskilled working class, and about 400 percent more than daughters of the unskilled working class. During the study period, the wealth gaps for the middle classes also intensified, and within the upper-middle class, individuals with economic-fraction family backgrounds were the most likely to accumulate wealth in recent years.
The class-origin gaps in wealth are remarkably similar for men and women. One difference between the genders, however, can be seen in income: whereas class-origin gaps in income are stable or even decreasing for men, they are increasing for women. These gender differences are most likely the result of women’s increasing involvement in the labor market, leading to greater differentiation between female employees. In addition, gender dynamics seem to be at play for the likelihood of owning high-end financial wealth. Sons of the economic upper class own the most liquid assets, and the differences among women are comparatively smaller.
How should the class-origin gaps in wealth be explained? One possibility is that educational inequalities stratify access to the highest-paying jobs that, in turn, enable wealth accumulation. After all, the mediating importance of the education system in lubricating class reproduction is one of the most dominant notions in class analysis. However, our results debunk this, as educational controls, as well as labor market returns (see Appendix Figure A4), affect the association between class origins and wealth attainment only to a very limited extent, although to a slightly higher degree when measuring gross worth. In contrast, we find that education is more important in channeling class-origin income gaps, and our results point to the persistence of the mediating function of education in income inequality over time. Economic capital in the form of income seemingly indicates the effectiveness of the “school-mediated mode of reproduction,” whereas economic capital in the form of assets seemingly indicates the effectiveness of the “family mode of reproduction” (Bourdieu 1996).
These trends have important ramifications for the efficacy of existing tools for social democratic governance in Norway. Although our class-origin estimates are high for both income and wealth, the percentage differences are much more unequal for wealth, reflecting the relatively compressed distribution of income in Norway. Income gaps are immanently related to labor market dynamics, and are often mediated through educational differences. Although both labor market dynamics and education policies are shaped by social democratic governance, class-origin wealth gaps seem to operate more autonomously from such institutions. Our evidence of increasing class-origin wealth gaps in Norway suggests wealth-based opportunity hoarding is rather resilient to many of the most highly favored political tools for redistribution, such as instruments for democratizing university attendance and centralized wage bargaining. Instead, such modes of reproduction may be thriving as opportunities for credit, housing wealth, and financial wealth are broadening in the wake of more highly marketized tools of governance.
The relative neglect of the importance of wealth in a country such as Norway is problematic, not only because the magnitude of its sovereign wealth fund makes Norway a dominant actor in global financial markets, but also because wealth has emerged as increasingly pivotal for national opportunity structures. The conventional emphasis on income and education steers one’s attention toward dynamics that are implicated in social democratic governance, and it feeds into narratives of Scandinavian exceptionalism (Andrade and Thomsen 2018; Corak 2013; Jäntti et al. 2006). 11 The alternative narrative of market governance and the acceleration of wealth looms large in more somber imaginaries, however.
There are some important caveats to our analyses. We argued that increasing investment opportunities and rising housing price inflation, in the wake of the turn toward marketization in the 1980s, probably gradually bolstered the class-origin wealth gaps we observed. However, an alternative explanation may be linked to the macroeconomic conditions during this period. In particular, at the beginning of the 1990s, following the initial phases of deregulation (Mjøset 2011), Norway underwent a banking crisis and a currency crisis that profoundly destabilized the economy, affecting banks, businesses, and private households alike (Tranøy 2009). If children of the upper classes suffered disproportionate losses at this time, the lower levels of class-origin wealth gaps in the early years of our observational window could reflect these macroeconomic conditions. However, there seem to be few indications of such possible biases during the economic crisis of 2008, although, admittedly, the effect on the economy was less profound.
Another limitation of our analysis pertains to problems with the undervaluation of wealth. We already noted that the value of unlisted stocks is underestimated in the tax register we used in our analyses. In addition, assets may be hidden offshore to evade tax. Alstadsæter, Johannesen, and Zucman (2019) estimate that Scandinavian households possessing the .01 top wealth evade approximately 25 percent of their taxes. Thus, although tax data may be regarded as the most reliable record of high-end wealth, these data may still profoundly underestimate class-origin wealth gaps between children of the economic fraction of the upper class and the unskilled working class.
Finally, our analyses offer few detailed explanations about the precise mechanisms that drive our results, and their consequences for relations of power and domination. This leaves some important questions for future studies. What are the different dynamics that produce intergenerational inequalities in housing wealth as opposed to financial wealth? Are families advantaged in different ways in their accumulation of different types of wealth, for instance by providing social networks; access to legal, consultancy, and wealth management services; a dispositional ease in investment and risk-taking; or by directly transferring economic assets? Beyond the clear inclination for liquid ownership among children of the economic upper class, are there additional differences in types of wealth, such as bank deposits, listed shares, stock funds, money market funds, and so forth? How is wealth-based opportunity hoarding implicated in the potential to exert power that flows from different assets, such as the difference between owning assets that imply a majority control of company shares versus diversified ownership?
Moving from the specific Norwegian case at hand, our analyses may form a fruitful basis for class analysts to investigate whether wealth accumulation is taking center stage in structuring current life chances in other countries. Although we think it probable that our findings may bear a resemblance to conditions in other societies, wealth inequalities are likely contingent on societal institutions (Torche 2015). In particular, it would be interesting to study wealth-based opportunity hoarding in countries such as the United States, where the market has more successfully penetrated a wide array of societal domains. The increasing exclusion of the vulnerable from wealth is likely to severely affect their access to crucial services, such as healthcare, and the social ramifications of class origins may thus be even more profound. In such contexts, having savings may be more essential for the future well-being of the working class, in contrast to the Norwegian case, where there is a stronger security net leveraged from social democratic policies, including publicly financed education, access to pensions, and economic support for the unemployed or ill. Wealth-based opportunity hoarding may thus be more evident across the class structure in the United States. On the other hand, the vast inequalities that exist on the “commodified” housing market in Norway arguably speak volumes about the necessity for wealth-based opportunity hoarding by the population at large, despite broader safety nets.
Since the turn of the millennium, the burgeoning literature on wealth inequalities has drawn attention to the importance of wealth; we add to this work in several ways. We contribute by linking wealth accumulation to class theory, and to the idea that different family contexts draw on different devices based on economic and cultural capital to hoard opportunities. We identify class fractions that are likely to be oriented toward profit-making and economic rewards, or that follow “pro-investment norms” and are therefore especially likely to enjoy the new opportunities for accumulation. Our analyses testify to the importance of singling out such economically dominant positions and contrasting them with fractions that are endowed with cultural capital. For instance, the EGP-service class, mainly composed of higher-level professionals, managers, and employers, conflates the different types of opportunities that may flow from origins privileged by cultural as opposed to economic capital, and it is thus likely to underestimate the role of wealth in perpetuating intergenerational opportunity hoarding in recent times. 12
Our comparison of gross worth with net worth suggests future studies could usefully explore debt. Again, this seems all the more important, the more excessive the liberalization of credit markets has become in different countries. Here, some fascinating research is emerging. For instance, Fourcade and Healy (2013) argue that new forms of market inequalities are forged by new, complex algorithms for generating credit scores and creditworthiness on the U.S. credit market. Although there has been increasing access to credit, these technologies internally differentiate between debtors of different kinds, and they have fostered both spiraling cycles of disadvantage and new cycles of advantage. Rather than removing debt from the estimation of assets, sociologists would be wise to dig more deeply into the way credit lending and different lending relationships are classed, and how such processes produce and reproduce class inequality in different national contexts (Dwyer 2018).
Moreover, a (re)turn to wealth-based opportunity hoarding in recent decades is likely to reinforce the interplay between different dimensions of inequality, such as class and race domination. While of obvious importance to immigrant populations, this interplay is also pivotal in national contexts where racial and ethnic minorities have been historically excluded from property ownership (Conley 1999; Shapiro 2004, 2017). The temporal feature of wealth accumulation means the inequity generated by racist policies can linger on, even long after such policies have been abolished. The consequences of these symbiotic tendencies merit further attention.
The increase in wealth-based opportunity hoarding also has wider ramifications for class analysis, as it touches on normative implications for rent acquisition, (credit)worthiness, and frames of justification. For instance, it raises the issue of the moral significance of new technologies in attributing blame and worthiness to different kinds of debtors (Fourcade and Healy 2013), or the way normative justifications for wealth inheritance sit with hegemonic notions of meritocratic effort and ability (Beckert 2008; Kantola and Kuusela 2019; Sherman 2017). Here, we believe class analysts are needed to shed additional light on the way privilege is currently perpetuated, accelerated, and legitimized.
Just as different classes seem responsive to societal changes by exploiting new opportunities for transmitting class privilege, sociological research needs to be sensitive to bringing its analytic tools up to speed. Arguably, a class analysis for the twenty-first century must move wealth accumulation to the heart of intergenerational opportunity hoarding and fine-tune concepts of class that identify those who have the most profound control and ownership of capital.
Supplemental Material
sj-pdf-1-asr-10.1177_00031224211020012 – Supplemental material for Wealth Accumulation and Opportunity Hoarding: Class-Origin Wealth Gaps over a Quarter of a Century in a Scandinavian Country
Supplemental material, sj-pdf-1-asr-10.1177_00031224211020012 for Wealth Accumulation and Opportunity Hoarding: Class-Origin Wealth Gaps over a Quarter of a Century in a Scandinavian Country by Marianne Nordli Hansen and Maren Toft in American Sociological Review
Footnotes
Appendix
Acknowledgments and Funding
The authors contributed equally to this article. We thank five anonymous reviewers, the editors of American Sociological Review, and Johs. Hjellbrekke for exciting and stimulating criticisms on earlier drafts. We have benefited from discussing the linkage of wealth and class with Magne Paalgard Flemmen, Jørn Ljunggren, Patrick Lie Andersen, and Øyvind Wiborg. This article is part of the research project Paradoxes of wealth and class: historical conditions and contemporary figurations (HISTCLASS) at the Department of Sociology and Human Geography, University of Oslo, and parts of this research were funded by the Research Council of Norway, grant no. 275249. We would like to thank Statistics Norway (SSB) for providing the administrative registry data. We are grateful to Karl Ingar Kittelsen Røberg for initial data preparation of the registry data for the ORDC scheme and to Vebjørn Nordhagen for providing us with the ISCO-version of the ORDC class scheme.
Notes
References
Supplementary Material
Please find the following supplemental material available below.
For Open Access articles published under a Creative Commons License, all supplemental material carries the same license as the article it is associated with.
For non-Open Access articles published, all supplemental material carries a non-exclusive license, and permission requests for re-use of supplemental material or any part of supplemental material shall be sent directly to the copyright owner as specified in the copyright notice associated with the article.