
Abstract
The aim of this study is to describe long-term changes in intergenerational social mobility in Hungary between 1973 and 2018 and to provide an overview of the current situation that has not been examined previously. Our main questions are whether trends of the earlier periods continued and whether previous gender differences persisted at the end of the 2010s. According to our results total mobility continued to decline and it hit its lowest point in decades at the end of the 2010s. In addition, decreasing proportion of the population move upwards compared with their fathers and an increasing proportion experience the deterioration of their social position. While earlier research found that structural changes in society triggered upward mobility the polarising class structure after 1990 set into motion contrary trends. In this period, structural mobility increasingly typically meant downward mobility. As regards relative mobility chances associated with working in high and low occupational positions, we concluded that the ceiling seems to be stickier than the floor as a rule, that is, the role of origin is more decisive in keeping a favourable social position than in the transmission of a disadvantaged position across generations. The odds for someone born into unfavourable circumstances to rise are greater than for those of someone who was brought up in privileged circumstances to slide down.
Introduction
In parallel with the reflections on growing income and wealth inequalities, the issue of inheriting inequalities and thus social mobility, has increasingly come to the forefront of social science research and even public debates. With the growth of inequalities, has the inequality of opportunities increased as well, and do mobility processes contribute not to a meritocratic, but an even more unequal society? It is unfortunate, however, that while interest has increased, data available for the determination of levels and trends in social mobility are less adequate today than in the last decades (Bukodi et al., 2015: 93–94).
The remark made by Bukodi and her colleagues on the British situation are fully valid in the Hungarian case as well. The mobility characteristics of Hungarian society were well documented until the 2000s due to research based on regular large-scale surveys. However, since the turn of the millennium, no research has been conducted to provide an overview of recent mobility trends in Hungarian society that could be compared with the results of earlier studies. Information on the mobility processes of Hungarian society since 2000 is primarily available through international comparative studies mostly covering only the period before 2010 (Bukodi and Paskov, 2020; Bukodi et al., 2019; Eurofound, 2017; Jackson and Evans, 2017; OECD, 2018). The findings of these studies cannot be compared directly with earlier analyses and thus are not suitable for identifying trends.
Thanks to its excellent research tradition, Hungary has always been at the centre of international debates on social mobility. Hungary served as a test case for exploring the mobility characteristics of state socialist societies. To what extent have they moved in the direction of increasing openness and to what extent can they be considered open compared with industrialised capitalist societies (Erikson and Goldthorpe, 1993). Hungary was also a critical case to examine the question of whether the transition from state socialism to market economy leads to an increase or decrease in social mobility (Bukodi and Goldthorpe, 2010; Jackson and Evans, 2017; Róbert and Bukodi, 2004). Today, we have pretty clear answers to these questions. The transition from state socialism to market economy was accompanied by a decrease in both the total rate (i.e. the percentage of those who were found in a different class from that of their parents) and the relative form (i.e. the net association between the class positions of children and their parents when all effects of the structural changes are discounted) of social mobility in Hungary and other post-socialist countries. Moreover, according to the latest studies, which refer to the 2000s, Hungary is among the most closed European countries.
In light of the rich tradition of Hungarian mobility research, it is a great shortcoming that we do not have information on how social mobility has changed in Hungary since the beginning of the 2010s, although this deserves special attention for at least two reasons. On the one hand, the global financial crisis was accompanied by a large economic downturn and significant increase in unemployment in Hungary, which was followed by an unprecedented economic boom and employment growth in the second half of the 2010s. It is an open question: How do these economic changes affected mobility processes? On the other hand, in the 2010s the political system also underwent significant changes in Hungary. Since 2010, the right-wing populist Fidesz has won three consecutive elections with a two-thirds majority. During this period, the country’s institutional arrangements and power structure were completely transformed. As a result of these changes, it was also questioned whether Hungary could still be considered a democracy at all (Bozóki and Hegedűs, 2018). In addition to the transformation of the political system, there have also been significant changes in social policy (e.g. introduction of a flat tax system for personal income, cutting back the social benefits in the name of the so-called ‘work-based society’, or lowering the age of compulsory education), which have the effect of sharpening social inequalities and increasing distance between the lower and upper classes (Éber, 2020; Scheiring, 2020; Szikra, 2014). These social policy changes may also have significant consequences for the mobility processes of Hungarian society.
As the decline in social mobility, after the transition from state socialism to capitalism itself may have contributed to the rise of populism in Hungary, the significant political and economic changes after 2010 may have led to the transformation of previous mobility processes. In our study we are looking for answer to the question of whether previous mobility processes continued or changed after 2010 due to these significant changes. In what follows, we first outline the major mobility trends of Hungarian society until the 2000s and then delve into the mobility patterns of present Hungarian society.
The main trends of social mobility in Hungary until the 2000s
Long-term mobility processes of Hungarian society are primarily known from the work of Rudolf Andorka (1982), which covers the period from the beginning of the 20th century to the 1970s. For an insight into the mobility patterns of the next period from 1973 to 2000, one should first see the analysis by Péter Róbert and Erzsébet Bukodi (2004) (cf. Andorka et al., 1994; Ferge, 1969; Harcsa and Kulcsár, 1986; Luijkx et al., 2002). They found that Hungarian society was characterised by a high degree of – upward – mobility after World War II and during the initial phase of state socialist transformation, which was driven mostly by the rapid structural changes in the society owing to reconstruction and industrialisation. The main directions of social mobility were determined on the one hand by the flow of labour from agriculture to industry, on the other hand by upgrading from blue-collar to white-collar jobs. Nevertheless, in the decades following the 1960s, total mobility declined steadily in the case of both men and women. As Róbert and Bukodi (2004) pointed out, in 2000 the percentage of those whose social position changed with respect to their class of origin was lower for both men and woman than it had been in 1973, 1983, and 1992. Thus, the transition to market economy in 1989–1990 did not change the mobility processes started earlier.
It is important to point out that the percentage of mobile persons was higher among women than men throughout the period, and total mobility decreased to a lesser extent in the case of women, too. There are also exciting differences between men and women regarding the direction of mobility. On the one hand, the proportion of horizontal mobility among women is higher, that is, the proportion of those who moved from their father’s occupational group to another group, but their class position remained the same. On the other hand, upward and downward mobility do not show a consistent trend throughout the period under review. While in 1973, 1983, and 1992 upward mobility was higher for men and downward mobility for women, in 2000 the proportion of upward mobility was higher among women, and differences between the sexes levelled off with respect to downward mobility.
One should keep in mind, however, that higher total mobility rates measured for women can partly be attributed to methodological reasons as well as to the specific features of the measurement. In fact, the respondents’ occupational position was compared with those of their fathers’ in the case of both men and women. This procedure may result in higher mobility rates in the case of women. Aside from methodological issues, the reason for higher mobility rates among women lies in the fact that the economic activity of women had increased significantly, that is they had entered the labour market in large numbers. Andorka (1982: 55–114) also observed that whereas in earlier periods women had primarily flowed towards unskilled jobs or occupations requiring low skills, this trend altered in the next decades. In Hungary, and in developed countries around the world, girls have outnumbered boys in grammar schools as well as in higher education (Fényes, 2009), and educational mobility facilitates occupational mobility.
Considering relative mobility some differences can also be detected between the sexes. Relative mobility increased among men between 1973 and 1983, that is, inequality of opportunity in changing one’s social position decreased. After that, it remained unchanged until 1992 and then decreased by 2000. Thus, the relative mobility chances for men diminished significantly by the turn of the millennium compared to the results of the1983 survey. Trends for women are somewhat different: they showed an increase in terms of relative mobility between 1973 and 1992, but after that the rate stagnated (Róbert and Bukodi, 2004).
As far as the period after 2000 is concerned, there are no researches available in Hungary to be used for direct comparison with the earlier results. The Hungarian mobility trends of the new millennium can therefore be primarily inferred from international comparative studies. Based on these studies, ‘mobility problem’ is not the most acute issue in the countries where it has been most widely discussed (Bukodi and Paskov, 2020; Bukodi et al., 2019; Eurofound, 2017; Jackson and Evans, 2017; OECD, 2018). According to the latest results, for example, no decline has been seen in absolute or relative mobility in Britain, and British society is rather open in European comparison. In the UK, the unfavourable trend in the rate of upward and downward mobility is particularly worrying (Bukodi and Goldthorpe, 2019; Bukodi et al., 2015). However, the situation is quite different in the case of Central and Eastern countries, including Hungary. Recent comparative studies have revealed that the mobility indicators of Hungary have consistently deteriorated and in fact they are among the least favourable ones in Europe (Bukodi and Paskov, 2020; Bukodi et al., 2019; Eurofound, 2017; Jackson and Evans, 2017; OECD, 2018). Thus, Hungary is particularly suitable for studying mobility problems.
In terms of gender differences in social mobility, Hungary also shows specific patterns. In the Northern and Western European countries, the proportion of the mobile persons is usually higher among women than men, mainly due to the fact that women are more likely to move to lower positions compared with their parents than men. In contrast, in Hungary and in the other Central-East European countries, the mobility characteristics of both men and women are fundamentally different. In Hungary, in line with previous findings, the total mobility of women is higher than that of men, but it is explained by higher upward mobility rates of women. With regard to relative mobility, however, no significant difference is seen between the two sexes (Bukodi and Paskov, 2020).
To summarise the main results of previous research on social mobility in Hungary, the Hungarian mobility regime has on the one hand some constant features that have not changed since the 1960s or 1970s; on the other hand, there are some that seem to have changed around the turn of the millennium. The first important constant trend is the steady decline of total mobility rate since the 1960s characterising both men and women. The second constant feature is that the rate of total mobility has always been higher among women than men. However, in addition to the constant characteristics of the mobility processes, there are other ones that have changed over time. Before the regime change, the rate of upward social mobility was higher among men than among women and vice versa: downward mobility rate was higher among women. It seems, however, that it has changed around 2000. Since that time, the rate of upward mobility has been higher among women than men. This is the third important feature of the Hungarian mobility processes seen in the past decades.
In international comparison in the period before the transition, Hungary was considered to be more open in terms of social mobility, but in the 2000s it was among the most closed ones. Compared with the Western countries, the unfavourable and deteriorating mobility characteristics of men are particularly striking.
The main objective of this article is to find out how the trends outlined by earlier studies evolved in the second half of the 2010s, in a period not having been explored so far by similar studies. 1
We would like to address three questions in particular. The first one is whether total mobility continued to decrease among both sexes; the second is whether the phenomenon of seeing more widespread upward mobility among women than men started in the early 2000s persists. Third, we would like to find out how inequality of relative mobility chances contributes to the different mobility characteristics of men and women.
It is difficult to estimate how the economic and political changes occurred in the 2010s have influenced the evolution of social mobility in Hungary. The links between social mobility and economic and political processes are not direct, but they can in any case be considered as secondary factors that can influence the development of social mobility in various ways (Bukodi and Goldthorpe, 2021). On the one hand, although the great economic downturn caused by the global financial crisis may have adversely influenced social mobility, the depression was followed by an unprecedented economic boom that may had an opposite effect if it could have contributed the upgrade of the occupational structure. On the other hand, the right-wing populist turn taken place in Hungary in 2010 has brought with them a wide-ranging elite exchange, which not only affected the political institutions, but also included the creation of a new national bourgeoise and upper middle class loyal to power, which in itself could have increased mobility (Éber, 2020; Scheiring, 2020). In this period, there were, however, significant policy changes as well in terms of education, the labour market, and social policy. These policy changes contributed to the rise and interconnection of different forms of social inequalities that deepened class cleavages in Hungary (Szikra, 2014). These policy changes certainly do not foster social mobility, however, it is unclear, how strongly and how directly they influence the mobility processes of today’s Hungary. Overall, considering the diverse effects of these factors, we assume that previous mobility processes have continued; they have not changed significantly, and if they have, certainly not in a positive direction.
Data and variables
The study is based on a survey conducted in the autumn of 2018 by the ‘Mobility Research Centre’ project by the Excellence Cooperation Programme of the Hungarian Academy of Sciences (MTA). The database includes the data of 2700 respondents over 18 years of age. When selecting the sample, a two-step, proportionally stratified probability sampling procedure was used. 2 The sample reflects the proportions of the total adult population in this field according to gender, age (three age groups), education (four levels of education), and type of settlement (four levels of settlement). Following the international practice, after the completion of the data collection, we applied multi-criteria weighting in order to fit the sample as accurately as possible. The resulting weight variable values ranged from 0.58 to 1.15, with 94% falling between 0.82 and 1.06. This small standard deviation of weights shows that even the raw database approximated the main characteristics of the initial population very well.
The research design of our study was constructed to facilitate comparison across time as much as possible. In order to achieve this, measurements of both the current social position and the origin of the individuals were based on the solutions applied in the study by Péter Róbert and Erzsébet Bukodi (2004). As a result, our results could have been inserted in the time series going back to 1973 provided by the authors. Accordingly, the Erikson-Goldthorpe-Portocarero (EGP) 3 typology was used to classify the occupational positions which were constructed based on four-digit occupational codes following the class scheme used in the 2011 Census (for the issue of operationalisation and exact classification of occupational codes see the Appendix of the volume of the census (Huszár, 2015). The respondents not being employed at the date of data collection were classified into the scheme according to their last occupation. (Table 1 shows the distribution of respondents and their fathers by EGP class.)
Origin and destination class structures in Hungary.
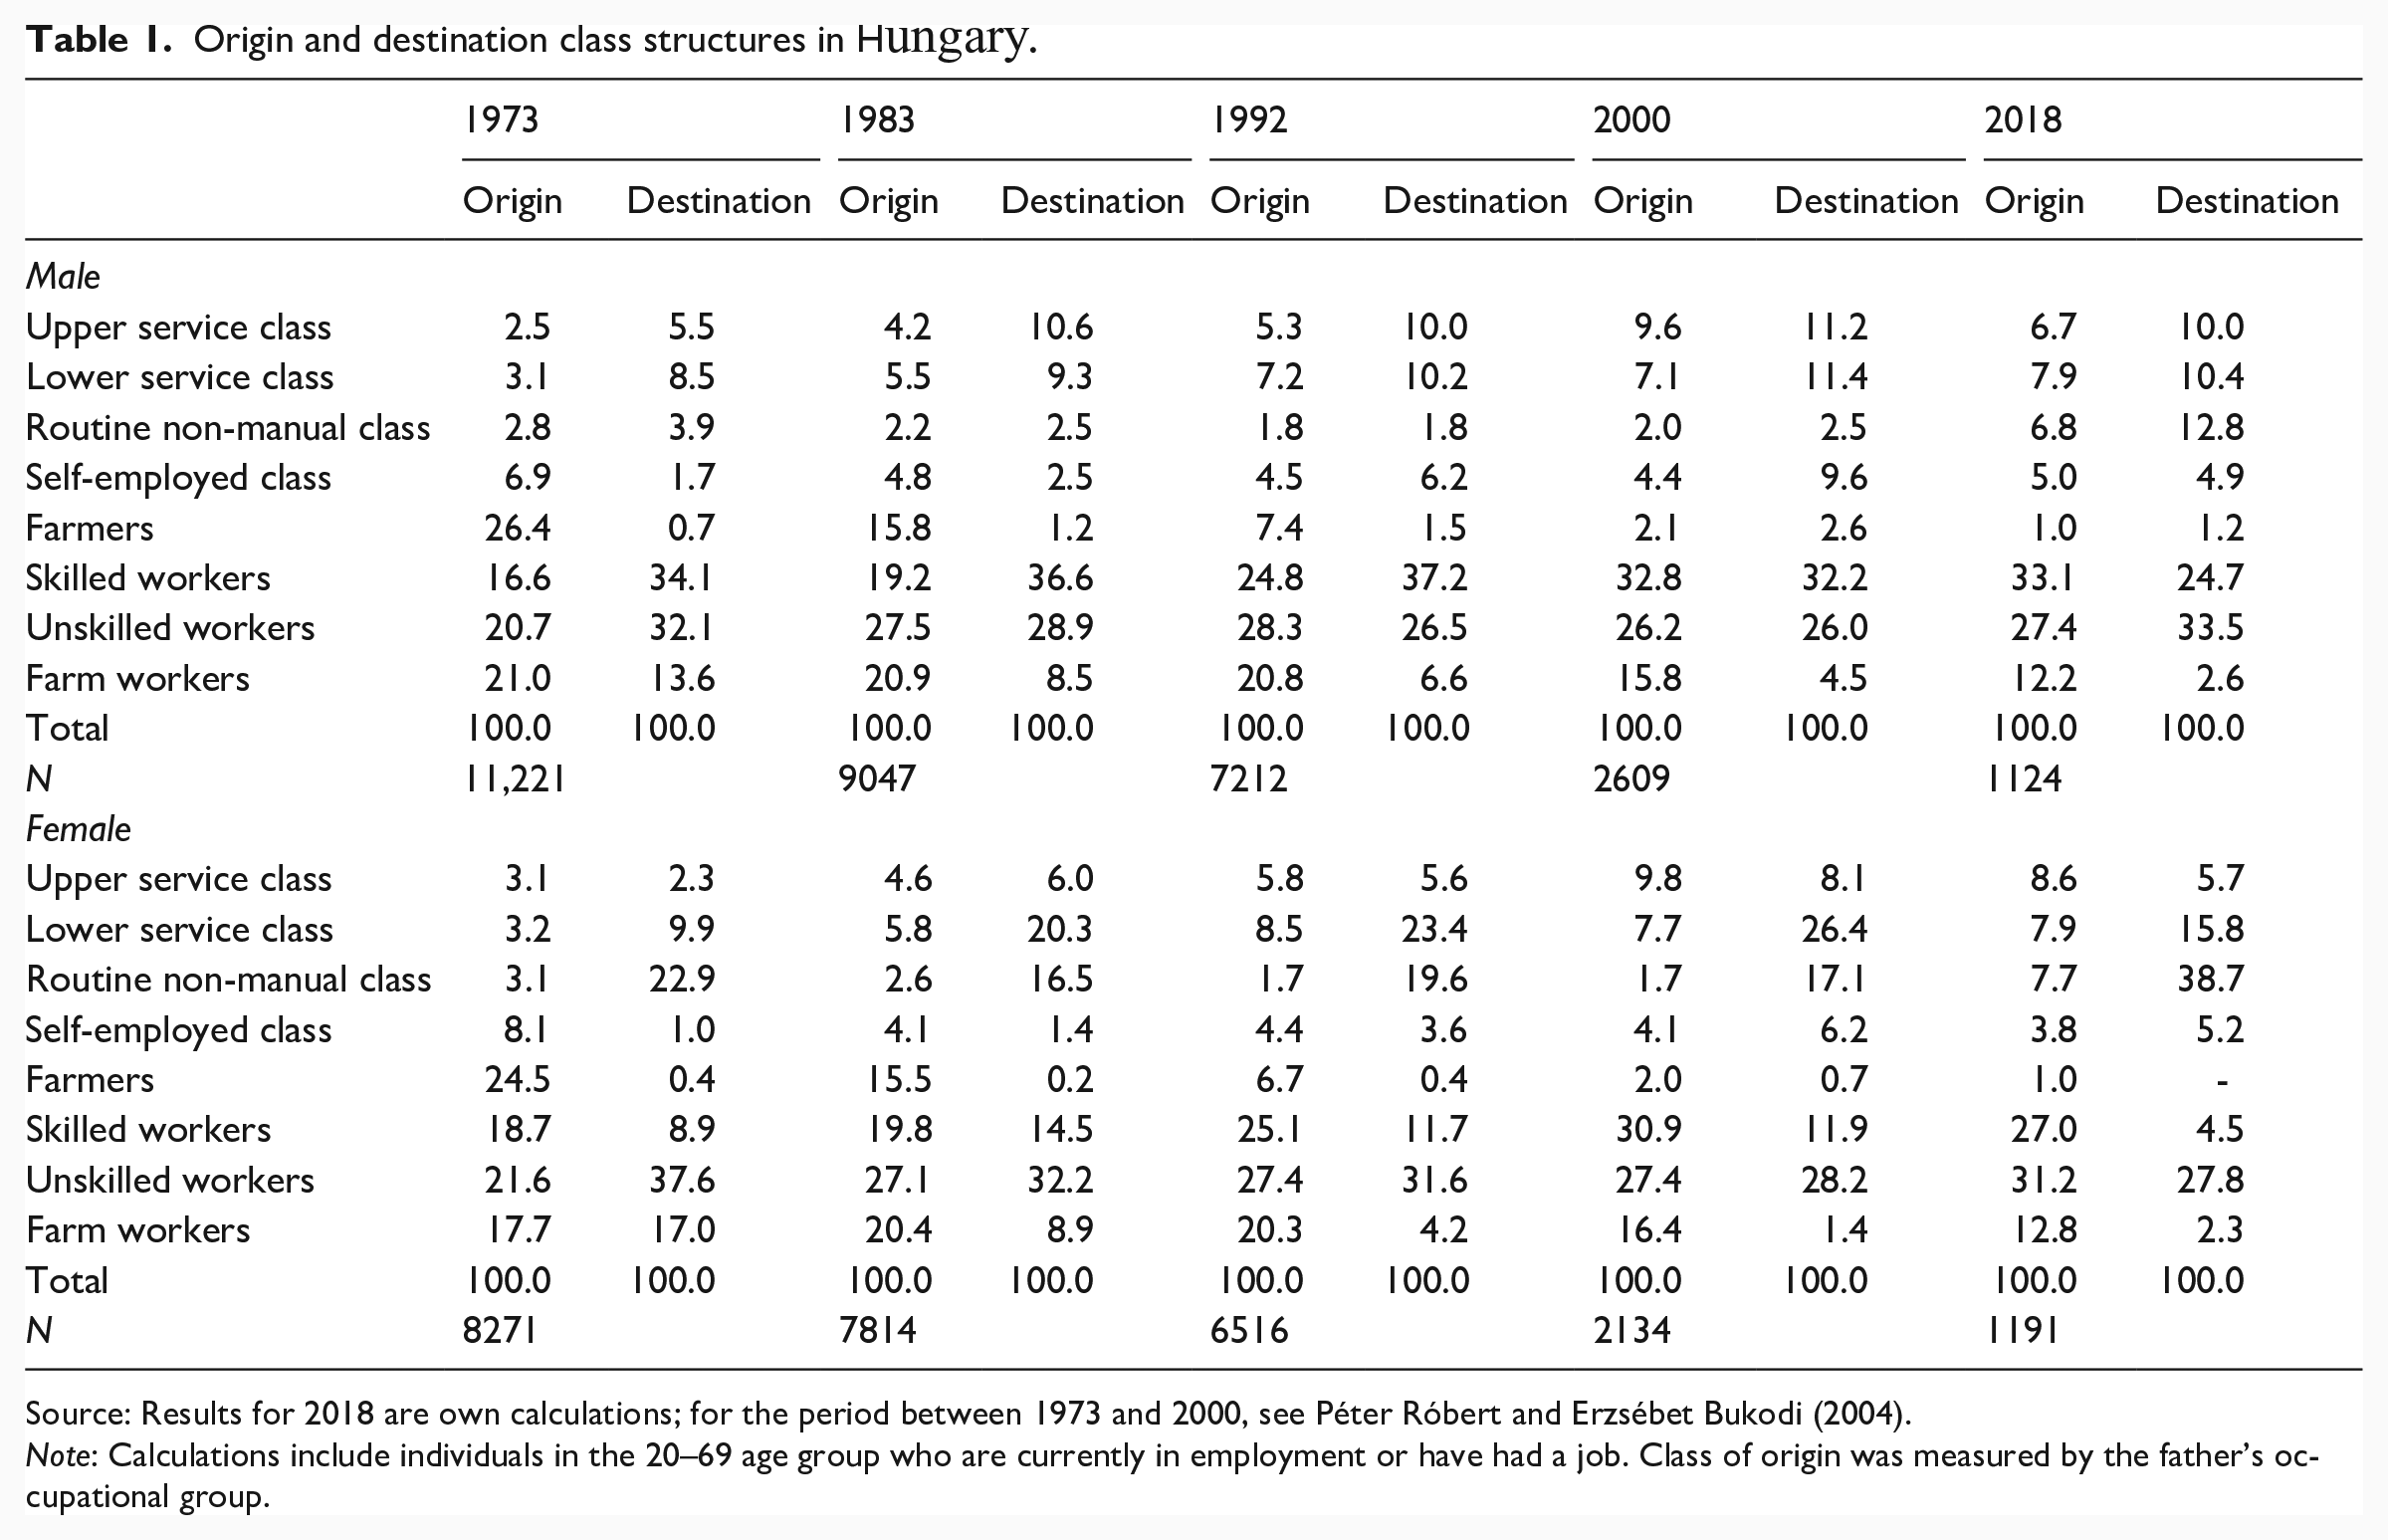
Source: Results for 2018 are own calculations; for the period between 1973 and 2000, see Péter Róbert and Erzsébet Bukodi (2004).
Note: Calculations include individuals in the 20–69 age group who are currently in employment or have had a job. Class of origin was measured by the father’s occupational group.
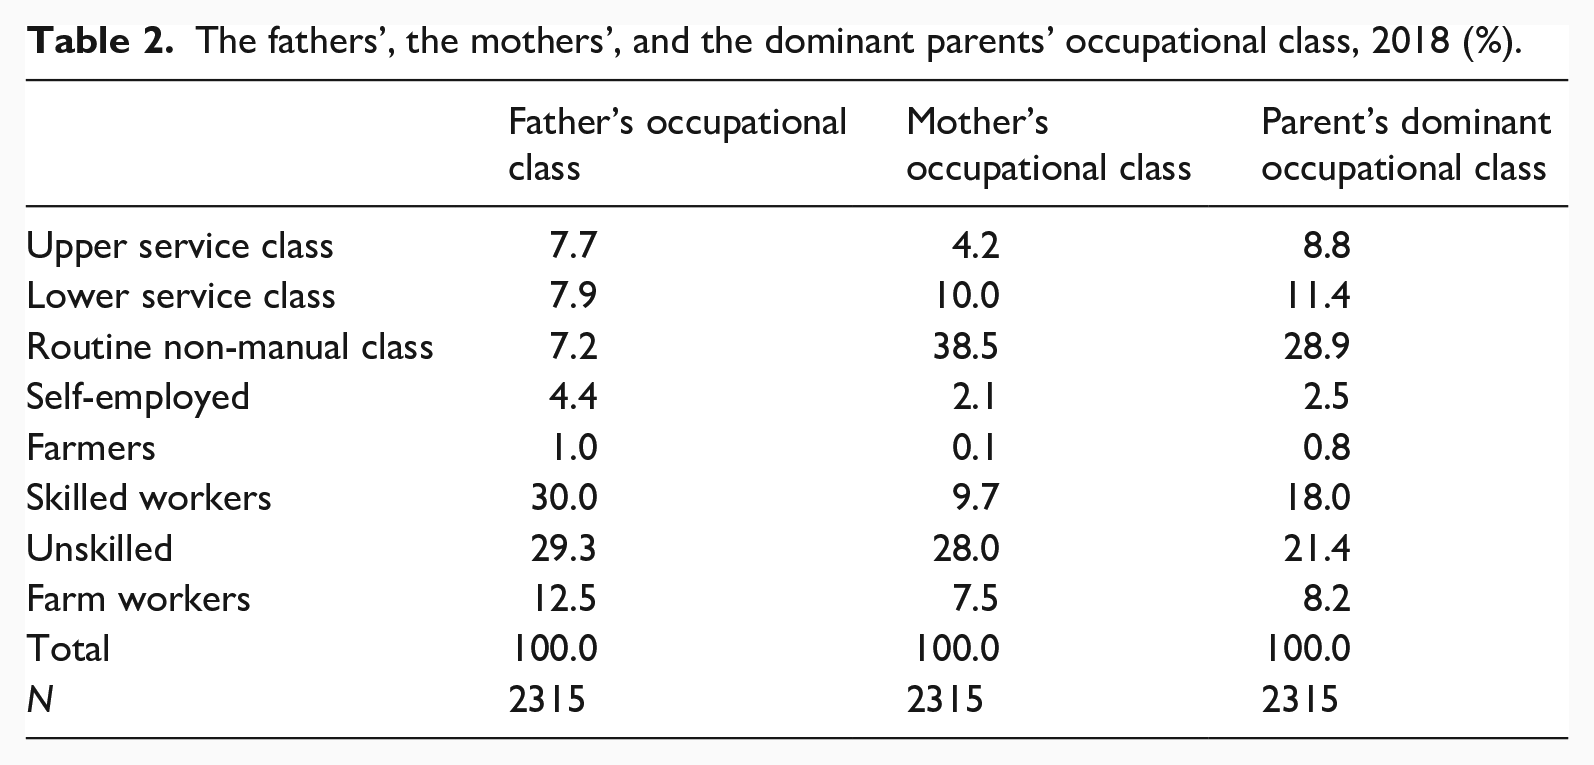
The class of origin of the individuals may be assessed in a number of ways. In the study by Róbert and Bukodi (2004) the father’s occupation was taken into account, so for the sake of comparability we have also adhered to this method as a general rule. The results and analyses included in the main text of this study are all based on this approach. This method, however, may lead to distortions, particularly in terms of the different mobility characteristics of the two sexes, therefore each calculation was also made by defining the origin of the individuals through the dominance approach (Bukodi and Paskov, 2020; Bukodi et al., 2019). This method takes into consideration the parent whose position is higher if both the father and the mother have had a job. Applying the dominance approach is especially justified if one tries to seek answers to gender differences in social mobility; however, it also results in shifting the occupational class structure of the parents higher than in the case when only the father’s (or the mother’s) occupational group had been considered (see Table 2 for the distribution of fathers and mothers by occupational group as well as the distribution of parents by dominant position). In the course of the analysis, a footnote was added to the cases where the calculations performed according to the dominance approach substantially differed from those relying on the father’s class position, and the detailed results are included in the Supplementary Appendix.
The fathers’, the mothers’, and the dominant parents’ occupational class, 2018 (%).
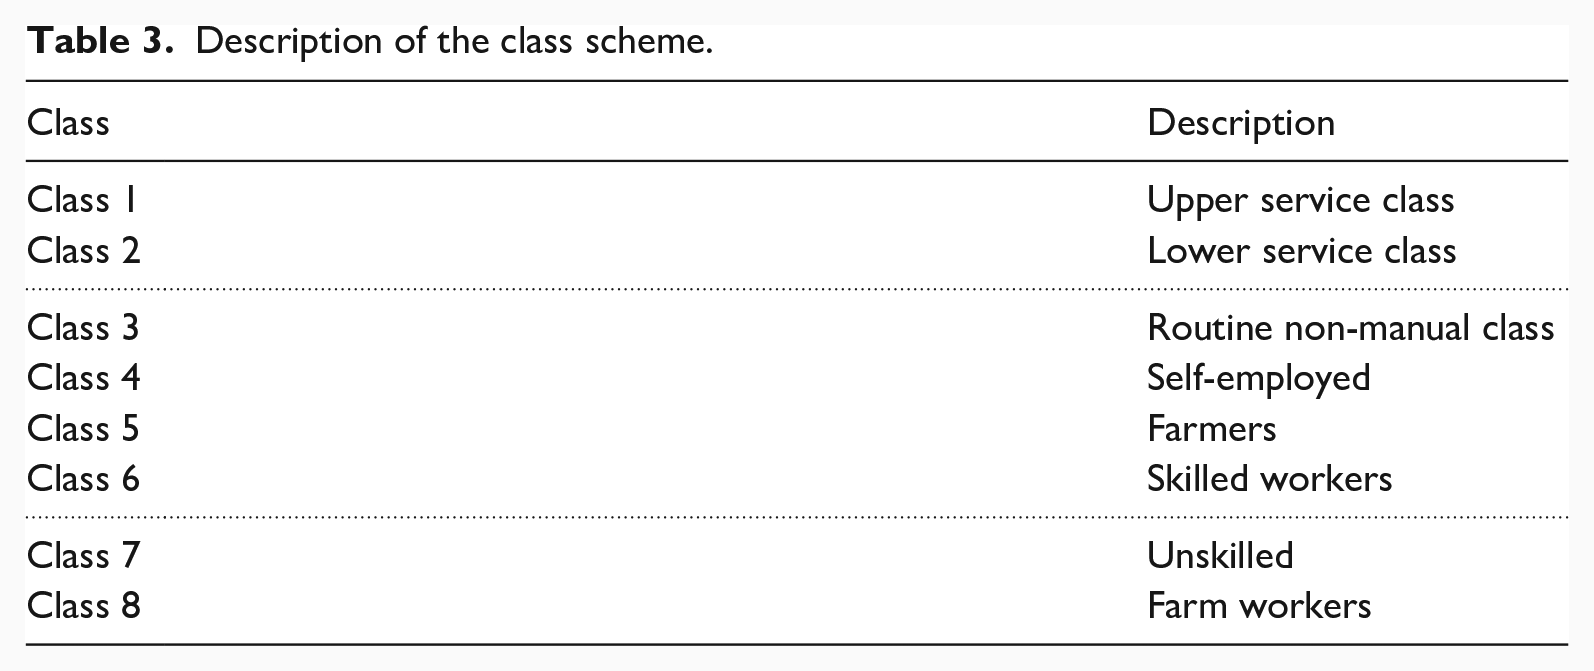
In our study, after Róbert and Bukodi again, we distinguish between vertical and horizontal mobility. These are calculated based on the hierarchical divisions of the class scheme applied. Any movement between these hierarchical divisions are calculated as upward or downward mobility depending on its direction. There are, however, occupational groups that cannot be unequivocally classified as more or less advantaged. Mobility between these groups is therefore regarded as horizontal. The hierarchical divisions of the class scheme are indicated by dotted lines in Table 3.
Description of the class scheme.
In order to ensure that our calculations are directly comparable with earlier results on the previous periods, our inquiry was limited to the age group between 20 and 69 year in line with the solutions used by Róbert and Bukodi (2004).
Our analysis is the first to offer results on the Hungarian mobility patterns of the second half of the 2010s that are directly comparable with earlier research. However, it obviously has some limits. The most crucial limit is that the research was based on a far smaller sample size than those of earlier mobility analyses. As a consequence, the aggregated version of the EGP scheme was used in some cases. The findings published in the present article may be confirmed by further large-sample surveys.
In the following, first we are going to examine the indicators of absolute intergenerational occupational mobility, and describe the relevant trends in Hungarian society in the second half of the 2010s as well as point out the divergences between the mobility characteristics of women and men. Then we are exploring the gender differences in terms of relative mobility chances by using regression models.
Absolute mobility
With regard to absolute mobility, our study poses two main questions based on earlier research: on the one hand, whether the rate of total mobility continued to decline in Hungary at the end of the 2010s following the trend of the previous periods; on the other hand, whether women continue to show more favourable mobility patterns than men, as it had been the case since 2000.
Table 4 summarises the main indicators of absolute mobility and it helps responding our key questions. It reveals that the patterns characterising earlier decades continued. There is quite large time lag between the 2000 and 2018 measurement, and it is not known how unified the mobility processes of the past almost two decades have been, but a further slight decrease is seen in total mobility rates among both men and women. The table also reveals that the degree of total mobility is higher among women than men. These main indicators thus suggest that previous trends continued, the main mobility patterns of Hungarian society seem to be resistant to change, while they also expose the fact that present Hungarian society seems to be more rigid than at any time in the past 50 years.
Considering the direction of mobility, our results also confirm the stability of the differences between the sexes. Unlike in the period before 2000, but corresponding to the findings of the 2000 measurements, the proportion of upward mobility was somewhat higher, while downward mobility was somewhat lower among women at the end of the 2010s. Thus, the mobility characteristics of women are definitely better than those of men. The direction of the change, however, is unfavourable for both sexes. Whereas the rate of horizontal mobility hardly changed among either women or men, there are considerable shifts in upward and downward mobility. In the period under review, the proportion of men whose social position improved compared to that of their father decreased from 35.7% in 2000 to 28.8% in 2018, while the percentage of downward mobility rose from 14.2% to 20.0%. As for women, although trends are similar, they are less dynamic: while the proportion of upward mobile women decreased by 5 percentage points, the rate of downward mobility remained almost the same. These results indicate that the problem with Hungarian mobility trends – similar to UK patterns (Bukodi et al., 2015; Goldthorpe, 2013, 2016) – lies not simply in the high rate of immobility and low rate of mobility. A more troublesome consideration is that social mobility increasingly means downward shifts in the ever more rigid Hungarian society. In fact, the chances of generations currently or soon entering the labour market to retain the social position of their parents are diminishing (Table 4). 4
Absolute intergenerational class mobility rates in Hungary, (%).
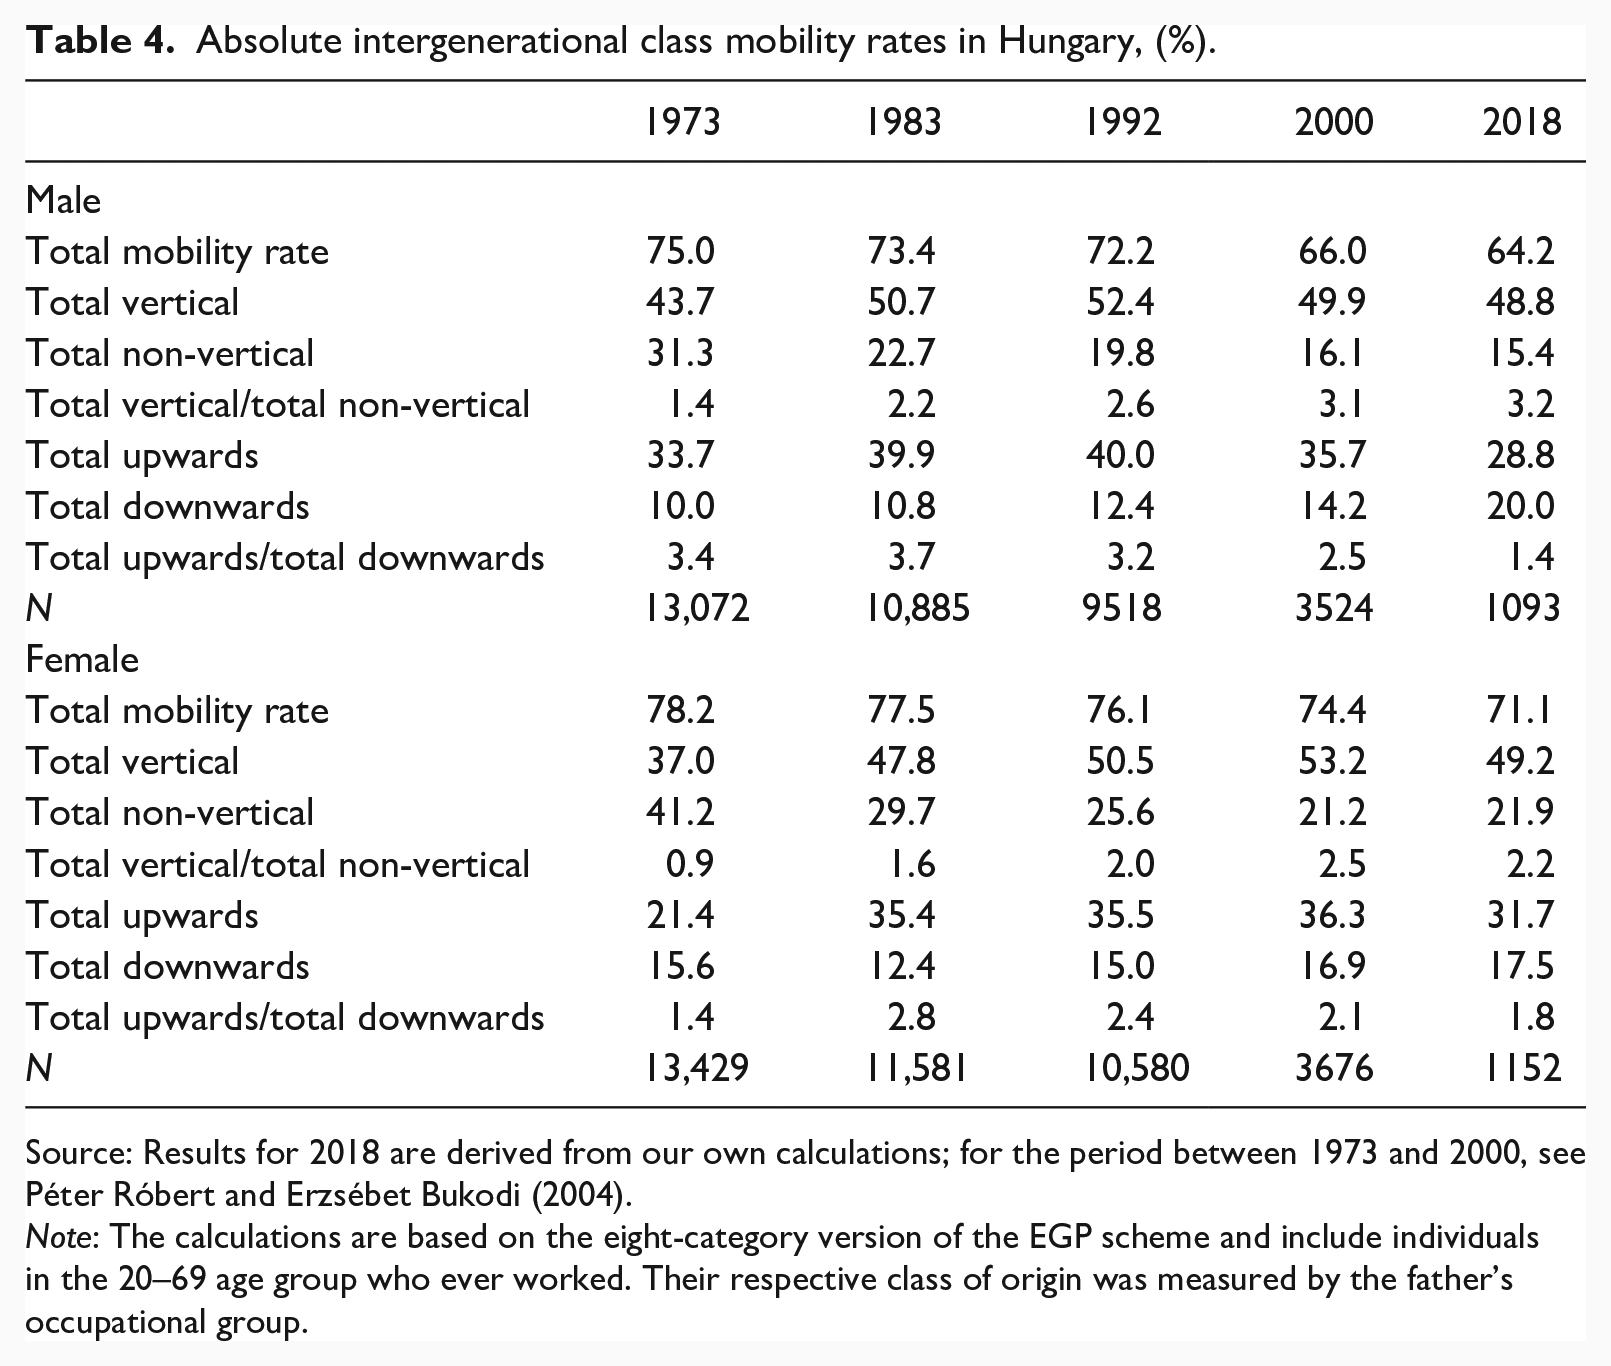
Source: Results for 2018 are derived from our own calculations; for the period between 1973 and 2000, see Péter Róbert and Erzsébet Bukodi (2004).
Note: The calculations are based on the eight-category version of the EGP scheme and include individuals in the 20–69 age group who ever worked. Their respective class of origin was measured by the father’s occupational group.
The development of indicators of absolute mobility is primarily influenced by structural changes in the society. In the 1960s, 1970s, and 1980s, owing to structural transformations, an increasing number of positions were created in the upper segments of the occupational hierarchy, which stimulated upward structural mobility (Andorka, 1982; Ferge, 1969). However, after the transition to market economy, these upgrading of the occupational structure has slowed down and even polarising tendencies could have been observed. In the 2010s, the labour market saw major changes, with significant increase in the number of employees, while new jobs were created mainly in the lower segment of the occupational structure. (On changes in the occupational structure in the generation of fathers and respondents, see Table 1. See also Bukodi and Záhonyi, 2004; Huszár, 2015; Kolosi, 2019.) As a result of this development, the structural changes of society worked in the opposite direction compared with the post-war period: they brought about downward structural mobility.
So far, we have investigated the indicators of total mobility. However, in order to understand the different mobility patterns of women and men beyond the main indicators, the specific mobility paths of the two sexes also need be to be reviewed. Based on this, one can also get an insight into the different strategies parents with various social backgrounds pursued when raising their children. Table 5 shows the proportion of immobile persons by their fathers’ occupational group. Thus, it provides information on the proportion of boys and girls who retained their class of origins. 5
Immobility rates by gender, 2018 (%).
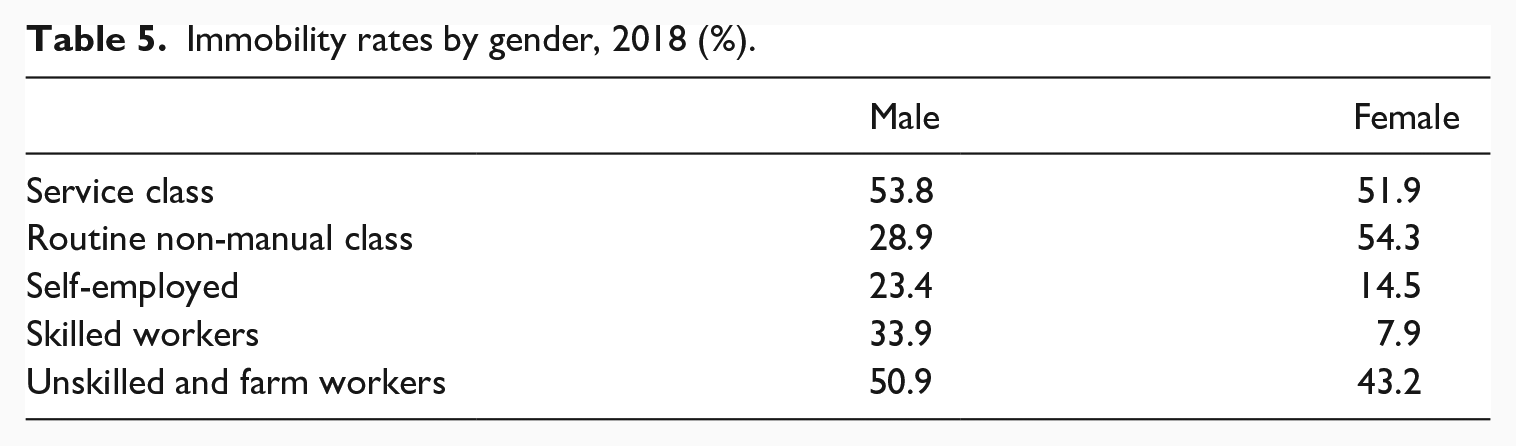
The most distinct feature of the service class is that of all occupational groups this proved to be the most closed. In this category, the proportion of immobile persons exceeded 50% among both sexes. Immobility is slightly higher among boys, but no significant difference was revealed between two sexes. 6 However, the divergence is more remarkable between men and women with respect to exit routes: while women tend to move to the routine non-manual class, men tend to become blue-collar workers.
The gender differences are clearer among the children of routine non-manual class fathers: a higher proportion of women retained their fathers’ position, at the same time, men were more likely to enter the service class or to move to a blue-collar position.
The mobility paths of the children of the self-employed show considerable differences by gender. First, the class of origin in this case is more likely to be inherited by men. Second, the destination of those who leave the group is also different for men and women. While upward mobile boys mostly move to the service class, girls’ destination is typically the routine non-manual group. The formula is quite similar for downward mobility: a greater proportion of men get into skilled workers, while women tend to move to the unskilled group.
The mobility paths of the children of skilled workers also show substantial differences by gender. A larger proportion of men retain the class position of their fathers. Those who leave this group are more likely to land in the group of unskilled workers. By contrast, the immobility of the girls of skilled worker fathers is lower; fewer of them move downwards, and nearly half of them get to the routine non-manual class.
The group of unskilled and farm workers positioned at the bottom of the occupational hierarchy appears to be nearly as closed as the service class. More than half of men with such a background proved to be immobile, and a further 25% switched to the skilled worker category. The proportion of immobility is also significant among women, but is not as high as in the case of men. The destination of women leaving this group is usually the routine non-manual class. 7
A more detailed analysis of mobility paths provides an insight into the specific underlying social trends of the gender divergences shown by the main indicators of absolute mobility. In this respect, movements between the two groups occupying the middle segment of the occupational hierarchy, that is, the non-manual class and skilled workers – are essential: a larger proportion of women from the routine non-manual class preserved their class of origin and the proportion of mobile women with skilled worker background was also higher. As far as men are concerned, a larger proportion (i.e. compared with women) left the routine non-manual class or stayed in worker position. This finding is especially relevant to establish that the main indicators of absolute mobility are overall more favourable for women and seem to reveal diminishing occupational inequalities between the sexes. However, a thorough examination of mobility paths shows that this has little relevance for substantive gender inequalities as the higher mobility rates detected among women derives mainly from movements in the middle segment of social structure, while gender differences are smaller in the bottom and top segments of the occupational hierarchy.
Relative mobility chances
Absolute mobility mainly reflects the degree and direction of the changes in class structure across generations. Relative mobility, by contrast, helps explore the mobility chances of individuals coming from different backgrounds, irrespective of structural transformations in the society. Based on the study on absolute mobility, we came to the conclusion that the higher mobility rates among women derives from movements in the middle segment of social structure, while gender differences tend to be smaller in the poles of society. Therefore, in the following, when examining relative mobility, we focus on the top and the bottom segments of society. 8
Mobility paths affecting the two poles of society are critical in terms of the development of social mobility and the assessment of the openness and closure of society. The permeability of these mobility routs determines what chances girls and boys with a disadvantaged background have to rise and how far children from affluent families inherit the privileged social position of their parents. Although we are working with occupational categories that cannot grasp the very elite and the most vulnerable, it is worth using the metaphors of sticky floor and sticky ceiling (OECD, 2018) to show what mechanisms are in operation at the upper and lower segments of society. If the floor is sticky, society ‘sticks’ the ones at the lower end to their position of origin despite their ambitions, efforts, and talents and hinders them to move upward, which leads to the intergenerational reproduction of poverty and disadvantage. However, if the ceiling is sticky, it means that the privileged successfully pass on their favourable social position to their children and block others from entering their group, leading to the closure of the upper (middle) classes.
When examining relative mobility, we generally seek to find the answer to the question of what the relative chances of someone originating from occupational group A to move to group B compared with those originating from group B are (cf. Breen, 2010; Bukodi and Goldthorpe, 2019: 52–70; Ganzeboom et al., 1991; Marshall et al., 1997). In the following, we examine this general question in terms of the service class and the class of unskilled and farm workers. Thus, we are going to review the relative chances of individuals with various origins entering the service class compared with those originating from the service class itself. Then, we are striving to find the answer to the same question for unskilled and farm workers. 9
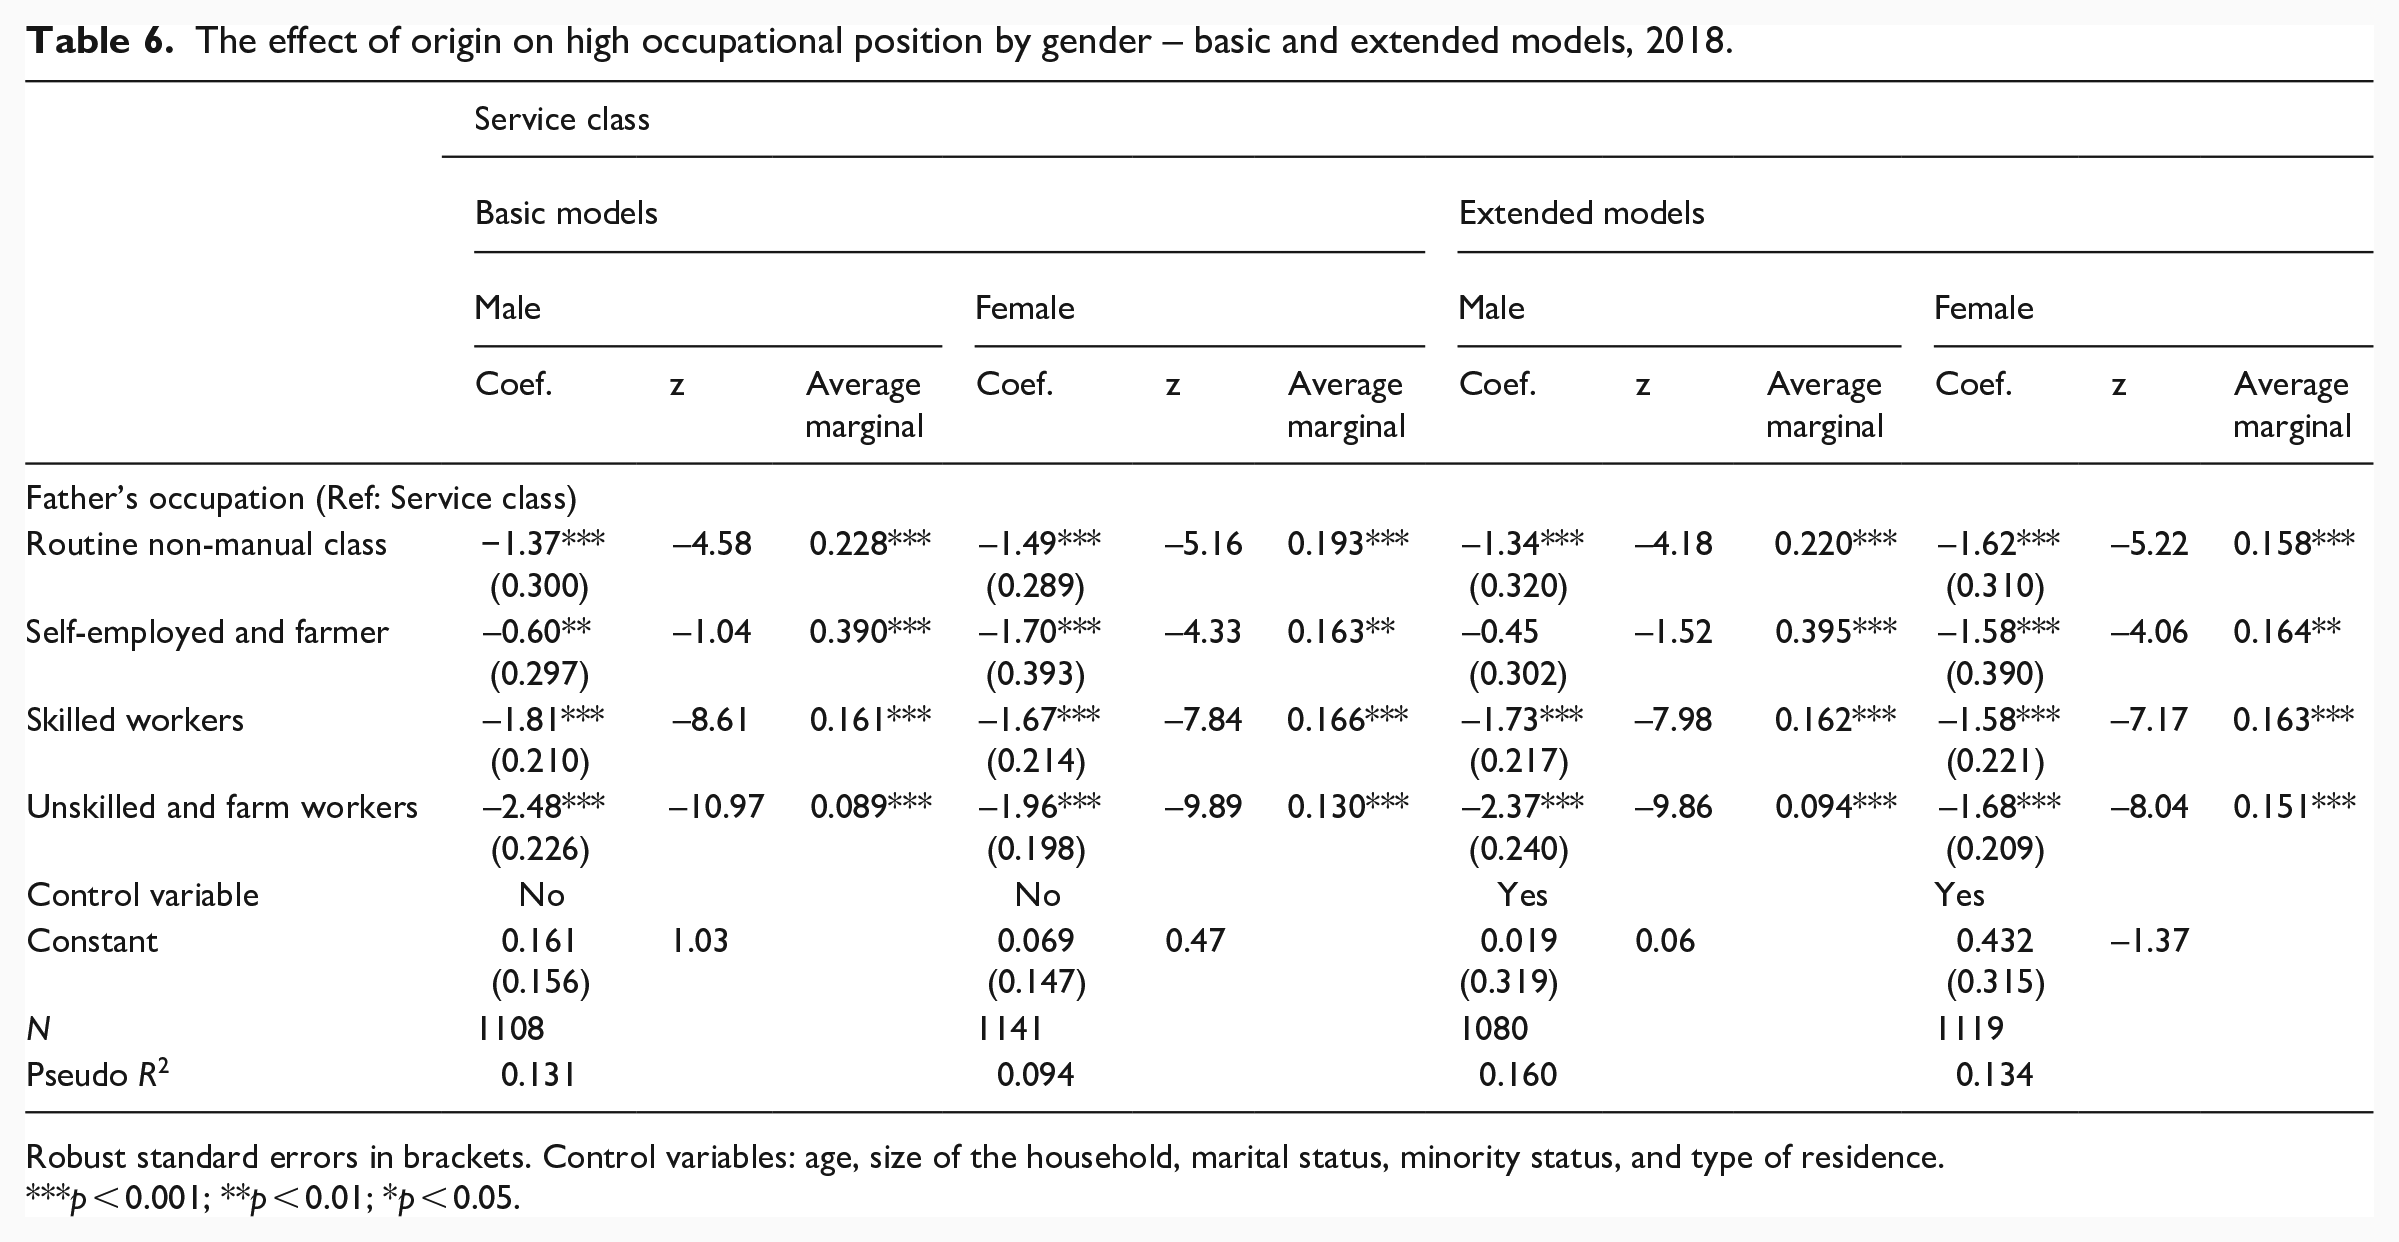
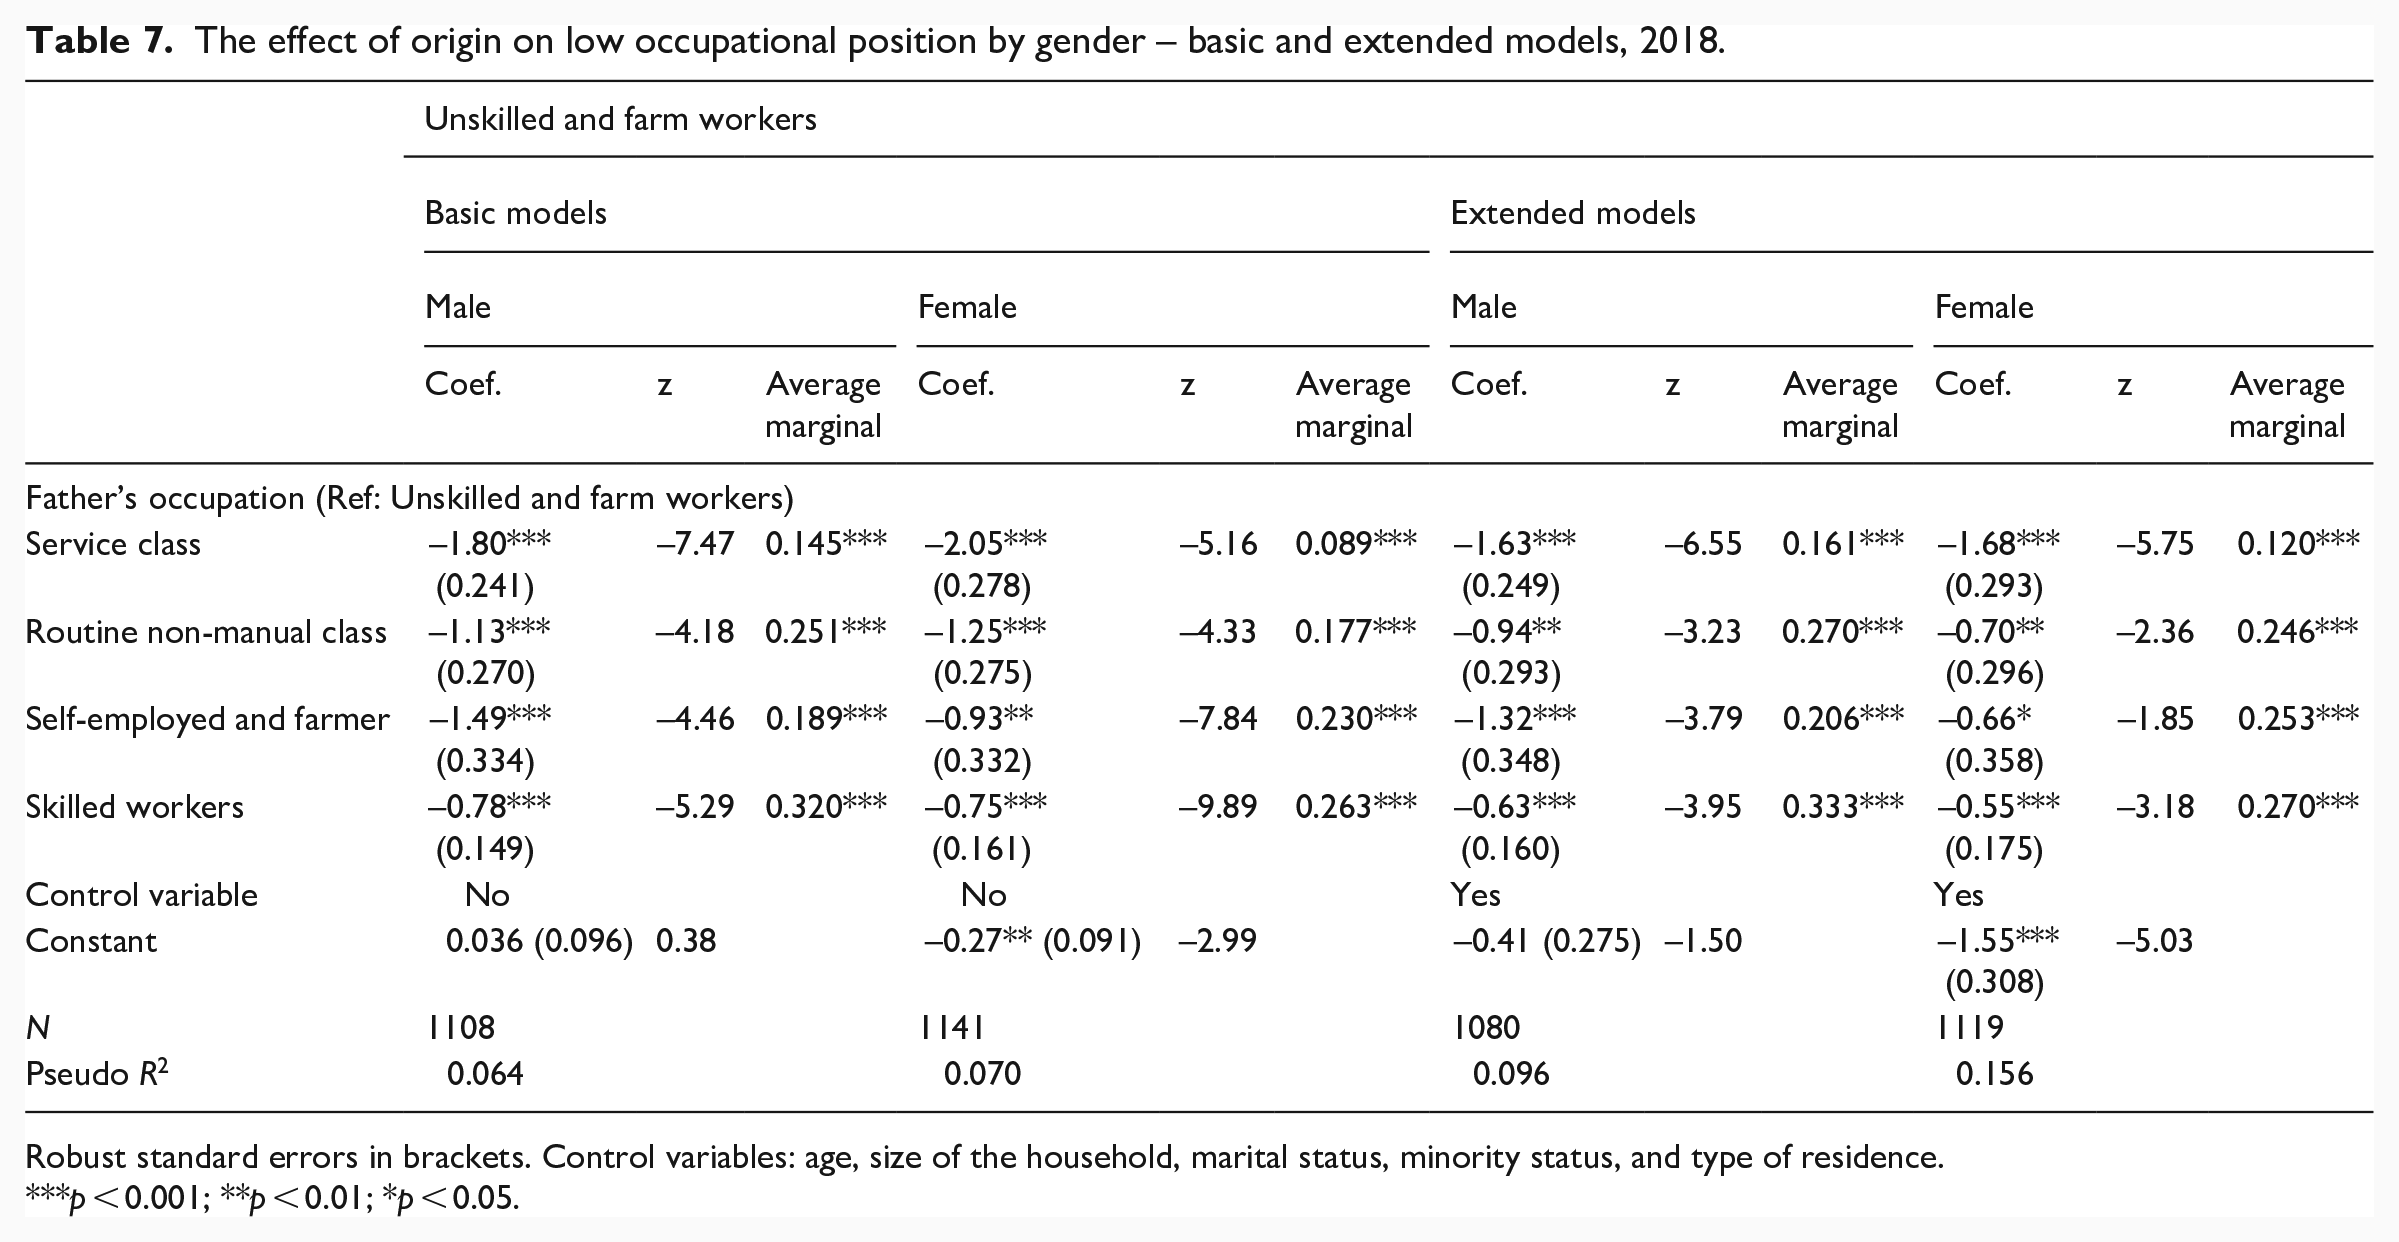
To answer these questions, we performed multivariate regression calculations and ran separate models to compare men and women. The dependent variables of our models were variables measuring the social position of the respondents: (1) low occupational position: is the respondent an unskilled or a farm worker; and (2) high occupational position: does the respondent belong to the service class? As both of them are discrete variables, our models were tested by logistic regression analysis. 10 The models were constructed in two steps: in the first step, only the impact of origin, that is, the social positions of parents, was involved in the equation (basic model); then, in order to eliminate the effect of individual variables deemed relevant by the literature, some control variables were also involved, such as the age of respondents, the size of their household, marital status, minority status, and the type of residence (extended model). The results of the estimations are summarised in Tables 6–7.
The effect of origin on high occupational position by gender – basic and extended models, 2018.
Robust standard errors in brackets. Control variables: age, size of the household, marital status, minority status, and type of residence.
p < 0.001; **p < 0.01; *p < 0.05.
The effect of origin on low occupational position by gender – basic and extended models, 2018.
Robust standard errors in brackets. Control variables: age, size of the household, marital status, minority status, and type of residence.
p < 0.001; **p < 0.01; *p < 0.05.
As for attaining a high social position – that is, regarding the question about how sticky the ceiling is – both the basic and the extended model explains better the heterogeneity of entry into the service class in the case of men (see the pseudo R2 statistics for women and men of Table 6). This means that the effect of social background is more decisive among men: a boy born into a ‘good family’ is more likely to inherit his parents’ favourable social position than a girl of similar background; however, it also implies that boys with a worse social background are less likely to make it to the top social category than girls. The odds ratios are in line with what is expected for both men and women: the less favourable the class of origin was, the less likely it is for anyone to reach the service class. The opportunities of the various occupational groups, however, differ by gender. The self-employed social background tends to reduce the inequality of opportunities among men; in addition, the disadvantage experienced by men is smaller in the routine non-manual class, but bigger in the case of various worker positions.
As far as the question of how sticky the floor is concerned, it should be first noted that the explanatory power of regression equations estimating the chances of ending up in a low occupational position is lower for both sexes (particularly for men) than those of the equations estimating the chances of landing in the service class (see the Pseudo R2 statistics of Table 7).
This implies that the intergenerational transmission of a privileged background is more likely to take place than that of a disadvantaged social position: that is, the ‘floor’ is less sticky than the ‘ceiling’. However, gender differences also prevail in terms of inheriting an underprivileged background, and they have actually proven to be even more prominent. Unlike the results seen for service class, in the case of unskilled and farm workers the effect of social background is more decisive among women. Thus, girls with disadvantaged backgrounds will be more likely to be disadvantaged themselves in their adulthood than boys in similar position. The odds ratios associated with the various occupational groups reveal two other interesting results. One is that self-employed background provides more protection to men than to women. The other is that a more favourable – service class or routine non-manual – family background offers more protection for women. Of the children of white-collar parents, girls are less likely to drop to the bottom of the society than boys. 11
Gender differences in terms of getting into the higher and lower class categories were also examined in an alternative way. In doing so, we ran our models on the entire sample, and in addition to the gender variable, we also included variables measuring the interaction effect of gender and the various origin categories in the models (see Tables S5–S6 for detailed results). These alternative calculations confirm that the ceiling appears stickier than the floor. The direct effect of gender is not significant for service class, but for unskilled and farm workers it shows a higher chance for men to get in, reflecting the gender distribution in the two occupational groups concerned. Based on the interaction effects, women with unskilled and farm workers backgrounds have significantly less, while those with self-employed and farmer backgrounds have a higher chance to get into the service class compared with men from the same background. In terms of getting into the low occupational position, significant differences can be observed only in the case of those with the most favourable background: women of service-class origin are almost three times less likely to get to the bottom of the occupational hierarchy than men. These results are consistent with the previous ones obtained based on the independent models.
Conclusion
In our study, we examined the development of social mobility in Hungary between 1973 and 2018. In doing so, while relying on previous studies of mobility research, for the first time, we present results for changes after 2010. Thus, our article is a national study that, by highlighting the case of Hungary, can contribute to the discussions on long-term social-mobility trends and national peculiarities.
The review of Hungary in the 2010s is particularly important in this respect, given that, on the one hand, the global financial downturn and the subsequent boom have led to significant economic changes in Hungary. On the other hand, due to the lasting rule of the right-wing populist Fidesz, profound institutional and social policy changes also took place during this period. Although the expected effects of these factors are diverse, we assumed that these significant economic and political changes affect the mobility processes of Hungarian society.
As a matter of fact, our analysis confirmed that trends observed earlier continued in the 2010s in all respects. These results show the strength of the trends started earlier and the permanent nature of the main patterns of the Hungarian mobility regime. The economic and political changes unfolding since 2010 do not seem to have been able, or at least have not yet been able, to change them substantially: the main patterns of mobility in Hungarian society are resistant to change.
Total mobility continued to decline slightly at the end of the 2010s and it hit its lowest point in decades. Besides, in addition to decreased total mobility, negative trends also continued with respect to the direction of mobility: a decreasing proportion of the population move upwards compared with their fathers and an increasing proportion experience the deterioration of their social position. While earlier research found that structural changes in society triggered upward mobility in the decades preceding the change of the political regime, after 1990 the transformation of occupational structure has slowed down and even polarising tendencies began. In this period, structural mobility increasingly typically meant downward mobility. Thus, despite the economic and political changes, Hungary remained a low mobility country, where, in addition, upward mobility shows a declining, while downward mobility an increasing trend.
Based on the results of our analysis of relative mobility chances associated with working in high and low occupational positions, we concluded that the ceiling seems to be stickier than the floor as a rule, that is, the role of origin is more decisive in keeping a favourable social position than in the transmission of a disadvantaged position across generations. The odds for someone born into unfavourable circumstances to rise are greater than for those of someone who was brought up in privileged circumstances to slide down.
Earlier research on intergenerational class mobility consistently measured more favourable outcomes for women than for men during the past decades. Our article partly confirms these results, however, having thoroughly examined the mobility paths of women and men as well as the intergenerational transmission of top and bottom class positions, we have also pointed out that gender inequalities did not decrease substantially. On the one hand, higher total mobility rates among women as well as their upward mobility trends stem from the characteristics of the method of measurement. If the respondent’s origin is not measured by the father’s occupational class, but by using the dominance approach, most of the differences between the sexes vanish. On the other hand, relative mobility chances also suggest strong gender inequalities. Boys coming from service class families have better chances of retaining their class of origin, whereas in the case of disadvantaged families, it is girls who are more likely to inherit the unfavourable social position of their parents, while boys have better chances of climbing up.
Our study examined the development of intergenerational occupational mobility in Hungary after 2010 for the first time. According to our results, despite the significant economic and political changes of the last decade the main patterns of social mobility remained unchanged in Hungary. Our study, however, has clear limitations that should be addressed by future research. On the one hand, the dataset we used only allowed us to examine the evolution of absolute mobility over time, but we could not explore the changes in relative mobility. On the other hand, it is also the task of future research to explore the direct empirical links between social mobility and the recent economic and political changes in Hungary.
Supplemental Material
sj-docx-1-sro-10.1177_13607804221084727 – Supplemental material for Resistance to Change: Intergenerational Class Mobility in Hungary, 1973–2018
Supplemental material, sj-docx-1-sro-10.1177_13607804221084727 for Resistance to Change: Intergenerational Class Mobility in Hungary, 1973–2018 by Ákos Huszár, Ágnes Győri and Karolina Balogh in Sociological Research Online
Footnotes
Funding
The author(s) disclosed receipt of the following financial support for the research, authorship, and/or publication of this article: This work was supported by the National Research Development and Innovation Office (Grant No. FK 131997) and the MTA Cooperation of Excellences Mobility Research Centre project.
Notes
Author biographies
References
Supplementary Material
Please find the following supplemental material available below.
For Open Access articles published under a Creative Commons License, all supplemental material carries the same license as the article it is associated with.
For non-Open Access articles published, all supplemental material carries a non-exclusive license, and permission requests for re-use of supplemental material or any part of supplemental material shall be sent directly to the copyright owner as specified in the copyright notice associated with the article.