
Abstract
This article discusses the use of autonomous, asynchronous, timelines to analyse personal and organizational experiences of COVID-19 using an online platform, LucidSpark. We evaluate the benefits and limitations of this approach and highlight findings in three areas: aesthetics, the balance of personal and organizational information, and the identification of key events. We argue that timelines generate fascinating data about participants’ personal and professional experiences of COVID-19. Then, we discuss the limitations of the data, and suggest how the method may be refined and used in combination with other approaches. By themselves, timelines provide limited data about how events relate to each other. Instead, timelines serve as useful pre-interview activities that should be combined with additional methods.
This article discusses the methodological benefits and challenges of autonomous, asynchronous, online timelines to analyse personal and organizational experiences of COVID-19. We evaluate the benefits and limitations of using online whiteboards for participants to complete timelines autonomously, rather than face-to-face timeline development during interviews. For this project, 32 staff members at drug and alcohol support organizations in the north of England were asked to complete a timeline of their personal and professional experiences of COVID-19 between March 2020 and February 2021. Timeline data collection took place over a 10-day period in March 2021. We developed a template on the online whiteboard platform LucidSpark (2021), which participants were asked to complete. This activity was part of a larger project evaluating how COVID-19 has impacted the delivery of drug and alcohol services to produce guidance for public health commissioning and service innovation.
First, this article discusses the context for this research, in terms of service delivery disruption caused by COVID-19; then, we provide a summary of existing methodological literature on the use of timelines, highlighting the innovation of online, autonomous, asynchronous, timelines. Next, this article describes the method we developed and the findings. Three key areas are highlighted: aesthetics, the balance of personal and organizational information, and the identification of key events. Finally, we discuss the extent to which timelines provide valuable insight into staff members’ experiences, the limitations of the data produced, and how the method may be refined and used in combination with other approaches.
Context: about and because of COVID-19
This article reports on work produced under the auspice of the Public Health Intervention Responsive Studies Teams based at the University of Hertfordshire, one of six teams established by the National Institute for Health Research (NIHR) to deliver public health intervention evaluations in the UK (Walters, 2020). This work was produced for a project exploring changes to the delivery of drug and alcohol services by three organizations in the north of England during the COVID-19 pandemic.
COVID-19 restrictions have caused major changes in the delivery of drug and alcohol services, including the cessation or reduction of face-to-face support and a move to remote delivery of support and treatment (either over the phone or video-call). Since March 2020, services have had to adapt to a fluid landscape and, at different times, activities have been suspended, transformed, or adapted. In addition, the organizations under evaluation needed to accommodate the personal impact that COVID-19 had on its staff members due to working-from-home arrangements, caring responsibilities, illness, well-being support, and so on.
Overall, COVID-19 has put organizations under significant stress, forcing them to reconfigure services while continuing to meet the needs of service users and support staff. The timeline activity sought to explore how services changed because of COVID-19, how staff members experienced these changes and, particularly, how new ways of working interacted with personal events (e.g. illness, child-care).
Timelines, re-imagined
Timelines are a visual data collection method where a participant creates a chronological arrangement of events and may add visual cues to indicate the significance of each event or its relationship to other events (Bagnoli, 2009; Patterson et al., 2012). Visual methods are well established in social sciences research with the use of photographs, drawings, films, maps, Internet pages, and other elements (Stiles, 2004; Warren, 2009; Wills et al., 2016).
Timelines are useful in producing and arranging complex, dynamic, and emotional data to generate research insights (Mazetti and Blenkinsopp, 2012; Warren, 2009). Timelines may also facilitate the recollection and sequencing of personal events (Gramling and Carr, 2004). Timelines are related to, although distinct from, life grids, which also allow participants to identify key events but focus on longer periods over a life span (Wilson et al., 2007). Thus, timelines seem particularly apt to explore the changing landscape of COVID-19 experiences.
Timelines have long been used in research about experiences of health and illness, such as clinical behaviours (Umoquit et al., 2008), weight loss (Sheridan et al., 2011), or barriers to health among homeless people (Patterson et al., 2012). There are several examples of timelines used to explore drug use and life experiences. Boyd et al. (1998), in a study of African American women who smoke crack, created ‘life lines’ akin to timelines based on participants’ interviews. These timelines linked life events (e.g. rape, deaths) with drug use. Friedman et al. (2008) explored drug injecting behaviours and HIV/HCV and developed, with participants, timelines that acted as a reference framework for the interview and helped identify patterns. Berends et al (2011) sought to understand trajectories of drug use by means of timelines that identified substance use, critical life events, and treatment pathways through timelines co-created with participants before the interview.
Timelines may take various shapes and forms, from an ‘A4 sheet with a horizontal axis where drug use was plotted above the line and treatment experiences below the line’ (Berends, 2011: 4) to displays that incorporate words and imaginery, and may be in not only a linear shape but also a wave or spiral. In fact, Kolar et al. (2015) argue that any timeline analysis should consider both the content and the form.
Even though this work informed our decision to develop a timeline activity as part of our data gathering, we also remained aware of the fact that, unlike our proposed work, existing research had so far focused on timelines as tools used during interviews, created as part of a face-to-face encounter between the participant and the researcher. Thus, timelines served to structure and/or complement spoken data, mutually enhancing accuracy and completeness, generating rapport between participant and researcher, and providing structure to the conversation (Kolar et al., 2015).
For our project, we asked participants to complete an online timeline template autonomously, in their own time, as COVID-19 restrictions prevented us from meeting participants face-to-face. However, a key motivation to develop an online timeline tool was also because our project focused on experiences of remote service delivery when face-to-face work was impossible and, thus, a remote methodology seemed particularly appropriate.
Method
This project involved 64 staff members at three partner organizations who volunteered to take part. These participants had varied roles, from newly recruited front-desk staff to long-term senior leaders. At enrolment, all were asked basic information about their work and graded their IT literacy from 0 to 100 using a slider. All had access to well-being support from their organization, and safeguarding and distress protocols were in place. A sample of 34 participants were invited to complete the timeline: participants included front-line workers, middle and senior managers, with diverse responsibilities who provide services for people struggling with alcohol and substance use (e.g. support work, medical services). On average, they had been working for their organization for 3.25 years and had an average self-declared IT confidence of 81/100. Some participants were also invited to attend a focus group or an interview (or both) at a later date based on their job role and experience. The timeline was developed on LucidSpark, cloud-based virtual whiteboard, compliant with UK data protection legislation, part of the collaboration software suite by Lucid, a US-based company (Lucid, 2021). Although LucidSpark is advertised as facilitating real-time collaboration between multiple users, we instead generated one ‘board’ per participant so that they could work on their timeline independent of other participants.
The 34 participants selected to complete a timeline were emailed a personalized invitation, a link to the online platform with the timeline template, and a short video with basic instructions on functionality. The instructions also reminded of the availability of well-being support throughout the process. Invitations were for a 10-day window in March 2021. Participants were told they could access their online timeline as often as they wished via the same link.
As Figure 1 shows, each board contained a timeline template composed of a horizontal line marked by months between March 2020 and February 2021. The timeline included seven ‘events’ above the line to help participants recall their experiences. A horizontal line was chosen as a central feature for participants to attach comments to it using built-in platform tools. The selection of events and images was conducted in collaboration with the Public Involvement in Research Group (PIRg) for PHIRST and local partners, who supported the authors in identifying key events and ensuring relevance to the project and for the participants. PIRg members also piloted the LucidSpark tool and helped develop clear instructions for participants. The timeline included short descriptive items such as ‘March 23 – National lockdown commences’ and ‘April 5 – PM [Prime Minister] admitted to hospital’. Four images were also added to enhance the template visually: these were images of the city during lockdown or graphic designs used by the city council and the organizations (thus, also easily recognizable for local participants). The images sought to generate a sense of familiarity and spark memories. In each timeline, participants were provided with basic instructions about the goal of the activity. These included: [. . .] Please use the timeline below to add events you feel are relevant to how the drug and alcohol services you are (directly or indirectly) involved with changed from March 2020 to February 2021, and your experiences of those changes. These might be changes in what your organisation or team does, or changes to your individual role or the way you work. They can be small or large things. You can include things like working from home, ways you were supported, or personal things such as changes to your daily routine or interactions. [. . .]
To complete the timeline, participants would create sticky note–shaped text boxes through a side-bar menu (where they could also choose 1 of 16 different colours), drag them to the location they wished, add text, and link them with an automatic arrow to the timeline (this was easier to do with a single horizontal line than curved or circular one, which complicated the automatic system). These sticky notes would automatically expand to accommodate text and could overlap each other. On 25 March, all timelines were downloaded in PDF. They were analysed using a framework analysis, a form of thematic analysis where researchers systematically summarize data into ‘codes’ and ‘cases’ to identify emerging themes (Gale et al., 2013).
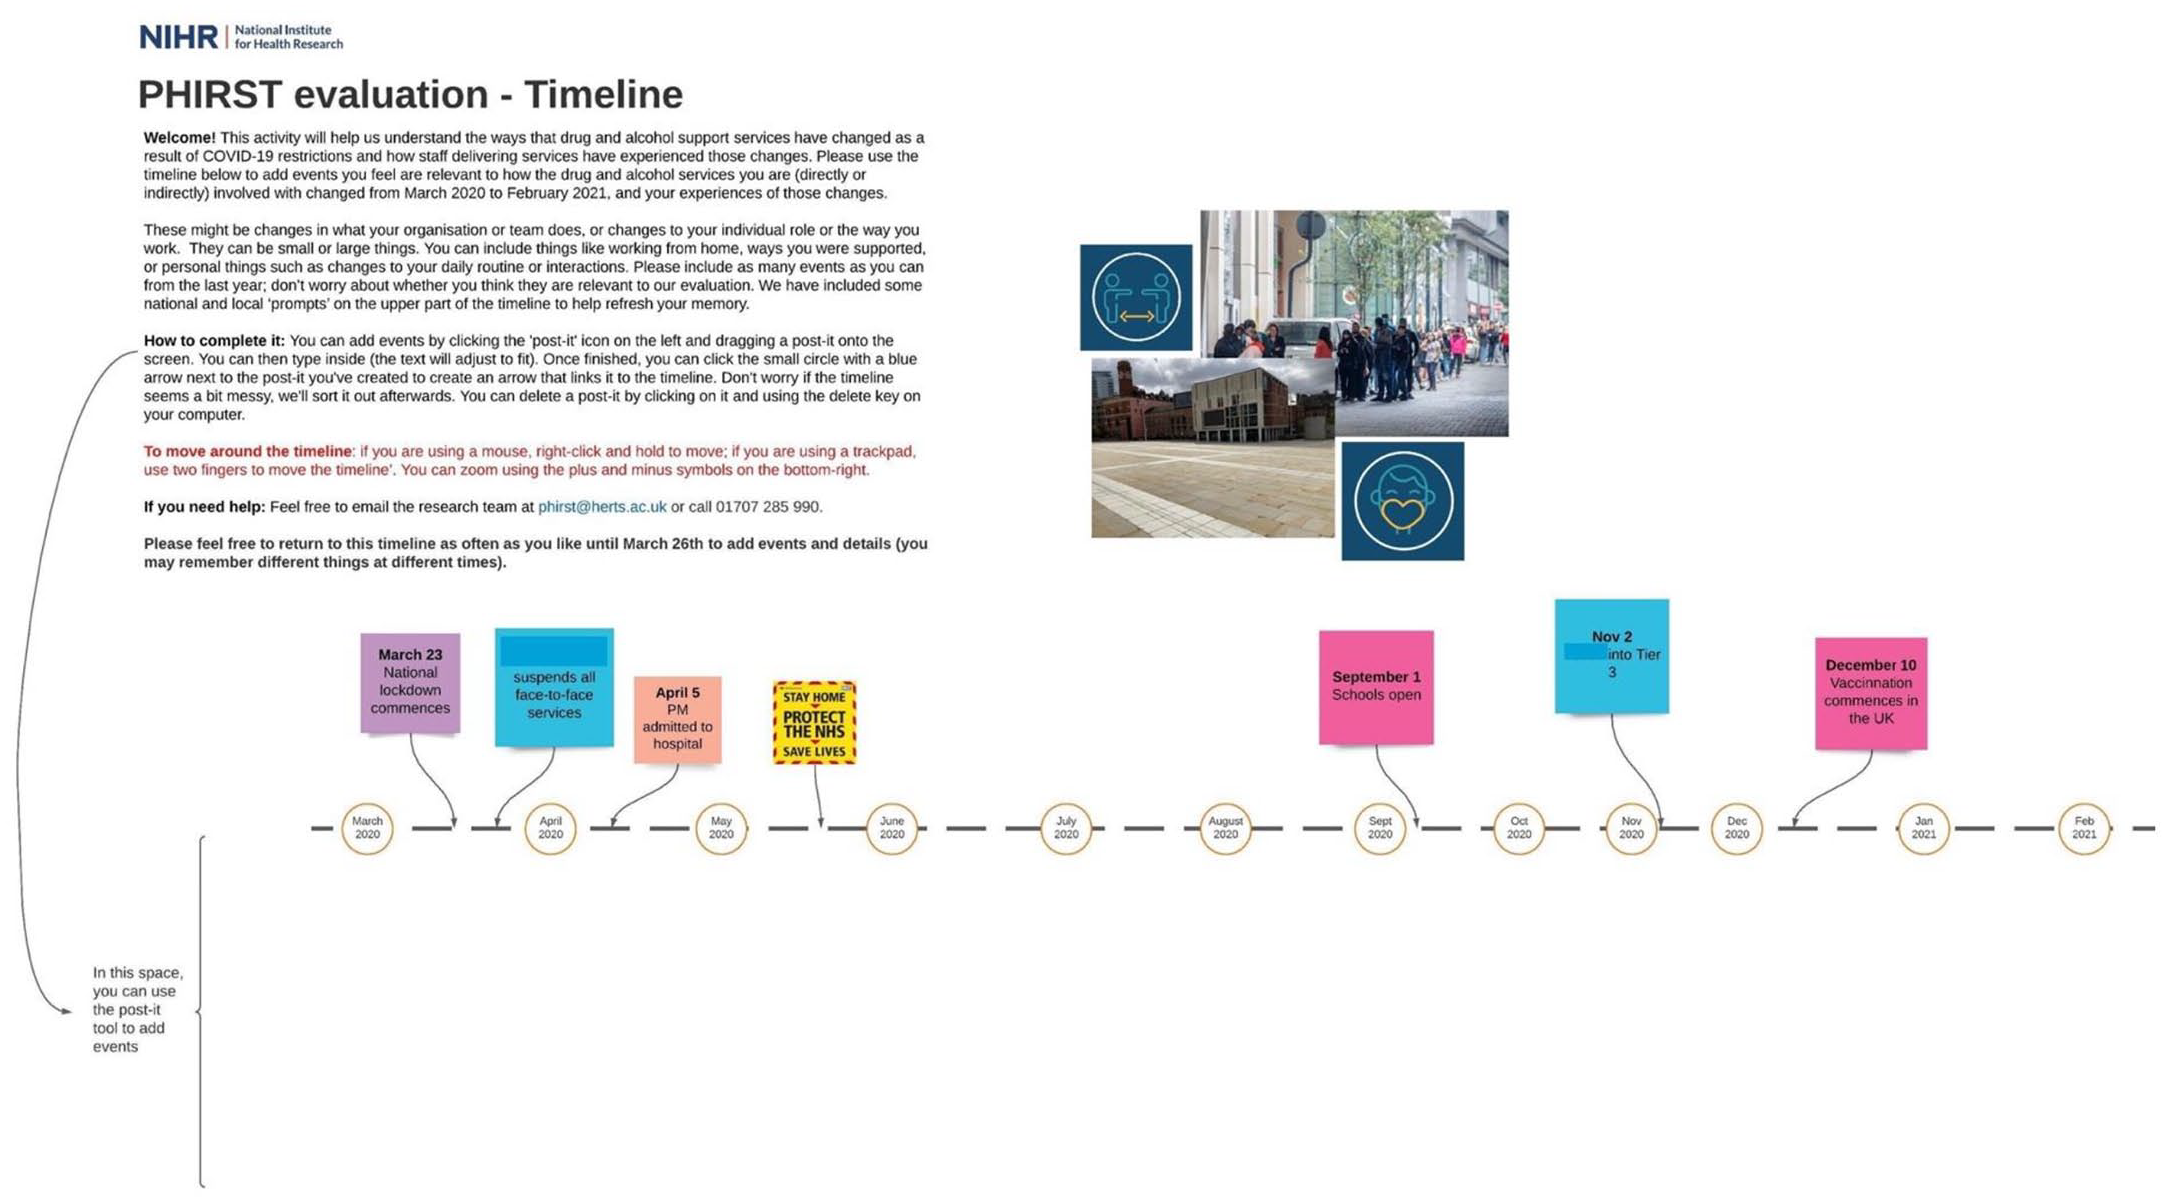
Timeline template.
A key consideration relates to safeguarding. Timelines asked participants to recall events from a potentially traumatic and distressing period of their lives. While doing it autonomously on their own time may be more convenient (allowing them to choose a time/place they feel comfortable in), it also means that it is harder to identify potentially distressing situations than if completion took place face-to-face. To minimize these risks, we developed a comprehensive distress and safeguarding protocol whereby participants were reminded that they could access existing support from their employing organizations and/or contact the research team using specific phone numbers to debrief during completion of timelines.
Findings
Of the 34 participants invited to the timeline activity, 19 completed the task by the deadline. The analysis identified emerging themes related to staff members’ experiences, such as the role of IT equipment in their capacity to continue working, the quality of well-being support, issues with other organizations, and so on. For this article, we will focus on the three themes related to the methodological use of the timeline tool: the aesthetics of the timelines, the balance between personal and organizational information, and the emergence of key events.
Aesthetic choices
In line with findings by Mazetti and Blenkinsopp (2012), completed timelines varied widely in their appearance and stylistic choices. Figures 2 and 3 show two different examples.
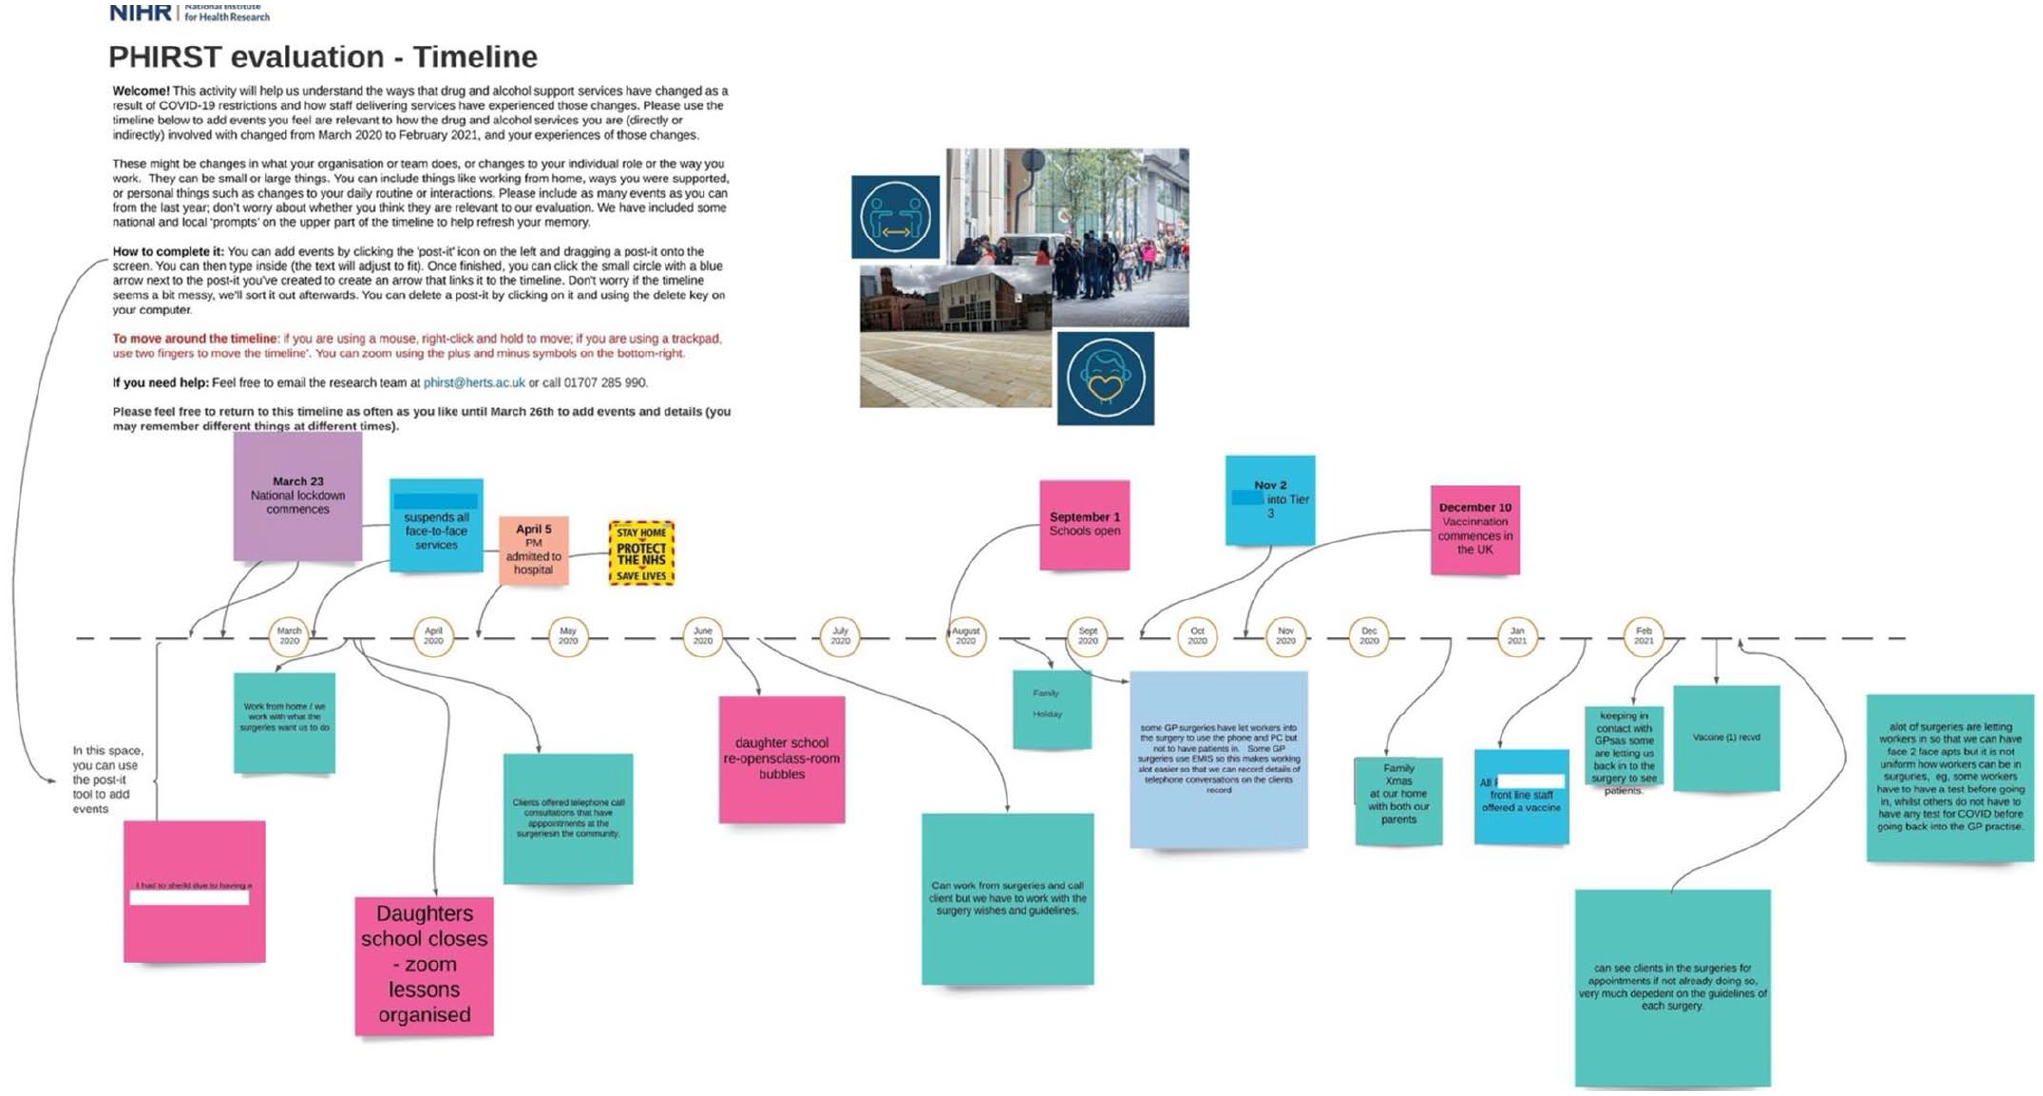
Neatly arranged timeline (identifying information has been redacted).
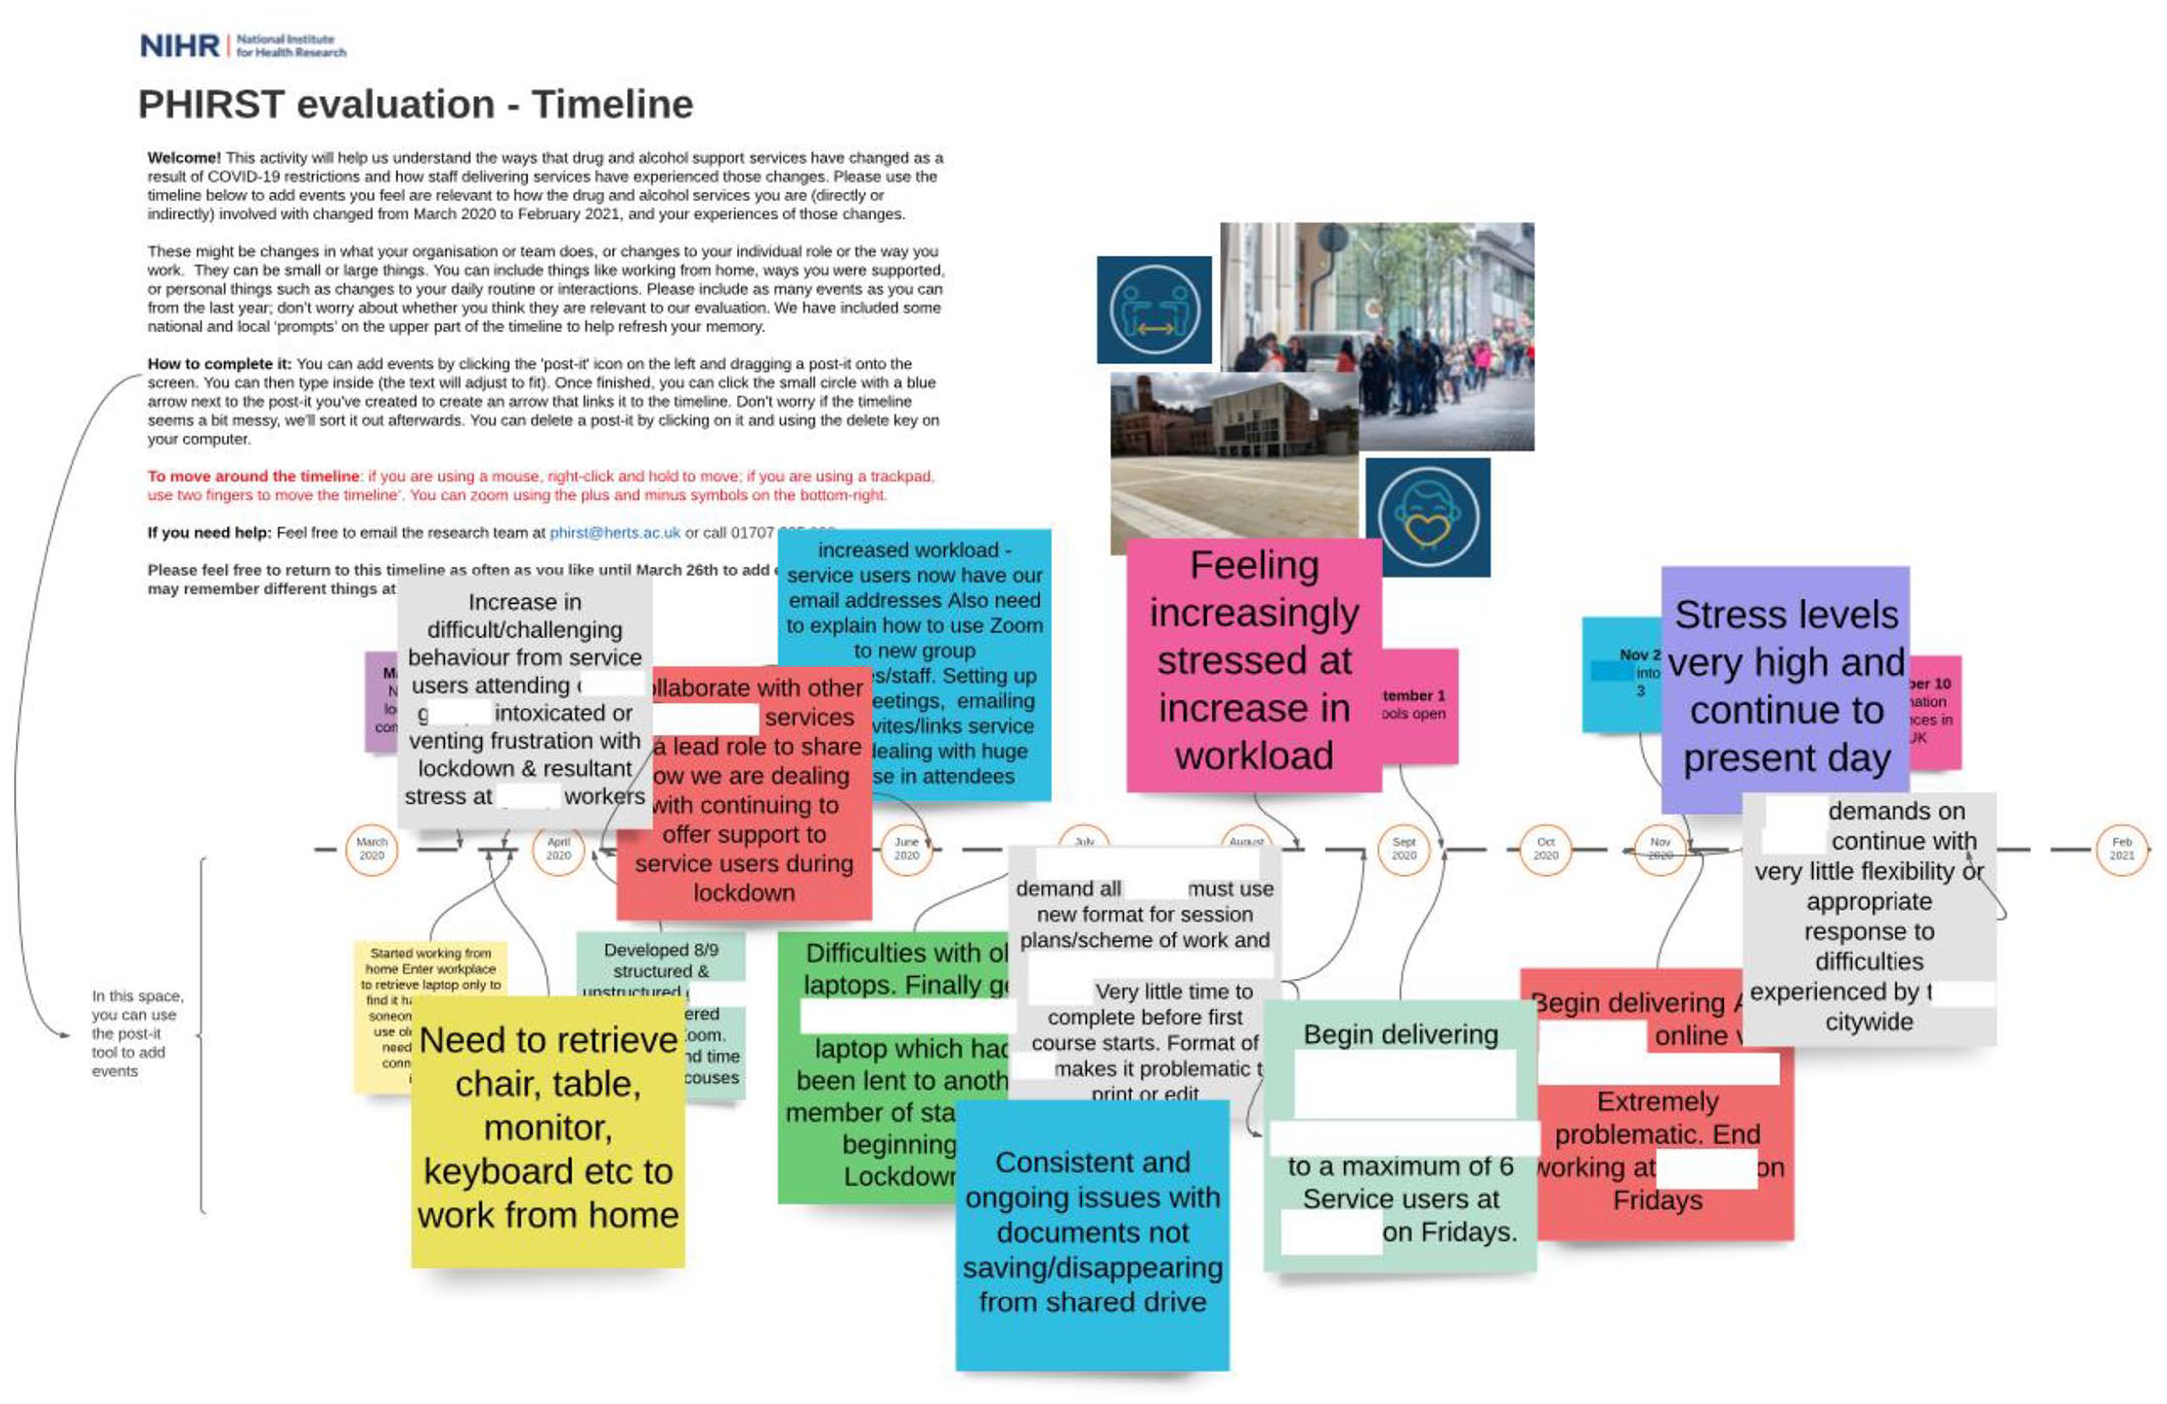
More disorganized timeline (identifying information has been redacted).
Figure 2 shows a timeline from a participant who neatly arranged each sticky note to maximize readability and colour coded them (pink for family-related events, green for work events, and blue for other events). The pink notes narrate experiences of home-schooling and shielding, whereas the green and blue ones talk about working from home and the new requirements to work from primary care practices. By contrast, Figure 3 shows a timeline that is rather disorganized in its arrangement of sticky notes and without discernible colour-coding pattern, contributions overlap with each other, making it impossible to read without rearranging them. We learn about the participant’s struggles to get IT equipment, their feelings of isolation and stress, the challenges of meeting new requirements for their work, or the poor response by city officials, among other things. In line with this, a second element emerges: some participants wrote abundant, short, descriptive contributions while others chose to provide fewer but longer and more narrative texts. For example, for April 2020, one participant, a practitioner working with people with alcohol issues, wrote several short contributions, such as ‘clients offered telephone call consultations that have appointments at the surgeries in the community’ (mid-April). Another participant, a team manager, was even briefer, writing comments such as ‘started working from home 4 weeks out of 5’ or ‘Responsibility passed over to me for ordering PPE’. In contrast, a staff member working with opiate users wrote a single entry for that month but did so in a much lengthier, narrative tone: More telephone consultations now, not able to make usual assessments, examinations, testing, etc. new skills needed to be developed. I was unable to work from home as there was not sufficient laptop for this, and my own was not deemed secure enough. Scripts still needed to be printed and signed, as the law still not allow electronic scripts to go to pharmacies for controlled drugs. Concerns regarding the truthfulness of the information from patients about their drug use.
These differences may come down to factors such as IT literacy: those more confident with the online platform may have decided to add more sticky notes, arrange them or colour-code them, whereas those who felt insecure might have tried to write longer texts so as to add fewer sticky notes. However, all the participants quoted in this article evidenced similar self-reported levels of IT literary when they consented to take part (ranging from 70 to 96 out of 100).
It is also possible that these timelines reveal how participants approached the activity. They were asked to retrospectively recall their experiences over 12 months and locate them in a linear timeline. In addition to a possible telescoping effect (Janssen et al., 2006), the stress and changes brought about by COVID-19 might have made this, for many, a challenging task: far from linear, their memories may be convoluted, circular, wavy, or hazy. If this activity had been done face-to-face (as some earlier studies report), some participants would have neatly walked the researcher along their timeline, others might have jumped backwards and forwards; some might elaborate little on their experiences, others might talk at length about events. How timelines are arranged by participants may provide a glimpse of both how they approached the activity and how they recall their experiences of the pandemic. Significantly, the variety of contributions was also facilitated by the instructions provided being intentionally left vague about how many contributions to add or their style. As this was early-on in the research, we hoped that this would allow for more emergent themes to arise.
Organizational and personal information
The most significant difference appeared between participants who prioritized organizational information and those who provided a mixture of both personal (e.g. family life, illness) and organizational details (e.g. work processes, working-from-home). This seemed to come down to individual choice rather than job role or seniority.
For example, a team manager only contributed five posts to their timeline, all work-related, such as ‘pubs reopened in the UK, referrals for alcohol support increased’ (July 2020), or ‘staffing changes’ (January 2021). However, another manager with similar experience, combined organizational information with personal details: alongside contributions such as ‘contacted relevant agencies with updates including whose who provide group activities’ (March 2020), they wrote, in September: ‘my birthday, spent alone sat in the garden talking to family and friends on the phone. My daughter was staying at his [sic] mother’s and too ill for me to visit due to covid (suspected covid) and was advised to isolate’ and, some days later, ‘my daughter had been unwell for a while and on this date was diagnosed with a rare genetic disorder’. This balance continues for the remainder of the timeline. For example, on December 2020, they wrote ‘face to face groups cancelled due to tier 3 and increased number of online groups’ alongside ‘working from hospital much of the time. Unable to see friends or family’.
Previous research has recommended the development of face-to-face timelines to build rapport between participants and researchers (Kolar et al., 2015). However, our online timelines highlight that some participants provided information about their children’s illnesses, or feelings of loneliness or isolation, which suggests that asynchronous, autonomous, online timelines also provide a space for participants to reflect on what they felt was relevant and share it in confidence with a research team that they have not met in person.
Key events
Several events routinely appeared across participants’ timelines, which we have termed ‘key events’ as they seem important to both participants and organizations. For example, between January and February 2021, many participants wrote about home-schooling: ‘kids stayed home. Zero home schooling took place, too busy’ wrote a senior manager, while one of the practitioners wrote ‘daughter school closes’. Similarly, starting to work from home also appears as a ‘key event’: one lead manager writes ‘starting home working, 2 weeks into lockdown-ish’, another comments ‘started working from home. Entered workplace to retrieve laptop only to find it had been lent to someone else. Had to use old laptop that needed cable to connect to internet’. Similarly, almost all participants noted down the date of their first COVID-19 vaccine. These are just some examples, but iterations of these events appeared across most timelines, which reveals that the move to home working, childcare responsibilities, and vaccinations, were key events in participants’ experiences of working during COVID-19.
The timeline was our first data-gathering activity: identifying these events as ‘key’ to participants’ experiences served to refine the interview and focus-groups schedules to further explore these events and their significance. The relevance of working from home compelled the development of a question about how staff members had accessed the required IT equipment; the emphasis on childcare led to questions about how participants had managed to hold work conversations around sensitive or confidential topics around their family; and the mentions of vaccines compelled us to ask whether participants were concerned about returning to face-to-face work.
Discussion and conclusion: some benefits, many limitations
The 19 timelines obtained provide fascinating data about participants’ personal and professional experiences of COVID-19. They have been particularly useful to gather information about single events, which have allowed us to start understanding the experiences of service provider participants living and working during a pandemic (Mazetti and Blenkinsopp, 2012). It is also rewarding to see that the timeline became a space where participants felt comfortable enough to share private aspects of their lives, such as the illness of a child (Kolar et al., 2015). Timelines also provide visually enticing images: through the accumulation of sticky notes, colours, and arrows, they illustrate how complex and difficult the past year has been. All this was possible with little resource-investment on the part of the research team, as participants completed the timelines on their own.
However, despite these benefits, autonomous and asynchronous timelines pose significant limitations. Most importantly, by themselves, timelines contain information about single events but fail to provide data about how events relate to each other. For example, one participant described both service changes and the illness of their son. On its own, their timeline fails to give insight about how, for example, working from their son’s hospital room influenced their job performance. That is, timelines do not provide overarching narratives about how multiple events are related, which severely limits their usefulness as stand-alone methods. Furthermore, timelines require participants to recollect events from their past, which may impede accurate recollection.
In previous research, timelines were developed during face-to-face meetings with participants, as part or preface to an interview. The timeline and interview framed and complemented each other, mutually developing their data. By developing timelines autonomously, the data gathered has significantly limited the potential for analysis. Instead, timelines have served as useful pre-interview activities both for the participants and the researchers. First, timelines provided ‘key events’ that guided the development of further research, identifying important changes. Second, participants who had completed a timeline activity arrived at the interview having reflected on their experience.
Overall, timelines are a useful tool to research complex processes over time, both at the personal and organizational level. However, they should be combined with additional research methods that can provide more in-depth data about how events relate to each other. Asynchronous, autonomous, online timelines may, however, be useful for research situations with limited face-to-face capacity and large number of participants to identify research themes and refine research questions. Further research should consider ways to allow participants to more freely represent their experiences without constricting them to a linear form, and seek to develop more interactive approaches that minimize potential harms.
Footnotes
Acknowledgements
We thank the members of the PHIRST PIRg group and the members of the Advisory Board and Local Authority for their support in developing this tool. The views expressed are those of the authors and not necessarily those of the NIHR or the Department of Health and Social Care.
Funding
The authors disclosed receipt of the following financial support for the research, authorship, and/or publication of this article: Funding is provided by the National Institute for Health Research (NIHR) PHIRST initiative (Public Health Research funding stream) [Funders reference: NIHR131573. Project reference: NIHR133206]. This report presents independent research commissioned by the National Institute for Health Research (NIHR). The views and opinions expressed by authors in this publication are those of the authors and do not necessarily reflect those of the NHS, the NIHR, MRC, CCF, NETSCC, the Public Health Research programme, or the Department of Health. The views and opinions expressed by the participants in this publication are those of the participants and do not necessarily reflect those of the authors, those of the NHS, the NIHR, MRC, CCF, NETSCC, the Public Health Research programme, or the Department of Health.