
Abstract
Introduction:
Maximal acceleration time of distal arteries of the foot (ATmax) is correlated to ankle–brachial index (ABI) and toe–brachial index (TBI), and seems very promising in diagnosing severe peripheral artery disease (PAD) and especially critical limb-threatening ischemia (CLTI). Our goal was to confirm the cut-off value of 215 ms to predict a toe pressure (TP) ⩽ 30 mmHg.
Methods:
A 4-month retrospective study was conducted on patients addressed for suspicion of PAD. Demographic data, ABI, TBI, and Doppler ultrasound scanning parameters of the dorsal pedis and lateral plantar arteries (DPA and LPA) were recorded.
Results:
A total of 137 patients with 258 lower limbs were included. ATmax was highly correlated to TBI (r = −0.89, p < 0.001). With the cut-off value of 215 ms, ATmax was effective to diagnose TP ⩽ 30 mmHg with a sensitivity of 93% [95% CI 77–99], a specificity of 96% [95% CI 92–98], a positive predictive value of 73% [95% CI 56–86], a negative predictive value of 99% [95% CI 97–100], and an area under the receiver operating characteristics curve of 0.99 [95% CI 0.98–1.00]. ATmax also showed promising results to rule out PAD in healthy patients.
Conclusion:
ATmax is a reliable diagnostic tool to diagnose low TP and could be a new easily performed hemodynamic criterion for diagnosis of CLTI.
Keywords
Introduction
Despite significant advance in cardiovascular management over the last decades, lower-extremity peripheral artery disease (PAD) remains a burden worldwide with an increasing prevalence. Critical limb-threatening ischemia (CLTI) is considered as the last stage of PAD and, hence, associated with a high mortality–morbidity rate with a historical 12-month mortality rate of 22% and 12-month major amputation rate of 22%. 1 However, CLTI diagnosis remains a challenge in everyday practice.
Even if still debated in literature, diagnosis of CLTI is most commonly based on the presence of both a clinical and a paraclinical criteria. 2 The paraclinical criterion must at least meet one of the following situations: ankle–brachial index (ABI) < 0.4, ankle pressure (AP) < 50 mmHg, toe pressure (TP) < 30 mmHg or transcutaneous oxygen pressure (TcPO2) < 30 mmHg.3,4 In recent guidelines, the authors emphasize that pressure measurements should always be correlated with arterial Doppler waveforms (DW) to avoid false negatives even if no clear guidelines are given on how DW analysis could lead to CLTI.4,5 Regarding the clinical criteria, CLTI includes any patients with ischemic rest pain (typically in the forefoot) or gangrene involving any portion of the foot or lower limb or nonhealing lower-limb or foot ulceration ⩾ 2 weeks duration. 3 The term CLTI implies chronicity and is to be distinguished from acute limb ischemia.5,6
Most guidelines emphasizes that AP and ABI alone are unreliable tools to diagnose CLTI.3–5,7 Bunte et al. showed that 29% of patients with clinical and angiographic features of CLTI had an ABI between 0.7 and 1.4. 8 Salaun et al. showed that AP < 50 mmHg alone failed to identify 42% of the CLTI patients in a cohort of 556 patients. 9 TBI and TcPO2 are often considered more accurate to diagnose CLTI.2,4,7 Unfortunately, their accessibility remains their main limitation. AP and Doppler ultrasound (DUS) are usually more easily accessible than TP, TcPO2 or skin perfusion pressure.
More recently, several studies have highlighted the correlation between acceleration time (AT) on pedal arteries and either ABI or TBI, and so PAD severity.10–12 More precisely, maximal AT between dorsalis pedis artery (DPA) and lateral plantar artery (LPA) (ATmax), with a cut-off value of 215 ms, has been shown to predict TP ⩽ 30 mmHg with a 86% sensitivity and a 82% specificity in patients with severe occlusive PAD. 10 Therefore, the aim of this study was to confirm the cut-off value of 215 ms to predict a TP ⩽ 30 mmHg in a broader population and the association to clinical signs of CLTI.
Methods
Patient selection
We conducted a retrospective study between March 1, 2022 and July 1, 2022 in a single university hospital, from consecutive patients referred to our vascular medicine unit for suspicion or follow-up of PAD. Since publication of the scientific work by Sommerset et al. in 2019,11–13 AT measurement on both DPA and LPA has become standard practice in our vascular lab for each patient suspected of PAD seen for arterial DUS of the lower limbs. As such, this study was not carried out as part of a prospectively established protocol.
All patients who underwent DUS with measurements of ATmax and TBI measurements (within 1 hour) were included. If DUS and TBI were feasible on both lower limbs, each limb was included separately.
Exclusion criteria were age under 18 years old, protected adults, any technical difficulty leading to the impossibility of either TP or ATmax measurements (toe or more proximal amputation, patient’s inability to stay still, significant skin edema or any other reason left to the discretion of the investigator), and occlusion of both DPA and LPA on the same lower limb.
The following demographics data were obtained from the patient electronic medical record: age, sex, clinical signs of PAD such as claudication, ischemic rest pain and necrotic tissue loss, declared pain-free maximal walking distance, tobacco habits, history of hypertension, hypercholesterolemia, diabetes, severe to terminal chronic kidney failure (defined by a creatinine clearance of < 30 mL/min/1.73 m2), coronary artery disease, or stroke. Patients were considered as ‘formerly smoking’ if they reported quitting for at least 1 month. Ischemic rest pain was retained if the patient described pain at rest (decubitus position) in the forefoot that had developed for at least 15 days, not relieved by grade II analgesics but was wholly or partially relieved in a supine or sitting position. 2 Necrotic tissue loss was defined as the presence of necrotic tissue affecting at least one toe and or forefoot and developing for at least 15 days.
Patients were considered to have no significant PAD if they presented no clinical signs of PAD, had a TBI ⩾ 0.7, and DW were considered normal on both DPA and LPA. DW were considered normal if they showed a multiphasic pattern (triphasic / biphasic) independently of resistance. Conversely, DW showing a monophasic pattern were considered abnormal. Exclusion of PAD using ATmax has been shown to be associated with the presence or absence of continuous flow on DW. Hence, cut-off values of ATmax differ depending on the resistivity (absence or presence of a continuous diastolic flow [CF− and CF+, respectively]) in patients without suspected PAD. Patients were classified as CF+ if the resistivity index on the relevant artery was < 0.95 when calculating ATmax (i.e., the artery with the highest AT value between DPA and LPA).
CLTI was diagnosed if patients had at least one clinical criterion (ischemic rest pain, necrotic tissue loss) associated with a TP ⩽ 30 mmHg. TcPO2 was not considered as a hemodynamic criterion for CLTI as data were missing for the vast majority of patients included due to technical difficulties (mechanical failure during several months of the inclusion period). AP and ABI were not used as diagnostic criteria for CLTI due to known low diagnostic accuracy in CLTI.9,14–17
After written information was provided, informed consent was obtained for each patient. The protocol was approved by our Institutional Review Board. This work was carried out according to the Declaration of Helsinki.
Duplex waveforms (DW) measurements
All measures were performed by four investigators (two medical doctors specialized in vascular medicine and two ultrasound technologists). The vascular medicine specialists were considered highly trained for AT measurements and the two ultrasound technologists received a 30-minute training course. Patients were scanned in the decubitus position. DUS imaging was performed using a GE Vivid E95 (GE Healthcare Systems, Chicago, IL, USA) or a Siemens Sequoia (Siemens Healthineers AG, Erlanger, Germany). A 9 MHz linear array transducer was used for the DPA and LPA. Each ultrasound probe was covered with transmitting gel. Pulsed DW were obtained from a longitudinal slice of the studied artery, with a Doppler color box size adjusted to the size of the vessel. The Doppler sample was obtained at ⩽ 60°, with a volume applied to the center of each artery with a spectral Doppler scrolling of ⩾ 100 mm/s. AT (in ms) was measured after determining manually the start of the systolic uprise (when the acceleration, in cm/s−2, becomes positive) to the top of the systolic peak (when the acceleration returns to zero) (Figure 1). 18 Every study physician measured AT on two distinct systolic peaks belonging to the same DW recording. For each artery (DPA and LPA), the value of AT retained was as the mean of the two measurements. ATmax was the highest AT value between DPA and LPA. DPA and LPA were considered occluded when a permanent absence of flow on Doppler color and pulsed Doppler was observed. In case of a retrograde flow, the artery was considered patent, and DW were analyzed as usual.
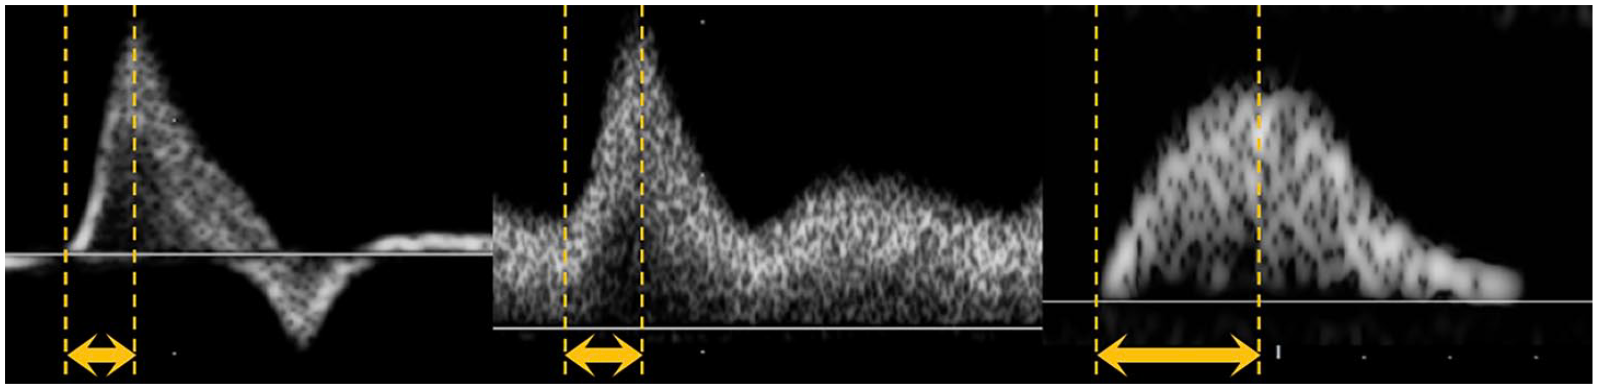
Examples of acceleration time measurements for different pulsed Doppler waveforms. Left: triphasic pattern (with a scrolling speed of 133 mm/s); Middle: triphasic pattern with a continuous diastolic flow (with a scrolling speed of 133 mm/s); Right: monophasic pattern (with a scrolling speed of 200 mm/s).
Blood pressure (BP) measurements
All patients had been at rest in supine decubitus for at least 10 minutes. All pressure measurements were made systematically after DUS within 60 minutes.
Humeral systolic blood pressures (SBP) were measured in both arms with an automatic device (Carescape Dinamap V100, GE Healthcare Systems). BP cuffs were adapted to the weight and height of the patient (10-cm or 12-cm cuff). Bilateral SBP on the DPA and the posterior tibial artery (TPA) was measured with an 8 MHz continuous Doppler probe (Diadop 200; Diatecnic, Labege, France) and a sphygmomanometer (Tycos TR-2, with a 29–42 cm cuff [WelchAllyn, NY, USA] or Lian Nano [Spengler, Aix-En-Provence, France]). If blood flow was still detected with a pressure cuff inflation of 250 mmHg or more, arteries were considered as ‘incompressible’ and the value of 250 mmHg was used for the ABI calculation. 19 ABI was calculated by dividing the highest value of the two SBPs of the leg (DPA or TPA) by the highest value of the right and left arm SBPs. 19
TPs were measured by a laser Doppler flowmetry (LD) (Periflux 6000 Combined, Perimed, Stockholm, Sweden), according to the instructions of the manufacturer and as described in the literature.20,21 The cuff was inflated at 200 mmHg and then automatically and linearly deflated. SBP was read automatically by software when the LD probe detected the return of blood perfusion (if the automatic value was deemed incorrect, investigators could modify by placing the value at the starting point of the LD curve upslope). TBI was calculated by dividing the TP by the highest value of the right and left arm SBPs.
Statistical analysis
Our primary objective was to confirm the ATmax cut-off value of 215 mmHg to predict TP ⩽ 30 mmHg.
Our second objectives were to evaluate the diagnostic performances of ATmax to identify patients with CLTI (at least one clinical criterion associated with TP ⩽ 30 mmHg) and patients without significant PAD.
With a sensitivity target of 90%, for a two-sided alpha risk of 5% and a margin of error of 10%, for an estimated prevalence of CLTI of 9%, the estimated number of subjects was 154 lower limbs. Given the average number of consultations per year for arterial exploration of the lower limbs in our department, a period of 4 months was deemed sufficient.
Statistical analysis was conducted in R 4.0.2 software (R Foundation for Statistical Computing, Vienna, Austria). Continuous variables are expressed as medians and IQR, defined as the first and third quartiles. Categorical variables are expressed as counts and percentages. Pearson’s correlation test was used to correlate ATmax with TBI. Pearson’s correlations ⩾ 0.68 and ⩾ 0.88 were considered strong and excellent correlations, respectively. 22 A receiver operating characteristics (ROC) curve represented sensitivity versus 1 – specificity of ATmax according to the presence or absence of TP ≤ 30 mmHg or to CLTI. ROC was used to determine the optimal cut-off value to detect TP ⩽ 30 mmHg. The area under the ROC curve (AUC) was used to measure the accuracy of ATmax to detect TP ⩽ 30 mmHg or presence of CLTI.
For the limb characteristics analysis stratified on the primary endpoint, the statistical difference between groups was tested for each variable. For quantitative data, Student’s t-test was used when the variable had two groups. For variables with more than two groups, we used a one-way analysis of variance if the distribution was normal. For qualitative data, we used a chi-squared test (or Fisher’s exact test if needed).
For intra-observer reproducibility, we used an intraclass correlation (ICC) to analyze to agreement between the two measurements of ATmax. Based on the 95% CI of the ICC estimate, values less than 0.5, between 0.5 and 0.75, between 0.75 and 0.9, and greater than 0.90 are indicative of poor, moderate, good, and excellent reliability, respectively. 23 For visual representation of the agreement between two measurements, we used a Bland–Altman plot.
For multivariate analysis, we used multiple binary logistic regression with ‘TBI ⩽ 30 mmHg’ or ‘CLTI’ as response variables. We kept as explanatory variables the ones associated to ‘TBI ⩽ 30 mmHg’ on univariate analysis with the value of p < 0.05. If needed, variables with high collinearity were excluded (variance inflation factor ⩾ 5). 24 For each independent variable analyzed, at least five events per variable were required.25,26
Significance was accepted for a value of p < 0.05.
Results
A total of 338 patients were initially screened; 122 patients were excluded for lack of TP measurements and 79 for lack of recording of either DPA or LPA (of which two patients had both DPA and LPA occlusion on one lower limb). A total of 137 patients were finally included with a total of 258 lower limbs.
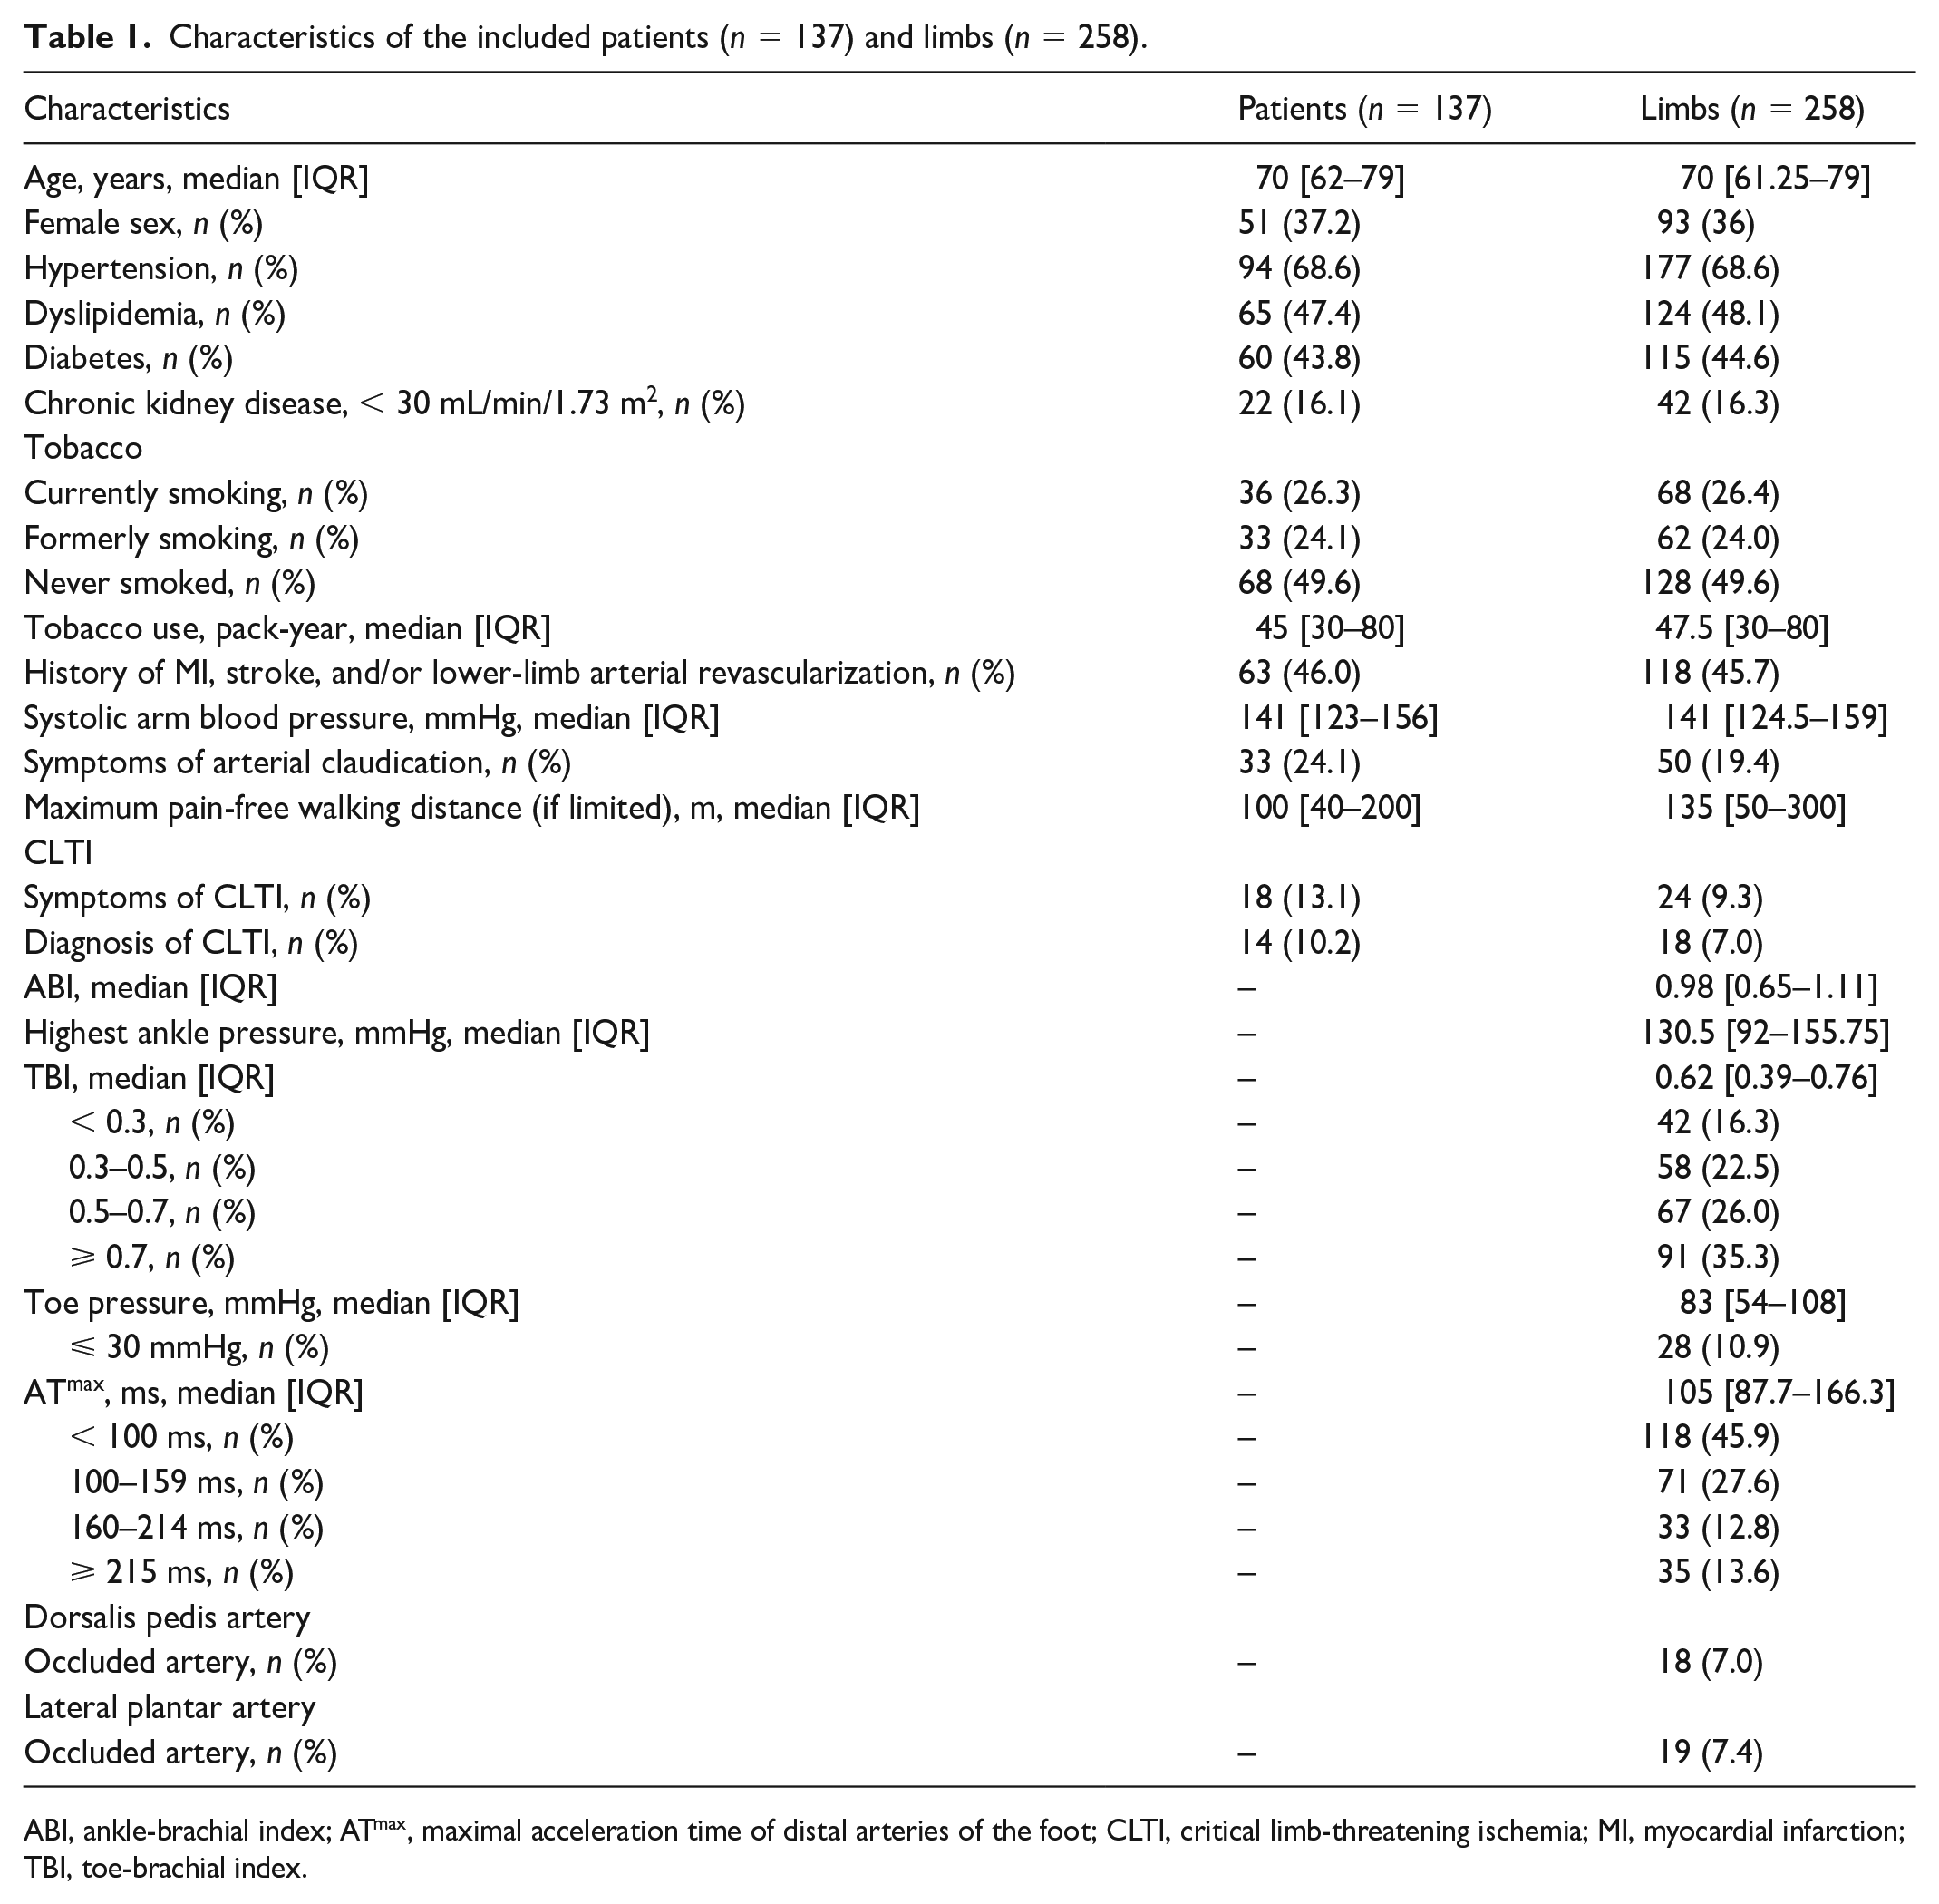
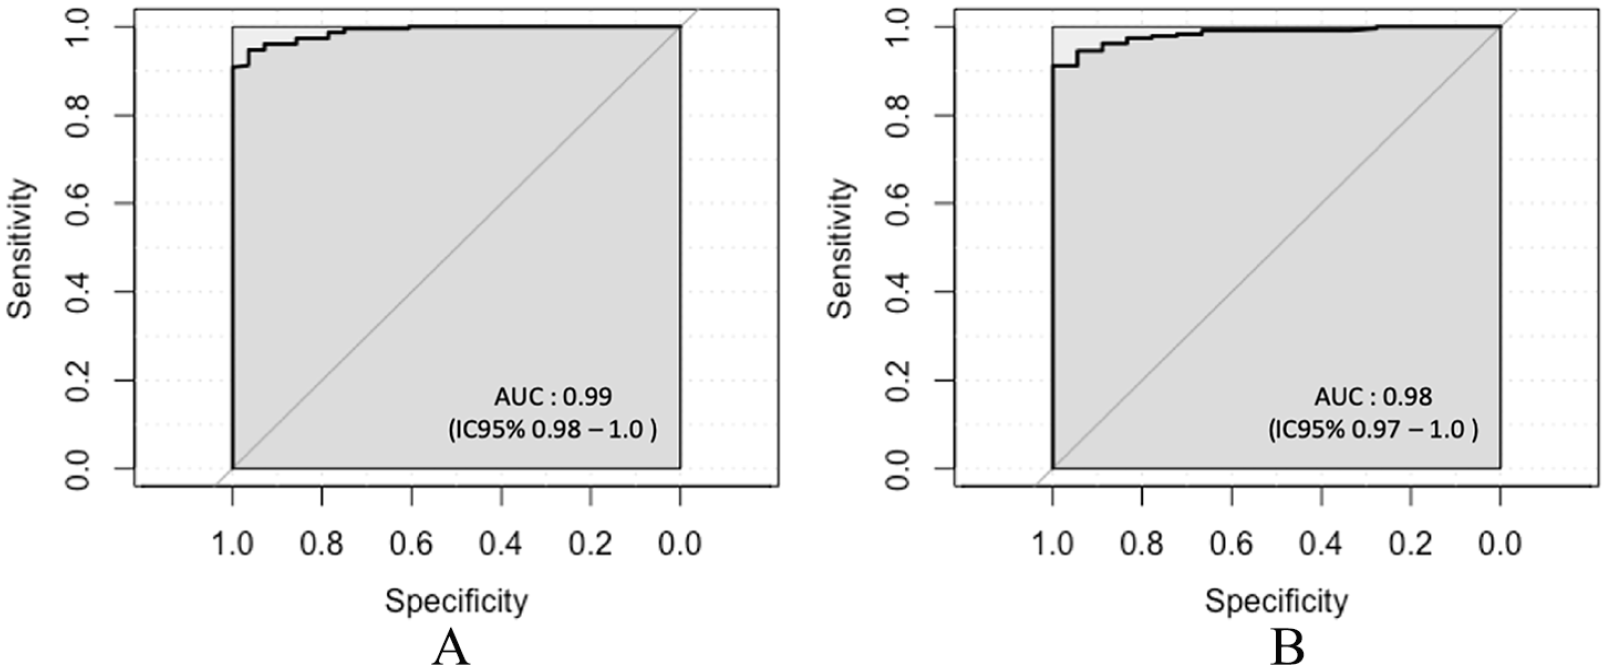
The characteristics of the included patients (n = 137) and limbs (n = 258) are summarized in Table 1. The majority of patients were men (62.8%). Sixty-eight patients (49.6%) had never smoked whereas 36 (26.3%) were current smokers. Regarding the included limbs, median TBI was 0.62 (IQR: 0.39–0.76) and median ABI was 0.98 (IQR: 0.62–1.17). Twenty-eight limbs had a TP ⩽ 30 mmHg. DPA was patent in 240 limbs (93%) and LPA in 239 limbs (92.6%).
Characteristics of the included patients (n = 137) and limbs (n = 258).
ABI, ankle-brachial index; ATmax, maximal acceleration time of distal arteries of the foot; CLTI, critical limb-threatening ischemia; MI, myocardial infarction; TBI, toe-brachial index.
Diagnostic accuracy of ATmax to detect toe pressure (TP) ⩽ 30 mmHg
Seven limbs (2.7%) and five limbs (1.9%) had retrograde flow on DPA and LPA, respectively. As a reminder, in the presence of a retrograde flow, the artery was considered as patent. DPA occlusion was diagnosed in 18 limbs (7.0%) and LPA occlusion in 19 limbs (7.4%).
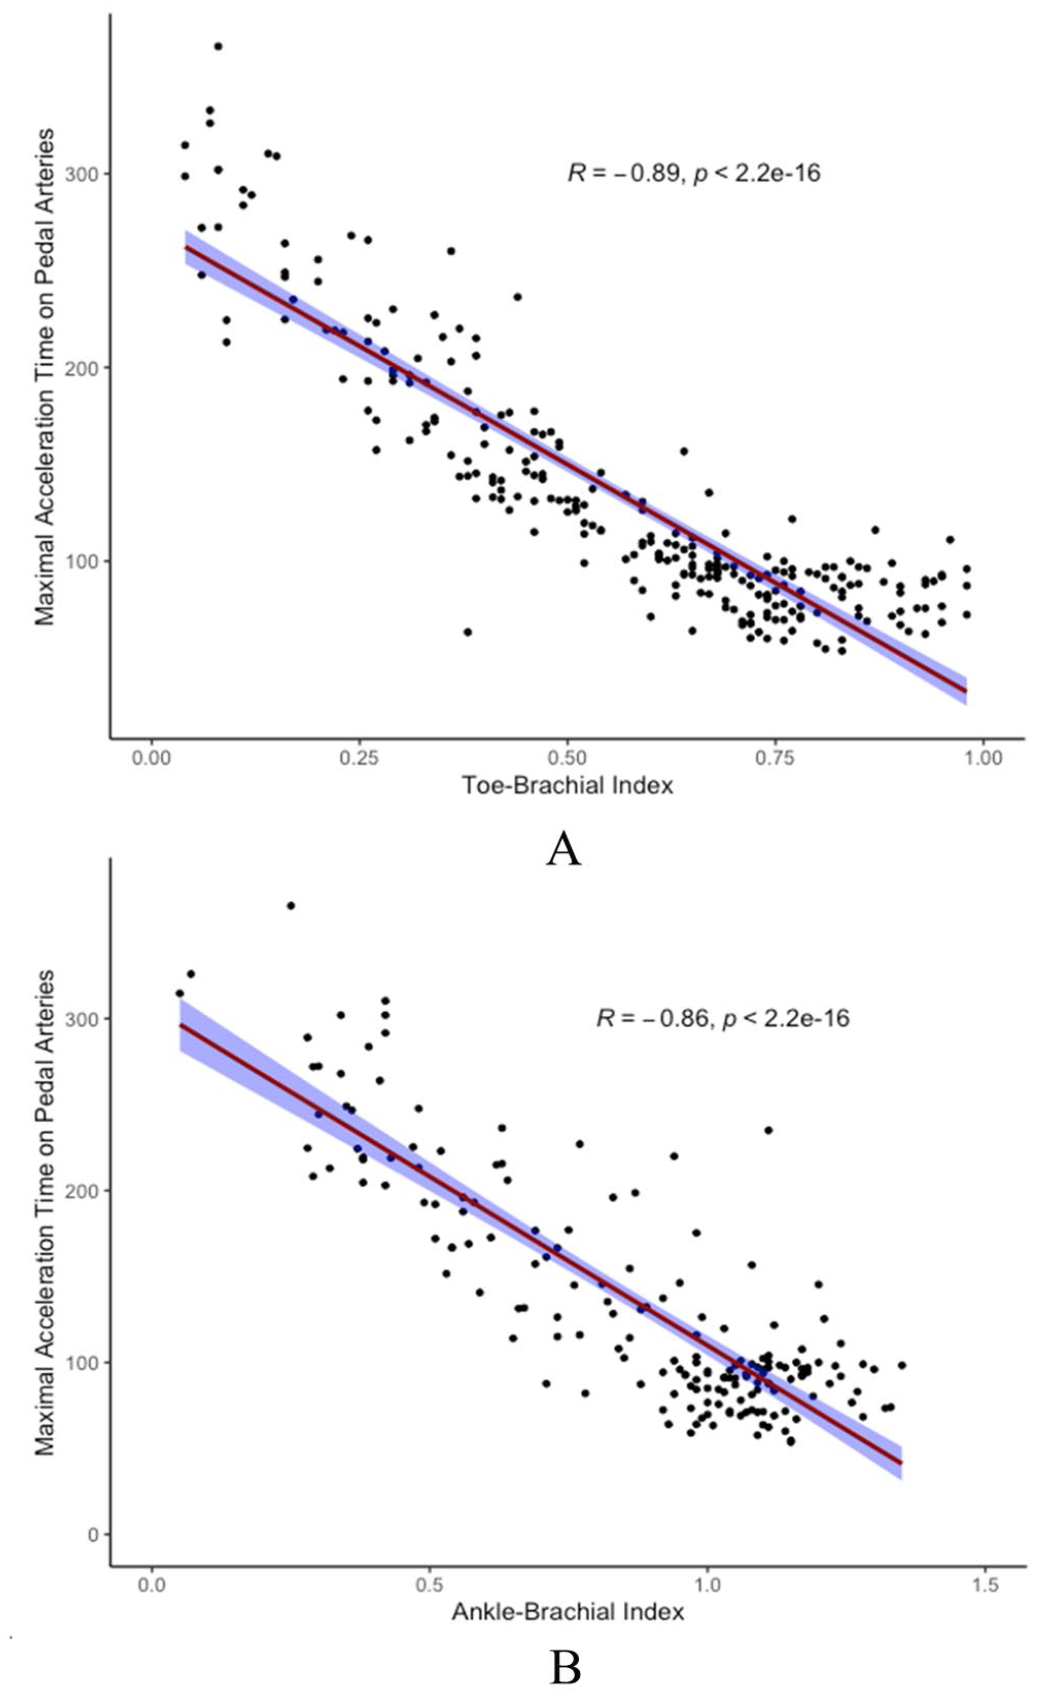
ATmax showed an excellent negative correlation with TBI (r = −0.89, p < 0.001) and a strong negative correlation with ABI (r = −0.82, p < 0.001) (Figure 2). If we exclude the two limbs (0.8%) with AP > 250 mmHg, the correlation between ABI and ATmax approaches but does not reach that between TBI and ATmax (r = −0.86, p < 0.001). For low TP (TP ⩽ 30 mmHg), we found an AUC of 0.99 [95% CI 0.98–1.00] and ROC curve analysis showed an optimal cut-off value of 212 ms (Figure 3).
Scatterplot and linear correlation of
ROC curves comparing maximal acceleration time of distal arteries to toe pressure ⩽ 30 mmHg
Hence, to detect TP ⩽ 30 mmHg, ATmax with a cut-off value of 215 ms showed excellent diagnostic performances: a sensitivity of 93% [95% CI 77–99], a specificity of 96% [95% CI 92–98], a positive predictive value of 73% [95% CI 56–86], and a negative predictive value of 99% [95% CI 97–100].
In Table 2, we analyzed limb characteristics stratified by the primary endpoint (TP ⩽ 30 mmHg). In univariate analysis, current or former tobacco use, presence of arterial claudication (and maximum pain-free walking distance), ankle pressure (and ABI), clinical signs suggestive of CLTI, and ATmax were significantly associated with the primary endpoint.
Limb characteristics stratified on the primary endpoint (presence of toe pressure [TP] ⩽ 30 mmHg).
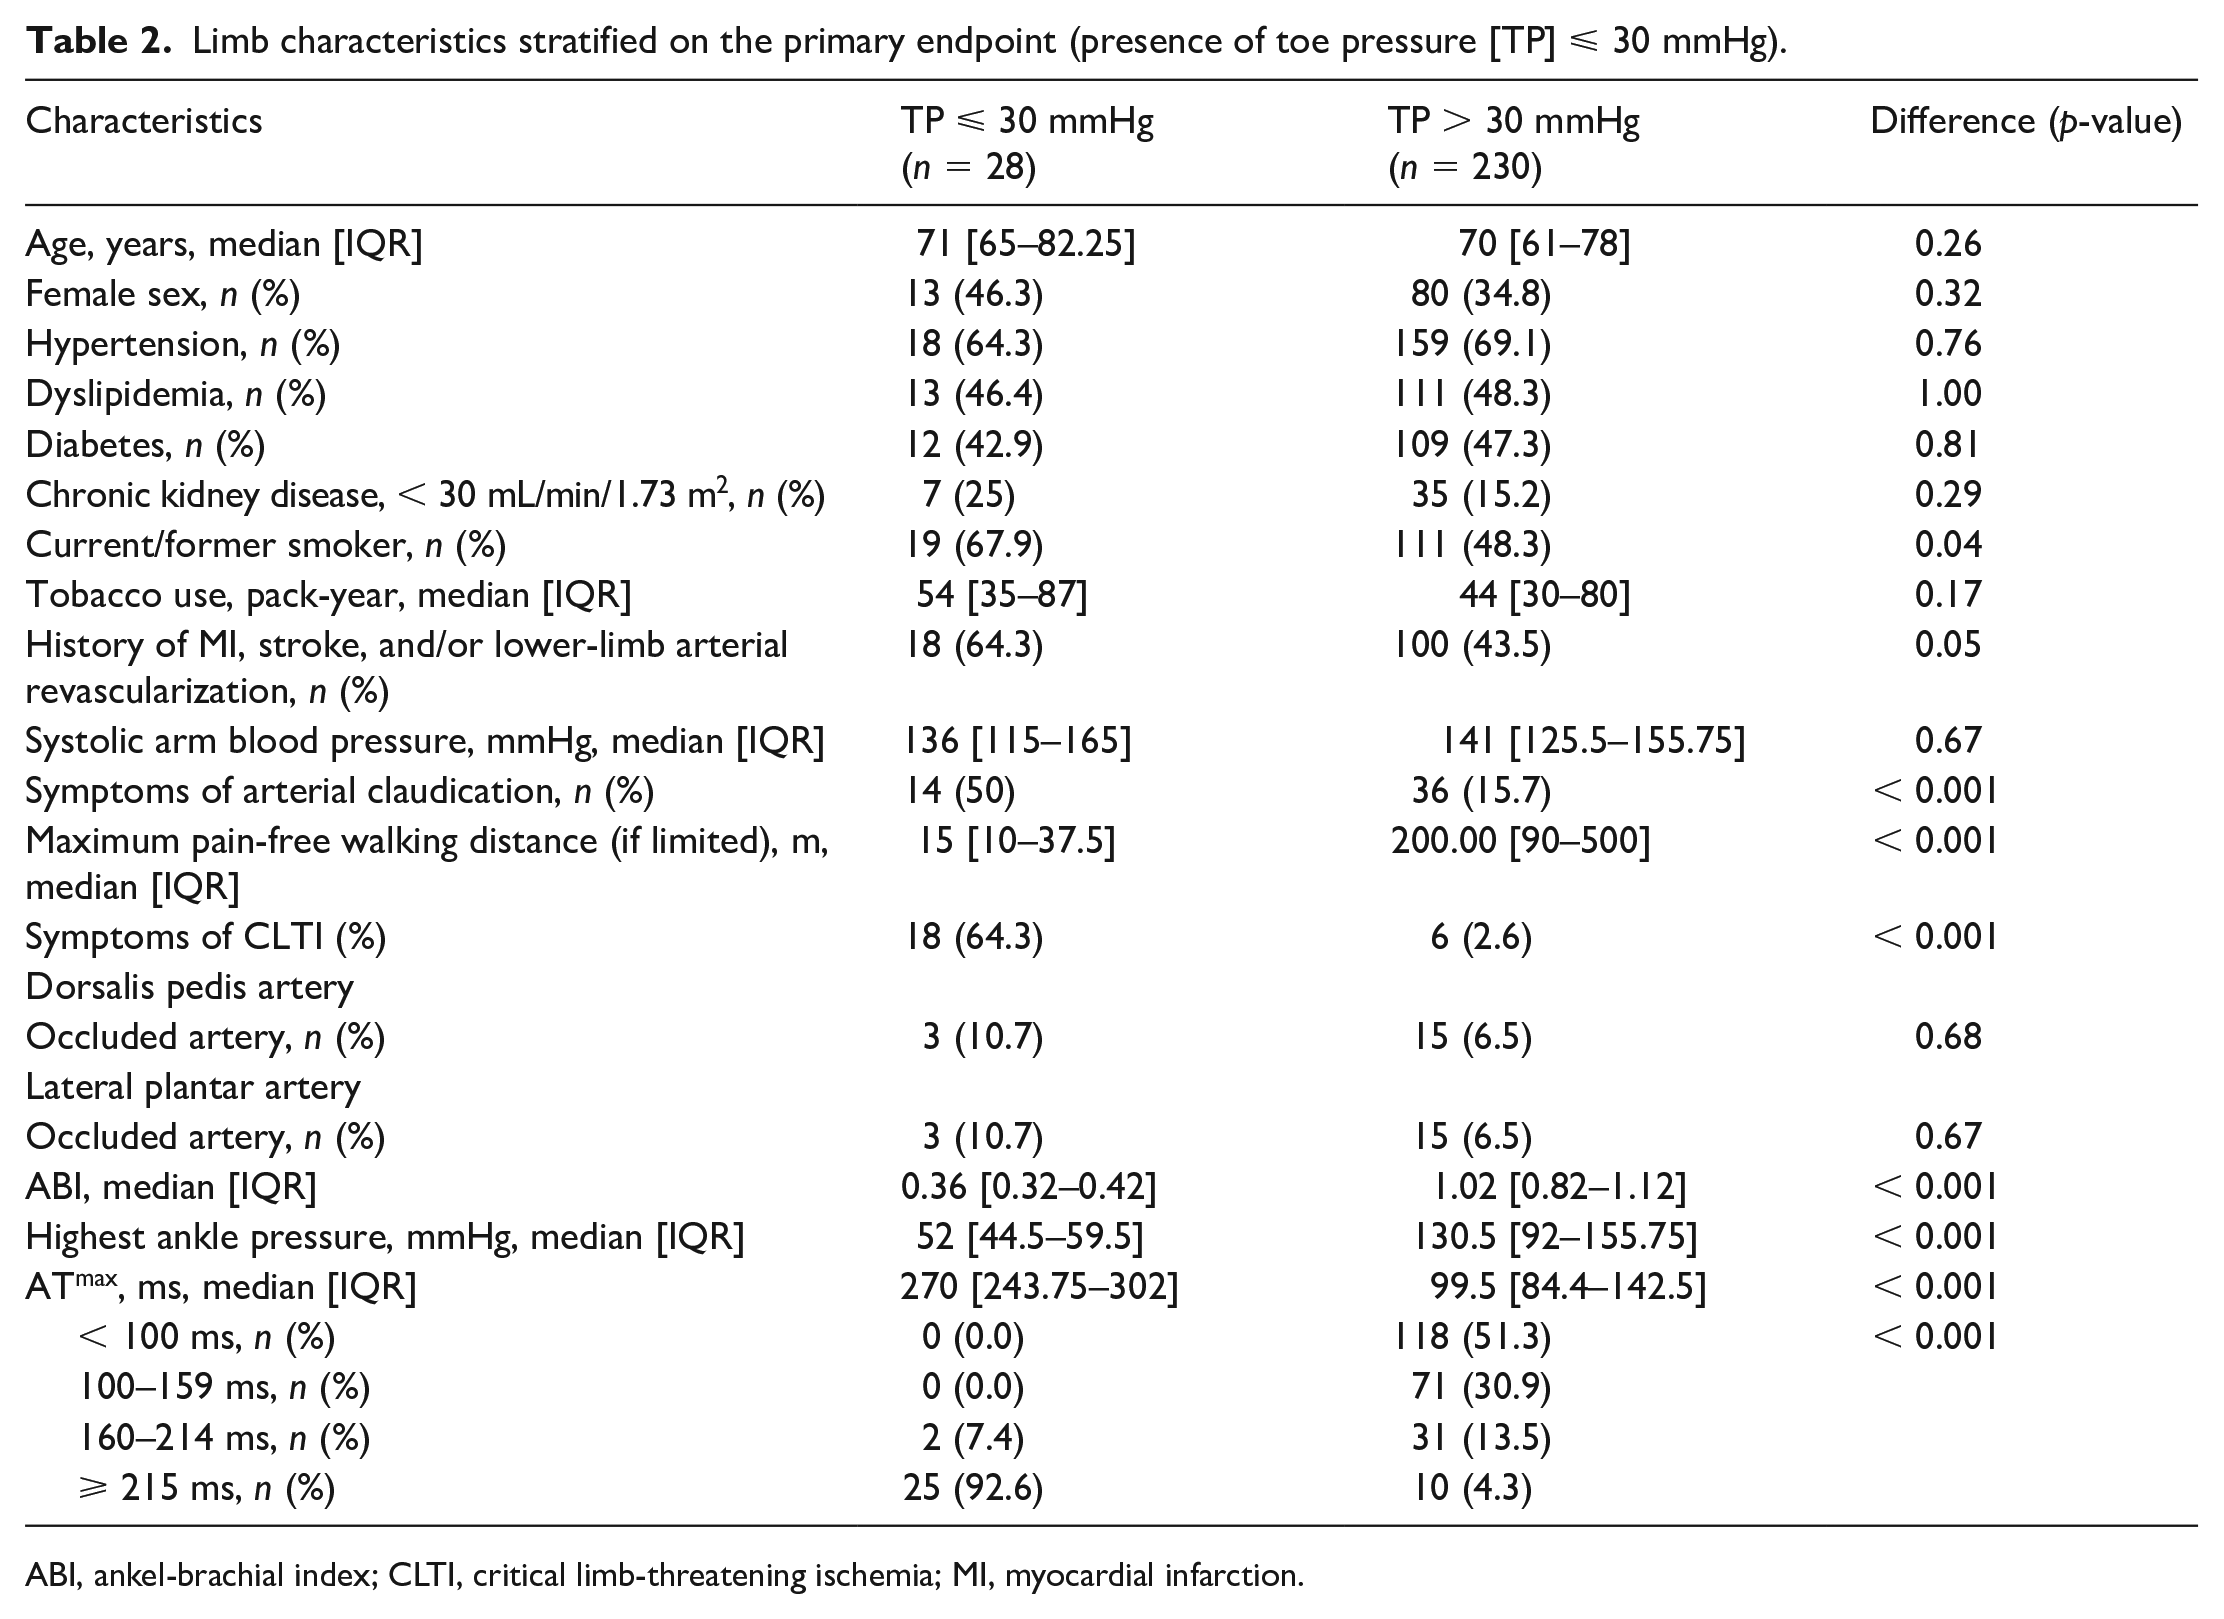
ABI, ankel-brachial index; CLTI, critical limb-threatening ischemia; MI, myocardial infarction.
On multivariate analysis, only ATmax remained statistically associated with TP ⩽ 30 mmHg (p = 0.007) in our multiple binary logistic regression model (Table 3).
Multiple binary logistic regression models to identify toe pressure ⩽ 30 mmHg or chronic limb-threatening ischemia (CLTI).
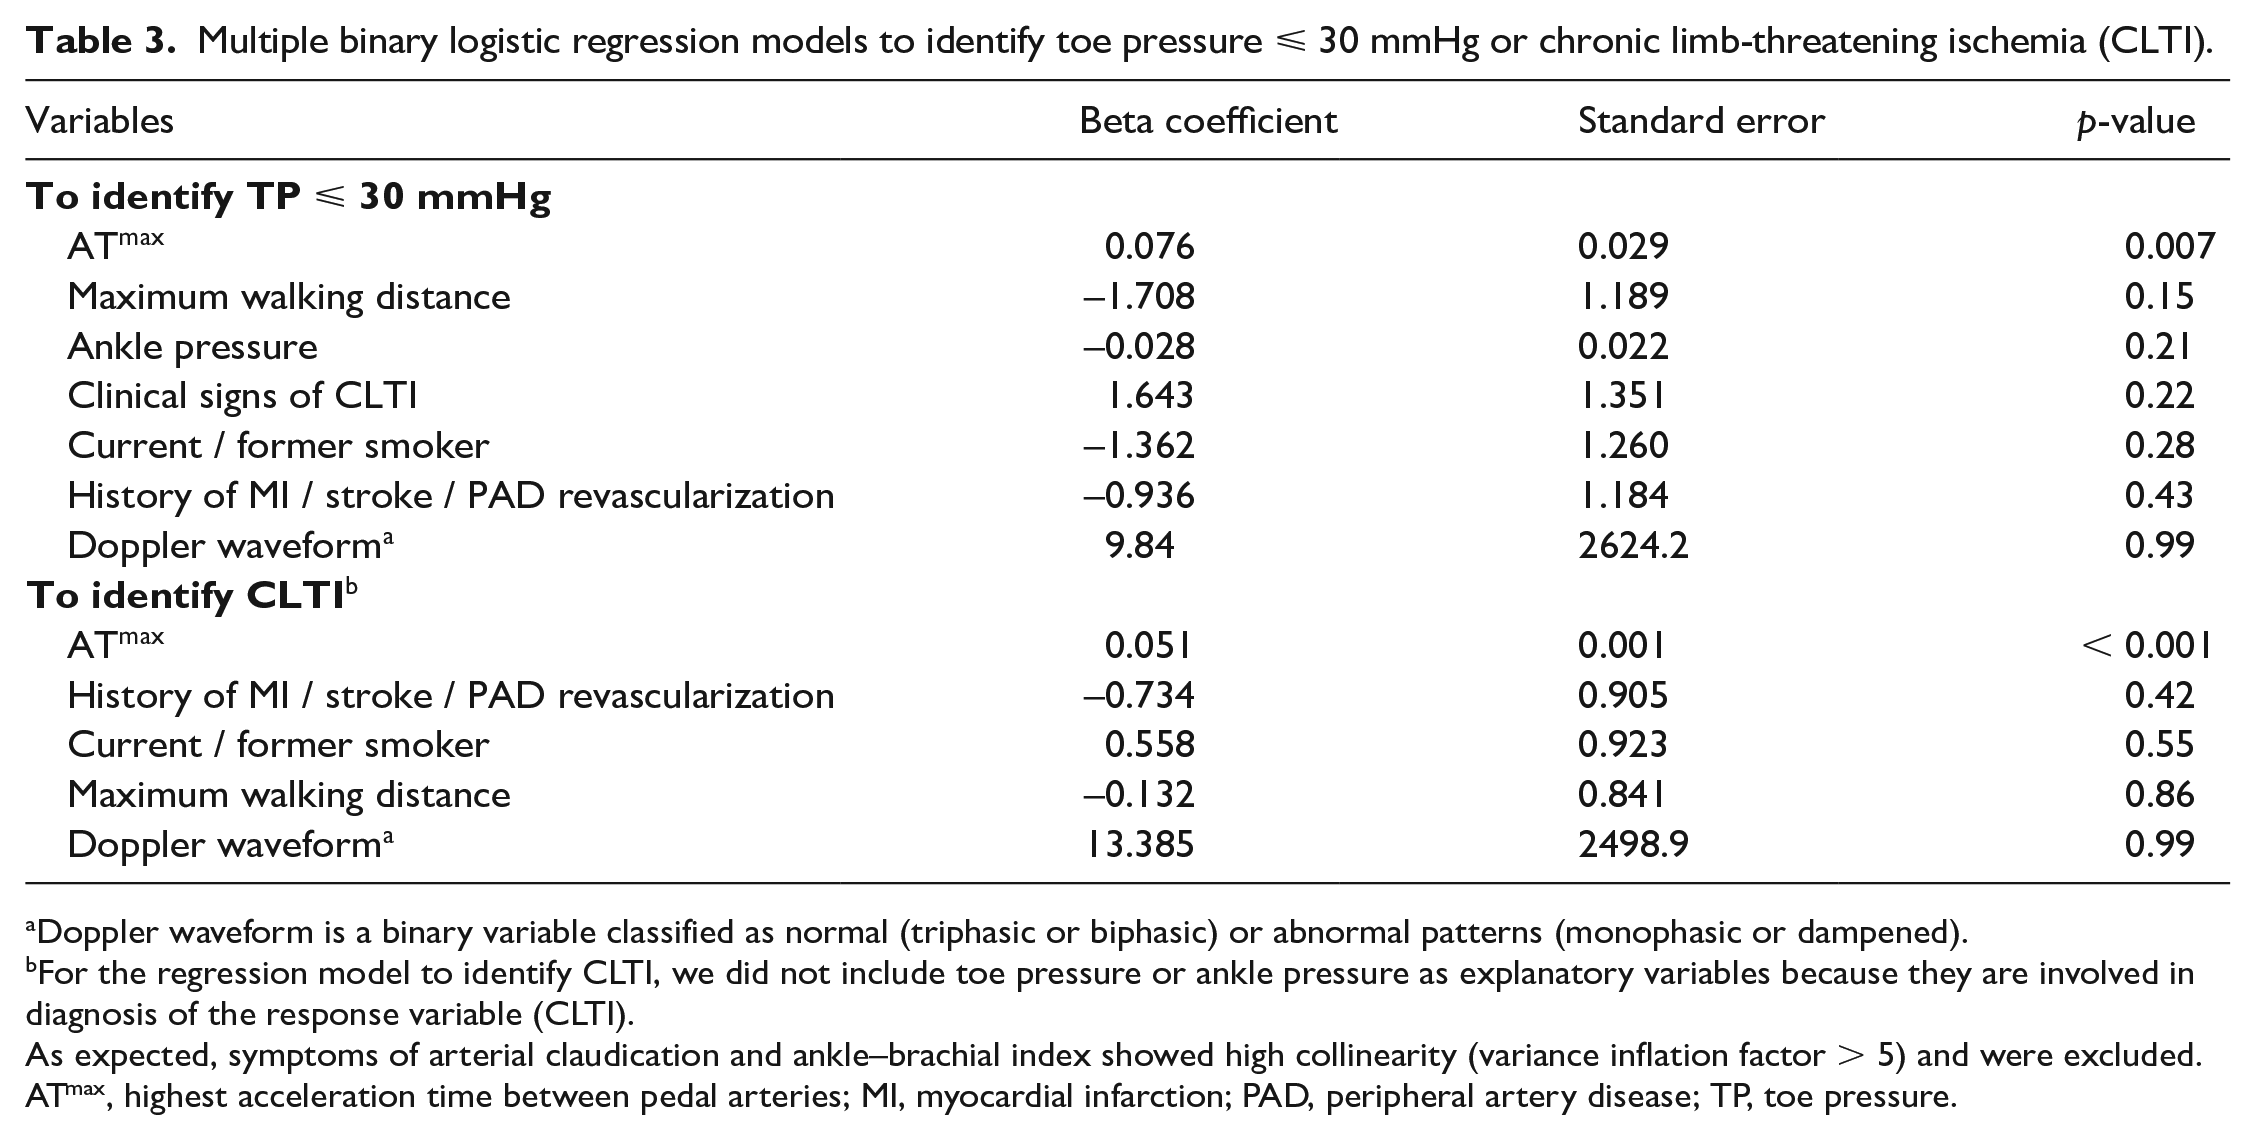
Doppler waveform is a binary variable classified as normal (triphasic or biphasic) or abnormal patterns (monophasic or dampened).
For the regression model to identify CLTI, we did not include toe pressure or ankle pressure as explanatory variables because they are involved in diagnosis of the response variable (CLTI).
As expected, symptoms of arterial claudication and ankle–brachial index showed high collinearity (variance inflation factor > 5) and were excluded.
ATmax, highest acceleration time between pedal arteries; MI, myocardial infarction; PAD, peripheral artery disease; TP, toe pressure.
Diagnostic accuracy of ATmax to diagnose CLTI
Nineteen patients (7.4%) presented with CLTI. For the detection of CLTI, ATmax showed an AUC of 0.98 (0.97–1.00) with an optimal cut-off value of 213 ms (Figure 3), which is also consistent with our previous value of 215 ms. At the cut-off value of 215 ms, the diagnostic performance of ATmax for the detection of CLTI was considered excellent with a sensitivity of 95% (95% CI 74–100), a specificity of 92% (95% CI 88–95), a positive predictive value of 50% (95% CI 33–67), and a negative predictive value of 100% (95% CI 97–100).
Ten patients had TP ⩽ 30 mmHg without CLTI, of which only one had an ATmax below 215 ms (198 ms).
Diagnostic accuracy of ATmax to rule out PAD
Sixty-three patients (24.4%) were considered to have no PAD. In CF− patients, the optimal cut-off ATmax value to exclude PAD was 95 ms, whereas in CF+ patients, the optimal cut-off ATmax value was 105 ms. The diagnostic performance of ATmax in CF− and CF+ patients is summarized in Table 4. ATmax showed better positive predictive values, specificities, and positive likelihood ratios when CF− and CF+ patients were dichotomized (Table 4).
Diagnostic performance of ATmax to exclude lower-limb peripheral artery disease (PAD) based on the presence or absence of continuous diastolic flow on Doppler waveforms.
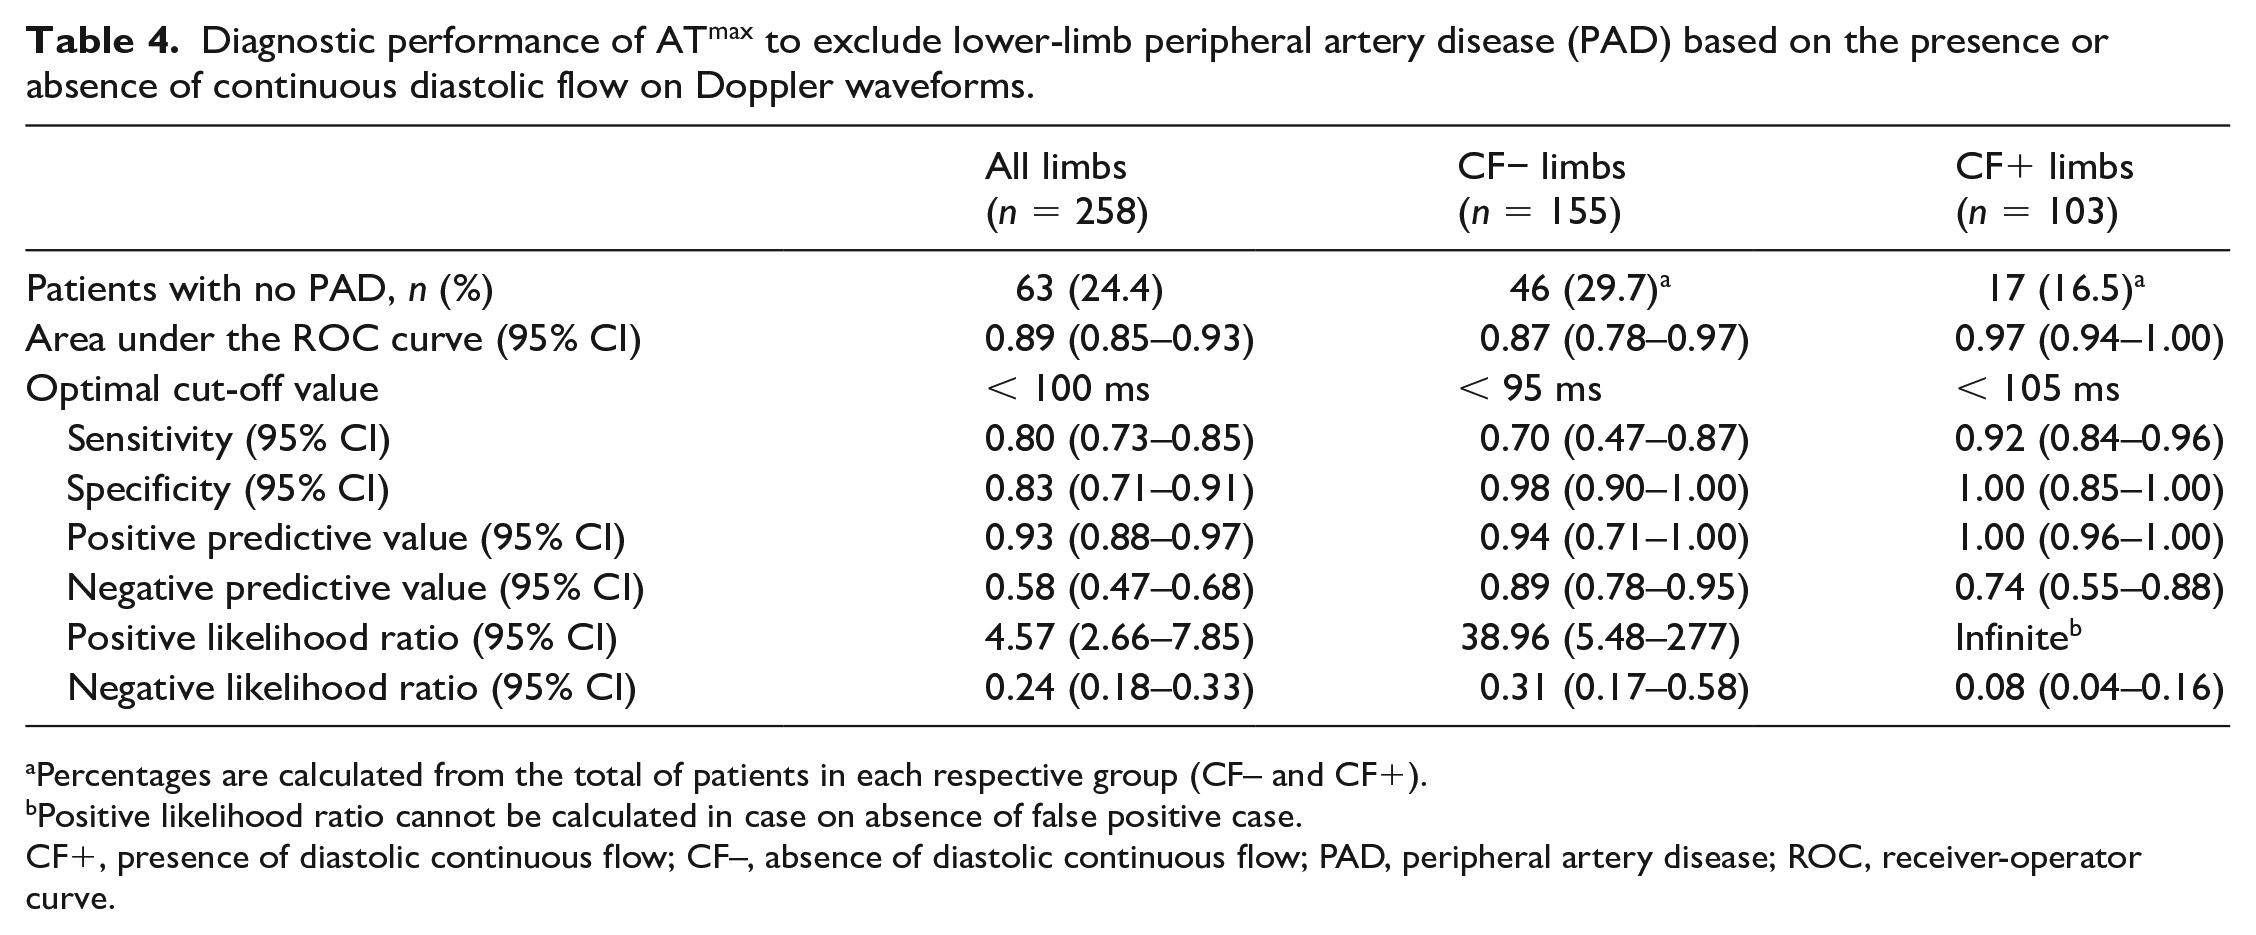
Percentages are calculated from the total of patients in each respective group (CF– and CF+).
Positive likelihood ratio cannot be calculated in case on absence of false positive case.
CF+, presence of diastolic continuous flow; CF–, absence of diastolic continuous flow; PAD, peripheral artery disease; ROC, receiver-operator curve.
Intra-observer reproducibility
The ICC for DPA and LPA measurements from the same investigator was 0.98 [95% CI 0.97–0.98] and 0.99 [95% CI 0.98–0.99], respectively. We then evaluated the intra-observer agreement of both DPA and LPA combined with 481 ATmax measurements and we found a pooled ICC of 0.98 [95% CI 0.98–0.98]. Bland–Altman plots for analysis of agreement between the different arteries are available in Figure 4.
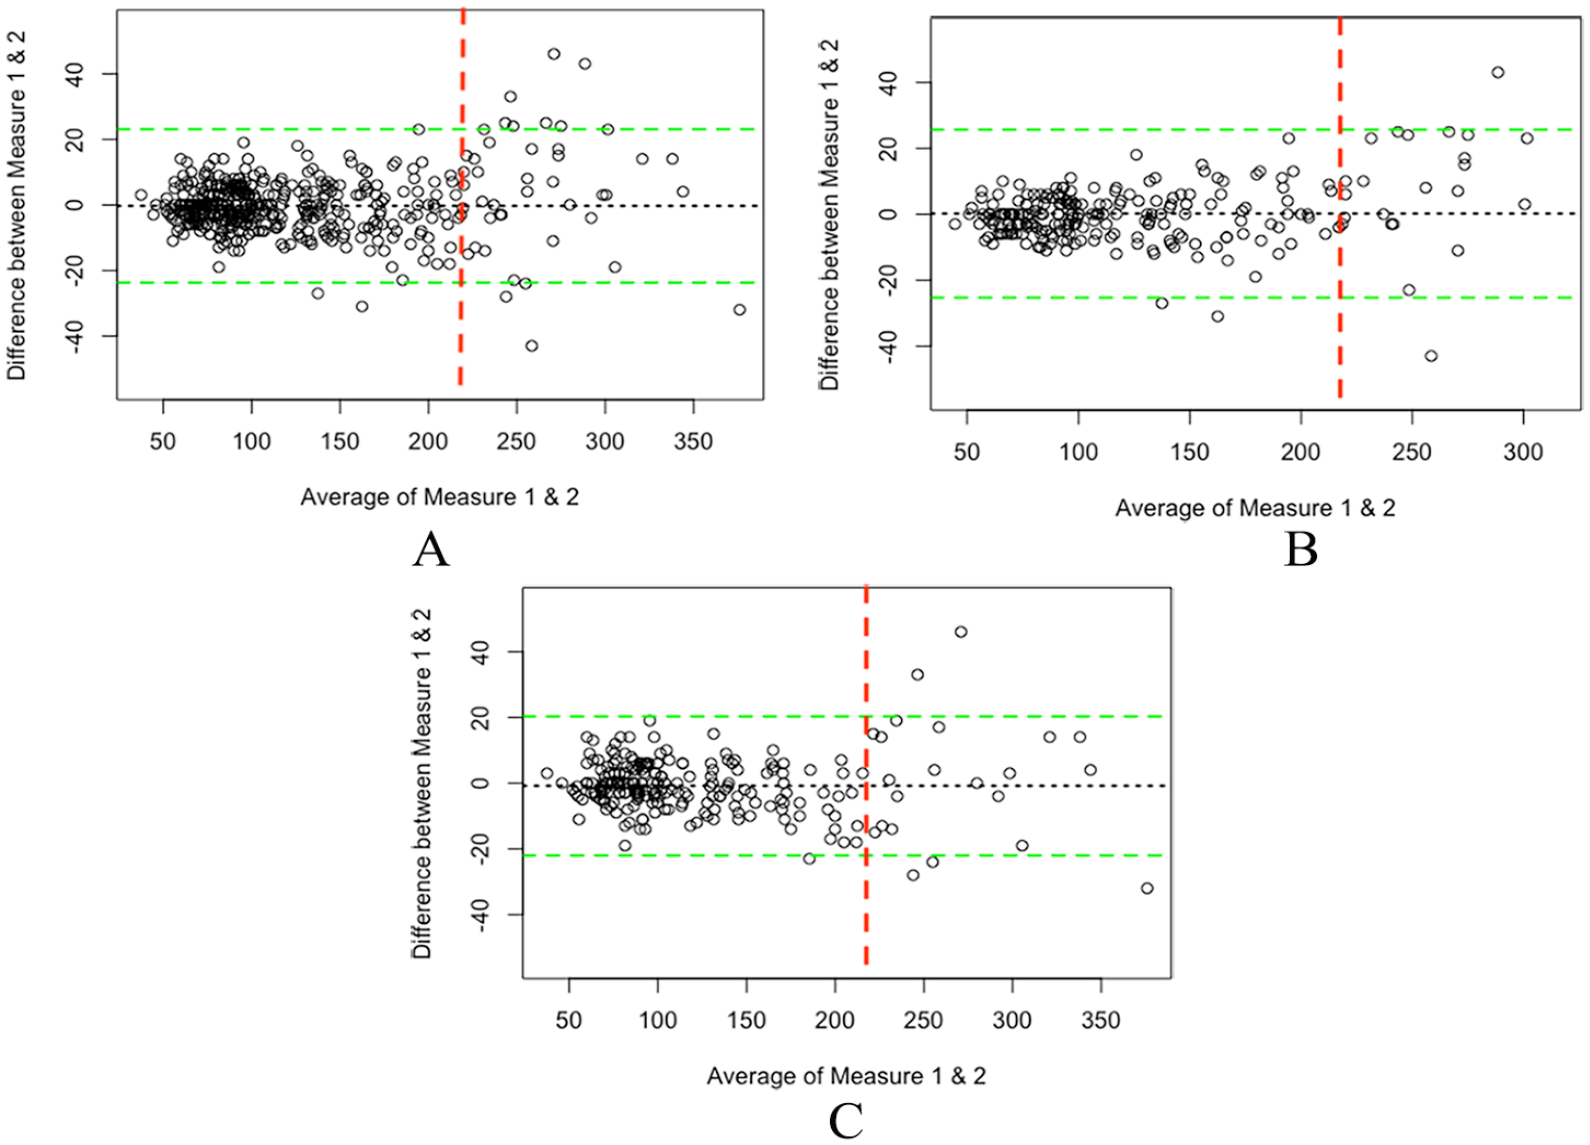
Bland–Altman plots for analysis of agreement the different measurement sites. Agreement for pooled data (both DPA and LPA) is represented in
Discussion
The diagnosis of CLTI is still debated in the literature, especially regarding hemodynamic criteria, whereas clinical criteria seem to be well established.3–5,7 The low diagnostic performance of AP or ABI to diagnose CLTI is easily understandable given the numerous co-morbidities of these patients (diabetes, renal failure, advanced age, active or former smoking) which may lead to mediacalcosis and thus an overestimation of AP. On the other hand, TP and TcPO2 are much less dependent on the above factors, but their accessibility in primary care is limited. This study demonstrates the value of an easily accessible DUS measurement in general practice, ATmax, in the early detection of patients with CLTI, allowing early referral to a center of expertise. ATmax with a cut-off value of 215 ms shows excellent diagnostic performance to diagnose either low TP (TP ⩽ 30 mmHg) or CLTI.
AT and maximal acceleration have long been described as predictive of severe arterial disease, particularly in renal artery stenosis,27–30 but have recently come to the fore again, particularly in quantifying the severity of peripheral artery disease in carotid artery disease31,32 and lower-extremity artery disease.10,12,13,33 In this study, we confirm the great interest of this ATmax in the diagnosis of either low TP or CLTI. In fact, we found almost the same cut-off value to detect TP ⩽ 30 mmHg or CLTI (212 ms and 213 ms, respectively), which is consistent with our previous study that found a threshold value of 215 ms. 10 Once again, ATmax appeared to be the best predictor of TP ⩽ 30 mmHg, and also CLTI, in multivariate analysis highlighting its utility. 10 The advantages of ATmax lie mainly in its accessibility and its speed of acquisition but like all man-made measures in medicine, a diagnostic tool can only be as effective as the practitioner performing the measurement. In this respect, it is essential that any practitioner adheres to measurement standards or guidelines of either AT or maximal acceleration. 18 Our results show that ATmax has an excellent intra-observer reproducibility. In Figure 4, we can see that the agreement between two ATmax measurements is very high, especially when AT is below 215 ms. On the other hand, ATmax shows greater variability when the value exceeds 215 ms emphasizing the need for a mean value between at least two measurements.
In our study, ATmax was also strongly associated with ABI, which is consistent with other studies.11,12,34 However, as in our previous study, 10 we found that ATmax was more strongly associated with TBI than with ABI (r = −0.89 vs −0.82). In our opinion, this is easily explained by the fact that, unlike TBI, ABI does not take into account arterial disease below the ankle.
Although ATmax is powerful in diagnosing severe PAD, it also appears to be promising in screening for patients without PAD. However, we found that the cut-off value of ATmax depends on the presence or absence of a continuous diastolic flow pattern. This fact is easy to understand if we consider that the presence of CF+ is most often secondary to a need for increased arterial blood flow, either temporary (i.e., healing ulcers) or permanent (i.e., diabetic autonomic neuropathy). Physiologically, increased arterial blood flow is mediated by several pathways (e.g., nitric oxide, adenosine, ATP, potassium, etc.) leading to short-term vasodilation and thus decreased vascular resistance.35–37 It leads to several changes in the DW scan. The main rapid effect is an increase in end-diastolic velocity (EDV) which occurs within seconds and can be up to 3.7 times higher. 38 Within 5 minutes, we can also observe an increase in peak systolic velocity (PSV), time averaged mean velocity, blood flow, arterial diameter, and downstream skin temperature; and a decrease of resistivity index and pulsatility index. 38 Unfortunately, changes in AT and maximal acceleration have never been studied in this context. However, it is reasonable to assume that both an increased PSV and increased blood flow may lead to a nonlaminar pattern and therefore an increase in AT and a decrease in maximal acceleration. Further studies on this matter are urgently needed, particularly in view of the increasing number of scientific studies investigating the value of these factors in quantifying the degree of stenosis or the severity of PAD.
Study limitations
Several limitations in this study should be addressed. First, the study was retrospective, which cannot provide exhaustive bias control. Second, all ABI and TBI measurements were performed by two vascular physicians and intra-individual variability was not assessed. However, the reproducibility of TBI could be considered satisfactory due to the automatic measurement. Third, most ATmax measurements were assessed by two trained physicians. Therefore, it will be necessary to confirm that (i) the use of ATmax can be as reliable when measured by less trained physicians and (ii) the inter-observer reproducibility is satisfactory. Fourth, the retrospective recruitment period was only 4 months, but this was sufficient to reach the estimated number of subjects required.
Finally, prospective follow-up will be required to investigate the relevance of ATmax compared with validated hemodynamic diagnostic criteria in CLTI.
Conclusion
This study confirms that ATmax (highest acceleration time between dorsalis pedis artery and lateral plantar artery) is highly predictive of low TP (⩽ 30 mmHg) and of CLTI with the previously reported cut-off value of 215 ms. ATmax also appears to be a reliable tool to exclude PAD in healthy patients but further studies are needed to evaluate the changes in AT secondary to vasodilatation in healthy volunteers.
A prospective multicenter study is currently underway to confirm the usefulness of ATmax in the diagnostic strategy for CLTI, as well as to evaluate inter-observer reproducibility and prognostic impact.
Footnotes
Declaration of conflicting interests
The authors declared no potential conflicts of interest with respect to the research, authorship, and/or publication of this article.
Funding
The authors received no financial support for the research, authorship, and/or publication of this article.
Data availability statement
The data that support the findings of this study are available from the corresponding author upon reasonable request.