
Abstract
Duplex ultrasound examinations of the mesenteric and renal circulations are commonly used to detect disease as well as to follow up patients after open surgery or endovascular intervention. The aims of this review were to present essential elements of these duplex ultrasound examinations as well as conduct a literature review of diagnostic criteria. Documentation of appropriate images and data will aid in an accurate interpretation. Spectral Doppler waveforms from various segments of these arterial systems can contribute both direct and indirect evidence of the presence of disease. Various studies have validated the duplex ultrasound diagnostic criteria which more recently have expanded to include specific criteria for stented vessels. This review presents a summary of the fundamental exam components and diagnostic criteria utilized for mesenteric and renal duplex ultrasound.
Keywords
Introduction
Duplex ultrasound is a reliable noninvasive modality commonly used to evaluate mesenteric and renal arteries. Patients with suspected mesenteric and renal disease often have several comorbidities which make invasive diagnostic testing employing contrast agents less desirable. Enhanced image resolution and spectral analysis have improved the accuracy for duplex ultrasound. The aims of this paper were to review the use of duplex ultrasound to detect mesenteric and renal vascular disease and provide a summary of commonly employed diagnostic criteria. A literature search of the National Institutes of Health PubMed database was conducted.
The first case report on the use of ultrasound to diagnose mesenteric artery disease was published by Jager et al. in 1984. 1 These authors described the elevated velocities and spectral waveform changes observed in a 54-year-old woman with a 6-month history of postprandial epigastric pain and diarrhea. Shortly thereafter, Nicholls and colleagues published findings of ultrasound parameters from the celiac arteries (CA) and superior mesenteric arteries (SMA). 2 They examined 15 normal subjects and four patients with symptoms of chronic mesenteric disease. The paper described waveform patterns which are commonly observed today and have come to be expected in these vessels. These patterns include the CA having forward flow throughout diastole whereas the SMA in fasted subjects displayed a reverse flow component during diastole. Following these early studies, multiple investigators continued to refine the interpretation of CA and SMA spectral waveforms. In 1991, two retrospective studies were published establishing velocity criteria to diagnose stenosis.3,4 Additional larger studies established the accuracy of the velocity thresholds.5–8
In 1981, Greene et al. were the first to publish their work on renal duplex ultrasound of normal and abnormal renal arteries. 9 They described renal artery blood flow rates and waveform morphology in 16 normal volunteer subjects and nine patients. Since this early study, several others continued defining duplex ultrasound characteristics and diagnostic criteria, including the parameter of the renal–aortic ratio (RAR).10,11 The RAR ratio was studied in 144 patients, 22 of whom underwent angiography. 10 The investigators realized the renal artery velocities increase within a focal stenosis relative to the aortic velocities and defined the RAR used to indicate a stenosis which is still used today.
The diagnostic criteria used for the mesenteric and renal systems has needed to be reevaluated with the advent of endovascular treatment of stenosis in these vessels. Endovascular intervention in patients with mesenteric ischemia has become a more frequent treatment than surgical bypass given that generally these patients are poor surgical candidates. Renal artery stenosis treatment with surgical bypass or endarterectomy has largely been replaced by endovascular angioplasty and stenting. As with other stented arteries, it is expected that criteria applied to native vessels may not be applicable to stented mesenteric and renal arteries. Proposed changes to criteria will be discussed later in this review.
Indications
There are varied indications for the ultrasound of mesenteric and renal arteries. Some of the more common indications for mesenteric duplex ultrasound examinations include suspected chronic mesenteric ischemia, median arcuate ligament syndrome (MALS), follow up after surgical bypass procedures, postintervention follow up of stents, and less frequently the assessment of these vessels for dissection or aneurysm. Indications for renal artery duplex ultrasound include suspected renovascular hypertension and ischemic nephropathy, both of which are mostly commonly associated with atherosclerosis. Other indications include suspected fibromuscular dysplasia (FMD), thromboemboli, dissection, and arteritis. However, the majority of renal artery pathology involves either atherosclerosis or FMD. Less commonly, suspected renal vein pathology may be an indication for a renal duplex ultrasound examination. Renal vein pathology can include thrombus or extrinsic compression. Nutcracker syndrome is a specific type of renal vein compression. The most common form, referred to as anterior Nutcracker syndrome, involves compression of the left renal vein between the SMA and aorta. A less common form, posterior Nutcracker syndrome, occurs with a left retroaortic renal vein becoming compressed between the vertebral column and the aorta.
Surveillance with duplex ultrasound is necessary as clinical follow up alone is not sensitive after intervention. Guidelines for follow up after mesenteric stenting includes clinical follow up and duplex ultrasound at a baseline exam within 1 month of the procedure, then 6 months, 12 months, and annually thereafter. 12 These are based on a strength of recommendation 1 (strong) and quality of evidence C (low). There are no prospective reports examining the impact of surveillance after renal artery stenting. Guidelines for follow up after renal stenting also includes clinical follow up and duplex ultrasound at a baseline exam within 1 month of the procedure, then 6 months, 12 months, and annually thereafter. 12 These are based on a strength of recommendation 2 (weak) and quality of evidence C (low).
Technical considerations
Early studies reported technically adequate visualization by duplex ultrasound to be 83–96% for CA, 93–98% for SMA, and 90–94% for renal arteries.5,7,10,11 There are numerous factors that contribute to successful mesenteric and renal duplex ultrasound. Certainly, the education and experience of the operator and interpreter are key. The following three factors are important to consider when performing these examinations.
Anatomic pitfalls
Pitfalls of ultrasound evaluation include the presence of anatomic variants. Awareness of the possibility of these variants will help expedite the documentation of additional images and spectral waveforms. A replaced right hepatic artery (RHA) where the RHA arises from the SMA is one of the most common variants observed and found in approximately 12% of patients. 13 This will alter the waveform configuration in the proximal portion of a normal SMA as this vessel is now supplying blood flow to the low-resistance liver. Distally in this SMA, beyond the origin of the RHA, the waveform will resume a typical high-resistance pattern. Other variants which can be encountered include the common hepatic artery (CHA) arising from the SMA (2–3% occurrence), CHA arising off the aorta (< 1%), and a common origin of both the CA and SMA referred to as the celiacomesenteric artery.13,14
The presence of accessory renal arteries has been reported to occur in a significant portion of the population varying between 23% and 33%.15,16 Bilateral multiple renal arteries can occur in 10–15% of the population.16,17 Accessory renal arteries may be small and difficult to identify on ultrasound. Many clinicians, but not all, hold the premise that a stenosis in any renal artery, main or accessory, could result in clinical consequences. A 2003 study by Bude et al., examined 87 kidneys in 68 patients and found 16 accessory renal arteries in 15 kidneys. 18 However, they found only one patient who had an accessory renal artery stenosis without an additional stenosis present in the main renal artery. At this incidence of 1.5%, they concluded that the failure to detect an accessory renal artery should not significantly impact the utility of duplex ultrasound to detect renovascular hypertension.
Patient preparation and positioning
Patient preparation is important with patients undergoing mesenteric and renal duplex ultrasound examinations. The patient should be fasted overnight or at a minimum for 4 hours. Morning medications can be taken with small sips of water. Patients who are diabetic are instructed to contact their primary care physician for guidance related to doses of insulin or other diabetic medication. Patients are also asked to avoid smoking or chewing gum as these activities introduce air into the gastrointestinal system. Fasting will not only improve the ability to visualize the vessels of interest but it is important to be aware that mesenteric velocity criteria was established in the fasting state.
Prior to the start of the ultrasound, the patient should be instructed on variations in breathing. Normal respiratory movement easily displaces the vessels from the field of view. Deep inspirations may be required with mesenteric testing. Patients should also practice suspending breathing without a deep inspiration as this maneuver assists in obtaining good quality waveforms from the renal vessels.
A supine patient position may be used but often the position must be varied during these examinations in order to document the required images. A patient may need to be moved into an upright or even standing position in those with suspected MALS. Renal ultrasounds can also be obtained with the patient in a lateral decubitus position, especially if extensive bowel gas is present from a midline approach. Adjusting the patient position can move bowel gas out of the field of view. Light transducer pressure may move the gas out of the scan area as well. Changing the patient position may also help in the presence of abdominal scar tissue.
Equipment optimization
Optimization of the ultrasound equipment must be performed. Low-frequency transducers, 2–5 MHz, must be used to gain enough depth in order to visualize the mesenteric and renal vessels. Manufacturer presets for specific examination types have been optimized over the years by the equipment companies. These presets provide a good start. As vessel depth, angles, and flow rates change, initial equipment settings must be adjusted. It is important to observe and optimize during the scan so that the best images can be documented, leading to the most accurate interpretation.
Spectral Doppler velocity measurements should be made using a 60° angle since that is the angle which was used to obtain data for published criteria. A 60° angle for the CA can be challenging due to its course. Variations in patient position or transducer position may help achieve a 60° angle but often angles between 0° and 30° must be used. These angles of insonation should be noted in the report and any follow-up examinations should attempt to use the same angle as prior studies.
Required documentation
Mesenteric evaluation
Essential documentation for mesenteric studies includes grayscale and/or color images of the aorta adjacent to the CA or SMA, the CA, SMA, and inferior mesenteric artery (IMA). Most laboratories include a full sweep of the aorta through the abdomen to determine the presence of plaque or aneurysmal dilation. Peak systolic (PSV) and end diastolic velocities (EDV) are recorded from the aorta at the level of the CA or SMA, the origin of the CA, the origin of the SMA, proximal SMA, and IMA. The CHA waveform is also documented as this vessel can provide indirect evidence of more proximal CA disease. The PSV of the CHA is not necessary as it is waveform morphology which is the diagnostic criterion observed for this vessel. Many laboratories will also include waveforms from the splenic artery and mid and distal SMA segments. These are the minimal levels of documentation, but many laboratories include multiple samples through the vessels.
If elevated velocities are present with the CA, it is recommended to obtain spectral waveforms during both deep (or forced) inspiration and expiration. This can be used to help identify MALS. Additional documentation can also be obtained with the patient sitting upright. With either deep inspiration or an upright position, the CA moves slightly inferior in the abdomen, assuming a more vertical position, and relieves the compression.
Prior studies have shown that approximately 30 minutes following a test meal, the velocities within the SMA increase in normal subjects. 19 Both PSV and EDV increase compared to baseline values. The elevation of postprandial velocities has been used to indirectly conclude that the vessel was disease-free. A study of 80 patients with vascular disease failed to show an improvement in diagnostic accuracy with postprandial ultrasound velocity measurements. 20 Today, most clinicians no longer perform both preprandial and postprandial duplex ultrasound examinations and rely on fasting SMA velocities to identify a stenosis.
Renal evaluation
Renal documentation must include grayscale and/or color images of the aorta at the level of the renal arteries, the renal arteries as they branch off the aorta, the renal artery and vein at the renal hilum, and pole to pole renal length measurements. Many laboratories will take three measurements of the renal length and provide an average. Spectral Doppler waveforms using angle correction are obtained from the aorta at the level of the renal arteries and the renal arteries at the ostium, proximal, mid, and distal portions. PSV and EDV are measured. Parenchymal or hilar waveforms are also documented but at these levels angle correction should not be used, and a larger sample volume will aid in obtaining signals from these small vessels. The absolute PSV and EDV are not of diagnostic importance, which is why angle correction is not necessary. Within the kidney or at the hilum, an examiner is evaluating the waveform morphology and the ratios of peak systolic to end diastolic flow. At the renal hilum, the acceleration index (AI) and/or acceleration time (AT) are also documented. The sweep speed should be increased for AI and AT measurements to aid in accurate caliper placement. Although the study by Bude 18 questioned the necessity of imaging accessory renal arteries, the common practice is to look for and document waveforms from these vessels as well.
Renal vein waveforms should also be obtained to document patency. In patients with suspected Nutcracker syndrome, renal vein velocities should be documented at the renal hilum and at the aortomesenteric portion of the renal vein. Renal vein diameters should also be measured at the hilum and at the area of maximum dilation of the vein. The examination is often repeated in an upright position to improve the accuracy of the measurements.
With any stenosis, it is important to ‘walk’ the spectral Doppler sample volume through a vessel documenting a waveform proximal to the stenosis, at the site of the highest velocity shift within the stenosis, and where poststenotic turbulence (PST) is present distal to the stenosis. PST helps to confirm the significance of the stenosis.
When scanning a patient with a bypass graft or stent, it is very helpful to know the exact location of anastomotic sites of a bypass or the position of a stent. Operative or interventional procedure notes will provide the needed information to assure the appropriate areas of the vasculature are examined.
Stents/bypasses when present should include grayscale or color documentation of the proximal and distal ends of the stent or bypass when possible. PSV measurements should be obtained within the native artery at the proximal end of the stent, the proximal, mid and distal stent, and the native artery at the distal end of the stent. All these waveforms may be difficult to obtain given the short length and small caliber of many of these stents.
It is very important that the sonographer/vascular technologist documents any limitations to the study or deviations from the protocol. Also, incidental findings should always be noted including dimensions of the object, echogenicity, and the presence of blood flow. Renal calculi, cysts, solid tumors, and hydronephrosis may be observed. Various other pathologies can be present and do not need a specific interpretation by the interpreting physician depending on the physician’s experience. However, it should be described and further evaluation should be recommended if clinically indicated.
Interpretation criteria
Mesenteric arteries
Normal waveform configurations should be recognized and understood. The CA displays a low-resistance pattern with constant forward flow throughout the cardiac cycle (Figure 1A). It is low resistance as it supplies the liver and spleen, two low-resistance organs. The CHA and splenic arteries will also normally display a low-resistance waveform with a sharp rise to peak systole. Jager et al. defined normal CA PSV as between 98 and 105 cm/s. 21 A PSV of < 125 cm/s in the CA is commonly accepted as normal.
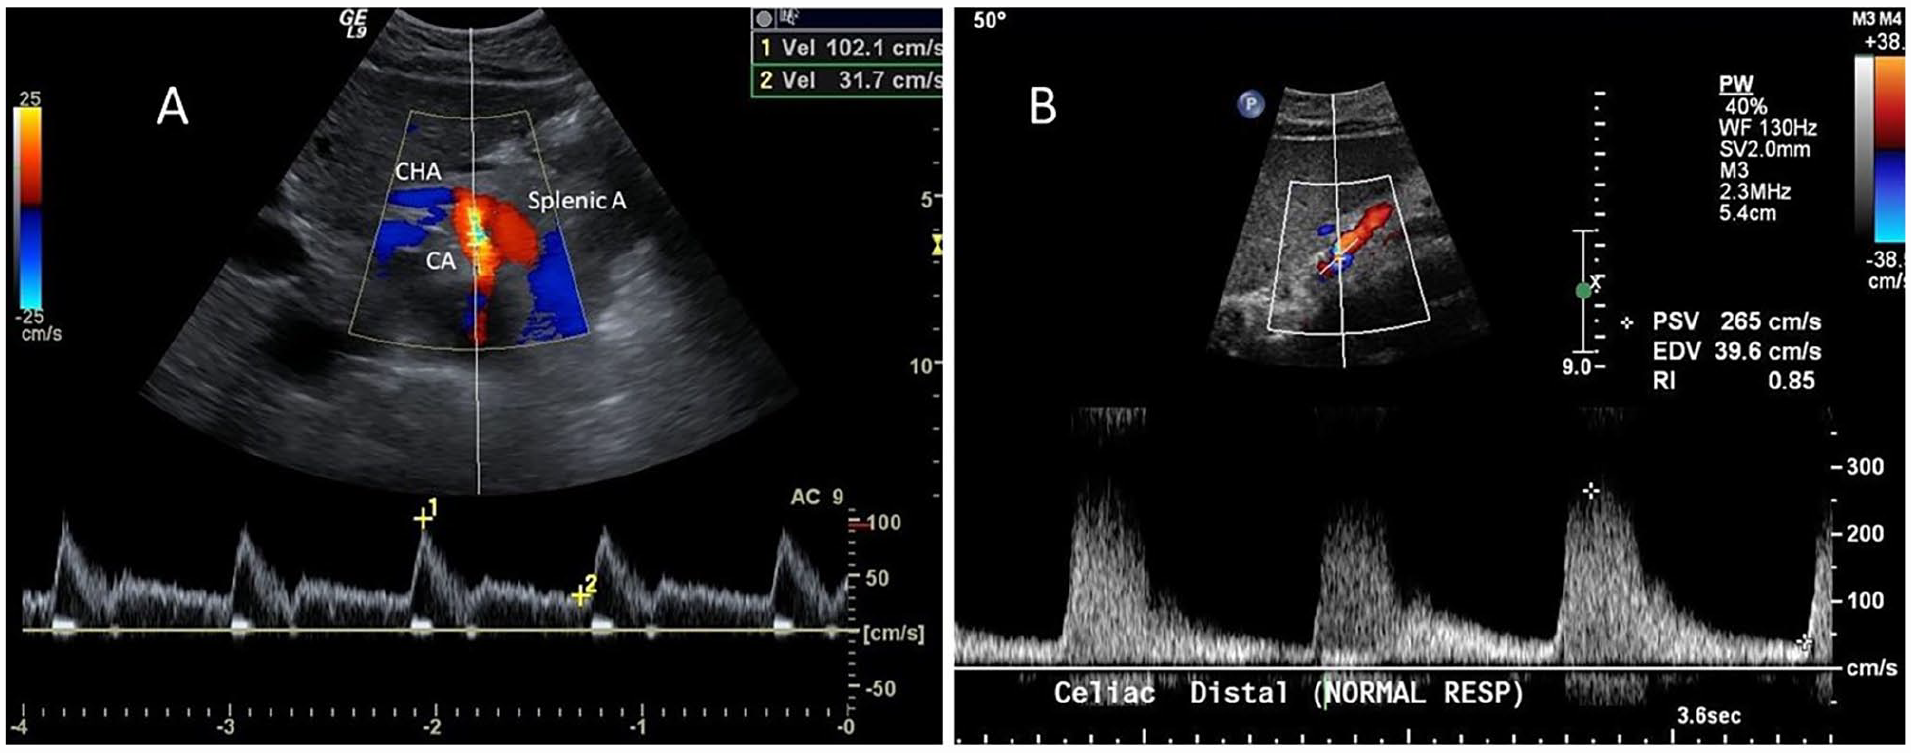
A PSV ≥ 200 cm/s correlated with a > 70% stenosis in angiographic comparisons with an 87% sensitivity, 80% specificity, and 82% accuracy. 5 In the event of a high-grade CA stenosis, PST will be present in the distal CA, and the CHA and splenic arteries will display dampened and turbulent flow patterns (Figure 1B). Studies of EDV described a > 50% stenosis correlated with an EDV ⩾ 55 cm/s with a sensitivity of 93%, specificity of 100%, and accuracy of 95%. 7
In these same studies, a reversed CHA waveform was found to be 100% predictive of severe stenosis or occlusion of the CA. 7 Eight duplex ultrasound examinations revealed retrograde CHA flow. Six of these eight patients had a CA occlusion and the remaining two patients had > 80% angiographic stenoses. The gastroduodenal artery will backfill the CHA such that retrograde flow is present in the CHA to provide flow to the splenic artery.
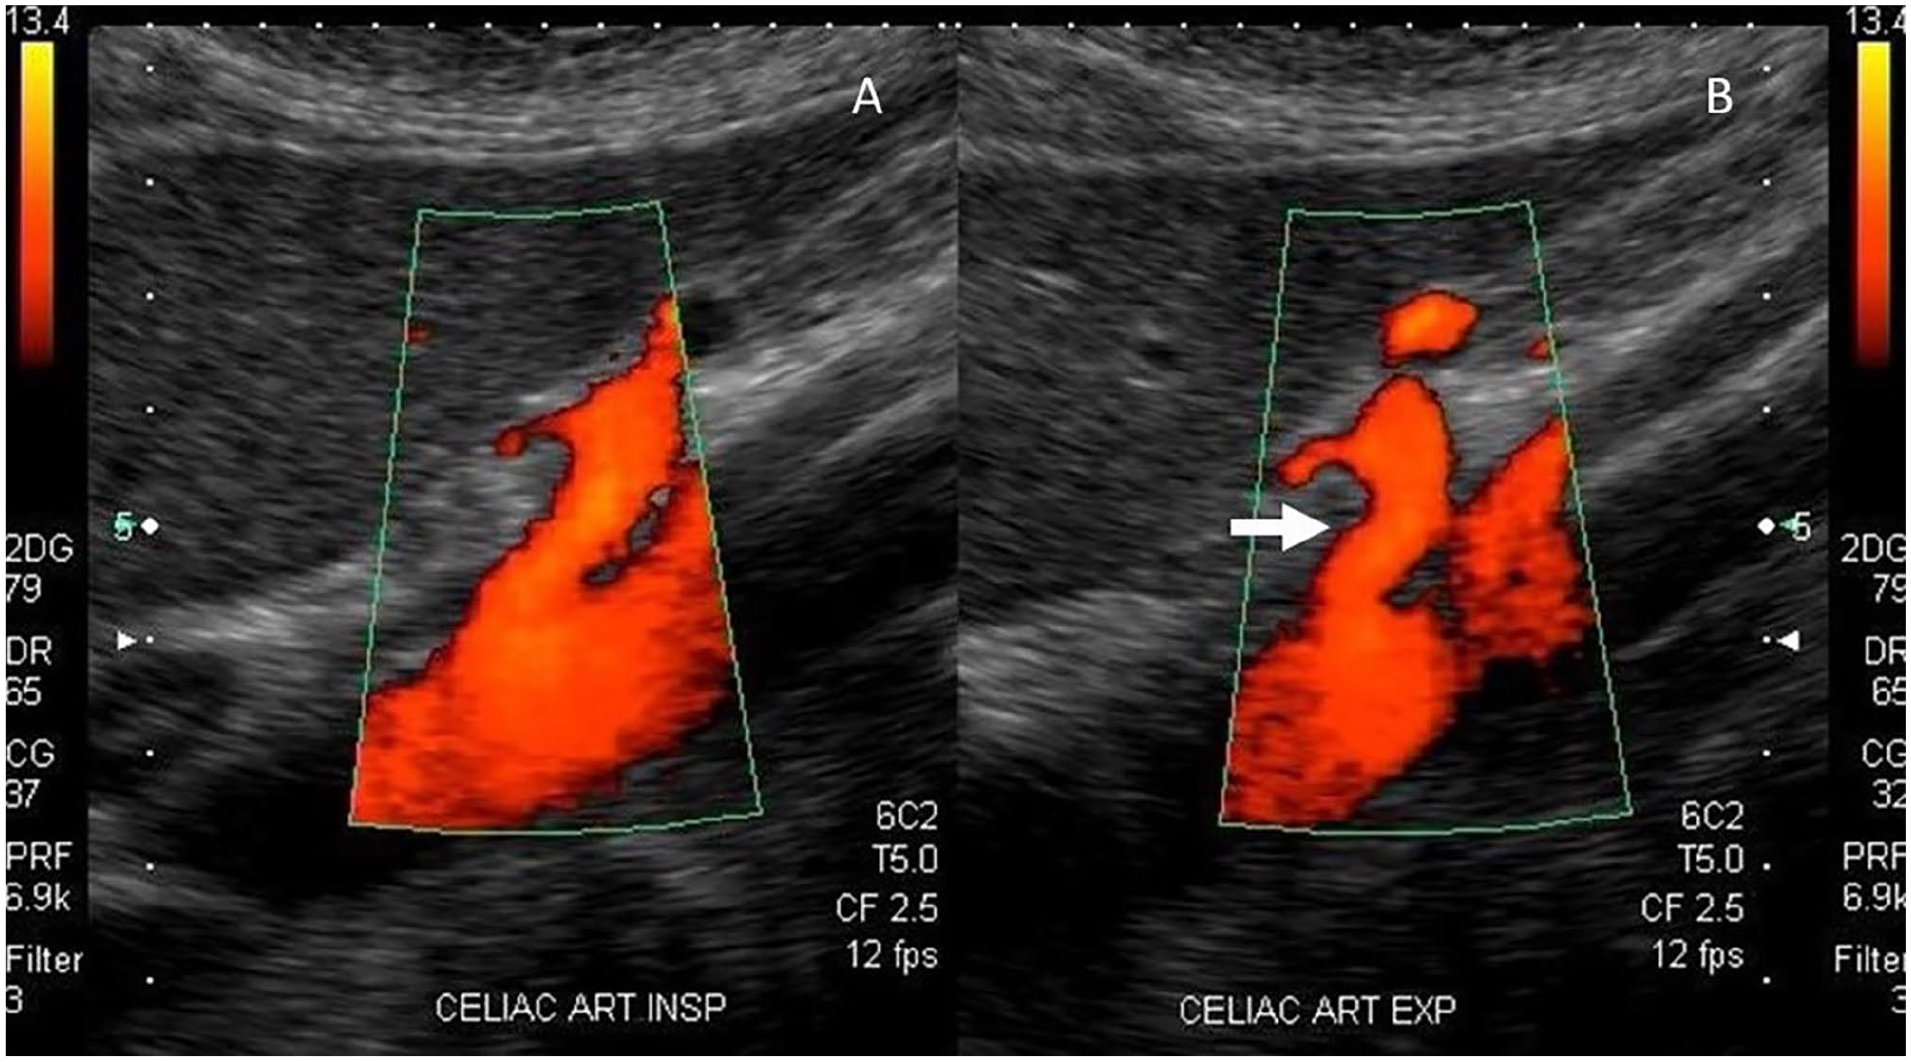
The diagnostic ultrasound criteria for MALS includes an elevated PSV in the CA during expiration which normalizes or decreases with deep inspiration. This is the result of the median arcuate ligament of the diaphragm passing anterior to the CA such that the CA is compressed during expiration. Some studies have demonstrated that the CA PSV will only normalize upon sitting upright or standing.22,23 If MALS is strongly suspected and velocities do not change with respiratory maneuvers, the examination should be repeated in an upright or standing position. Another significant diagnostic finding in patients with MALS is a characteristic ‘hooked’ appearance to the proximal CA (Figure 2). To further characterize this ‘hook’, investigators have measured the deflection angle off the aorta and found a positive angle of > 50° was associated with MALS. 24 This study defined ultrasound criteria for MALS as a PSV > 350 cm/s and a deflection angle > 50° obtained during expiration with a specificity of 100% and sensitivity of 83%. The study also noted that normal volunteers can exhibit respiratory variations in CA PSV.
The SMA displays a high-resistance waveform in the fasting state as the resting small intestine does not have a high metabolic demand for blood flow (Figure 3A). The SMA normal PSV has a range of 97–142 cm/s. 21 Angiographic correlative studies revealed a PSV ≥ 275 cm/s indicated a > 70% stenosis with a sensitivity of 92%, specificity of 96%, and accuracy of 96%4,5 (Figures 3B, 3C). Additional studies described an EDV ⩾ 45 cm/s as indicating a > 50% stenosis with a 90% sensitivity, 91% specificity, and 91% accuracy.3,7
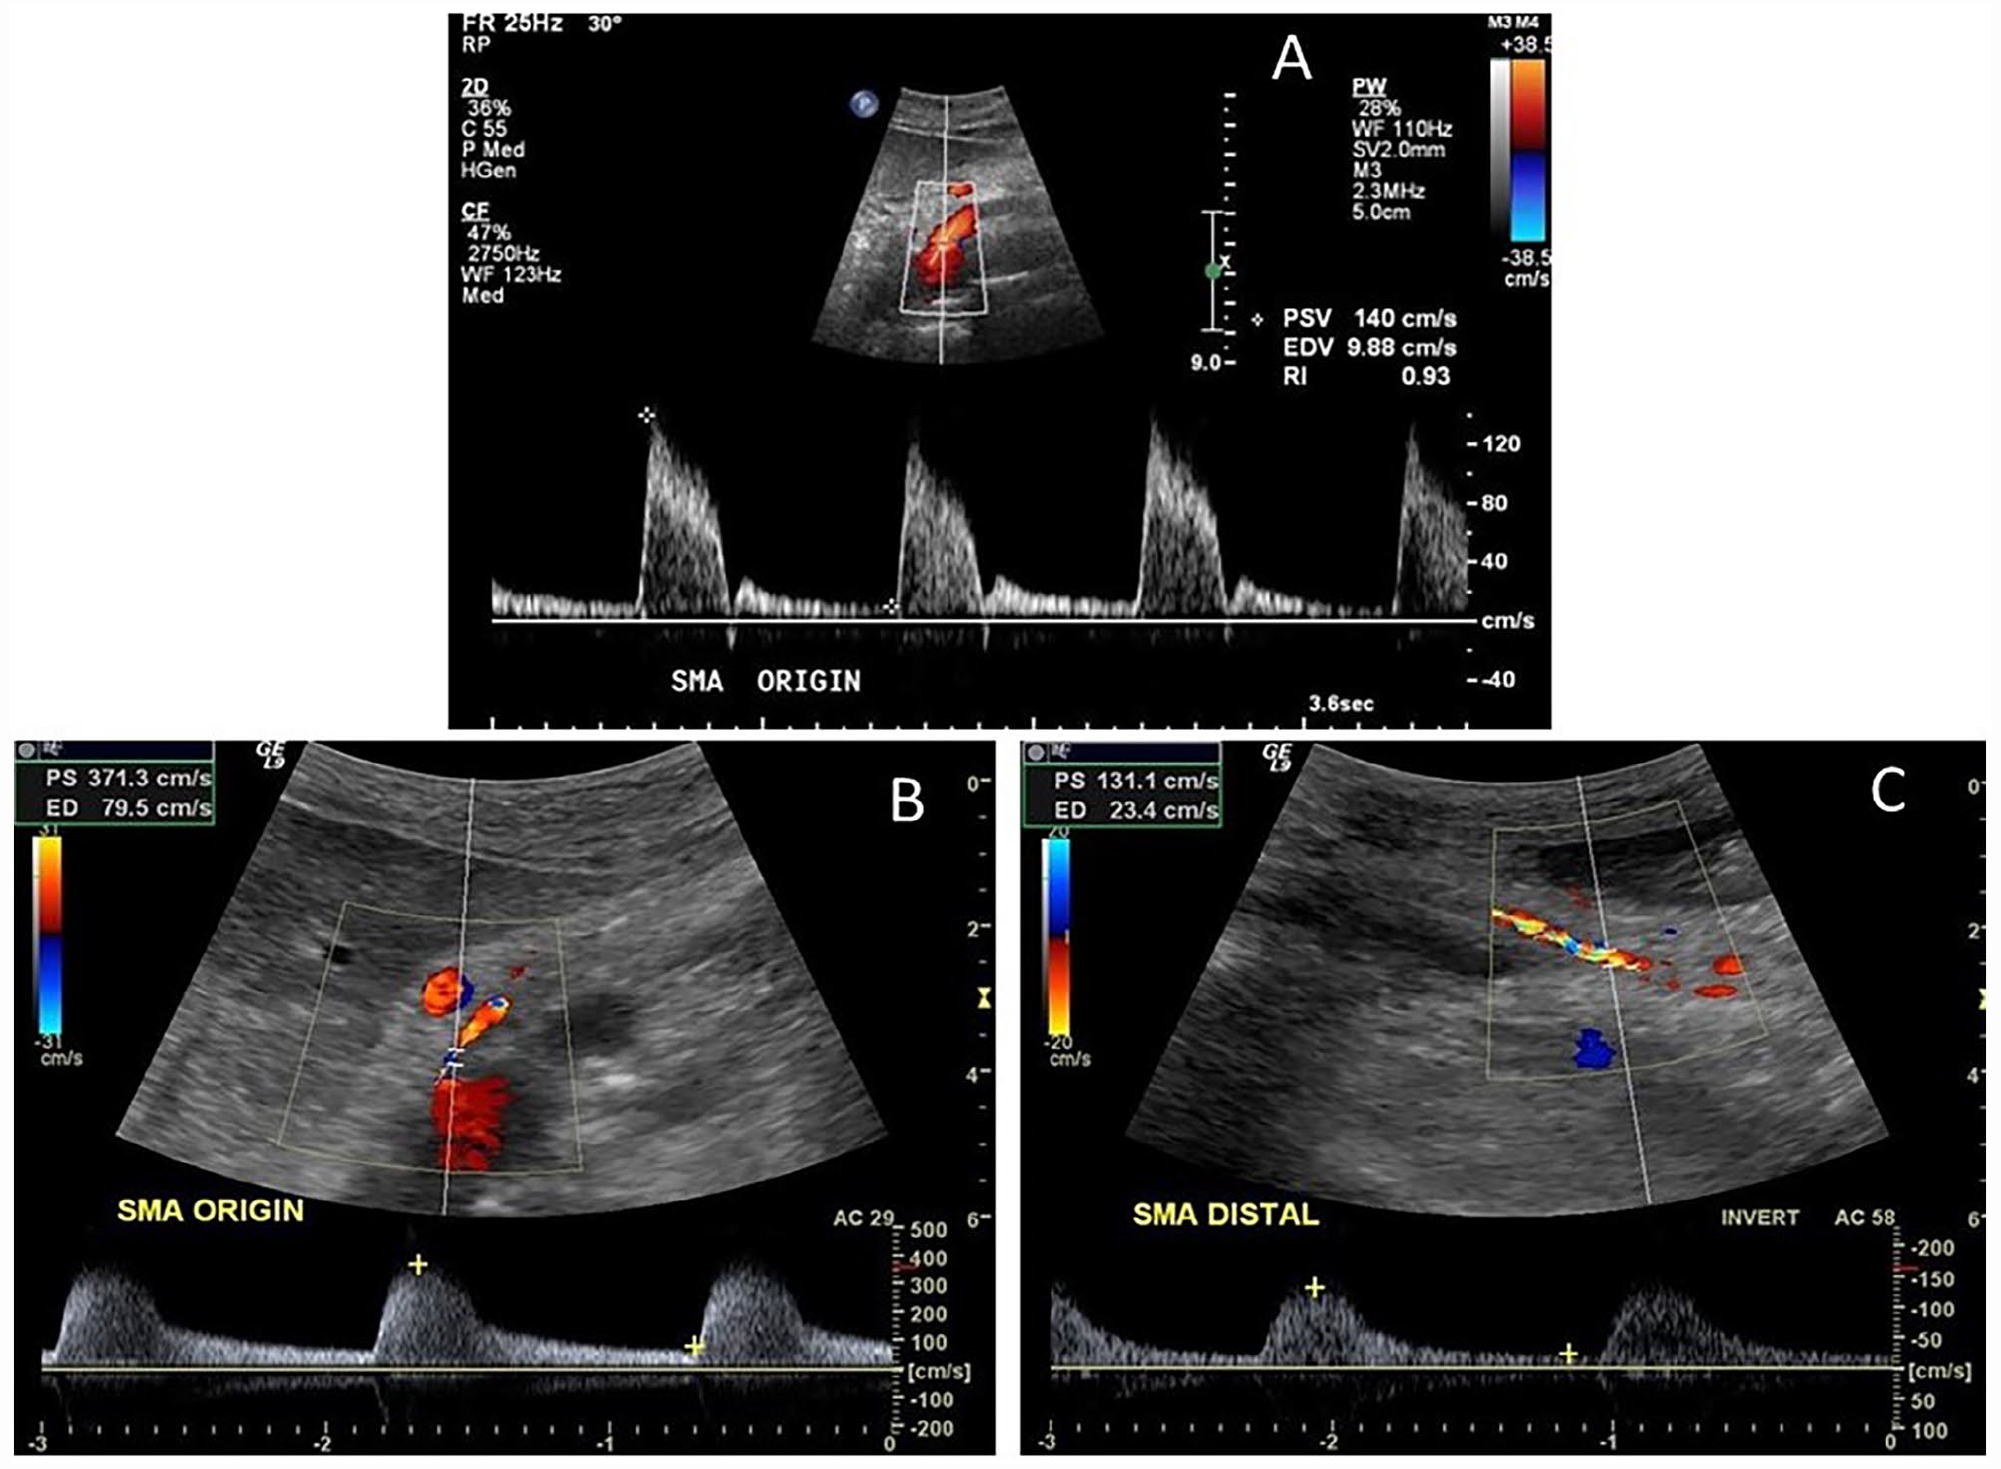
Superior mesenteric artery spectral waveforms.
In 2012, duplex ultrasound velocities and angiography of the SMA and CA were compared in 153 patients. 8 This study found PSV was better at detecting disease as compared to EDV. Their CA threshold values were a PSV ⩾ 240 cm/s for a ⩾ 50% stenosis (sensitivity 87%, specificity 83%, accuracy 86%) and a PSV ⩾ 320 cm/s for a ⩾ 70% stenosis (sensitivity 80%, specificity 89%, accuracy 85%). For the SMA, a PSV ⩾ 295 cm/s was associated with a ⩾ 50% stenosis (sensitivity 87%, specificity 89%, accuracy 88%) and a PSV of ⩾ 400 cm/s was associated with a ⩾ 70% stenosis (sensitivity 72%, specificity 93%, accuracy 85%).
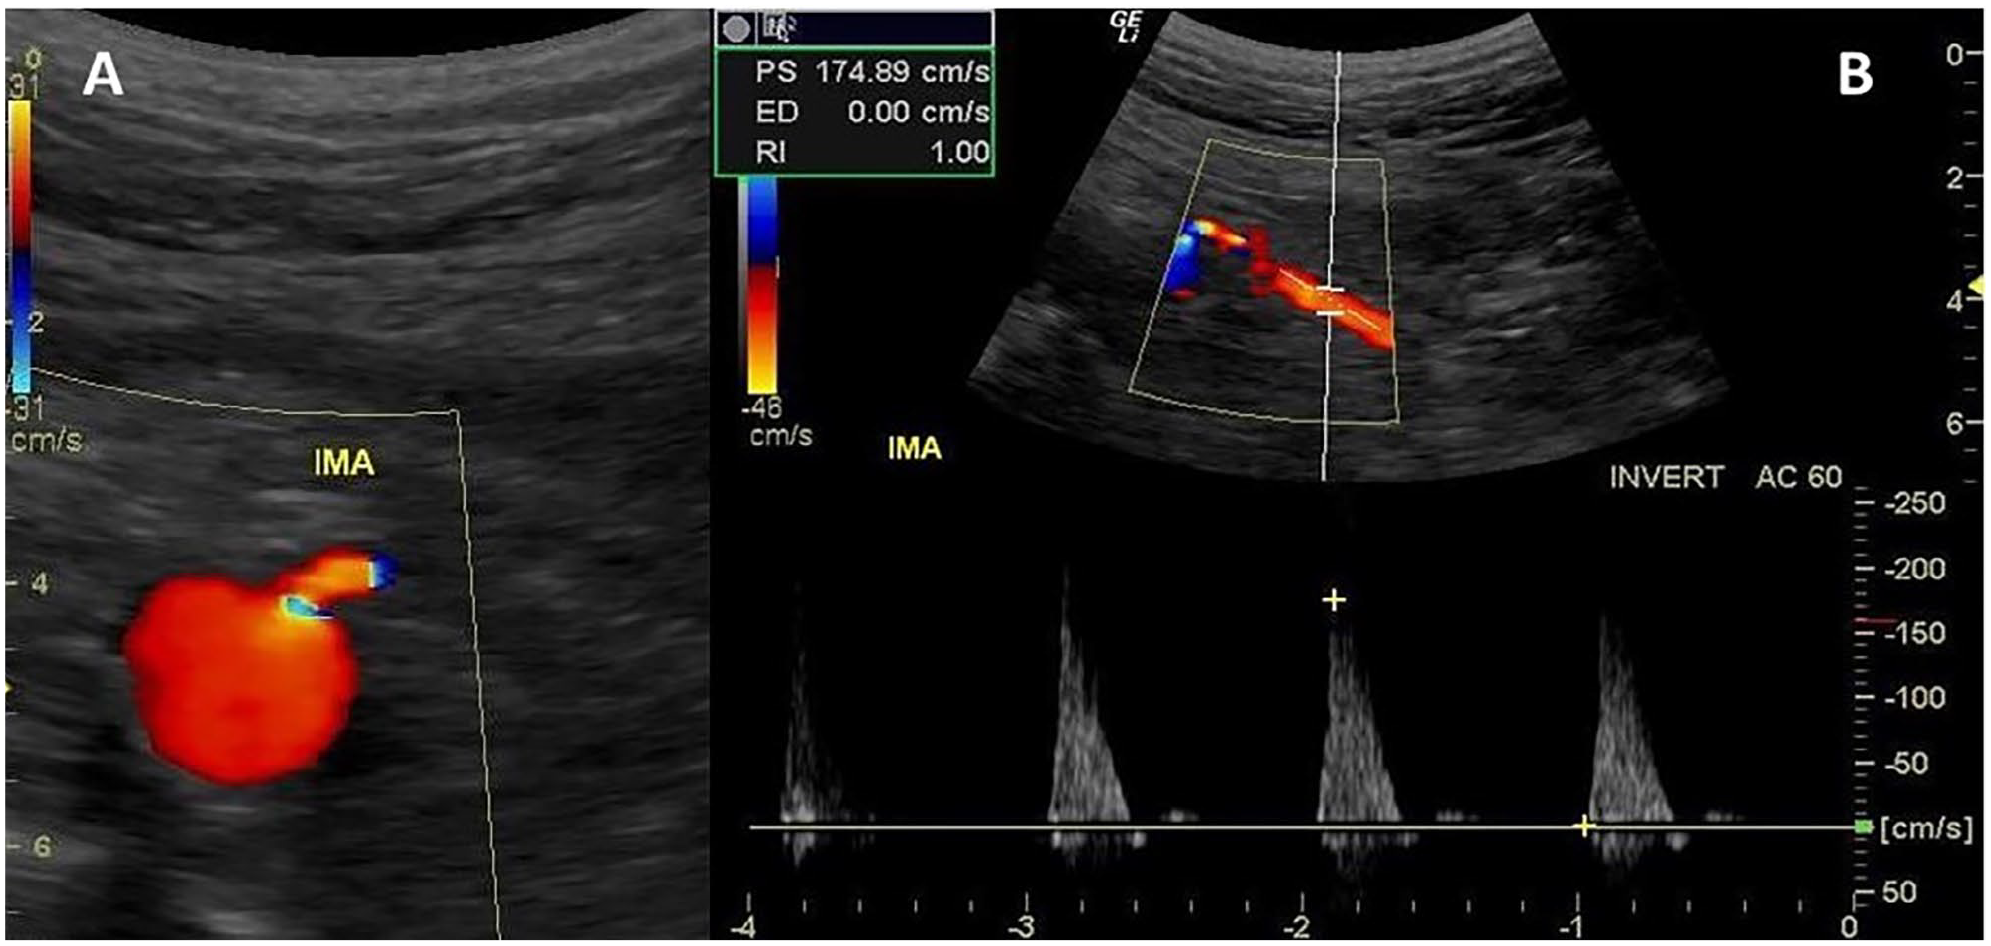
Waveforms from the IMA will be similar to the high-resistance profile observed in the SMA waveforms (Figure 4). Normal IMA PSV ranges from 93 to 189 cm/s. 21 An IMA PSV ⩾ 250 was reported to be associated with a > 50% angiographic stenosis. 25 In this study, 85 IMAs were examined by both ultrasound and angiography. A PSV value of 250 cm/s demonstrated an overall accuracy of 95% with a sensitivity of 90% and a specificity of 96%. In a retrospective review of 205 patients, Pellerito and associates examined IMA PSV, EDV, and mesenteric artery–aortic velocity ratio (MAR). 26 They defined the following threshold values for a hemodynamically significant stenosis as a PSV > 200 cm/s, an EDV > 25 cm/s, and a MAR > 2.5 with overall accuracies of 95%, 79%, and 86%, respectively. They concluded that an IMA stenosis was best diagnosed using a PSV > 200 cm/s. Table 1 summarizes CA, SMA, and IMA stenosis criteria.
Duplex stenosis criteria for celiac, superior mesenteric, and inferior mesenteric arteries.
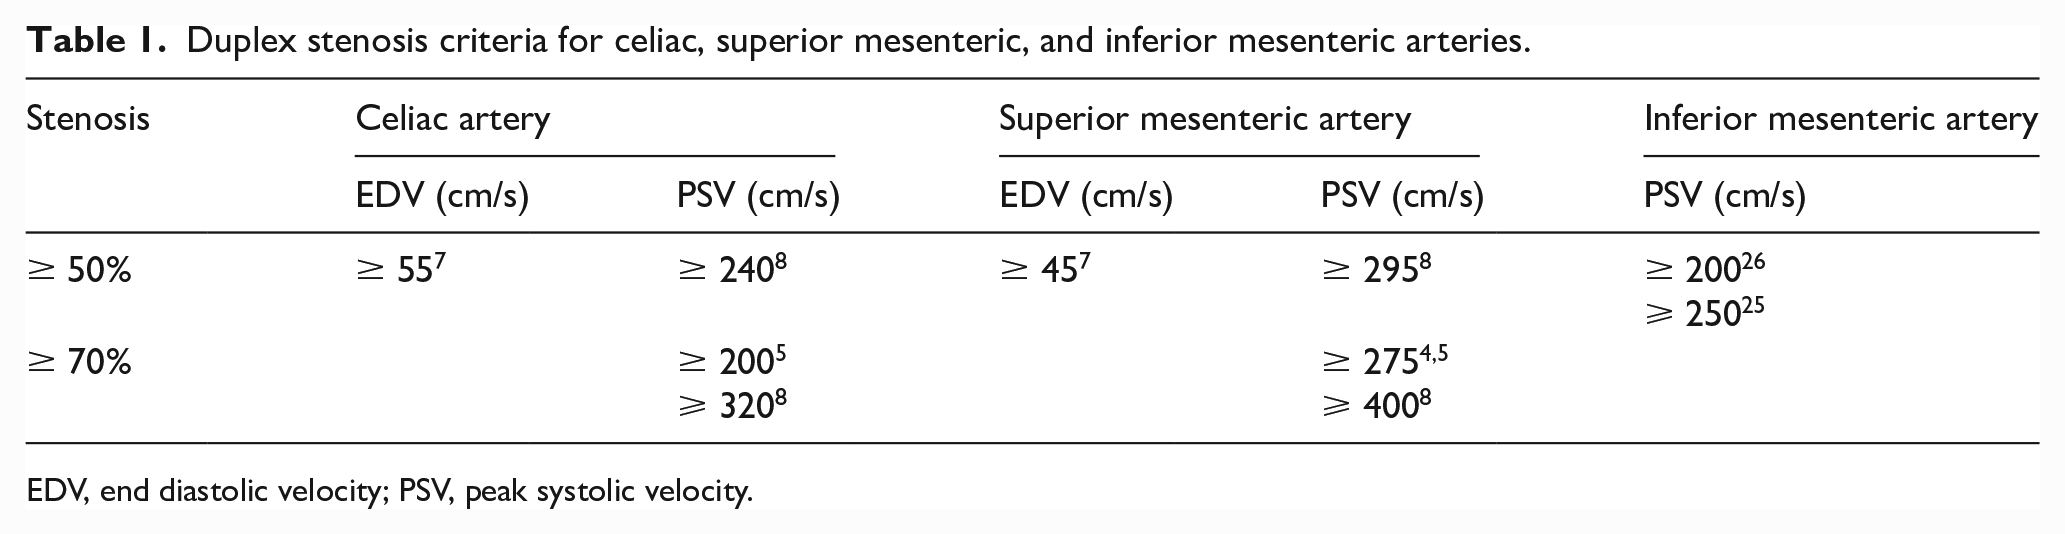
EDV, end diastolic velocity; PSV, peak systolic velocity.
An interpretative pitfall for the mesenteric vessels can arise in the presence of compensatory flow. An increase in PSV due to compensatory flow may be present if a particular artery has increased collateral flow associated with vessel occlusion or high-grade stenosis elsewhere. A stenosis is often focal, displaying increased velocities over a short segment of the vessel, and with PST. Compensatory increased flow with elevated PSVs will be diffusely present throughout the vessel without PST. Compensatory flow will also not display spectral broadening as seen within stenotic vessels.
Mesenteric artery stents
Several studies have confirmed that widely patent stented mesenteric arteries display velocities which are significantly higher than widely patent native mesenteric arteries.27–29 Mitchell et al. confirmed successful stenting of SMA with completion angiography, yet duplex ultrasound displayed velocities from 279 to 416 cm/s with a mean poststent PSV of 336 cm/s. 27 Another retrospective study examined both ultrasound and angiographic findings in 30 stented CAs and 32 stented SMAs. This study found that an optimal PSV of a stented CA with a > 50% restenosis was 274 cm/s (sensitivity 96%, specificity 86%, accuracy 93%) and with a > 70% restenosis the PSV was 363 cm/s (sensitivity 88%, specificity 92%, accuracy 90%). 29 For the SMA, a > 50% restenosis was associated with a PSV of 325 cm/s (sensitivity 89%, specificity 100%, accuracy 91%) and a > 70% restenosis had a PSV of 412 cm/s (sensitivity 100%, specificity 95%, accuracy 97%). 29
Soult et al. reviewed ultrasound findings and angiography results in 66 SMA stents and 37 CA stents. 30 This investigation proposed slightly different values for a > 70% in-stent restenosis. A PSV ⩾ 289 cm/s for the CA yielded a 100% sensitivity but only a 57% specificity. For the SMA, a PSV ⩾ 445 cm/s had a 83% sensitivity and specificity.
A 7-year retrospective, single-center study of 71 arteries in 61 patients was published by Barnes et al. 31 Duplex ultrasound data from 32 stented CAs and 39 SMA stents was reviewed. During the follow-up period, 23 patients developed symptomatic recurrence of mesenteric occlusive disease. Receiver operating characteristic (ROC) curves for CA stents revealed a PSV ⩾ 440 cm/s which yielded 100% sensitivity and 86% specificity for clinically significant in-stent restenosis. For a clinically significant in-stent restenosis of the SMA, a PSV ⩾ 341 cm/s yielded 80% sensitivity and 52% specificity.
SVS guidelines recommend contrast imaging in those with a CA stent PSV > 370 cm/s and in those with a SMA stent PSV > 420 cm/s. 12 These guidelines are based on a strength of recommendation 2 (weak) and quality of evidence C (low).
There is yet to be universally accepted in-stent restenosis criteria but higher PSV values are clearly documented in multiple publications. Table 2 summarizes stenosis criteria for stented mesenteric vessels. There are no published criteria for mesenteric bypass grafts.
Duplex stenosis criteria for stented celiac and superior mesenteric arteries.
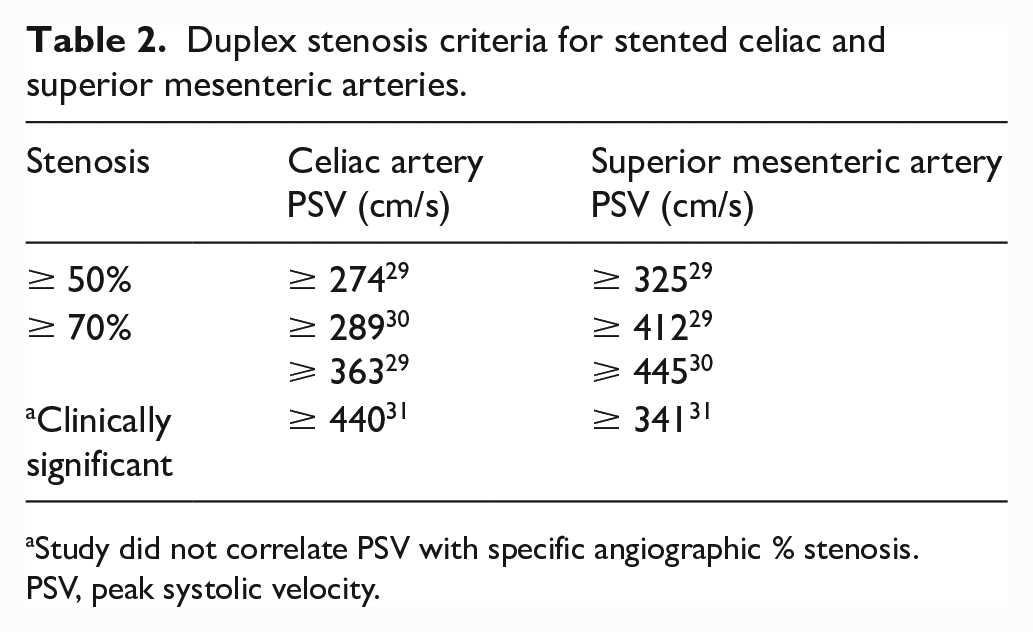
Study did not correlate PSV with specific angiographic % stenosis.
PSV, peak systolic velocity.
Renal arteries
Normal renal artery spectral waveforms are low resistance with forward flow through the cardiac cycle due to the high metabolic demands of the kidney (Figure 5A). An early study by Hoffmann et al. examined 74 renal arteries by both duplex ultrasound and angiography. 32 They found the PSV of normal renal arteries is typically less than 180 cm/s and using this value as a threshold for disease provided a sensitivity of 95% and specificity of 90% (Figure 5B). Other investigators have supported these criteria.11,33 In addition to an elevated PSV, PST should also be present.
Early researchers confirmed the importance of evaluating the renal artery velocities compared to the aortic velocities. The RAR is calculated by dividing the highest renal artery PSV by the aortic PSV as recorded proximal to the origin of the renal arteries. However, the RAR is not used if aortic pathology is present. If the aortic PSV is elevated due to occlusive disease or diminished due to aneurysmal dilation, then the RAR is not valid. For the RAR to be used diagnostically, the aortic velocity must be between 40 and 100 cm/s. The use of the RAR was investigated by Kohler et al. who showed a ratio of > 3.5 was associated with a > 60% stenosis (sensitivity 91%, specificity 95%). 10
A large study was conducted by AbuRahma et al. examining duplex ultrasound and angiography in 606 renal arteries in 313 patients exhibiting symptoms suggestive of renal artery stenosis. 34 Based on the angiographic results, renal arteries were placed into one of the four following categories: normal (n = 210), < 60% (n = 158), 60–99% (n = 207), and occluded (n = 31). They determined a PSV cut-off of 285 cm/s had the best overall accuracy of 81% (sensitivity 67%, specificity 90%) in determining a ⩾ 60% stenosis. For EDV and RAR, the most accurate thresholds for ⩾ 60% stenosis were an EDV of 65 cm/s (accuracy 74%) and RAR of 3.7 (accuracy 82%). In evaluating the commonly used criteria of PSV ⩾ 180 cm/s and RAR ⩾ 3.5, their data showed an overall accuracy of 72%. The accuracy was the same if the PSV ⩾ 200 cm/s was used. The authors concluded either a PSV of 285 cm/s or a RAR of 3.7 can be used alone to detect a ⩾ 60% stenosis. Even though this large study demonstrated improved accuracy with higher PSV and RAR thresholds, these higher values have not gained widespread use.
Another less frequently used ratio to detect renal artery stenosis is the renal–renal ratio (RRR). The RRR is the PSV in the proximal or mid-portion of the renal artery divided by the PSV in the distal renal artery. A RRR of > 2.7 was predictive of a > 50% stenosis with a sensitivity of 97% and specificity of 96%. 35
Four general categories are used to classify renal artery disease. A summary of the criteria is presented in Table 3.
Common duplex stenosis criteria for the renal artery.
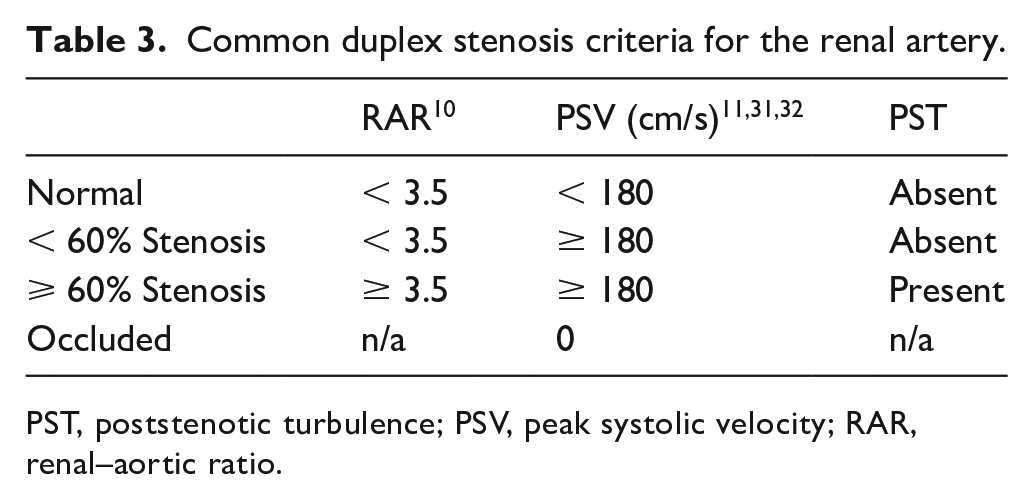
PST, poststenotic turbulence; PSV, peak systolic velocity; RAR, renal–aortic ratio.
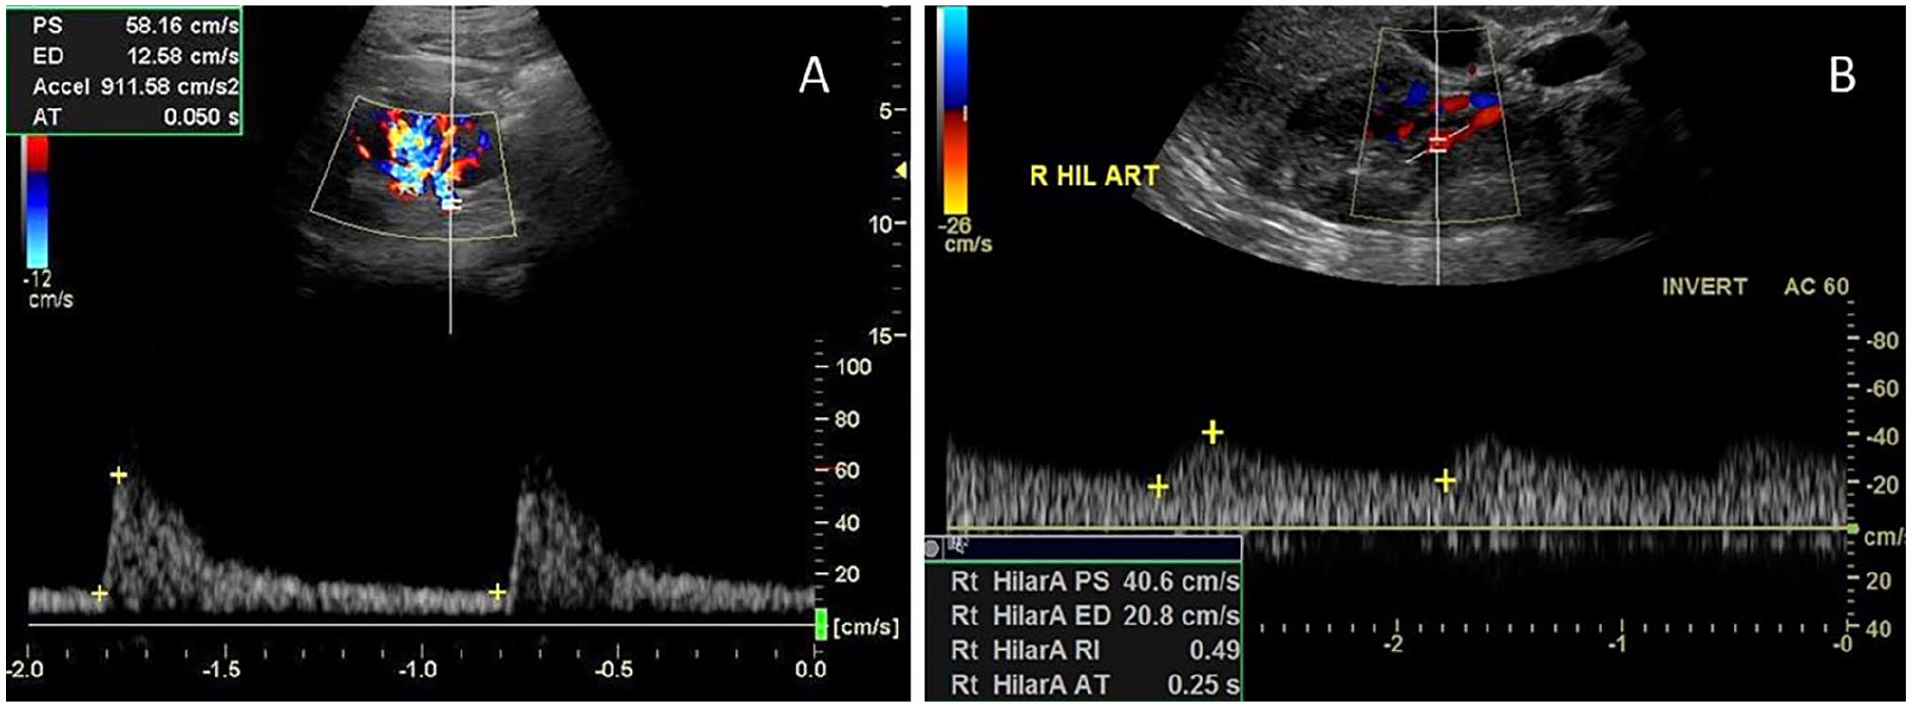
Hilar waveforms can provide indirect evidence of more proximal disease using measurements of AI and AT (Figure 6A). It is believed a more proximal stenosis will result in a dampened waveform with a prolonged upstroke at the renal hilum. These measurements may be helpful for patients in whom the proximal renal arteries are not able to be adequately insonated due to the presence of bowel gas or acoustic shadowing from stents or stent grafts. The AI is based on the slope of the systolic upstroke and the AT is the time from the beginning of systole to the first compliance peak. Handa et al. first published AI data, which demonstrated a sensitivity of 100%, specificity of 93%, and accuracy of 95%. 36 The original data used units of kHz/s as the older equipment at the time used kHz. Converting into velocity units, an AI value of ⩽ 291 cm/s2 indicates a significant stenosis in the proximal renal artery. Martin et al. conducted studies using AT and found an AT > 100 ms was associated with a more proximal renal artery stenosis 37 (Figure 6B). Further studies by Stavros et al. examined pattern recognition and the presence of an early systolic peak (ESP). 38 They found the loss of an ESP identified a renal artery stenosis with 95% sensitivity, 97% specificity, and 96% accuracy.
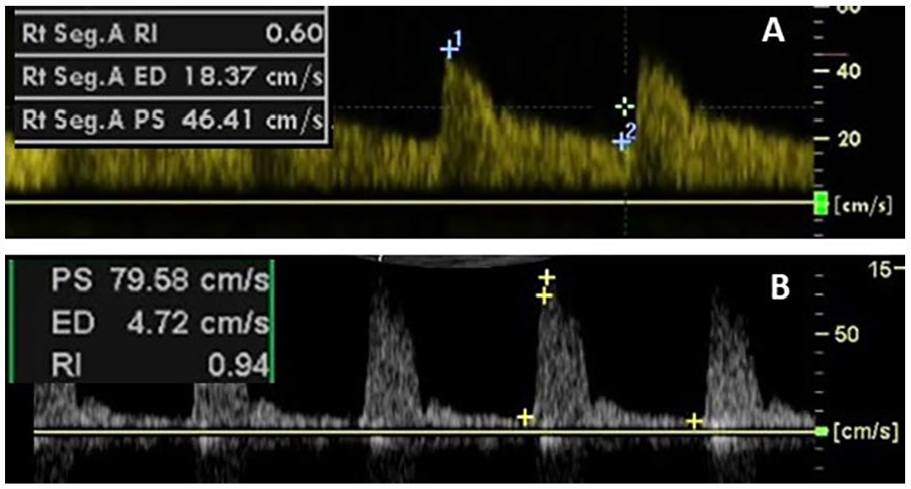
In addition to examining the main renal artery for stenosis, parenchymal waveforms are examined to provide information as to the intrinsic health of the kidney and vascular resistance. 39 Two parameters commonly measured are the end diastolic ratio (EDR) and the renal resistive index (RRI), also termed simply RI for resistive index or resistance index. The EDR is the EDV/PSV. The RI is the (PSV – EDV)/PSV. Increased renovascular resistance is associated with an EDR ⩽ 0.3. 40 The RI in patients with normal kidneys has been shown to range between 0.5 and 0.67. 41 An RI ⩾ 0.7 is considered abnormal 41 (Figure 7). The measurements, RI and EDR, are two methods used to examine the same features of a waveform. The RI is equal to 1 – EDR.
FMD of the renal artery can produce one focal or multifocal stenotic areas. 42 With multifocal disease the ‘string of beads’ appearance may be seen on ultrasound in the mid and distal renal artery. The PSV and RAR criteria described for renal atherosclerotic disease is typically not applied to FMD. Ultrasound findings of FMD will include turbulence, tortuosity, and velocity increases in the mid and distal renal artery (Figure 8).
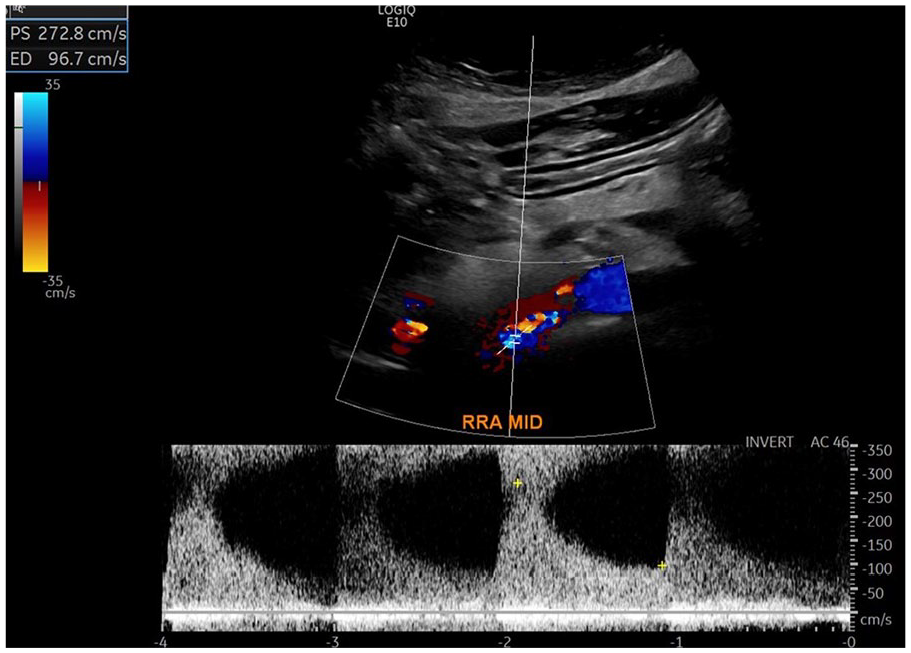
Ultrasound image of right renal artery in a patient with fibromuscular dysplasia (courtesy of Heather L. Gornik, Harrington Heart & Vascular Institute, University Hospitals, Cleveland, OH). The color image demonstrates aliasing and disturbed flow present in the mid renal artery. The spectral waveform illustrates turbulence and elevated velocities with PSV 272.8 cm/s and EDV 96.7 cm/s.
Renal veins
Renal veins often display slightly pulsatile flow patterns as they terminate into the inferior vena cava at a level where transmitted cardiac pulsations can be observed. Specific quantitative criteria for the diagnosis of Nutcracker syndrome includes calculating the ratio of the highest renal vein velocity compared to the renal vein velocity at the hilum. A renal vein velocity ratio greater than 5.0 has a sensitivity of 80% and specificity of 94% in detecting Nutcracker syndrome. 43 A renal vein diameter ratio (diameter at area of greatest dilation compared to the renal vein diameter at the hilum) greater than 5 has a slightly lower sensitivity, 69%, and specificity, 89%, than the renal vein velocity ratio. 43
Kidney length
Kidney length is commonly documented during renal artery ultrasounds. Adult kidney length is approximately 10–12 cm. 44 Slight asymmetry left to right is common. 45 In the presence of a chronic renal artery occlusion, kidney atrophy will occur. 46 A recent study suggested a difference in kidney length of 1.2 cm was found to be significant for renal artery stenosis 47 (Figure 9).
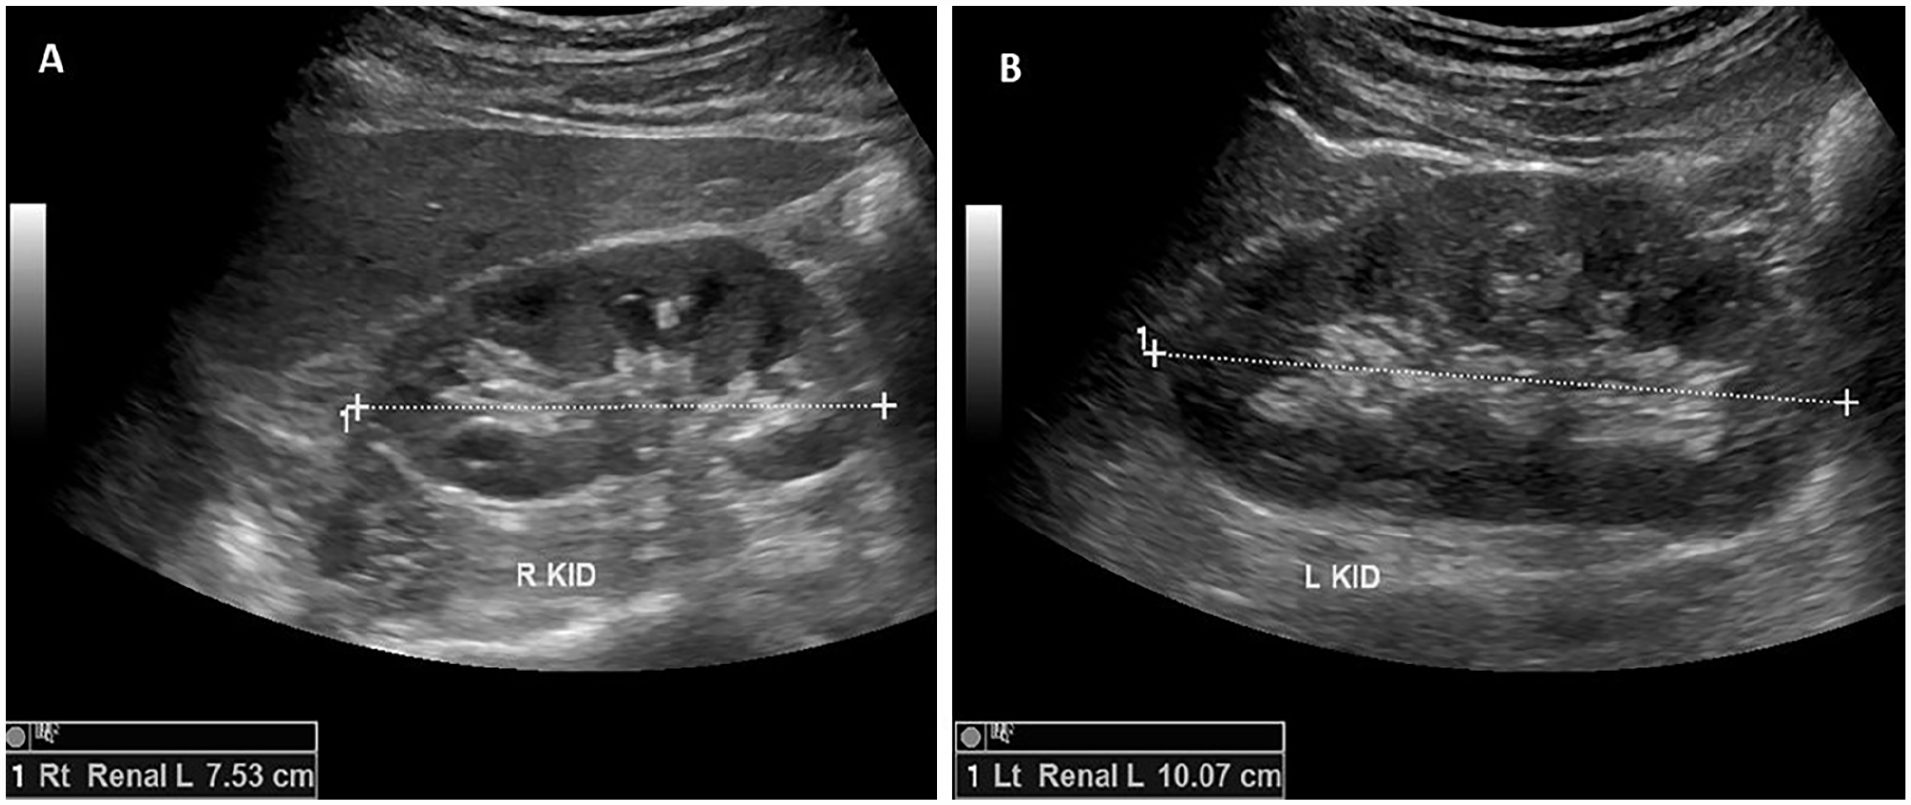
Kidney (KID) length (L) measurements in a patient with a right renal artery stenosis.
Renal artery stents
As with mesenteric stents, there are no broadly accepted stented renal artery criteria and conflicting study recommendations. A 2009 study compared 67 consecutive patients with abnormal duplex ultrasound findings after renal artery stenting with 55 nonstented patients. 48 They classified abnormal duplex results as those with a PSV ⩾ 200 cm/s and a RAR of ⩾ 3.5, which was their standard criteria for native renal arteries. Angiography showed a > 50% in-stent restenosis in 31 of the 67 patients with a mean angiographic stenosis of 72 ± 21%. In the nonstented group, a > 50% stenosis by angiography was found in 30 of the 55 patients with a mean angiographic stenosis of 70 ± 20%. ROC analysis-determined thresholds for a ⩾ 70% in-stent restenosis was a PSV ⩾395 (83% sensitivity, 88% specificity, 87% accuracy) and a RAR ⩾ 5.1 (94% sensitivity, 86% specificity, 88% accuracy). These authors concluded that native artery criteria overestimates disease in stented renal arteries and recommended further study of stented renal artery duplex parameters.
Another early study by Fleming et al. looked at 66 stented renal arteries by both duplex ultrasound and digital subtraction angiography. 49 The ROC analysis of their data indicated a PSV ⩾ 180 cm/s had a 73% sensitivity, 80% specificity, and 76% accuracy. Similar findings were obtained for a PSV ⩾ 200 cm/s, which had a 68% sensitivity, 80% specificity, and 76% accuracy. Increasing the PSV to ⩾ 250 cm/s resulted in an improved specificity of 95% and accuracy of 83%, but a sensitivity of only 59%. They concluded that native renal artery PSV criteria for stenosis compared favorably with duplex findings of restenosis in stented renal arteries.
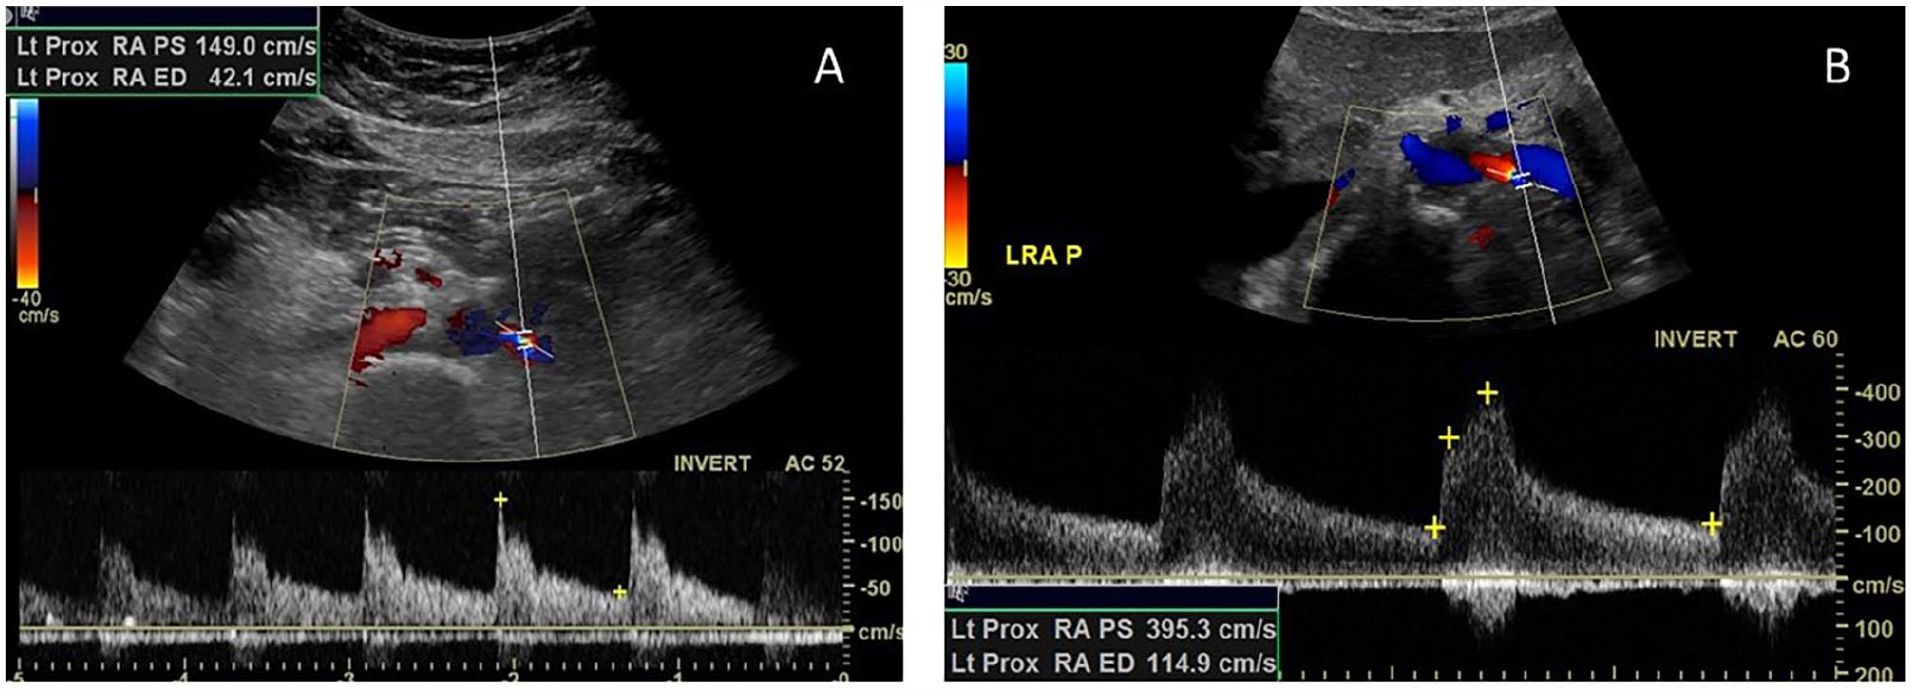
A larger retrospective review of 132 stented renal artery duplex ultrasound findings were compared to angiography results by del Conde et al. 50 A 0–59% stenosis was angiographically present in 88 renal arteries whereas 44 renal arteries had a 60–99% stenosis. Consistent with the earlier study by Chi et al., 48 these investigators found that higher velocities were present in stented renal arteries as compared to normal native renal arteries. The group suggested a PSV ⩾ 296 cm/s as a cut-off for a > 60% in-stent restenosis (Figure 10). This value had a positive predictive value of 94%, a sensitivity of 75%, and specificity of 99%. A RAR ⩾ 4.4 was also accurate in identifying a restenosis with a positive predictive value of 96%, a sensitivity of 64%, and specificity of 98%. The authors concluded that the PSV was a better predictor as the area under the curve was larger for the PSV cut-off as compared to the RAR cut-off (0.95 vs 0.92). Additional recommendations were made as a result of their analysis. They stated a PSV < 241 cm/s or RAR of < 2.6 were accurate in excluding a restenosis with negative predictive values of 96% and 95%, respectively. For PSV values between 241 and 295 or RAR values of 2.6–4.3, one could not rule out a restenosis and termed these values as being within an indeterminate zone.
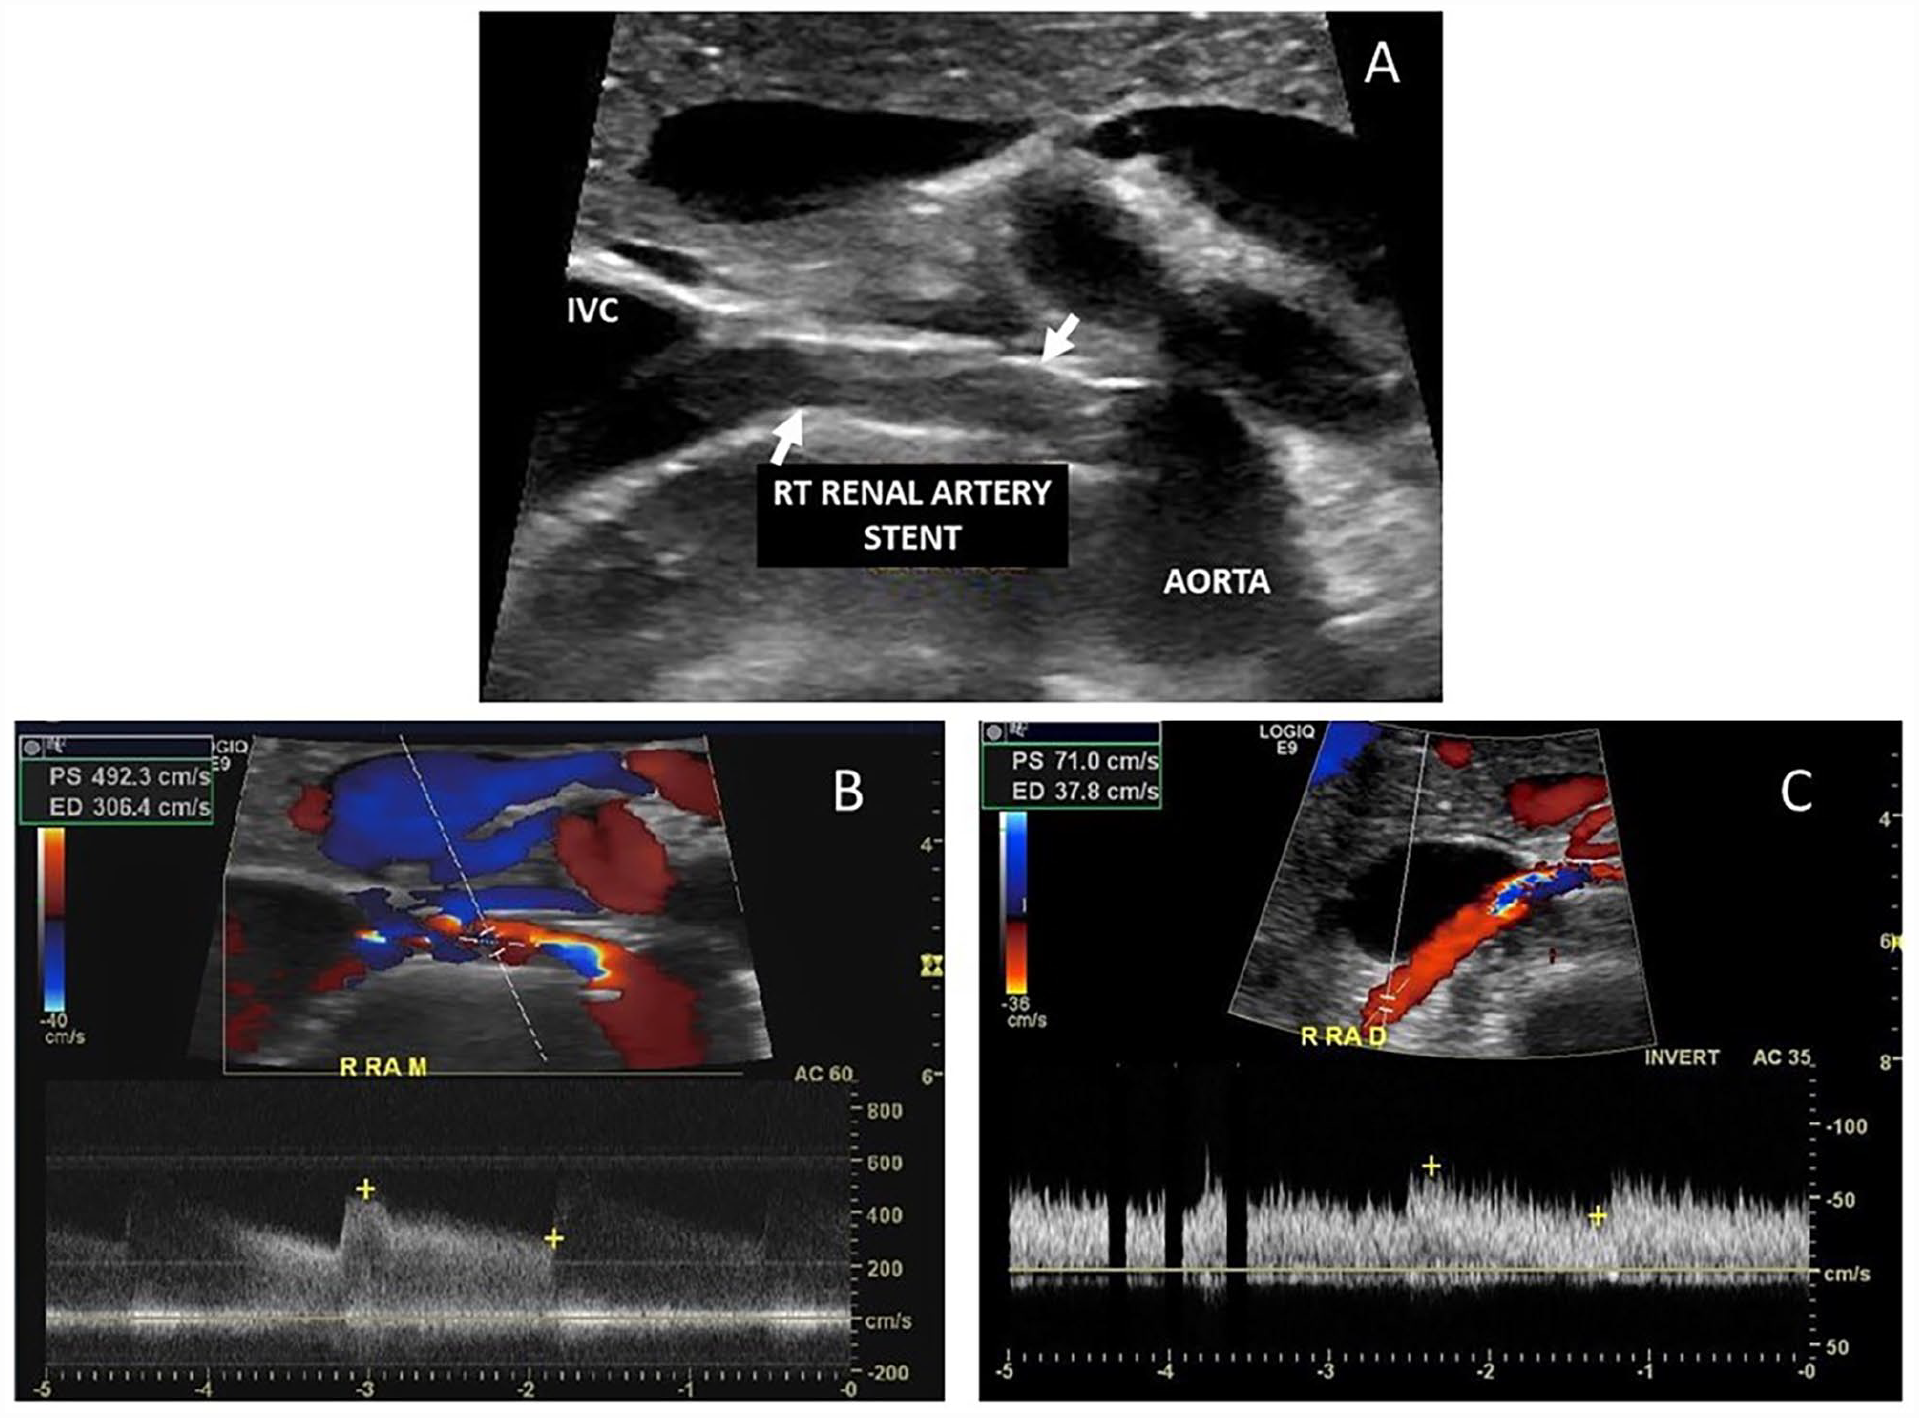
Images from a patient with a renal artery stent.
Studies have examined renal artery duplex findings in patients with fenestrated endovascular aortic grafts and renal artery stents. These patients represent a different population as they did not have atherosclerotic renal artery disease but were stented as part of endovascular aortic repair. In one study, researchers followed 518 renal arteries with both covered (n = 231) and uncovered (n = 287) stents for a mean of 25 months. 51 A total of 36 stents (30 uncovered, six covered) developed a stenosis. Based on these patients, the group suggested revised criteria of PSV ⩾ 280 cm/s (sensitivity 93%, specificity 100%) or RAR ⩾ 4.5 (sensitivity 83%, specificity 89%) for a 60–99% stenosis. A second study examined 94 stented renal arteries, only nine of which developed a stenosis. 52 This study found a PSV > 215 cm/s in the proximal renal artery yielded a 83% sensitivity and 94% specificity for a junctional stenosis. A distal renal artery PSV of < 25 cm/s had a 100% sensitivity and 97% specificity for a stenosis within the main body of the stent. They went on to suggest the best indicator of stenosis was the use of dual threshold criteria of combining both the elevated PSV proximally and the diminished PSV distally, which provided a sensitivity of 92% and specificity of 85%.
SVS guidelines recommend contrast imaging in those patients with a renal artery stent PSV ⩾ 280 cm/s or with a RAR ⩾ 4.5. 12 This is based on a strength of recommendation 2 (weak) and quality of evidence B (moderate). Table 4 summarizes the ultrasound criteria for renal artery stents.
Duplex stenosis criteria for stented renal arteries.
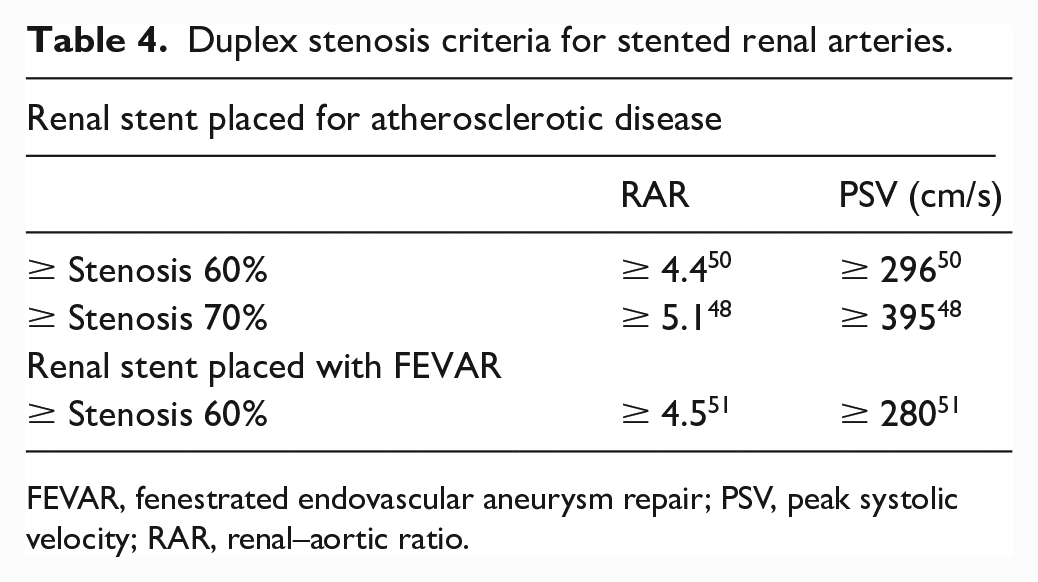
FEVAR, fenestrated endovascular aneurysm repair; PSV, peak systolic velocity; RAR, renal–aortic ratio.
Key points to remember
Accurate interpretation of ultrasound studies requires technically adequate and comprehensive images to review.
A ⩾ 70% stenosis of the celiac artery (CA) is associated with a PSV ⩾ 200 cm/s.
A ⩾ 70% stenosis of the SMA is associated with a PSV ⩾ 275 cm/s.
A ⩾ 60% stenosis of the renal arteries is associated with a PSV > 180 cm/s and a RAR > 3.5.
Data for stented vessels varies. The SVS recommends further investigation of stents with the following findings on ultrasound: CA stent, PSV ⩾ 370 cm/s; SMA stent, PSV ⩾ 420 cm/s; renal artery stent, PSV ⩾ 280 cm/s or RAR ⩾ 4.5.
Conclusions
Duplex ultrasound is a commonly utilized diagnostic tool to examine the mesenteric and renal vasculature. Scanning techniques have been defined for these vessels in addition to following surgical or endovascular treatment. Awareness of anatomic variants, attention to patient preparation and positioning, and equipment optimization will all assist in obtaining good quality diagnostic images. Interpretive criteria for native vessels have been well defined, with some variations noted for stented vessels. Individual laboratories should maintain ongoing internal review of ultrasound results to aid in assuring reliable diagnostic accuracy.
Footnotes
Declaration of conflicting interests
The author declared no potential conflicts of interest with respect to the research, authorship, and/or publication of this article.
Funding
The author received no financial support for the research, authorship, and/or publication of this article.