
Abstract
Introduction:
Evaluation of limb hemodynamics using the ankle–brachial index (ABI) may be difficult due to skin lesions, extensive necrosis, and obesity, such as commonly present in patients with diabetes with chronic limb-threatening ischemia (CLTI). We hypothesized that the pedal acceleration time (PAT) correlates with ABI and Wound, Ischemia, and foot Infection (WIfI) scores in patients with diabetes to serve as a new modality to accurately stage CLTI.
Methods:
A single-center, cross-sectional study included patients with and without diabetes > 18 years with CLTI. Limbs were categorized in three grades of ischemia based on the ABI (ABI < 0.8, < 0.6, and < 0.4) and in two classes based on WIfI stages of amputation risk. Receiver operator characteristic (ROC) curves were used to determine PAT sensitivity, specificity, and accuracy to predict lower-limb ischemia.
Results:
A total of 141 patients (67 nondiabetic and 74 diabetic) and 198 lower limbs (94 nondiabetic and 104 diabetic) met the inclusion criteria. In patients without diabetes, the accuracy of PAT for detecting an ABI < 0.8 was 85%; for detecting an ABI < 0.6 was 85%; and for detecting an ABI < 0.4 was 87%. In patients with diabetes, the accuracy of PAT in detecting an ABI < 0.8 was 91%; for detecting an ABI < 0.6 was 79%; and for detecting an ABI < 0.4 was 88%. In patients without diabetes, the accuracy for detecting WIfI stages of moderate and high amputation risk was 77% and for patients with diabetes was also 77%.
Conclusions:
PAT shows high correlation with the ABI as well as with the WIfI stages of amputation risk and the grades of ischemia, with high accuracy.
Keywords
Introduction
The clinical approach to treat patients with chronic limb-threatening ischemia (CLTI) focuses on reducing pain, healing wounds, and preventing major amputation, as well as improving functional status and quality of life. 1 The ankle–brachial index (ABI) is widely applied and is considered the standard tool to objectively diagnose peripheral artery disease (PAD) according to the Wound, Ischemia, and foot Infection (WIfI) classification. 2 However, in patients with obesity, edema, extensive limb dressings, orthopedics devices, or arterial medial calcification, the ABI may be limited, preventing accurate hemodynamic quantification of perfusion.1,3,4 Other methods to assess perfusion, such as transcutaneous oxygen tension (TCPO2), pulse volume recordings (PVR), or toe pressure measurements using Doppler and photoplethysmography, are validated alternatives; however, these tests may not be widely available, can consume scarce resources, and may also be difficult to interpret. For example, there are several limitations to using TCPO2 as a marker for the severity of arterial disease: TCPO2 is a marker of skin perfusion and, as a result, can be falsely low in low temperatures or in the presence of vasculitis, or falsely high in patients with diabetes. Accordingly, there is controversy about whether TCPO2 can be more accurate than the ABI. PVR traditionally complement the ABI but require expensive machinery and frequently a dedicated technician. There are also limitations to the use of toe pressures in assessing foot perfusion, including prior amputation of the first toe, extreme calcification, vasoconstriction of digital arteries, and unclear accuracy of the toe pressure in representing perfusion to the heel, especially if they are in distinct angiosomes; in addition, toe pressure can sometimes be less accurate than the ABI.5,6
Duplex ultrasound (DUS) is an alternative method, at least in patients without diabetes.1,3,7 The spectral waveform measurements available during a Duplex ultrasound scan, such as acceleration time and peak systolic velocity, are validated and frequently used in clinical practice to measure blood flow as well as to provide anatomic details. 8 Pulsed-Doppler analysis of the lateral plantar artery provides the pedal acceleration time (PAT), which is simple and noninvasive, and can be performed rapidly at the bedside, including in locations that may benefit from rapid acquisition of data such as in the emergency, operative, and angiographic rooms. The PAT measurement also permits direct real-time visualization of the vessels and hemodynamic changes in the foot. Furthermore, PAT only requires a vascular ultrasound machine that is typically present in most vascular laboratories worldwide, even among low- and middle-income countries. 9
The utility of PAT was first described by Sommerset et al. who demonstrated the linear relationship between PAT and ABI in patients without diabetes and suggested reference values for PAT for different ABI grades according to the Rutherford classification. 7 This group first described PAT using images from the four pedal arteries. 10 The same group described, in 2021, the use of PAT to predict limb salvage in patients with diabetes with noncompressible ABI after revascularization; however, the global accuracy of PAT was not reported.7,11 Thus, lack of validated correlation between DUS measurements and the ABI prevents clinicians from using a reliable tool to assess perfusion in some patients with diabetes.
The aim of this study was to determine the accuracy of PAT to identify and to quantify limb ischemia using the WIfI classification system in patients with and without diabetes, as well as to assess correlation with the WIfI stages of amputation risk. 2
Methods
This is a cross-sectional study performed in a tertiary vascular center. Data were collected between June 2019 and March 2020. This study was approved by the Ethics Committee (protocol number 34091220.6.0000.5149), and the informed consent requirement was waived because the research involved no more than minimal risk to patients. This study was performed in the Vascular Surgery unit of the University Hospital Risoleta Tolentino Neves, Federal University of Minas Gerais in Belo Horizonte, Minas Gerais, Brazil.
We included all patients with a previously known or with a new diagnosis of PAD in need of noninvasive vascular imaging between June 2019 and March 2020 sequentially admitted to our vascular surgery unit; patients were included if they were over 18 years old, regardless of sex, diabetic status, or history of previous revascularization. Patients were excluded if they had acute limb ischemia, peripheral aneurysms, blue toe disease, and had occluded or nonpulsatile flow in the lateral plantar artery, or elevated or incompressible ankle systolic pressure. Patients who met the inclusion criteria were scored by the Society for Vascular Surgery (SVS) WIfI classification system (see below). 2 Every patient enrolled could have up to two limbs for the analysis; however, nondiseased or amputated limbs were not included.
To estimate the risk of amputation at admission, we used the WIfI classification system. Risk stratification of the WIfI classification is based on three major factors that impact amputation risk and clinical management: wound, ischemia, and foot infection. Wounds are stratified from grade 0 through grade 3 based on size, depth, severity, and anticipated difficulty of achieving wound healing. Presence of infection is stratified in four grades based on clinical observations. This system has been validated and correlates with amputation risk. It should be noted that grade 3 infections are characterized by systemic or metabolic toxicity and are associated with a very high risk of early amputation. Based on these factor stratifications, group combinations were divided into four stages of amputation risk and of benefit of revascularization: stage 1, very low; stage 2, low; stage 3, moderate; and stage 4, high. 2
The designation of the WIfI classification system was performed by the senior vascular surgeon present on the day of admission and confirmed during hospitalization by other senior vascular surgeons, including on the day of the ultrasound exam. In case of disagreements, the most experienced surgeon made the final classification. 2
The ABI was measured as the ratio between the highest supra-malleolar systolic pressure and the highest systolic pressure in the arms using a handheld continuous 8-megahertz (MHz) Doppler device (Medpej DF 7001 [Ribeirão Preto, São Paulo, Brazil] or Medmega DV 610 [Franca, São Paulo, Brazil]) and a 12-cm arterial pressure cuff with a calibrated aneroid sphygmomanometer. The ABI was considered unreliable if higher than 1.4 or if the systolic ankle pressure was incompressible (> 250 mmHg). 12
Duplex imaging of the lateral plantar artery was performed by a single, trained, certified vascular surgeon using a linear array transducer (frequency 9–3 MHz) with a Toshiba Aplio XG US system L9-3 (Toshiba Medical Systems, Tokyo, Japan). In our unit, all operators performed at least 20 supervised examinations prior to performing independent studies. The DUS spectral waveform was obtained in a vessel identified below the medial malleolus (Figure 1). The transverse axis was used to assess the posterior tibial artery bifurcation; the lateral plantar artery was identified in the long axis, in the mid aspect of the foot, lying above the metatarsal bony mark.13,14 Images demonstrating areas of occlusion or changes in blood flow were saved into the computer system, and PAT was measured manually in milliseconds (ms)7,11 (Figure 2).
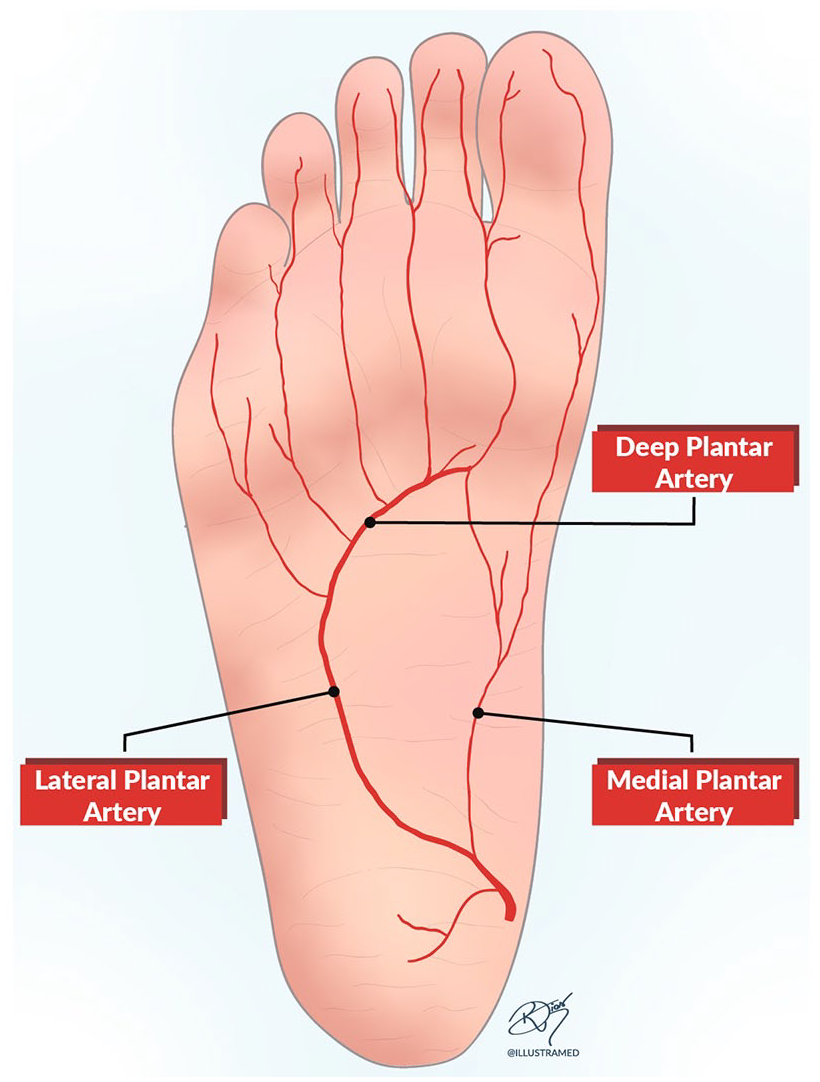
Anatomy of the lateral plantar artery.
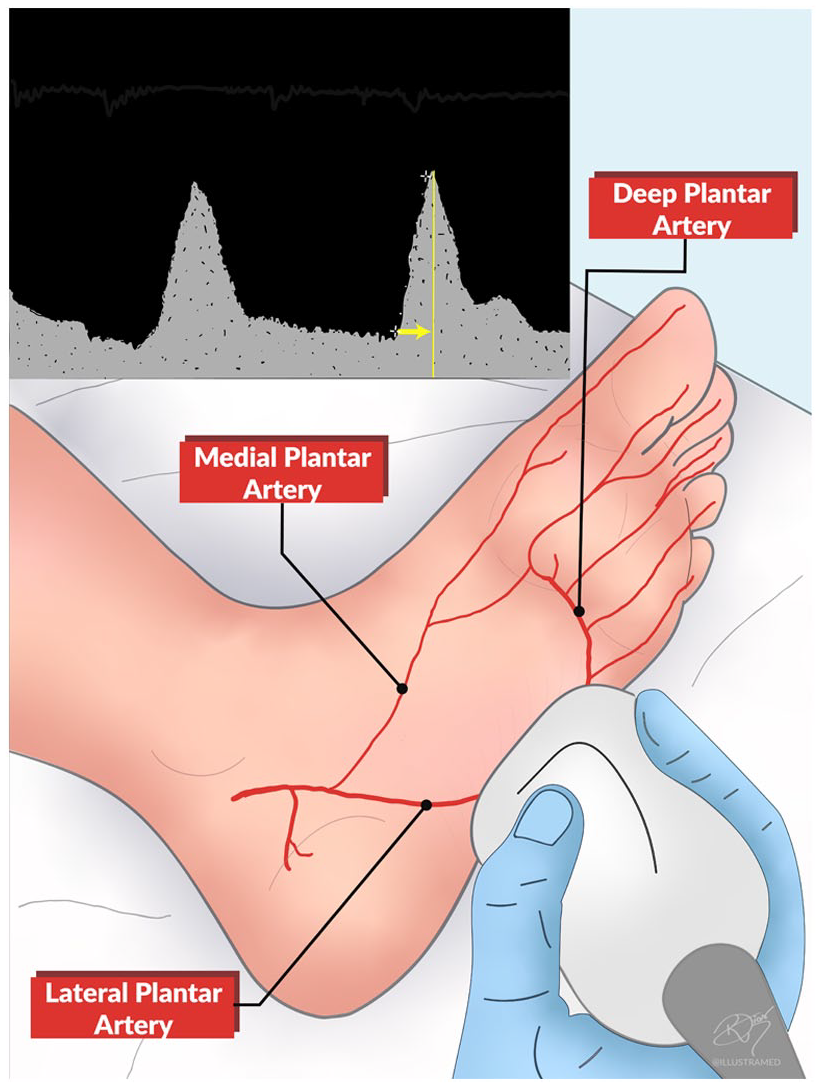
Duplex imaging of the lateral plantar artery. Inset shows the spectral waveform of the lateral plantar artery and the pedal acceleration time depicted by the yellow arrow.
Demographic and clinical data included: age, sex, comorbidities, smoking, statin use, creatinine levels, lower limbs and arteries affected by PAD. DUS measurements including PAT, ABI, ischemia grade, and stages of amputation risk, and stages of revascularization benefit from the SVS-WIfI classification system. All data were inputted into an Excel spreadsheet.
Statistical analysis
The data were tested for normality using the Shapiro–Wilk test. Demographic and clinical characteristics were presented as mean and SD or minimum and maximum percentage or median and IQR range when appropriate. Relative risk (RR) was calculated as the ratio of the outcome probability between two groups and was reported using 95% CI. For the main analysis, the sample was divided in two groups: nondiabetic and diabetic. Each lower limb was considered individually. Spearman correlation analysis was performed between the ABI and amputation risk stages and PAT in each group. A Spearman coefficient closer to 1 suggests strong correlation between the variables, and negative coefficients represent an inversely proportional correlation. To analyze the data based on the ABI and the WIfI classification system, limbs were grouped into three ABI groups: ABI < 0.8; ABI < 0.6, and ABI < 0.4. Data were also combined in two classes based on their WIfI amputation risk stages: 1 (very low and low) and 2 (moderate and high).1,2 Receiver operator characteristic (ROC) curves were calculated. The PAT measurement value with the highest sensitivity, specificity, positive predictive value, negative predictive value, and accuracy was determined using the calculated list of optimal cut-off points. Continuous variables were compared using Welch’s t-test if normally distributed and the Mann–Whitney test if not normally distributed. Categorical variables were analyzed using the chi-squared test. Tests were performed using GraphPad Prism, version 8.4.2 for Mac OS (GraphPad Software, Inc., San Diego, CA USA). A p-value less than 0.05 was considered statistically significant.
Results
Patients
The projected sample size for the study was calculated prior to enrollment; to achieve 80% power and p < 0.05, and using an estimated disease prevalence of 70%, 153 lower limbs needed to be examined. 15 During the study period, 184 consecutive patients (265 lower limbs) were referred to the vascular imaging unit for an arterial lower-limb DUS examination and were assessed for inclusion in the study. From the total, 141 patients (67 nondiabetic and 74 diabetic) with 198 lower limbs (94 nondiabetic and 104 diabetic) met the inclusion criteria and were included in the study (Figure 3).
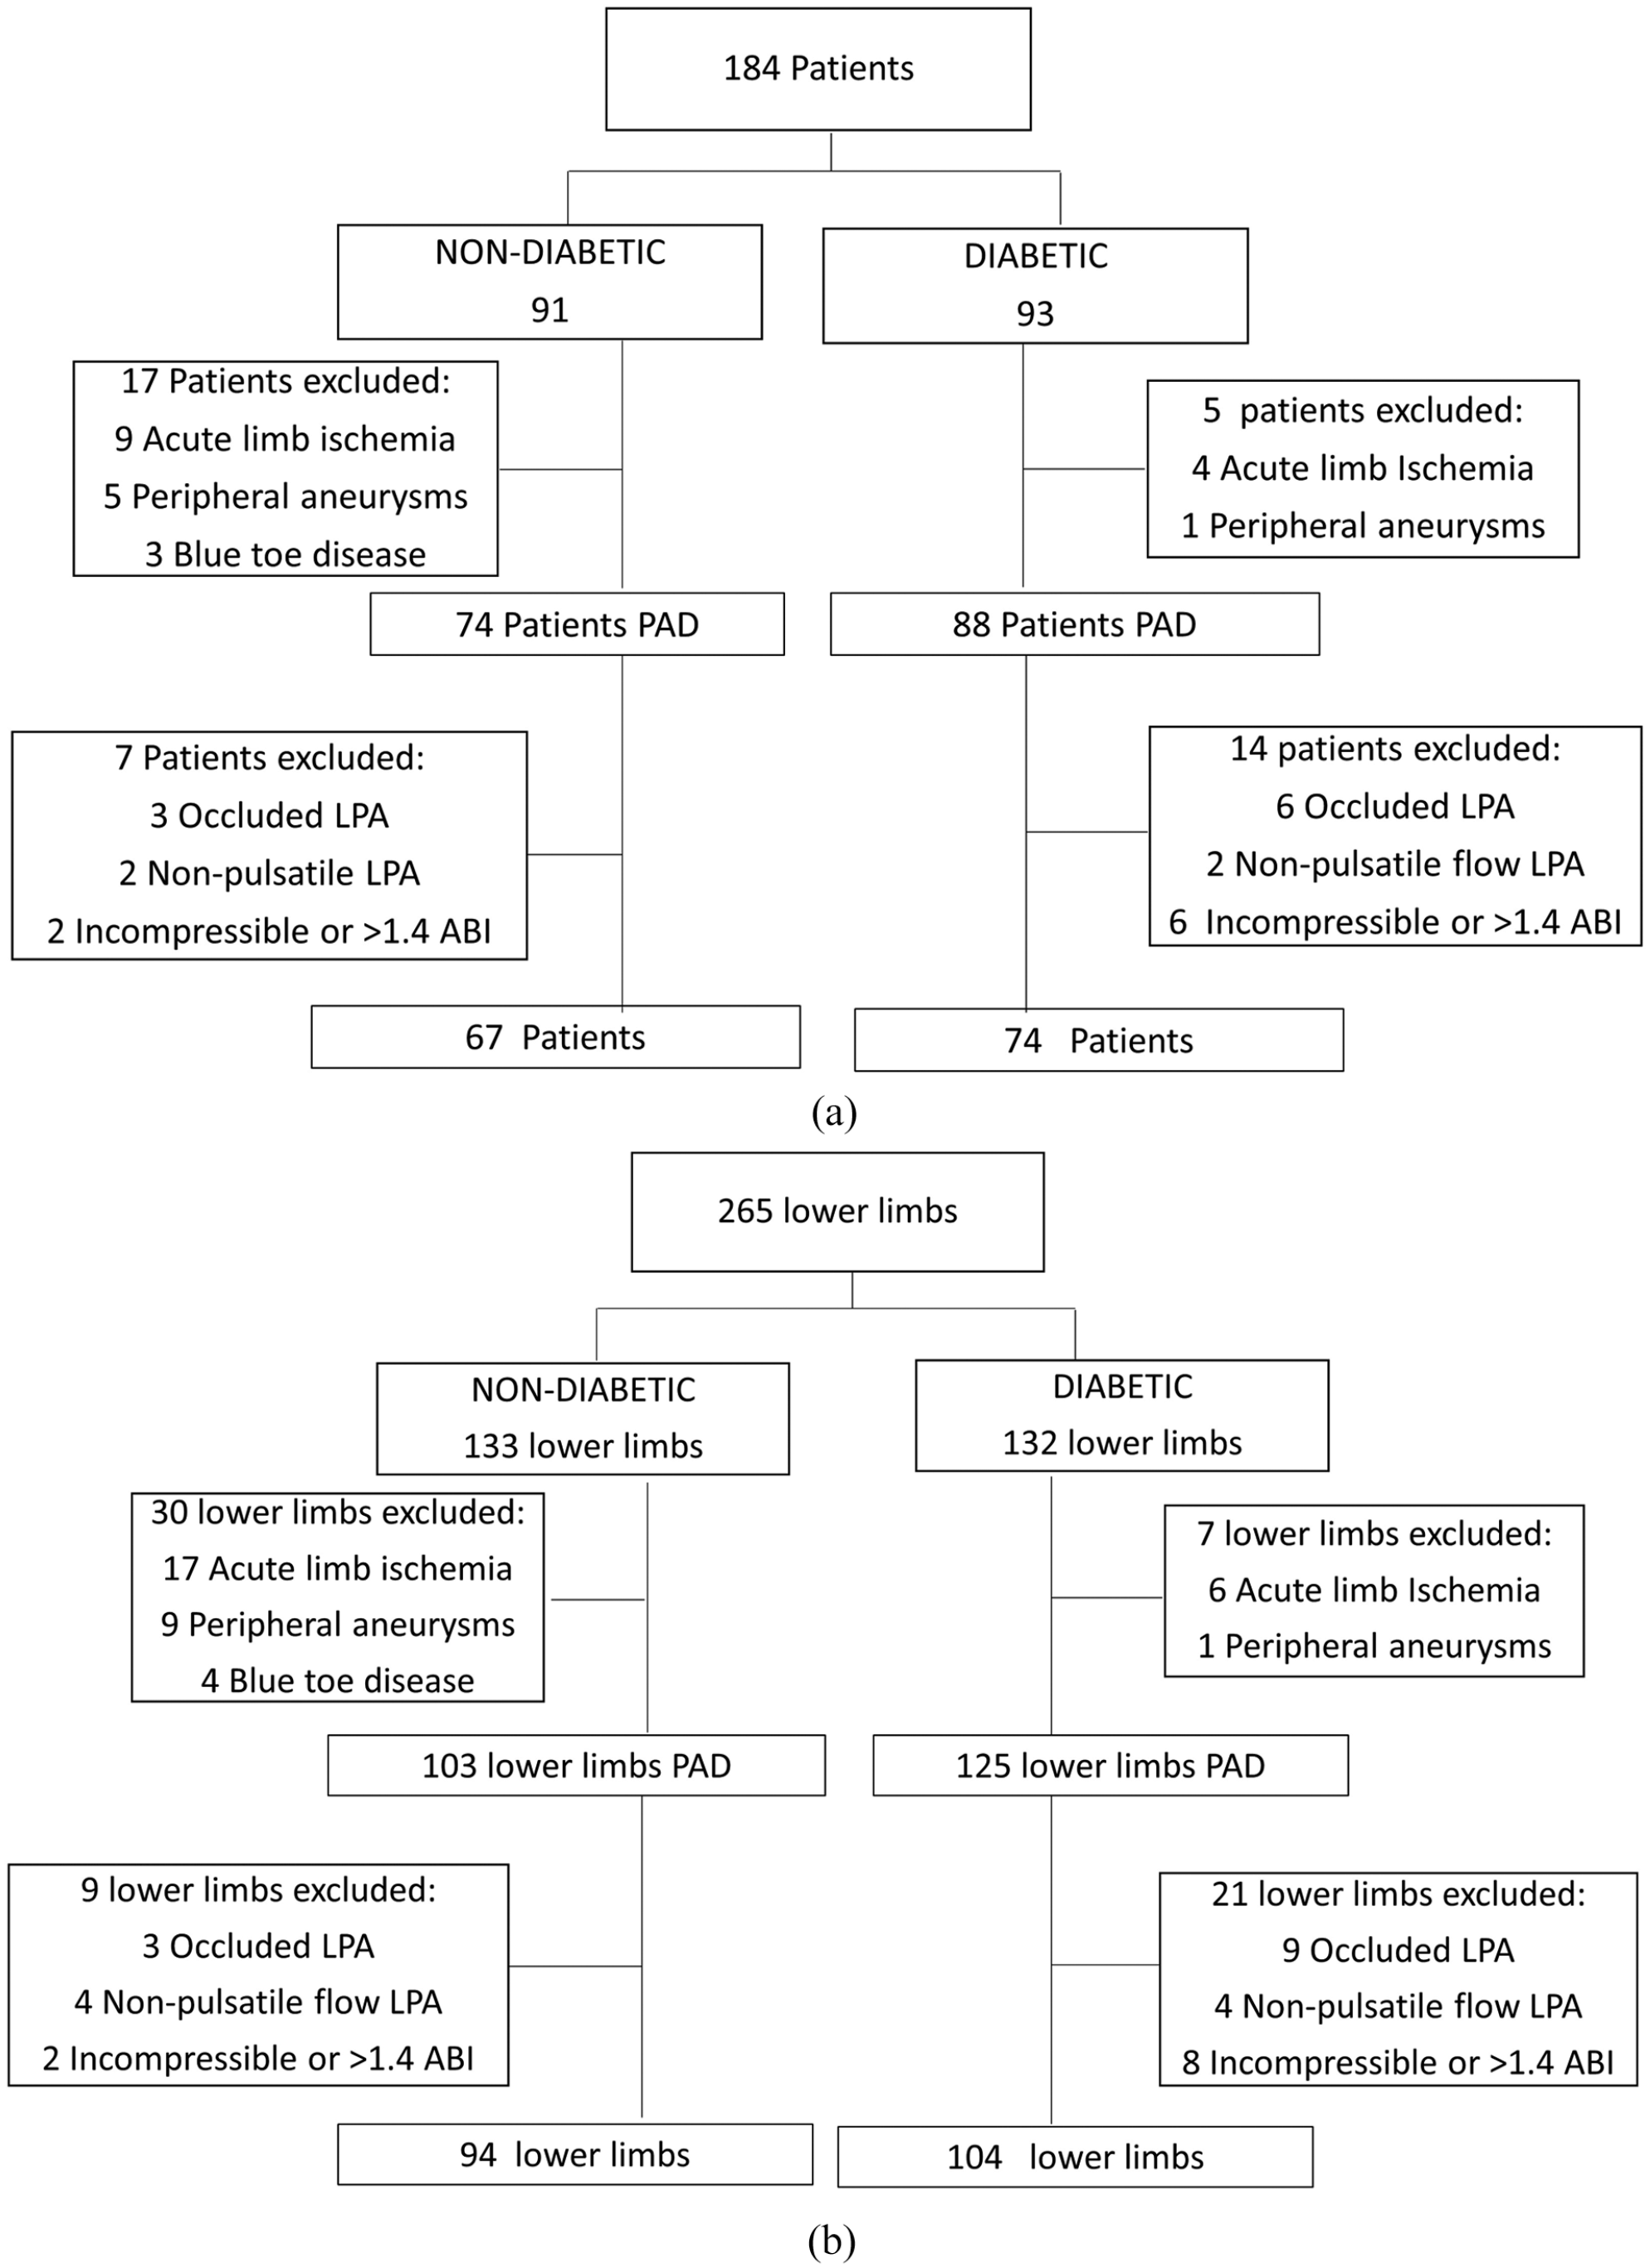
Study design, analyzed by both
Demographics, main risk factors, and comorbidities as well as the serum creatinine were analyzed in all 141 patients (Table 1). Patients with diabetes were younger and more likely to present coronary artery disease (RR 1.501; 95% CI 1.075–21.989). Women were older than men and men had a higher rate of smoking (RR 1.567; 95% CI 1.090–2.251) compared to women (Table 1).
Demographics, risk factors, and comorbidities in 141 patients with and without diabetes with peripheral artery disease.
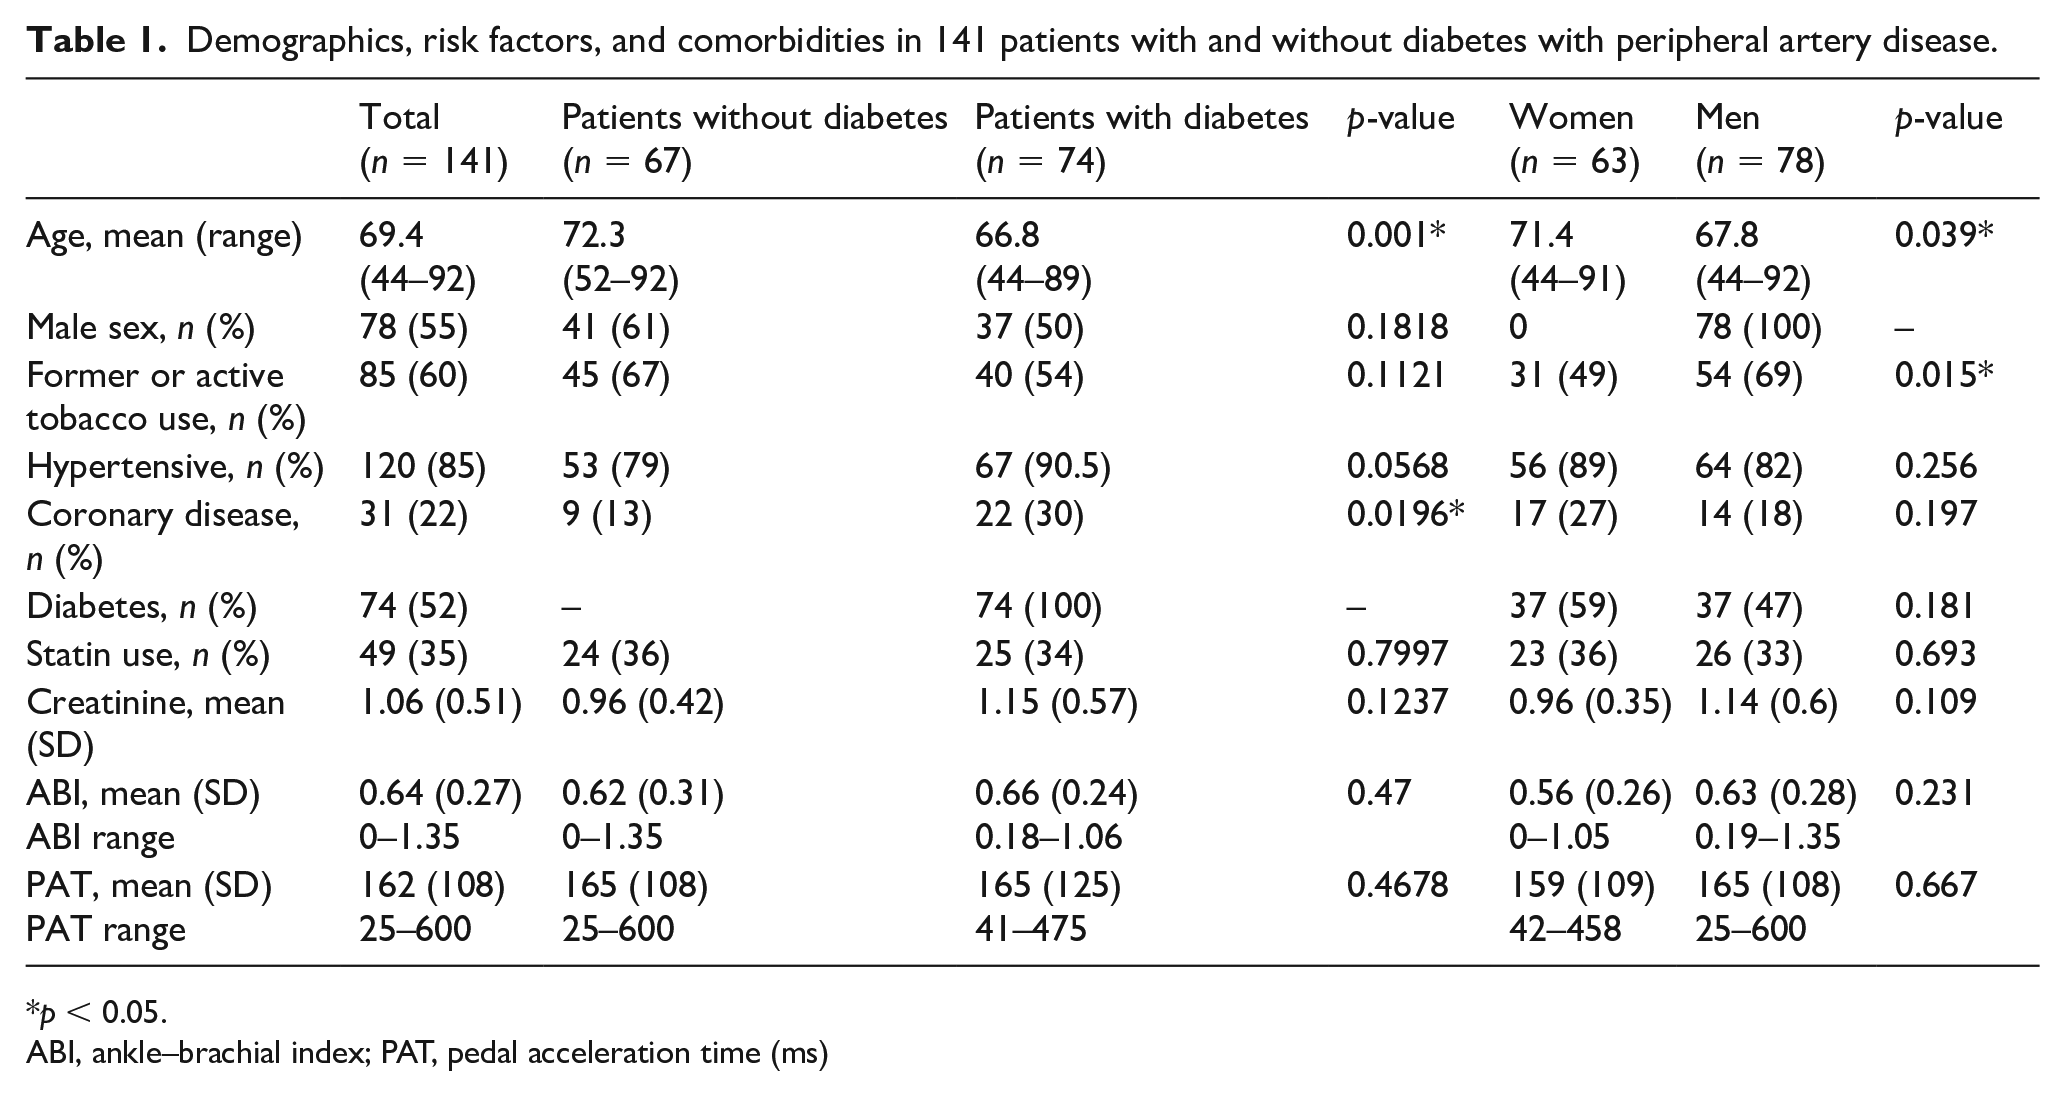
p < 0.05.
ABI, ankle–brachial index; PAT, pedal acceleration time (ms)
Since the relationship between the ABI and PAT has been previously reported in patients without diabetes, we determined this relationship including patients both without and with diabetes. Since the Shapiro–Wilk test showed nonparametric distribution of both the ABI (p = 0.0239, nondiabetic; p = 0.0026, diabetic) and PAT (p < 0.0001, nondiabetic; p < 0.0001, diabetic), the Spearman model was used to determine correlation. The Spearman coefficient (ρ) between PAT and ABI in patients without diabetes was −0.8071 (95% CI −0.8693 to −0.7198; p < 0.001); in patients with diabetes it was −0.8016 (95% CI −0.8627 to −0.7174; p < 0.001); in men it was −0.8133 (95% CI −0.8693 to −0.7368; p < 0.001) and in women it was −0.7611 (95% CI −0.8397 to −0.6511; p < 0.01). These data show a strong inverse correlation between ABI and PAT, stratified by either diabetes or by sex (Figure 4); that is, the lower the ABI, the higher the acceleration time, and vice-versa.
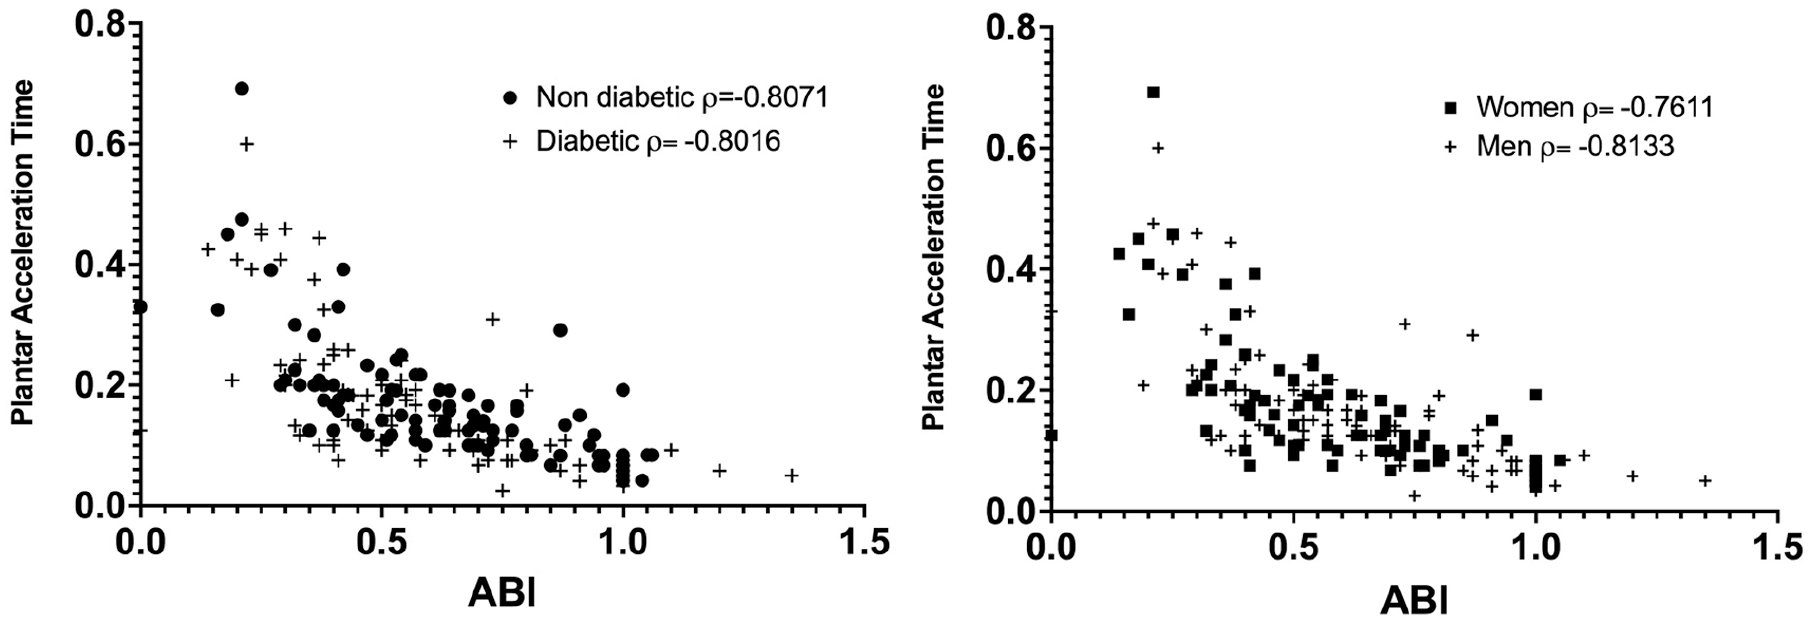
Correlation between pedal acceleration time and ankle–brachial index (ABI).
Wounds
Sixty-four percent of patients with diabetes and 53% of patients without diabetes had foot ulcers (W classification 1, 2, and 3; p = 0.018); 58% of men and 63% of women (W classification 1, 2, and 3; p = 0.730) presented with foot ulcers. The severity of wounds did not differ between groups. Only 15% of the lower limbs in patients with diabetes were at low risk of amputation compared to 29% in patients without diabetes (p = 0.0642); similarly, 24% of the lower limbs in patients with diabetes were at high risk of amputation compared to 15% in patients without diabetes (p > 0.99; Table 2). Regarding sex, 28% of the lower limbs in women were at low risk of amputation, compared to 17% in men (p = 0.02; Table 2). The stages of revascularization benefit did not differ significantly between patients with or without diabetes. Only 30% of the lower limbs in women were at very low benefit of revascularization, compared to 44% in men (p = 0.0407); similarly, in women, 25% of the lower limbs were at moderate risk of amputation compared to 11% in men (p = 0.0060; Table 2). These data suggest that women may be at higher risk for amputation compared to men among patients with CLTI.
Stages of amputation risk and revascularization benefit stratified by the WIfI classification system.
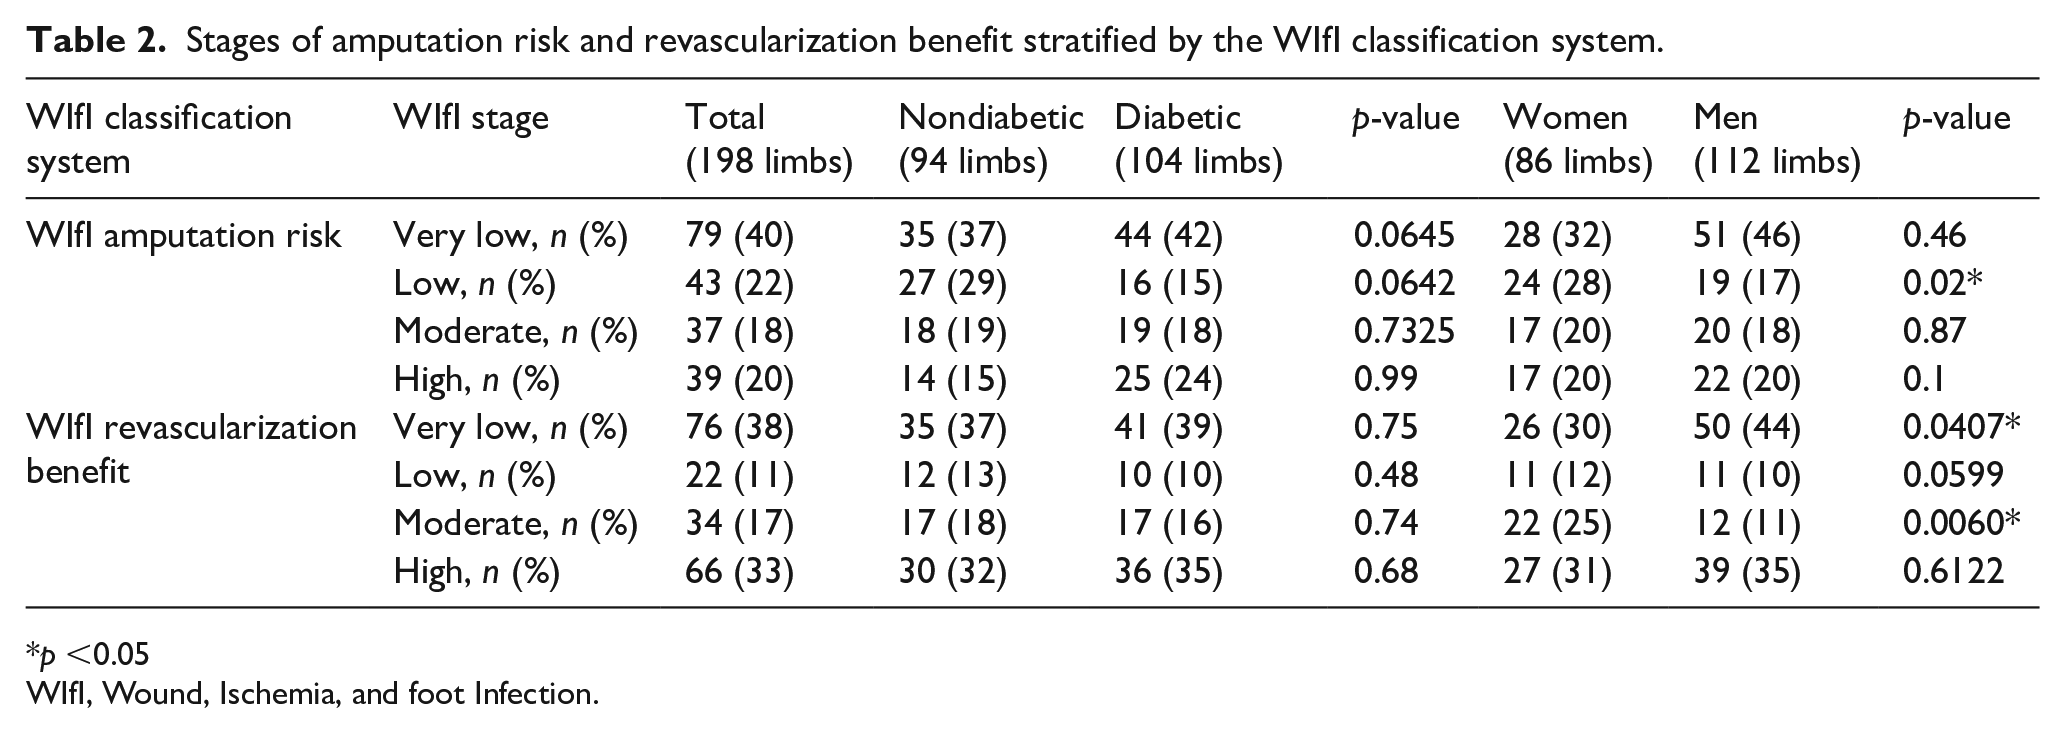
p <0.05
WIfI, Wound, Ischemia, and foot Infection.
Ischemic status of the limb and WIfI scores
The ABI is the standard tool to objectively confirm the diagnosis of PAD. 2 In order to estimate the sensitivity and specificity of PAT compared to ABI and the stages of amputation risk we used ROC curve analysis (Figure 5). The AUC was higher than 0.80 for ABI < 0.8, ABI < 0.6, and ABI < 0.4 for PAT, and moderate and high stages of amputation risk among patients both without and with diabetes.
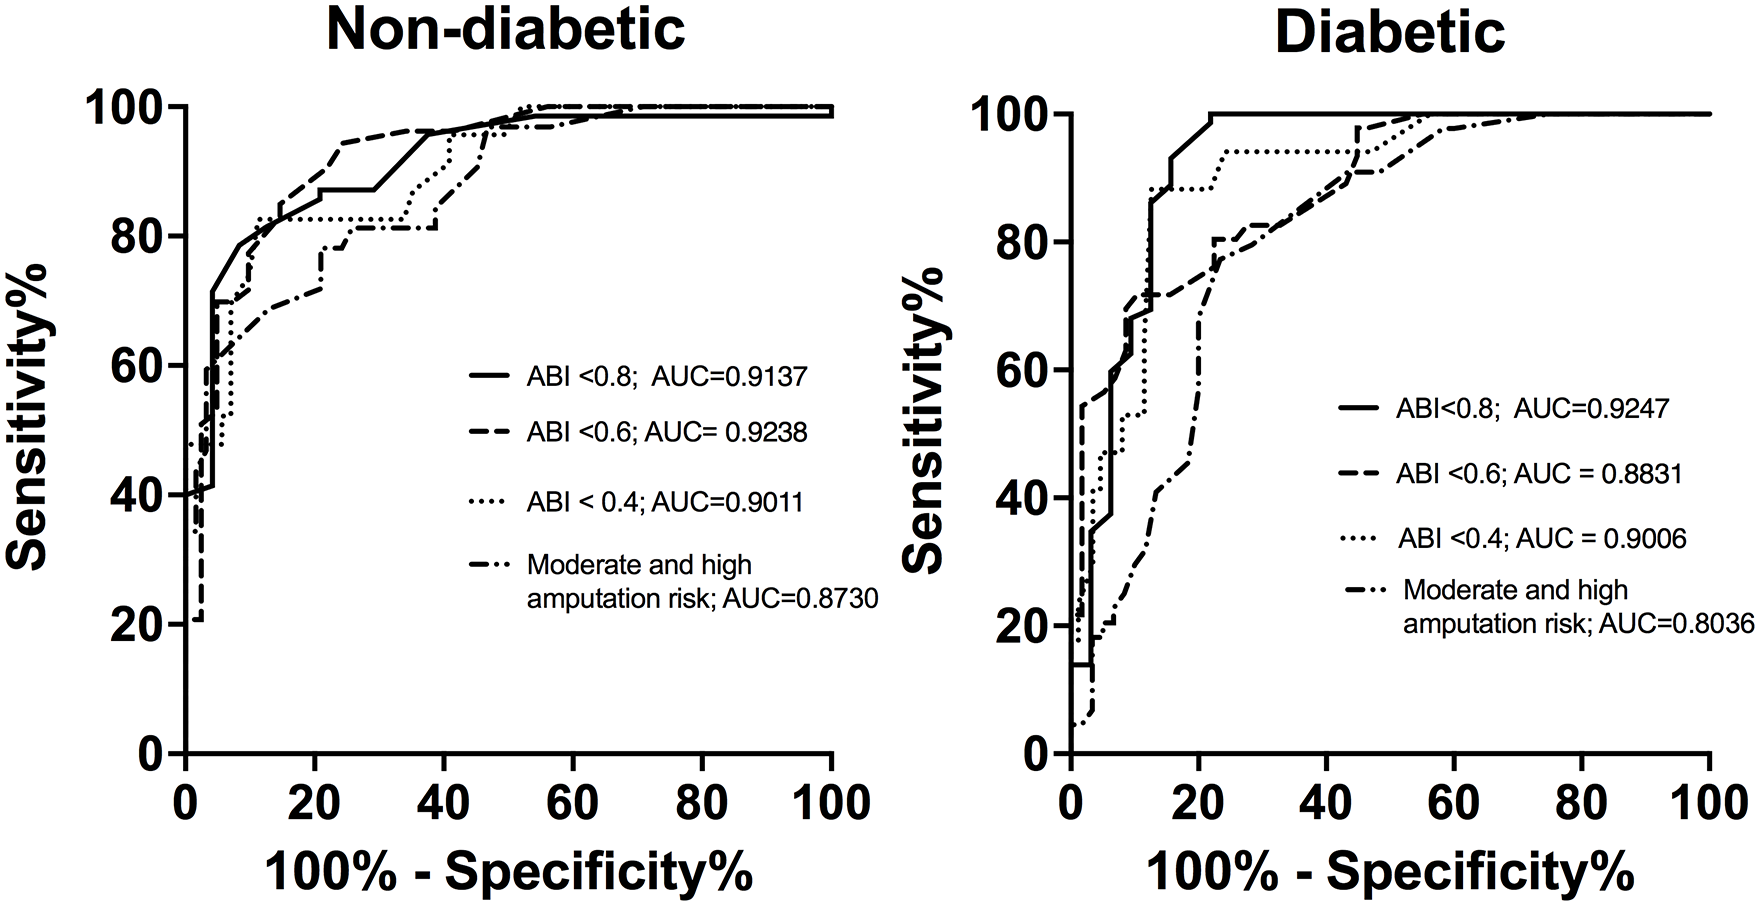
Receiver operator characteristic curves comparing pedal acceleration time in three different WIfI classification grades of ischemia and amputation risk.
In patients with diabetes, the AUC (0.8831) was lower compared to patients without diabetes (0.9238) to detect an ABI < 0.6. Similarly, the AUC was lower patients with diabetes (0.8036) compared to patients without diabetes (0.8730) to detect moderate and high stages of amputation risk. These data show that the accuracy of PAT is slightly but not significantly lower among patients with diabetes compared to patients without diabetes.
The PAT measurement values with the highest sensitivity and specificity were determined by the optimal cut-offs derived from ROC curves; the overall accuracy of PAT to detect an ABI < 0.8 was up to 91% in patients with diabetes and 85% in patients without diabetes (Table 3). Similarly, for an ABI < 0.6, we observed an accuracy of 79% in patients with diabetes and 85% in patients without diabetes. To detect an ABI < 0.4, the accuracy was 88% in patients with diabetes and 87% in patients without diabetes. These data suggest that PAT has increased sensitivity and specificity compared to ABI to identify lower-limb ischemia based on the four WIfI grades of ischemia. The values of PAT are slightly higher in patients with diabetes for an ABI < 0.8 and for an ABI < 0.6 compared to patients without diabetes, but similar among patients with an ABI < 0.4 (Table 3).
Sensitivity, specificity, positive predictive value, negative predictive value, and accuracy of pedal acceleration time stratified by WIfI grades of ischemia.
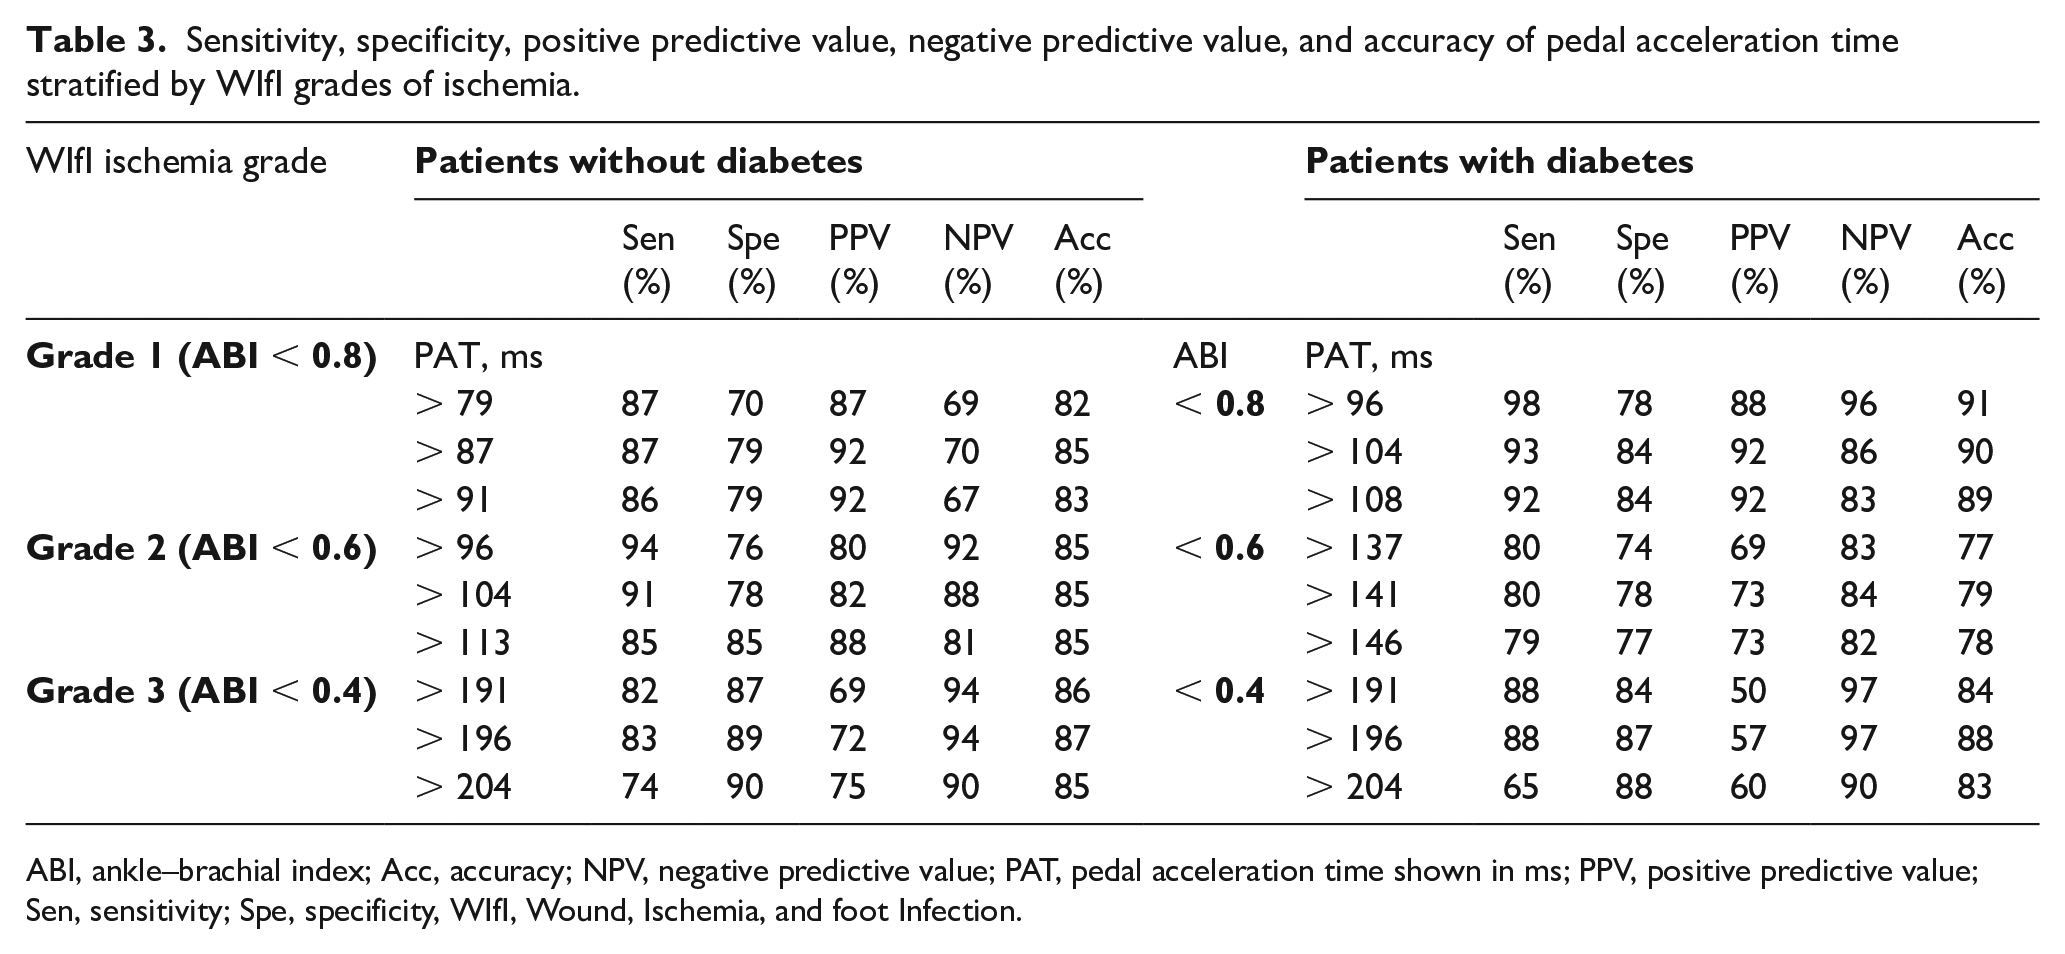
ABI, ankle–brachial index; Acc, accuracy; NPV, negative predictive value; PAT, pedal acceleration time shown in ms; PPV, positive predictive value; Sen, sensitivity; Spe, specificity, WIfI, Wound, Ischemia, and foot Infection.
Similarly, using three suggested optimal cut-offs, the accuracy of PAT to detect the WIfI stages of moderate and high amputation risk reached 77% among all patients (Table 4). Using data from the ROC curves, the suggested values of PAT to predict moderate and high amputation risk were slightly higher in patients without diabetes; however, the sensitivity, specificity, and accuracy were quite similar between patients with and without diabetes (Table 4). Overall, these data show that PAT accurately predicts both the ABI and the WIfI stage of amputation risk.
Sensitivity, specificity, positive predictive value, negative predictive value, and accuracy of plantar acceleration to predict WIfI moderate and high amputation risk.
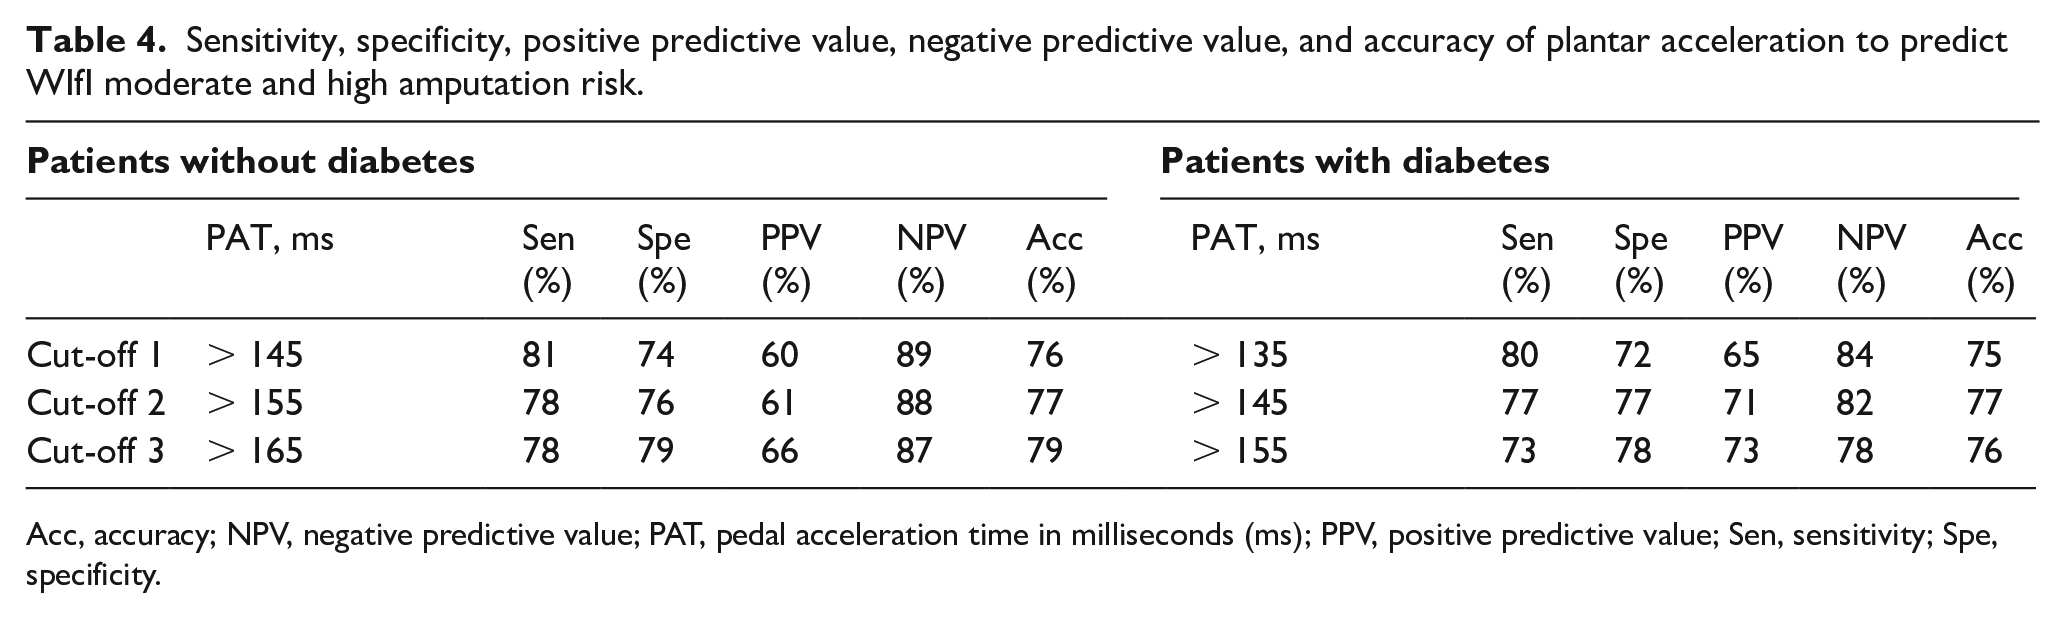
Acc, accuracy; NPV, negative predictive value; PAT, pedal acceleration time in milliseconds (ms); PPV, positive predictive value; Sen, sensitivity; Spe, specificity.
Discussion
Our data show that PAT can diagnose the four WIfI grades of limb ischemia with sensitivity of at least 80% and estimates the stage of amputation risk with sensitivity between 71% and 83%. In addition, PAT correlates with both the ABI and the WIfI classification system to accurately predict the stage and amputation risk with high sensitivity, specificity, and accuracy in patients with and without diabetes. Thus, PAT may be a useful diagnostic tool available at the bedside to accurately stage CLTI in patients with and without diabetes, particularly those patients with obesity, edema, extensive limb dressings, external orthopedic devices, or arterial medial calcification.
Since PAT was described in 2019, several studies have been reported. 7 Sommerset et al. described PAT using all four pedal arteries. 10 Teso et al. used PAT to predict limb salvage in patients with diabetes with noncompressible ABI after revascularization; however, differences in PAT between pedal arteries were not the objective of this study, whereas attention was paid to evaluate visualized vessels leading to the wound bed, directed by angiosomes. 11 However, the sensitivity, specificity, accuracy, positive predictive value, and negative predictive values of PAT were not reported.7,11 Although PAT can be measured in all four arteries, in our study we analyzed only the lateral plantar artery to be uniform and consistent. Other derived ultrasound Doppler measurements, such as the tibial artery peak systolic velocity described by Moneta et al., can be used in highly calcified vessels and is of particular value in the evaluation of patients with incompressible tibial arteries producing a falsely elevated ABI. 16 Wilson et al. described the use of the tibial artery peak systolic velocity to compare pre- and postrevascularization status in patients with ischemic limbs and control patients and suggested that duplex ultrasound-derived tibial artery velocities could be used to determine the hemodynamic success of above-knee endovascular interventions. 17 Tongeren et al. reported a linear relationship between the Doppler-derived maximal systolic acceleration of the dorsal artery of the foot and the ABI in patients with and without diabetes; they showed 90% accuracy with Doppler-derived maximal systolic acceleration < 6.45 m/s2 to diagnose an ABI < 0.9 and used this as a screening tool. 18 These reports show a relationship between ultrasound Doppler-derived measures and limb ischemia; however, they did not report correlation of these measures with WIfI grades and stages.
The ABI is recommended as the first-line noninvasive hemodynamic test in all patients with suspected CLTI. In patients with a noncompressible ABI or dampened, monophasic waveforms, the TCPO2, toe–brachial index (TBI) or other hemodynamic measurements should be obtained. 1 In our study, patients with an ABI > 1.4 were excluded. Our PAT values were slightly different to those described by Sommerset et al., 7 likely due to the high number of patients with diabetes in our study and the differences in limb ischemia classification systems, as we used the SVS-WIfI classification and Sommerset used the Rutherford classification.
We show the correlation between PAT and ABI as well as the accuracy of PAT to diagnose limb ischemia based on WIfI classification scores (Figure 1, Table 3). Using ROC curve analysis, PAT showed slightly lower sensitivity, specificity, and accuracy in patients with diabetes to detect WIfI ischemia grade 2 (ABI < 0.6) compared to grade 1 (ABI < 0.8) and grade 3 (ABI < 0.4). The PAT optimal cut-off value > 96 ms showed 98% sensitivity to detect an ABI < 0.8, suggesting that 98% of patients with an ABI < 0.8 would be properly diagnosed with PAT. However, if the PAT optimal cut-off value of > 204 ms were used to detect WIfI ischemia grade 3 (ABI < 0.4), a specificity of 88% was achieved, suggesting that 88% of patients with an ABI ⩾ 0.4 would be properly excluded for severe PAD. High specificity values are important since the diagnosis of PAD can lead to invasive diagnostic and therapeutic actions that are associated with complications and the ability to impact quality of life and functional status. In patients without diabetes, PAT estimates the ABI with an accuracy higher than 83% for WIfI grades of ischemia 1 to 3; the WIfI classification may be incomplete due to nonaccurate grading of the ischemia in patients with large foot or leg ulcers, obesity, edema, extensive limb dressings, and orthopedic devices. Since alternative tools such as toe pressure and TPO2 are not universally available, PAT may be used to estimate the benefit of revascularization and the risk of amputation.
PAT estimates the ABI (Figure 6) and thus may help clinical decision-making as well as aid in follow-up after revascularization. We believe that PAT should not replace the ABI, but rather PAT provides a useful tool to assist in situations in which the ABI cannot be accurately measured, such as patients with large foot or leg ulcers, obesity, edema, extensive limb dressings, and orthopedic devices.
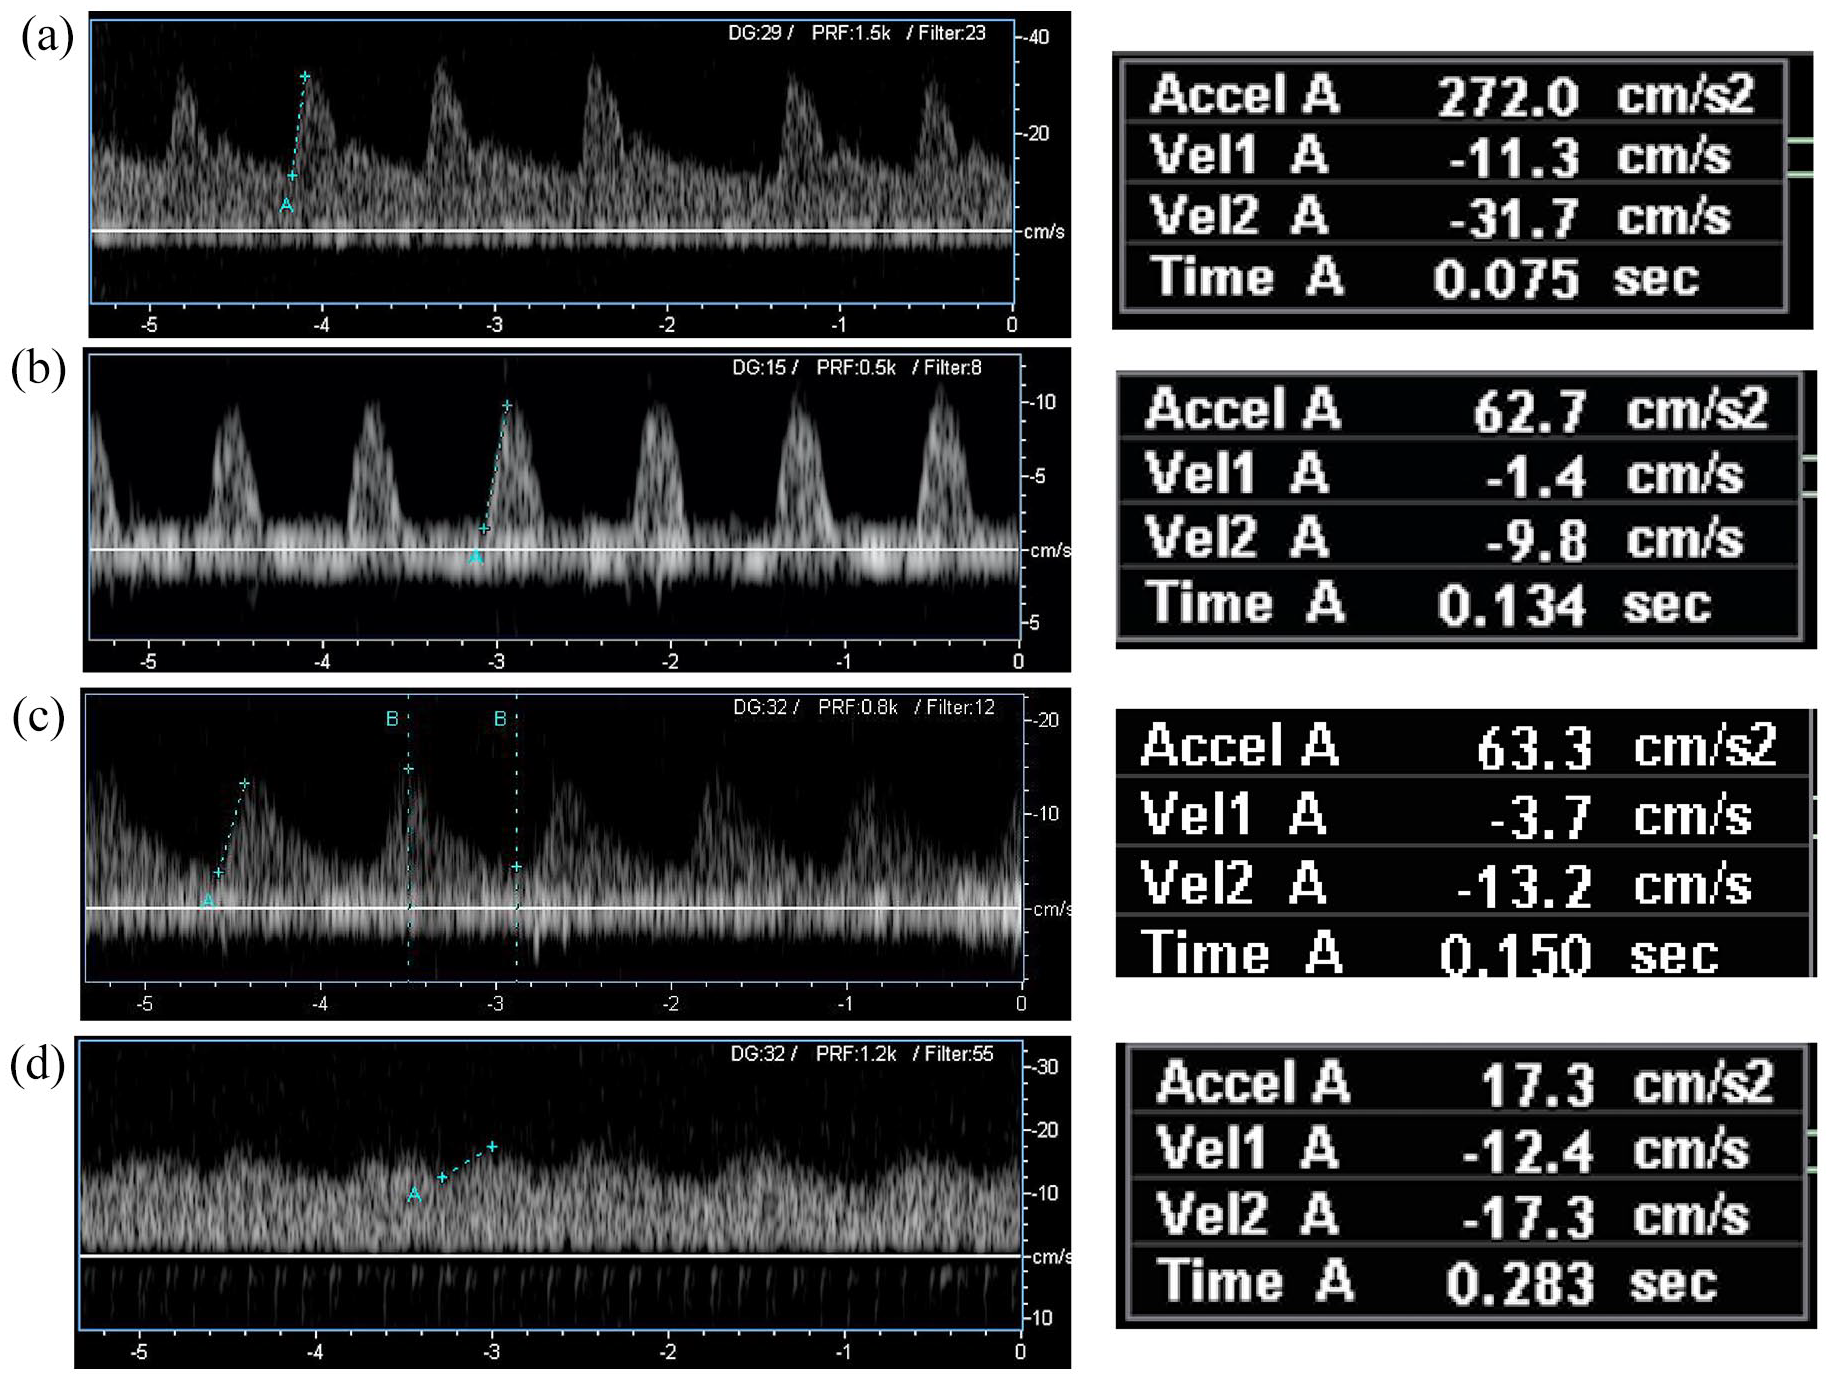
Examples of WIfI grades of ischemia using PAT spectral waveforms in patients with diabetes.
Study limitations
The major limitation of our data is that it is derived from a cross-section, single-center analysis, and therefore may have selection bias as well as lack of applicability to other centers, and thus requires external validation. Future studies should also assess the ability of PAT to predict the success of revascularization as well as estimate cardiovascular mortality risk and survival; since the ABI correlates with both amputation and mortality risks, it is possible that PAT also has a similar prognostic value. 12 In addition, the correlation of PAT with outcomes in patients with an incompressible ABI or high ankle pressures needs additional study.
Conclusion
PAT shows a high correlation with ABI, WIfI stages of amputation risk, and grades of ischemia with high sensitivity, specificity, and accuracy. PAT is an alternative objective measurement to assess limb perfusion in patients with and without diabetes with CLTI.
Footnotes
Declaration of conflicting interests
The authors declared no potential conflicts of interest with respect to the research, authorship, and/or publication of this article.
Funding
The authors received no financial support for the research, authorship, and/or publication of this article.