
Abstract
Positive relationships between volume and outcome have been seen in several surgical and medical conditions, resulting in more centralized and specialized care structures. Currently, there is a scarcity of literature involving the volume–outcome relationship in pulmonary embolism (PE). Using a state-wide dataset that encapsulates all non-federal admissions in New York State, we performed a retrospective cohort study on admitted patients with a diagnosis of PE. A total of 70,443 cases were separated into volume groups stratified by hospital quartile. Continuous and categorical variables were compared between cohorts. Multivariable regression analysis was conducted to assess predictors of 1-year mortality, 30-day all-cause readmission, 30-day PE-related readmission, length of stay, and total charges. Of the 205 facilities that were included, 128 (62%) were labeled low volume, 39 (19%) medium volume, 23 (11%) high volume, and 15 (7%) very high volume. Multivariable analysis showed that very high volume was associated with decreased 30-day PE-related readmission (OR 0.64; 95% CI, 0.55 to 0.73), decreased 30-day all-cause readmission (OR 0.84; 95% CI, 0.79 to 0.89), decreased 1-year mortality (OR 0.85; 95% CI, 0.80 to 0.91), decreased total charges (OR 0.96; 95% CI, 0.94 to 0.98), and decreased length of stay (OR 0.94; 95% CI, 0.92 to 0.96). In summary, facilities with higher volumes of acute PE were found to have less 30-day PE-related readmissions, less all-cause readmissions, shorter length of stay, decreased 1-year mortality, and decreased total charges.
Introduction
A growing body of research has delineated the benefits of higher volume on patient outcomes for certain medical diagnoses and surgical procedures. The positive association between volume and outcome of several conditions not requiring surgery, such as stroke, myocardial infarction, AIDS, congestive heart failure (CHF), and coronary artery disease (CAD), have been found to be significant.1–6 A prior study found that diabetic patients treated in facilities with higher overall volumes were associated with increased likelihood of both hemoglobin A1c testing and hemoglobin A1c levels less than 7%. Similarly, hospitals with a higher volume of CHF admissions had a lower mortality rate and a lower readmission rate. 4 Several reasons for these relationships have been proffered, including better staff experience, subspecialty services, enhanced peri-clinical services, selective referral, compliance with medication, and improved patient education. With respect to procedural volume, numerous studies have demonstrated an association between higher facility volume and reduced mortality, length of stay, complication rates, and readmission rates.7–16 Recognizing the importance of this relationship, several organizations, such as the National Cancer Policy Board of the Institute of Medicine and The Leapfrog Group, have issued recommendations and supported initiatives promoting centralization towards high-volume hospitals.17,18
Studies continue to monitor and assess growing trends in centralization within several fields across the United States. This tendency towards centralization is often bolstered by new technologies that require significant capital investments only select facilities can make. 19 Another contributing trend is the emergence of the Center of Excellence model, seen most remarkably in bariatric surgery and stroke care, in which organizations accredit facilities that meet rigid requirements.14,20
In other countries, recognition of the volume–outcome relationship has resulted in coordinated government-driven efforts towards centralized and specialized care structures. In Germany, mandatory minimums were introduced at the facility level for defined surgical procedures. To date, these include six types of surgical procedure: (1) complex esophageal interventions; (2) complex pancreatic interventions; (3) total knee replacement; and transplantations of (4) kidney, (5) liver, and (6) stem cells.21,22 The effects of such organized centralization strategies across Europe and Japan are the subject of ongoing study.
Acute pulmonary embolism (PE) is a common and sometimes fatal disease with a highly variable presentation. Estimates of the incidence of PEs have changed with improving diagnostic modalities, with one study finding the incidence of PE to have risen from 62 cases per 100,000 in the 5-year period before 1998 to 112 cases per 100,000 in the 7 years after 1998. 23 Estimates of mortality have similarly been influenced by changes in diagnostic modalities and evolving treatments. 23 Additionally, many causes of unexplained syncope and sudden cardiac death are thought to be secondary to PE. 24 According to one study, PE accounts for approximately 100,000 annual deaths in the United States. 25 Sparse previous studies have found decreasing mortality but not length of stay in relation to higher volume at the facility level. 26 This volume–outcome relationship may be explained by differential access to diagnostic equipment, staff experience, intensive care capabilities, and access to advanced PE therapies such as systemic thrombolysis, catheter-based embolectomy, catheter-directed thrombolysis, and advanced surgical techniques. Additionally, the development of multidisciplinary and accelerated protocols in evaluating and treating patients with acute PE, such as the Pulmonary Embolism Response Team (PERT), may also contribute to the volume–outcome relationship. 27 There is a scarcity of studies that analyze the volume–outcome relationship of hospitals in the management of PE. This study aims to assess whether hospitals that care for large numbers of patients with PE have improved outcomes, including decreased length of stay, mortality, and readmission.
Methods
Database
This study was based on data from the Statewide Planning and Research Cooperative System (SPARCS). The SPARCS dataset is a New York State all payer database established in 1979 and compiled by the New York State Department of Health Office of Quality and Patient Safety. New York State law mandates the collection of certain data from all inpatient centers in the state of New York and all ambulatory, associated outpatient facilities, and emergency departments. The SPARCS database provides a unique opportunity to examine emergent cases of PE due both to its completeness and availability of patient identifiers that may link patient admissions. The SPARCS database includes information on patient characteristics such as age, race, ethnicity, sex, zip code, and insurance. Each encounter is also associated with a facility identifier, which allows the facility providing care to be identified. There is an additional field providing total charge, defined as the sum of all ancillary charges incurred by the patient during the billing period. The database is divided into two datasets based on level of care, either inpatient or outpatient.
Supplemental data were obtained by linking the SPARCS dataset with the American Hospital Association dataset in order to obtain hospital-level information, such as level of teaching affiliation as well as census data in order to match patients’ zip codes to median income in their area. Data on patient mortality was obtained from the New York State Death Registry.
Study sample
Prior to the commencement of this study, the study design was approved by the institutional review board of the Icahn School of Medicine at Mount Sinai. Using the SPARCS dataset, the study sample was collected from all admissions with discharge from January 1, 2009 to August 31, 2015 involving patients 18 years of age or older who were discharged with a diagnosis of PE (International Classification of Diseases, Ninth Revision (ICD-9) 415.1*, where * indicates all subcodes). To ensure PE was of primary relevance to the encounter, we included only those patients for whom PE was the primary diagnoses or in which PE was a secondary diagnosis alongside one of the following primary diagnoses, in order to ensure the most severe manifestations were identified: acute venous embolism and thrombosis (ICD-9 453.4*, 453.8*), acute respiratory failure (ICD-9 518.81), cardiogenic shock (ICD-9 785.51), cardiac arrest (427.5), secondary pulmonary hypertension (ICD-9 416.8), and syncope and collapse (ICD-9 780.2). Also included were patients with a secondary diagnosis of PE that required any of the following procedures: thrombolysis (ICD-9 99.10), intubation (ICD-9 96.04, 96.05), extracorporeal membrane oxygenation (ECMO) (ICD-9 39.65), implantation of heart and circulatory assist system (HCAS) (ICD-9 37.6*), or continuous mechanical ventilation (ICD-9 96.7). Patients diagnosed with HIV or AIDS were excluded from this study due to limitations in data provided for these patients. To ensure the most complex cases were included, which may involve elevation of care from smaller hospitals, transfers were connected and merged with the resultant encounter assigned to the facility involved in the incident encounter. Encounters that were found to be transferred from an encounter that did not meet the criteria listed above were excluded as these were likely cases where PE occurred within a hospital stay for a separate and potentially unrelated diagnosis. All-cause readmissions were determined by identifying subsequent encounters involving the patient from the incident encounter within a 30-day period subsequent to the discharge date associated with the incident encounter. Readmissions with principal or admitting diagnosis codes involving rehabilitation were excluded (V578.9, V571). PE-related readmissions were also identified using criteria identical to the above-described criteria for identifying cases involving PE.
In accordance with previously published studies, we categorized all 205 facilities into very high, high, medium, and low volume. 26 The facilities were ranked in order of increasing number of encounters involving PE, and the four groups were defined by selecting whole-number cut-off points for annual volume that most equitably divided the number of patients into four groups of equal size. Patient age was categorized into three groups: 18–64, 65–79, and ⩾ 80. Severity of illness was quantified using an ICD-9 adaptation of the Charlson Comorbidity Index (CCI). 28 The CCI has been shown to be discriminatory for predicting in-hospital and long-term outcomes following acute PE. 29 Independent variables considered in the analysis include patient race, patient sex, encounter source of payment, facility volume level, age category, patient comorbidities, and facility teaching affiliation.
The study outcomes were length of stay, 30-day all-cause readmission, 30-day PE-related readmission, 1-year all-cause mortality, and total charges.
Statistical analysis
Analysis was completed using R, version 3.2.3 (R Foundation for Statistical Computing, Vienna, Austria). Initial data exploration and data extraction were completed utilizing a purpose-built program. 30 Age and Charlson Comorbidity Index were presented with mean and SD, with bivariate analysis performed using a one-way analysis of variance (ANOVA). Other continuous variables were presented with median and associated IQR. Bivariate analysis of non-outcome continuous variables (facility volume and median income) was performed using the Kruskal–Wallis test. For continuous outcome variables (length of stay and total charges), Kendall’s correlation coefficient was used as a test of trend. Bivariate analysis of non-outcome categorical variables (patient race, patient sex, source of payment, facility volume level, age category, comorbidities, and teaching affiliation) was performed using a chi-squared test. For dichotomous outcome variables (1-year mortality, 30-day readmission, and 30-day PE-related readmission), a generalized Pearson chi-squared test for trend was used. Multivariable logistic regression was used to estimate associations between covariates and outcomes (30-day readmission, 30-day PE-related readmission, and 1-year mortality), while a multivariable linear regression was performed with logarithmic transformation to estimate proportional relationship between continuous outcome variables (length of stay and total charges) and hospital volume using low volume as the reference category.
Results
From the 126,288 encounters that were identified as involving a diagnosis of PE, 70,443 encounters remained in the final study cohort after the application of exclusion criteria and removal of records with missing data (Figure 1). A total of 13 encounters were excluded due to missing data, including absence of an objective discharge time and those with undetermined sex. PE was the primary diagnosis for 60,018 (85.2%) of the encounters. There were 205 facilities included in the study with diverse regional distributions and varying degrees of teaching affiliations (Table 1). Facilities were divided into quartiles of increasing case volume such that each quartile represented an approximately equivalent quantity of encounters. Variation in caseload led to variation in the number of facilities in each group, with 15 facilities categorized as very high and 128 as low. Very high-volume facilities (⩾ 148 cases/year) were more likely than low-volume facilities (< 52 cases/year) to have major teaching affiliations (60.0% vs 10.2%, p < 0.001), be located in a non-rural setting (0.0% vs 26.6%, p = 0.002), and have had a higher quantity of total beds (900 vs 186, p < 0.001). Very high-volume facilities were also more likely than low-volume facilities to have a higher mean CCI (2.09 vs 1.50, p < 0.001), a higher proportion of African American patients (20.2% vs 18.5%, p < 0.001), and payment involving primarily private insurance (47.2% vs 38.3%, p < 0.001). In analyzing the components of the CCI, we noticed increases in the proportion of encounters involving patients with histories of metastatic solid tumor (14.3% vs 7.4%, p < 0.001), renal disease (11.4% vs 8.8%, p < 0.001), and mild liver disease (4.3% vs 2.9%, p < 0.001) for very high-volume facilities when compared to low-volume facilities. Encounters were more likely to involve thrombolysis (5.5% vs 2.5%, p < 0.001), mechanical ventilation (17.4% vs 12.9%, p < 0.001), HCAS (0.4% vs 0.0%, p < 0.001), and ECMO (0.3% vs 0.0%, p < 0.001) at very high-volume hospitals as opposed to low-volume hospitals. Higher incidence of 1-year mortality (26.1% vs 21.7%, p < 0.001) and 30-day readmission (17.2% vs 16.8%, p = 0.03) was noted on bivariate analysis for very high-volume facilities over low-volume facilities; however, a lower incidence of 30-day PE-related readmission was seen (2.3% vs 3.5%, p < 0.001). Total charges were higher for very high-volume facilities when compared to low-volume facilities (p < 0.001). There was no significant trend found between facility volume and length of stay on bivariate analysis. Comparisons of other variables of interest, as well as data relating to other volume categories, are available in Tables 1 and 2.
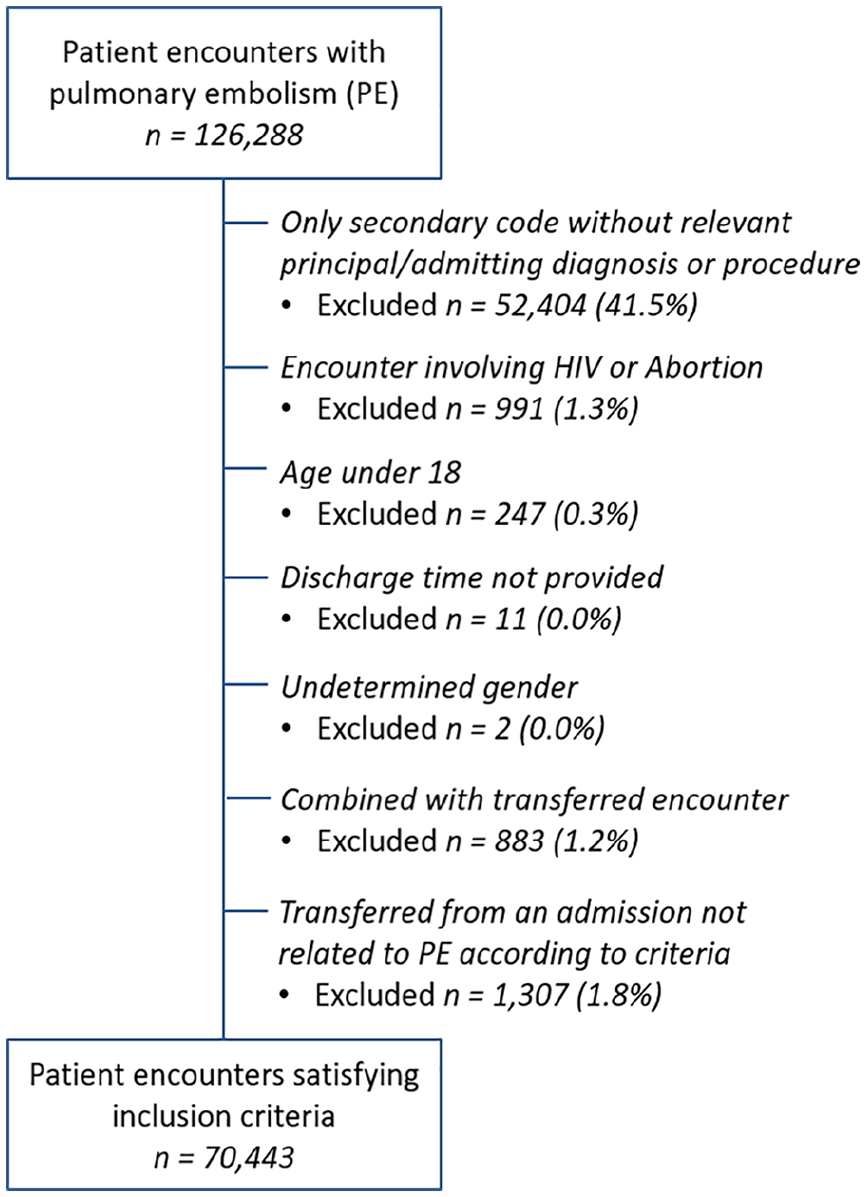
Construction of the study sample with inclusion and exclusion criteria.
Characteristics of facilities in the study sample.
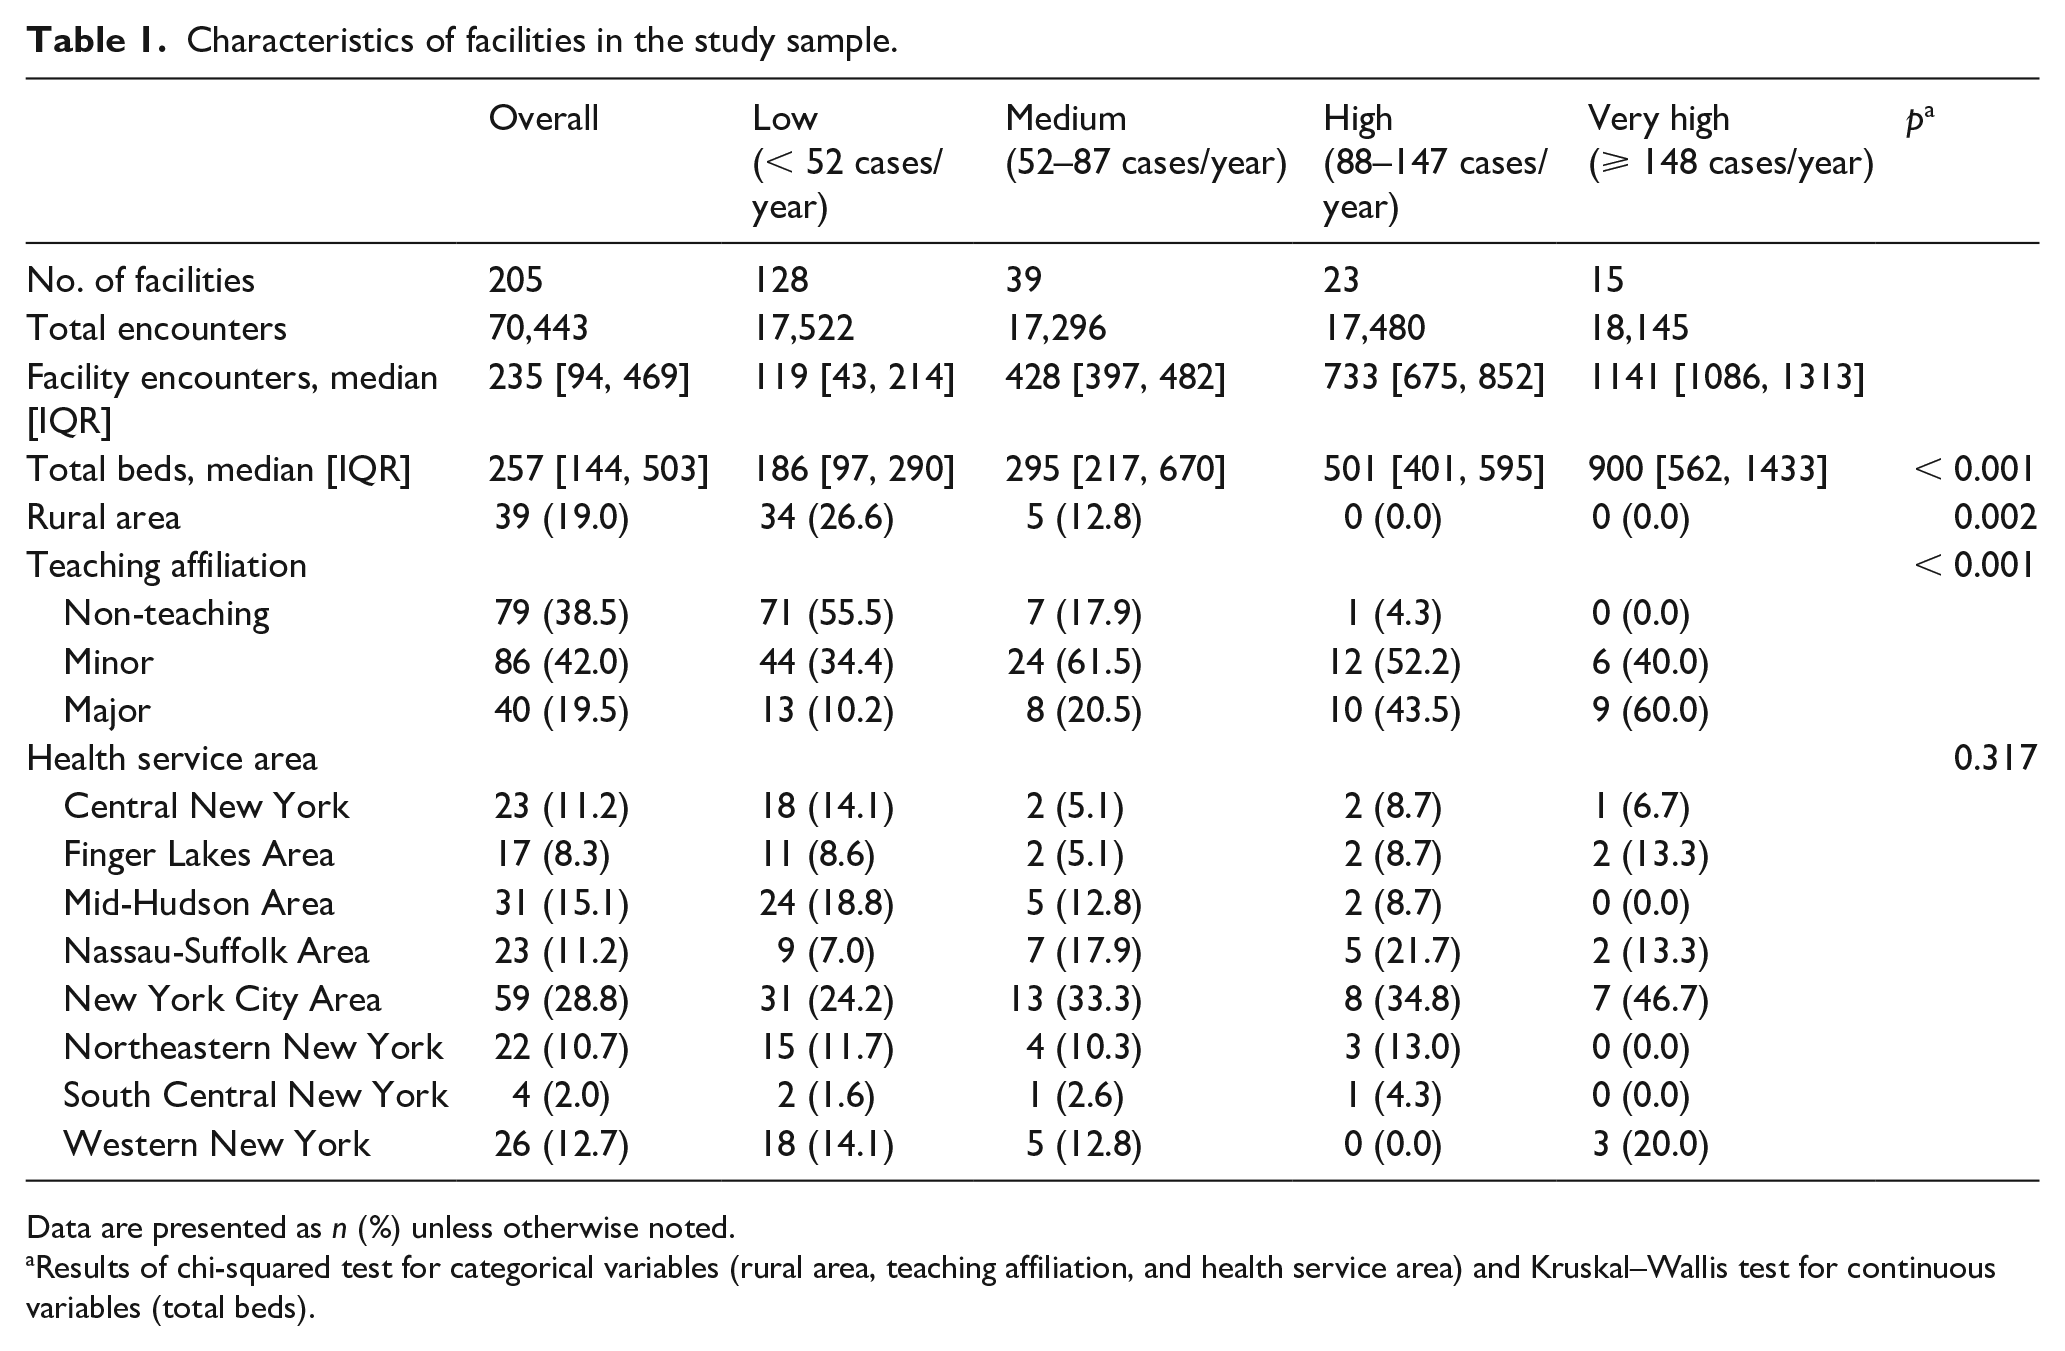
Data are presented as n (%) unless otherwise noted.
Results of chi-squared test for categorical variables (rural area, teaching affiliation, and health service area) and Kruskal–Wallis test for continuous variables (total beds).
Characteristics of patients in the study sample.
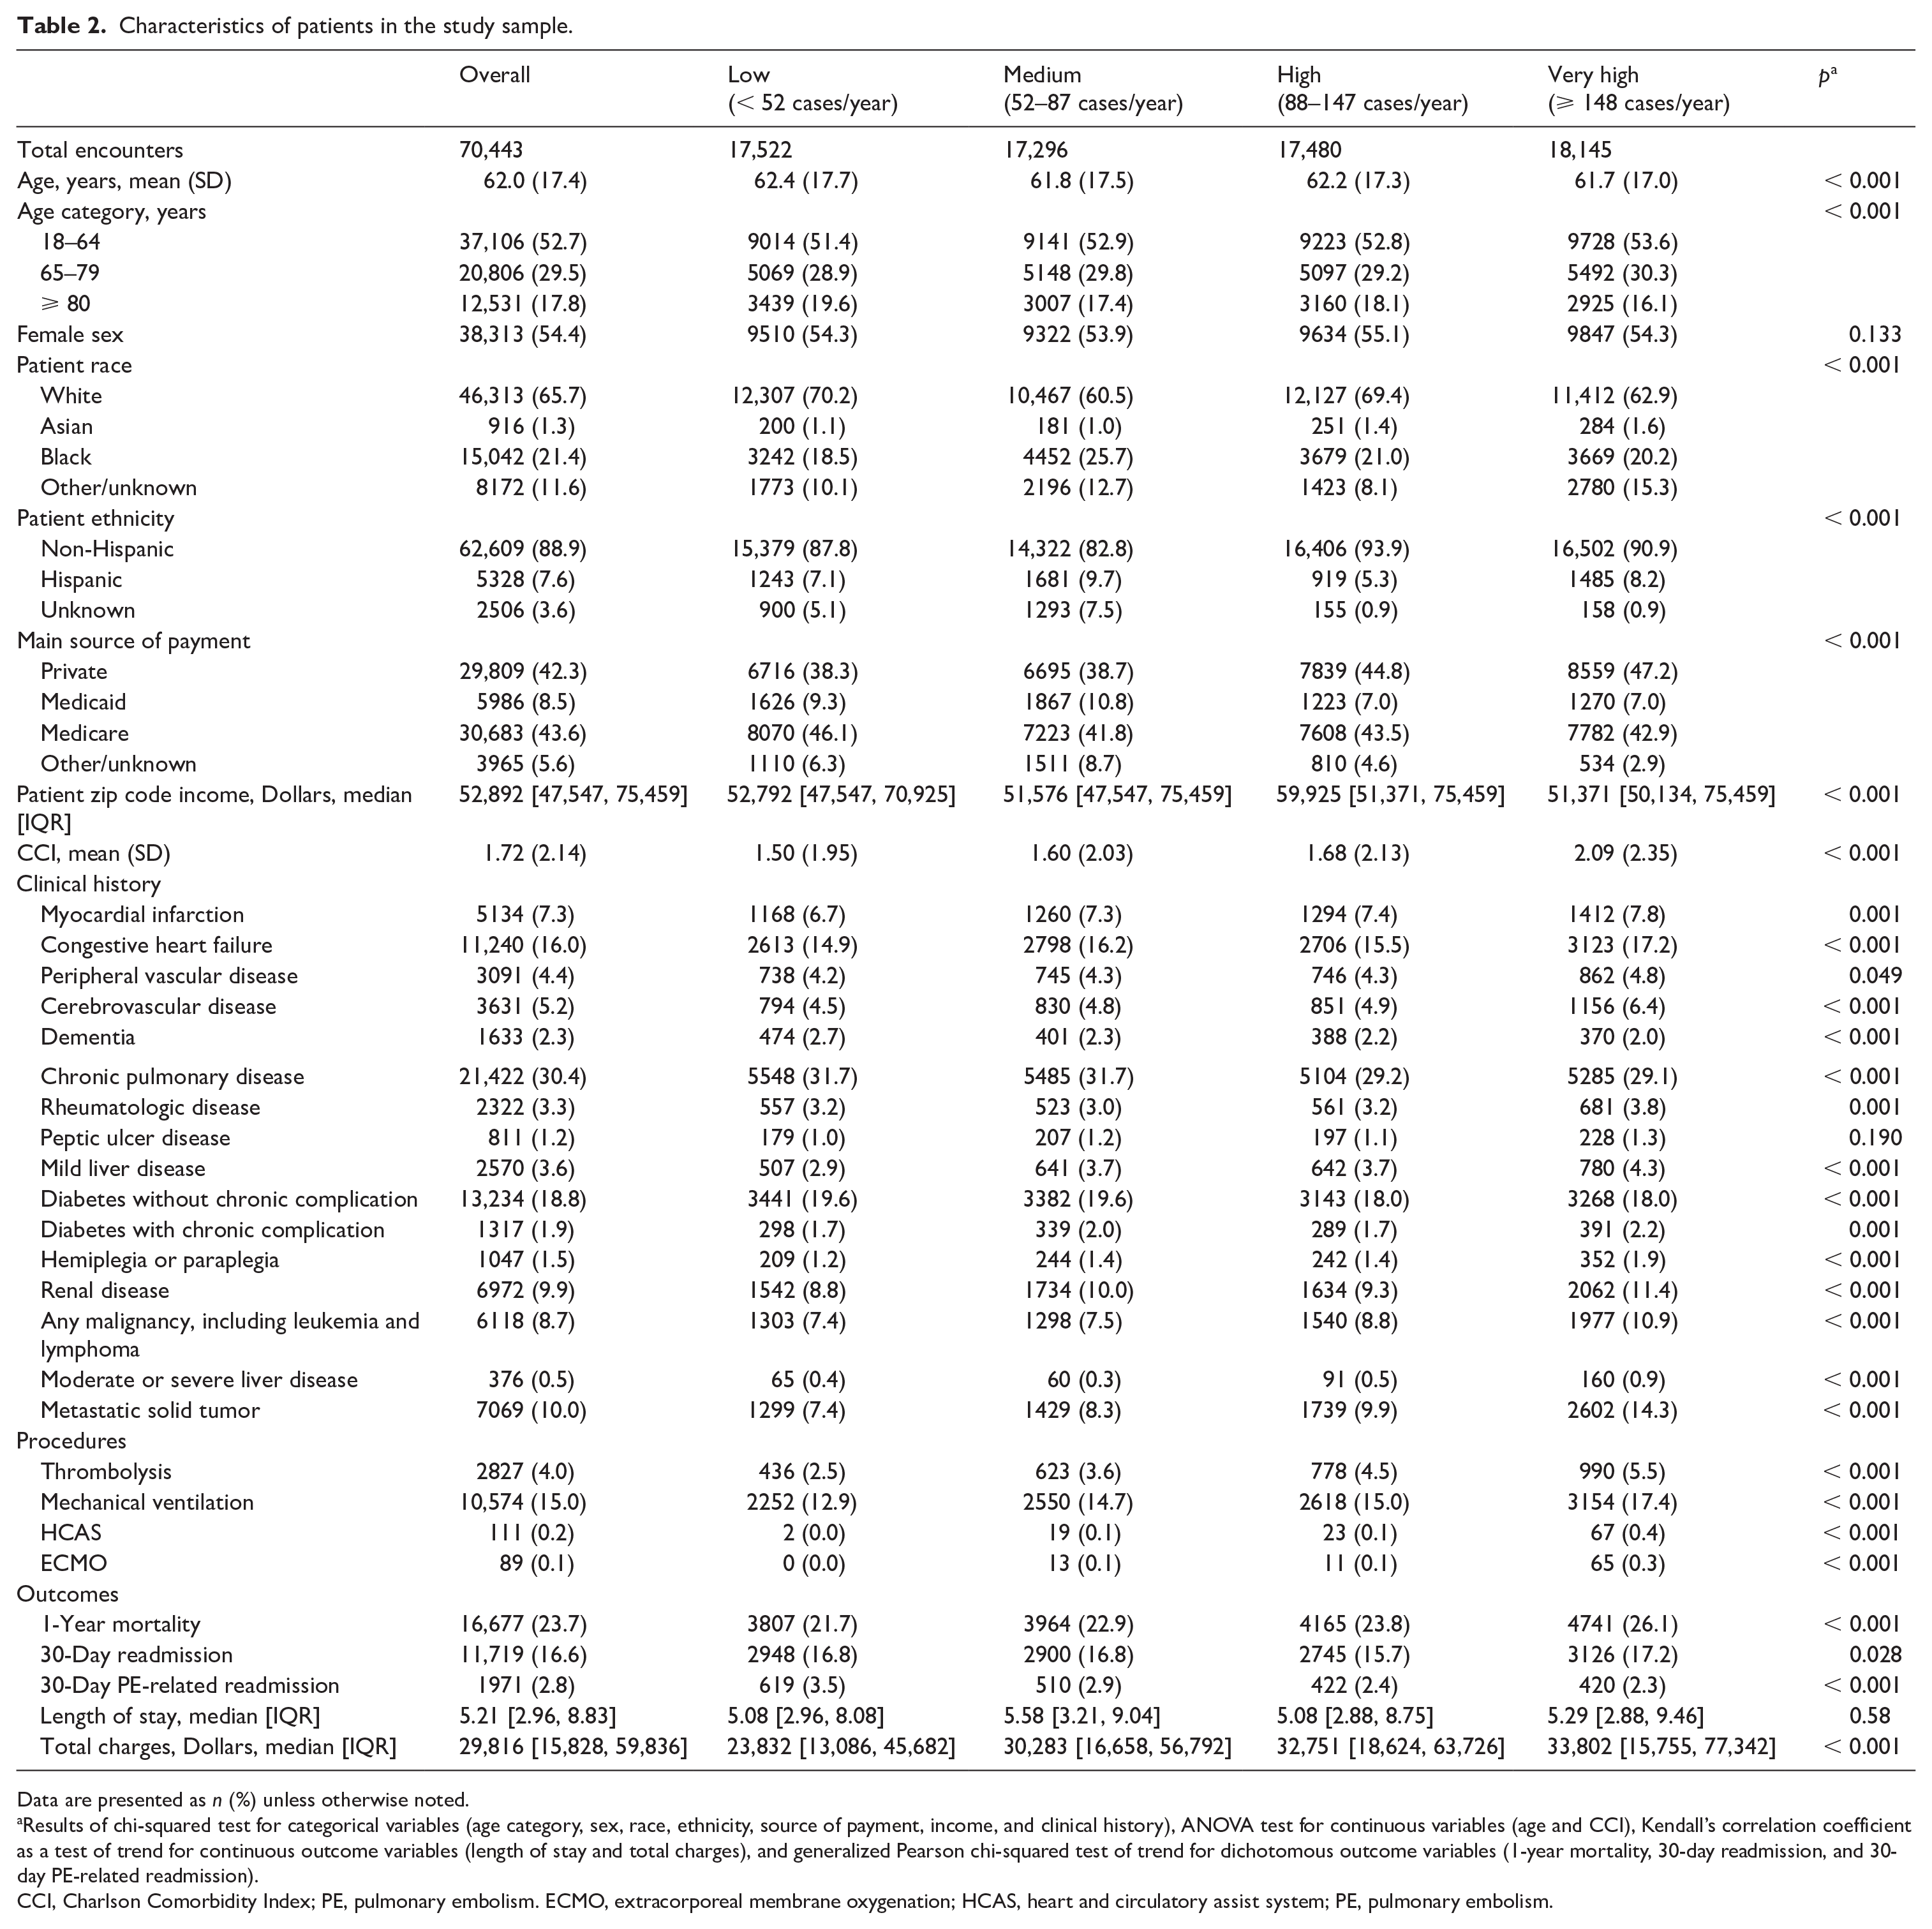
Data are presented as n (%) unless otherwise noted.
Results of chi-squared test for categorical variables (age category, sex, race, ethnicity, source of payment, income, and clinical history), ANOVA test for continuous variables (age and CCI), Kendall’s correlation coefficient as a test of trend for continuous outcome variables (length of stay and total charges), and generalized Pearson chi-squared test of trend for dichotomous outcome variables (1-year mortality, 30-day readmission, and 30-day PE-related readmission).
CCI, Charlson Comorbidity Index; PE, pulmonary embolism. ECMO, extracorporeal membrane oxygenation; HCAS, heart and circulatory assist system; PE, pulmonary embolism.
Using low-volume centers as a reference, there were significant differences in both unadjusted and adjusted odds ratios (OR) when relating facility volume to outcomes of interest. When unadjusted, very high-volume centers were associated with a higher incidence of 1-year mortality (OR 1.27; CI, 1.21 to 1.34), longer length of stay (1.10; 95% CI, 1.08 to 1.12), and higher total charges (1.47; 95% CI, 1.44 to 1.50) when compared to low-volume centers (see online Supplemental Tables 1 and 2). When adjusting for patient race, patient sex, major source of payment, facility volume level, patient age category, patient chronic conditions, and level of facility teaching affiliation, very high-volume centers were associated with 16% lower odds of 30-day all-cause readmission (OR 0.84; 95% CI, 0.79 to 0.89), 36% lower odds of 30-day PE-related readmission (OR 0.64; 95% CI, 0.55 to 0.73), and 15% lower odds of 1-year mortality (OR 0.85; 95% CI, 0.80 to 0.91) when compared to low-volume centers. Reductions in 30-day readmissions were also seen with high-volume centers (OR 0.83; 95% CI, 0.78 to 0.88) and to a lesser degree with medium-volume centers (OR 0.93; 95% CI, 0.88 to 0.99) when compared to low-volume centers. For 30-day PE-related readmission, a graded decline in OR can be seen from medium to high to very high-volume centers while still showing statistically significant associated lowered odds when compared to low-volume centers (Figure 2). There was no statistically significant association in mortality for high or medium-volume centers when compared to low-volume centers. Very high-volume centers were associated with 6% lower length of stay (R2 0.94; 95% CI, 0.92 to 0.96) and 4% lower total charges (R2 0.96; 95% CI, 0.94 to 0.98) when compared to low-volume centers (Figure 3). In contrast, high and medium-volume centers were associated with a 5% (R2 1.05; 95% CI, 1.03 to 1.08) and 11% (R2 1.11; 95% CI, 1.09 to 1.13) increase in total charges when compared to low-volume centers, respectively.
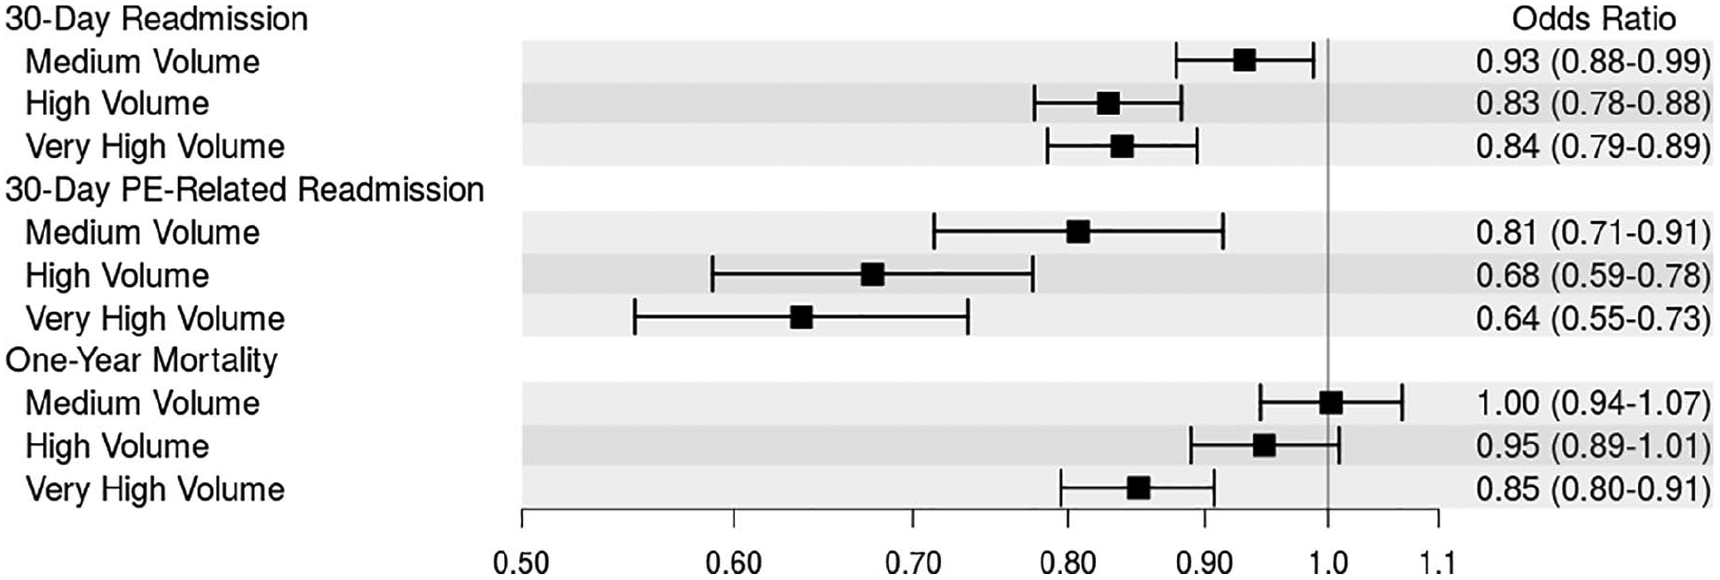
Forest plot showing the association between outcomes (30-day readmission, 30-day PE-related readmission, 1-year mortality) and hospital volume.
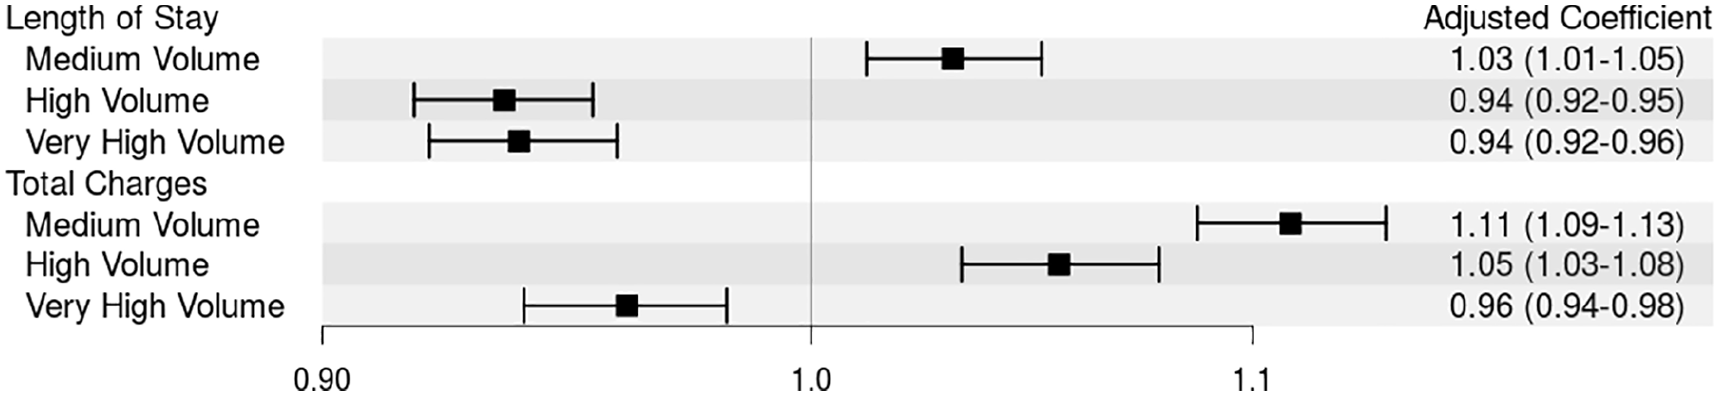
Forest plot showing the association between continuous outcomes (length of stay and total charges) and hospital volume.
Discussion
When controlling for facility and patient-specific variables, we found that facilities that deal with higher volumes of PE cases had significantly lower rates of 30-day all-cause readmission, 30-day PE-related readmission, 1-year mortality, and significantly decreased length of stay and total charges. Though these trends were found most strongly in very high-volume hospitals, high-volume facilities were found to have decreased length of stay and decreased rates of 30-day all-cause readmission and 30-day PE-related readmission.
Critically, many of these benefits are only seen after adjusting for the higher complexity of patients at higher-volume hospitals. Similar findings were recently reported by Jiménez et al. in 2019, who used data from the Registro Informatizado de la Enfermedad TrombóEmbolica (RIETE) registry to report an inverse association between the annual facility volume of PE and adjusted PE-related mortality at 30 days among patients with acute symptomatic PE. 31
Though the precise mechanisms that provide these benefits to very high-volume facilities remain to be studied, there are several probable factors that may be considered. Higher-volume hospitals may have more experience with the diagnosis and treatment of PE, have quicker adoption of evidence-based approaches, have established facility-based PE management protocols with dedicated response teams, and have more access to advanced PE treatment options such as catheter-directed thrombolysis. Lower adherence to evidenced-based guidelines at lower-volume hospitals may also be a factor related to poorer outcomes, as reported by Jiménez et al. in analysis of the RIETE registry. 32 An additional element to consider is that every single very high-volume center in our study had a teaching affiliation, a status previously shown to determine better outcomes in patients with heart failure, myocardial infarction, and stroke. 33 Perhaps having a more multidisciplinary approach with increased access to treatment options, such as those with PERT, allows teaching hospitals to provide earlier risk stratification and faster access to advanced therapies such as catheter-directed thrombolysis and mechanical ventilation.
This study has a wide variety of implications. In concordance with prior studies demonstrating the positive volume–outcome relationship in many surgical fields, our study found a clear association for improved outcomes with higher volume in the management of PE. There is already discussion across many fields in numerous countries about the benefits of shifting the management of certain procedures and diagnoses to facilities and staff with greater experience in dealing with them. Our study suggests that treatment of PE may also benefit from such a shift.
Limitations
Several limitations of our study should be noted. As the inclusion criteria has been established such that it includes cases where PE is likely a primary contributor to the presentation, there is a bias towards more serious presentations of PE. This is reflected in the overall 1-year mortality of included encounters, which is higher than other studies that have examined general 1-year mortality of PE. 33 Additionally, our study did not distinguish between massive (high-risk), submassive (intermediate-risk) and low-risk PE, a characterization that has implications in risk stratification and treatment. The use of thrombolysis as a PE treatment in our cohort did not account for the treatment dose and did not distinguish between systemic or catheter-directed thrombolysis, preventing the assessment of whether systemic dose or route of thrombolysis is related to PE volume or outcome. Data provided on patients diagnosed with HIV and/or AIDS was limited, preventing the use of associated encounters in this dataset. Additionally, while the SPARCS dataset captures all hospital readmissions and returns within the state of New York, it does not capture readmissions outside of the state. As New York has many visitors and tourists, this may result in some degree of underestimation of readmission and return rates, as these patients may return or be readmitted to the hospital after returning home. Finally, it is possible for patients to have provided false information, preventing proper linking of encounters for these patients for the purposes of calculating the outcomes of interests, further decreasing calculated readmission, frequency, and return rates, while concurrently inflating the number of patients.
Conclusion
The results of this study suggest that hospitals which manage higher volumes of patients with PE are associated with decreased length of stay, 1-year mortality, 30-day all-cause readmission rates, 30-day PE-related readmission rates, and cost. Further studies are needed to elucidate the underlying mechanisms for these benefits.
Supplemental Material
sj-docx-1-vmj-10.1177_1358863X20970263 – Supplemental material for Relationship of hospital volume on outcomes in patients with acute pulmonary embolism: Analysis of a 70,000 patient database
Supplemental material, sj-docx-1-vmj-10.1177_1358863X20970263 for Relationship of hospital volume on outcomes in patients with acute pulmonary embolism: Analysis of a 70,000 patient database by Mark Finkelstein, Mario A Cedillo, David C Kestenbaum, Obaib S Shoaib, Aaron M Fischman and Robert A Lookstein in Vascular Medicine
Supplemental Material
sj-docx-2-vmj-10.1177_1358863X20970263 – Supplemental material for Relationship of hospital volume on outcomes in patients with acute pulmonary embolism: Analysis of a 70,000 patient database
Supplemental material, sj-docx-2-vmj-10.1177_1358863X20970263 for Relationship of hospital volume on outcomes in patients with acute pulmonary embolism: Analysis of a 70,000 patient database by Mark Finkelstein, Mario A Cedillo, David C Kestenbaum, Obaib S Shoaib, Aaron M Fischman and Robert A Lookstein in Vascular Medicine
Footnotes
Declaration of conflicting interests
The authors declared no potential conflicts of interest with respect to the research, authorship, and/or publication of this article.
Funding
The authors received no financial support for the research, authorship, and/or publication of this article.
Supplementary material
The supplementary material is available online with the article.
References
Supplementary Material
Please find the following supplemental material available below.
For Open Access articles published under a Creative Commons License, all supplemental material carries the same license as the article it is associated with.
For non-Open Access articles published, all supplemental material carries a non-exclusive license, and permission requests for re-use of supplemental material or any part of supplemental material shall be sent directly to the copyright owner as specified in the copyright notice associated with the article.