
Abstract
Arterial stiffness (AS) and obesity are recognized as important risk factors of cardiovascular disease (CVD). The purpose of this study was to investigate the relationship between AS and obesity. AS was defined as high augmentation index (AIx) and low elasticity (C1, large artery elasticity; C2, small artery elasticity) in participants enrolled in the Multi-Ethnic Study of Atherosclerosis at baseline. We compared AIx, C1, and C2 by body mass index (BMI) (< 25, 25–29.9, 30–39.9, ⩾ 40 kg/m2) and waist–hip ratio (WHR) (< 0.85, 0.85–0.99, ⩾ 1). The obesity–AS association was tested across 10-year age intervals. Among 6177 participants (62 ± 10 years old, 52% female), a significant inverse relationship was observed between obesity and AS. After adjustments for CVD risk factors, participants with a BMI > 40 kg/m2 had 5.4% lower AIx (mean difference [Δ] = −0.82%; 95% CI: –1.10, –0.53), 15.4% higher C1 (Δ = 1.66 mL/mmHg ×10; 95% CI: 1.00, 2.33), and 40.2% higher C2 (Δ = 1.49 mL/mmHg ×100; 95% CI: 1.15, 1.83) compared to those with a BMI < 25 kg/m2 (all p for trend < 0.001). Participants with a WHR ⩾ 1 had 5.6% higher C1 (∆ = 0.92 mL/mmHg ×10; 95% CI: 0.47, 1.37) compared to those with a WHR < 0.85. The WHR had a significant interaction with age on AIx and C2, but not with BMI; the inverse relationships of the WHR with AIx and C2 were observed only in participants < 55 years between the normal (WHR < 0.85) and the overweight (0.85 ⩽ WHR < 0.99) groups. Different associations of WHR and BMI with arterial stiffness among older adults should be further investigated.
Introduction
Arterial stiffness is recognized as an important subclinical marker of cardiovascular disease (CVD). 1 While carotid–femoral pulse wave velocity (PWV) is considered the gold standard measure of arterial stiffness, 2 high augmentation index (AIx) and low elasticity (C1, large artery elasticity; C2, small artery elasticity) derived from radial artery pulse wave analysis have been used as surrogate measures of arterial stiffness. Studies have reported that high AIx was an independent marker for premature coronary artery disease 3 and severe short- and long-term cardiovascular (CV) events in patients undergoing percutaneous coronary interventions. 4 Previous studies reported that C1 and C2 are indices for elasticities of large and small arteries, respectively. 5 While low C1 showed significant prediction for heart failure in unadjusted models, low C2 was independently associated with endothelial dysfunction, 6 reduced kidney function, 7 future coronary heart disease (CHD), stroke, and heart failure. 5 C2 has also been proposed as a surrogate marker of endothelial function. 8 These noninvasive measures of arterial stiffness have made it more feasible to identify CVD risk associated with arterial stiffness.
Obesity is a common and costly epidemiologic challenge; 39.8% of US adults were obese in 2015–2016, 9 and the estimated annual medical cost of obesity was $147 billion in the US in 2008. 10 The association of obesity with increased risk of CVD has already been documented. 11 Although underlying mechanisms remain unclear, studies have demonstrated that obesity, measured by body mass index (BMI) and elevated amounts of abdominal fat, is positively related to arterial stiffness measured by PWV.12–15 Conversely, several studies have reported the so-called ‘obesity paradox’, in which obesity measured by BMI was associated with lower risk of all-cause mortality 16 and better outcomes after percutaneous coronary intervention. 17 An observational study has also suggested that vascular function and PWV were superior in severely obese persons compared to those who are obese, measured by BMI. 18
One explanation for this apparently ‘paradoxical’ relationship is that BMI indicates lean body mass rather than adiposity, which is a stronger predictor of CV morbidity and mortality. 19 A previous study reported that the obesity paradox is linked to the use of BMI, but not with waist–hip ratio (WHR). 20 WHR is known to be a superior measure of central adiposity to waist circumference or BMI in predicting arterial stiffness. 21 Different types of obesity such as lean body mass or central adiposity may exert divergent effects on arterial stiffness. The objective of this study is to examine relationships between different measures of obesity (BMI and WHR) and arterial stiffness. We hypothesized that individuals with higher BMI are more likely to have lower arterial stiffness, while those with higher WHR are more likely to have higher arterial stiffness.
Methods
Study sample
The aims and design of the Multi-Ethnic Study of Atherosclerosis (MESA) have been previously published. In brief, the MESA is a multi-center cohort study of white, Chinese American, African American, and Hispanic adults living in six US cities (Winston-Salem, New York, Baltimore, Minneapolis, Chicago, and Los Angeles). The MESA cohort at baseline (MESA Exam 1) included 6814 men and women of 45–84 years of age without CVD who were recruited between 2000 and 2002. All participants provided written informed consent for study participation. The study was approved by the institutional review boards (IRBs) of all MESA field centers. This secondary analysis was approved by the University of Virginia IRB. We excluded participants who did not have C1 or C2 values (n = 478) and who had missing values of smoking (n = 14), heart rate (n = 36), low-density lipoprotein (n = 100), blood glucose (n = 4), and any other covariates (n = 6) from the final sample (n = 6177).
Assessment of obesity
Obesity was determined by BMI and WHR measured at the Exam 1 of the MESA Main Study. BMI (kg/m2) was categorized into normal (< 25), overweight (25–29.9), obesity (30–39.9), and extreme obesity (⩾ 40). WHR was categorized into three groups (< 0.85, 0.85–0.99, ⩾ 1). Previously, the thresholds 0.80 and 0.85 have been suggested for defining overweight and obesity for women and 0.90 and 1.00 for men. 22 However, given the distribution of WHR in our cohort with about 75% of women being categorized as obese when 0.85 was used as the threshold, we used 0.85 and 1.00 for both men and women to define overweight and obesity in this study.
Assessment of arterial stiffness
The HDI/PulseWave CR-2000 tonometry device (Hypertension Diagnostics, Eagan, MN, USA) was used to acquire and analyze pulse waveforms from the radial arterial site on all MESA participants. Details on these measurements in MESA have been described elsewhere. 23 AIx (%) was calculated as the ratio of the secondary systolic peak to the first systolic peak multiplied by 100. 24 C1 and C2 are compliance of the proximal large and distal small arteries used to indicate how elastic these arteries are. 5 They were derived by a computer-based, third-order, four-element modified Windkessel model 25 that analyzes the diastolic pulse contour by extracting the decay component of the waveforms and correcting for systemic vascular resistance (SVR). SVR was estimated as mean arterial blood pressure divided by cardiac output, and cardiac output was estimated from ejection time taken from the pulse waveform, heart rate, age, height, and weight. 5
Assessment of risk factors
Other risk factors that can potentially confound the association between obesity and arterial stiffness included demographic characteristics (age, sex, race/ethnicity), lifestyle factors (smoking, physical activity), medication use for hypertension, hyperlipidemia, and diabetes, circulatory factors (systolic blood pressure, heart rate), and metabolic factors (fasting glucose, high-density lipoprotein, low-density lipoprotein, and triglyceride). Smoking status was classified as never, former, or current smoking. For physical activity levels, total intentional exercise as metabolic equivalent minutes (MET-min) per week was measured by using the MESA Typical Week Physical Activity Survey. 26
Statistical analysis
The relationships between obesity and arterial stiffness were examined using concurrent measures of BMI, WHR, AIx, C1, and C2. We used bivariate and multivariable analyses to examine the relationships. For multivariable analyses, we used ordinary least squares regression to model arterial stiffness (AIx, C1, and C2, dependent variables) as a function of obesity (BMI or WHR), adjusting for age, sex, race/ethnicity, smoking, physical activity, antidiabetic medications, lipid-lowering medications, antihypertensive medications, systolic blood pressure, heart rate, fasting glucose, high-density lipoprotein, low-density lipoprotein, and triglyceride.
To test whether the relationship between obesity and arterial stiffness may vary by age categories (45–54, 55–64, 65–74, and 75–84 years old), sex, and race, we conducted analysis of covariance (ANCOVA) that included interactions between obesity (BMI and WHR) and these demographic factors for all measures of arterial stiffness (AIx, C1, and C2). Least squares means were obtained for each subgroup and were tested for pairwise differences between adjacent weight categories. We used the Bonferroni correction for multiple comparison. Continuous variables were expressed as mean (SD) unless specified otherwise.
Since C1 and C2 have SVR as the denominator in the formula, in sensitivity analyses, we used C1 × SVR and C2 × SVR as additional outcomes to separate the information obtained from the pulse waveform from physical measures (SVR). All analyses were performed using Stata SE, Release 15 (StataCorp, College Station, TX, USA) and SPSS Statistics, Version 24 (IBM, Armonk, NY, USA).
Results
After excluding missing observations, the study sample included 6177 participants. All participants included in the sample had C1 and C2 values, but AIx was not able to be computed for 362 of them. Thus, all analyses involving AIx were based on 5815 participants. The sample was 62 ± 10 years old at the time of MESA Exam 1, 48% were male, 38% were white, 12% Chinese American, 27% African American, and 23% Hispanic. The average AIx was 14.88 ± 2.2%, C1 was 13.36 ± 5.6 mL/mmHg × 10, and C2 was 4.48 ± 2.8 mL/mmHg × 100 (Table 1).
Characteristics of the study participants: Multi-Ethnic Study of Atherosclerosis, 2000–2002.
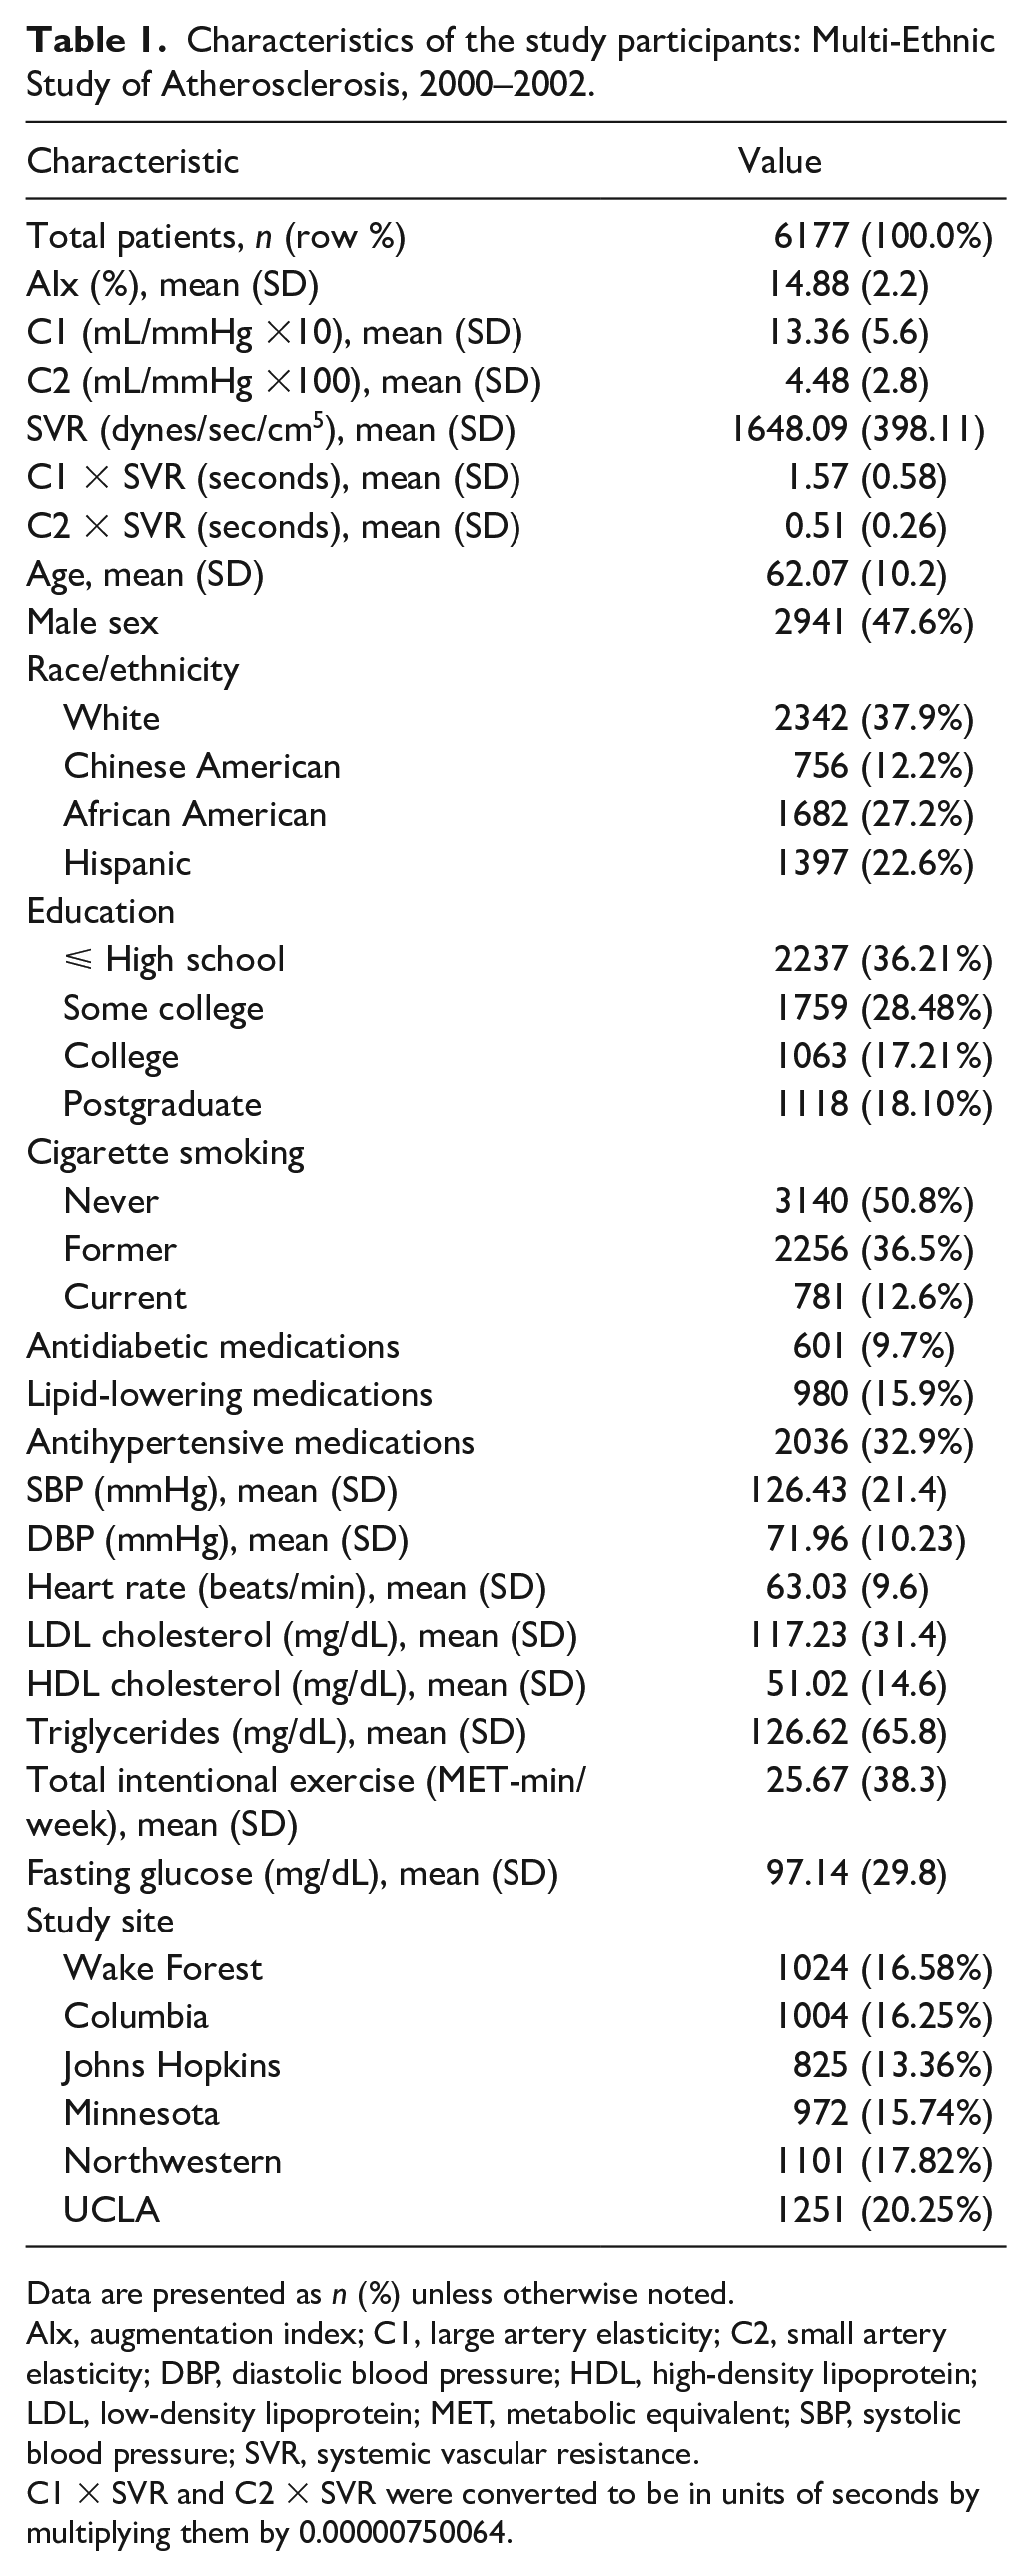
Data are presented as n (%) unless otherwise noted. AIx, augmentation index; C1, large artery elasticity; C2, small artery elasticity; DBP, diastolic blood pressure; HDL, high-density lipoprotein; LDL, low-density lipoprotein; MET, metabolic equivalent; SBP, systolic blood pressure; SVR, systemic vascular resistance.
C1 × SVR and C2 × SVR were converted to be in units of seconds by multiplying them by 0.00000750064.
Table 2 shows a bivariate analysis of participant characteristics according to BMI groups. The majority of participants were classified in the Normal (28.8%), Overweight (39.3%), or Obese (28.3%) groups, with only 3.6% classified as the Very Obese group. The unadjusted average AIx linearly decreased from 15.06% to 14.37% from the Normal group to the Very Obese group (p < 0.001). C1 was highest in the Overweight group (13.61 mL/mmHg × 10) and lowest in the Very Obese group (12.92 mL/mmHg × 10). C2 increased linearly from 4.22 to 5.21 mL/mmHg × 100 from the Normal to the Very Obese groups (p < 0.001).
Study participant characteristics in function of BMI categories (n = 6177): Multi-Ethnic Study of Atherosclerosis, 2000–2002.
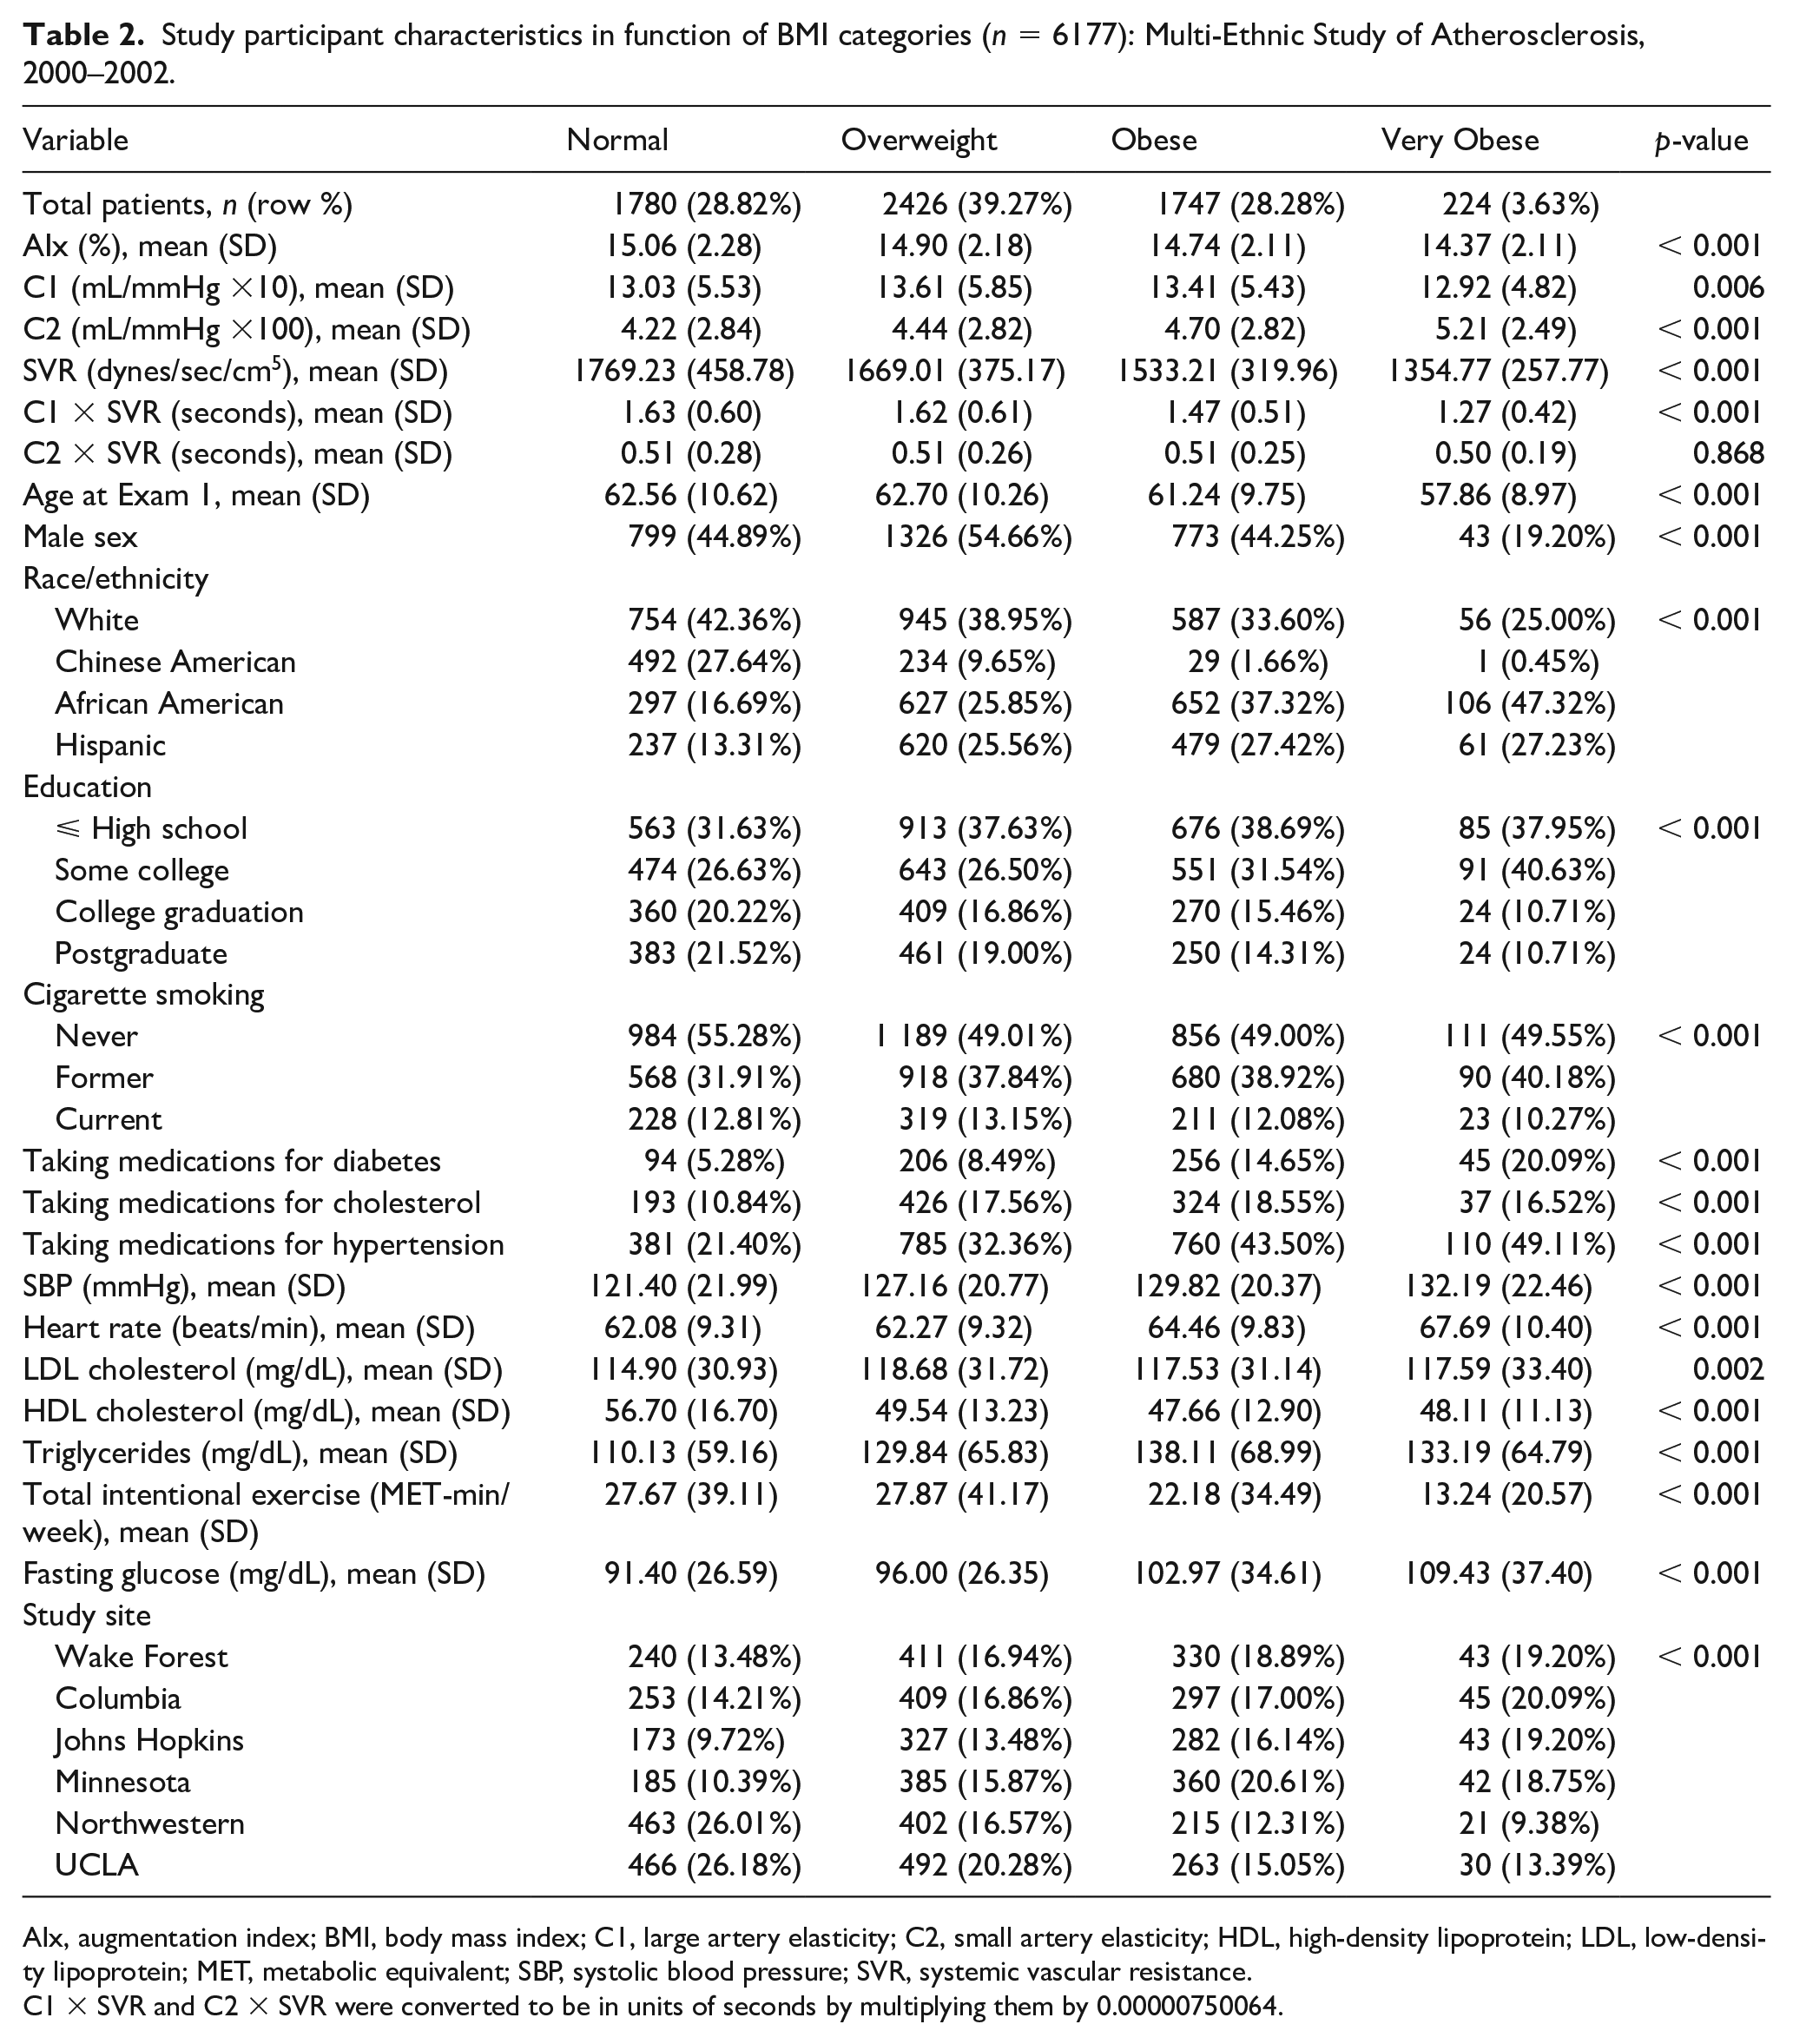
AIx, augmentation index; BMI, body mass index; C1, large artery elasticity; C2, small artery elasticity; HDL, high-density lipoprotein; LDL, low-density lipoprotein; MET, metabolic equivalent; SBP, systolic blood pressure; SVR, systemic vascular resistance.
C1 × SVR and C2 × SVR were converted to be in units of seconds by multiplying them by 0.00000750064.
Table 3 shows a bivariate analysis according to WHR categories. The majority of the participants (66%) fell into the Overweight group (WHR 0.85–0.99), while the number of participants in the Normal (WHR < 0.85) and Obese (⩾ 1.00) groups were similar (16.2%, 17.7%, respectively). The average AIx tended to decrease linearly from 15.36% to 14.54% from the Normal to Obese groups (p < 0.001). C1 was the highest in the Overweight group but it tended to increase across all three groups (p = 0.006). The average C2 showed a nonlinear trend across the WHR groups, but the difference was not statistically significant (p = 0.188).
Study participant characteristics in function of WHR categories (n = 6177): Multi-Ethnic Study of Atherosclerosis, 2000–2002.
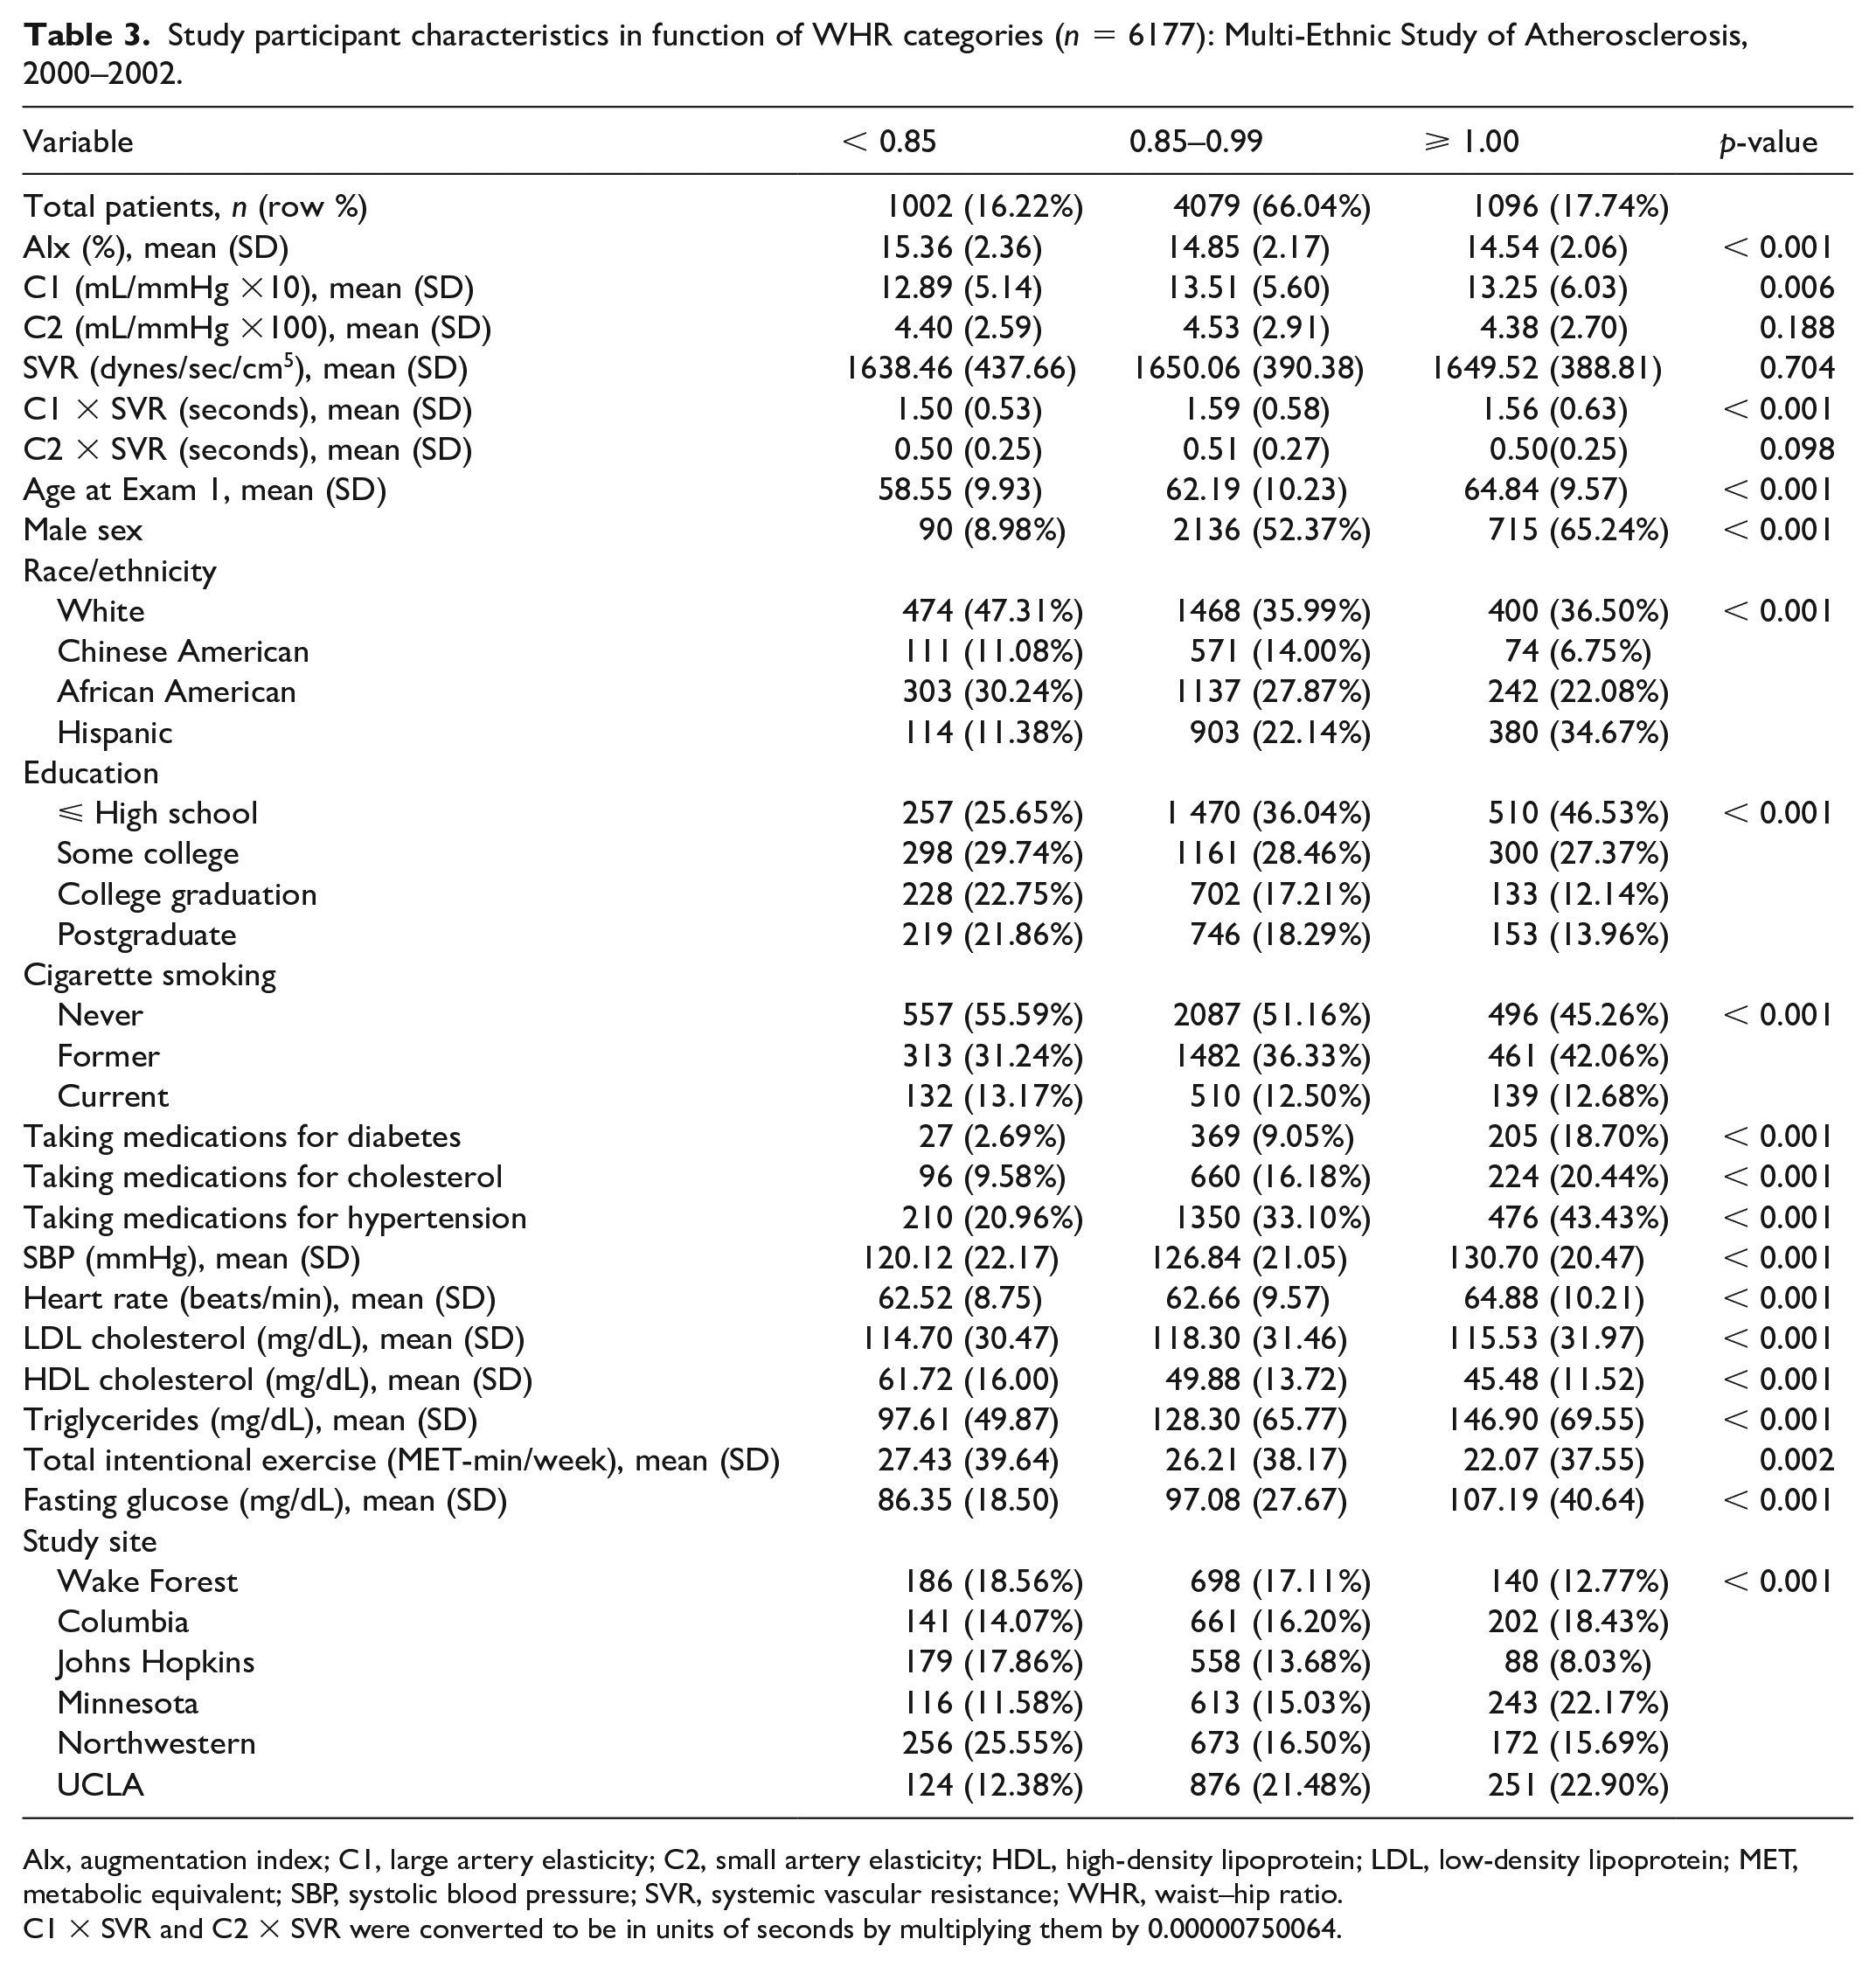
AIx, augmentation index; C1, large artery elasticity; C2, small artery elasticity; HDL, high-density lipoprotein; LDL, low-density lipoprotein; MET, metabolic equivalent; SBP, systolic blood pressure; SVR, systemic vascular resistance; WHR, waist–hip ratio.
C1 × SVR and C2 × SVR were converted to be in units of seconds by multiplying them by 0.00000750064.
Multivariable analyses that controlled for all potential confounders are summarized in Tables 4 and 5 for BMI and WHR, respectively, with full models shown in online supplemental Tables A and B. Compared to the Normal group, the Overweight, Obese, and Very Obese groups showed lower average AIx, where the mean differences were –0.19% (95% CI, –0.32, –0.06), –0.38% (95% CI, –0.53, –0.23), and –0.82% (95% CI, –1.10 –0.53), respectively. This represents a 1.2%, 2.4%, and 5.4% decrease in AIx from the Normal group (p for trend < 0.001).
Adjusted mean differences in arterial stiffness in Grade 1–3 Obesity groups compared to the Normal weight (n = 5814) a : Multi-Ethnic Study of Atherosclerosis, 2000–2002.
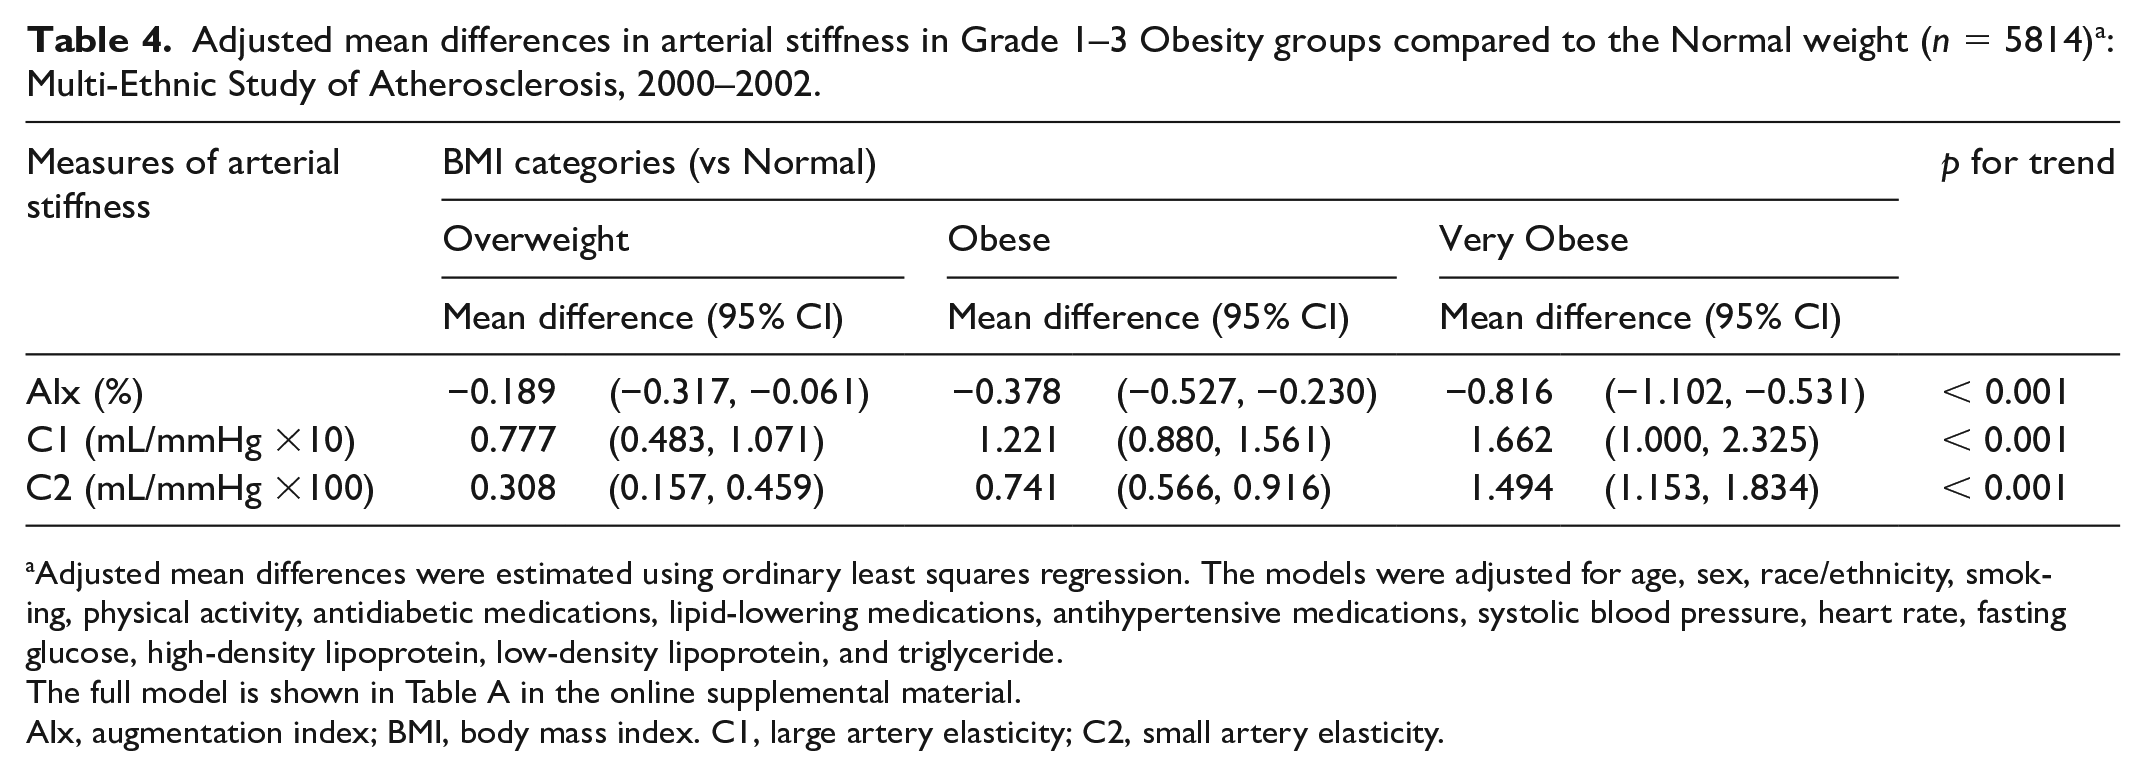
Adjusted mean differences were estimated using ordinary least squares regression. The models were adjusted for age, sex, race/ethnicity, smoking, physical activity, antidiabetic medications, lipid-lowering medications, antihypertensive medications, systolic blood pressure, heart rate, fasting glucose, high-density lipoprotein, low-density lipoprotein, and triglyceride.
The full model is shown in Table A in the online supplemental material.
AIx, augmentation index; BMI, body mass index. C1, large artery elasticity; C2, small artery elasticity.
Adjusted mean differences in arterial stiffness in WHR groups (n = 6177) a : Multi-Ethnic Study of Atherosclerosis, 2000–2002.
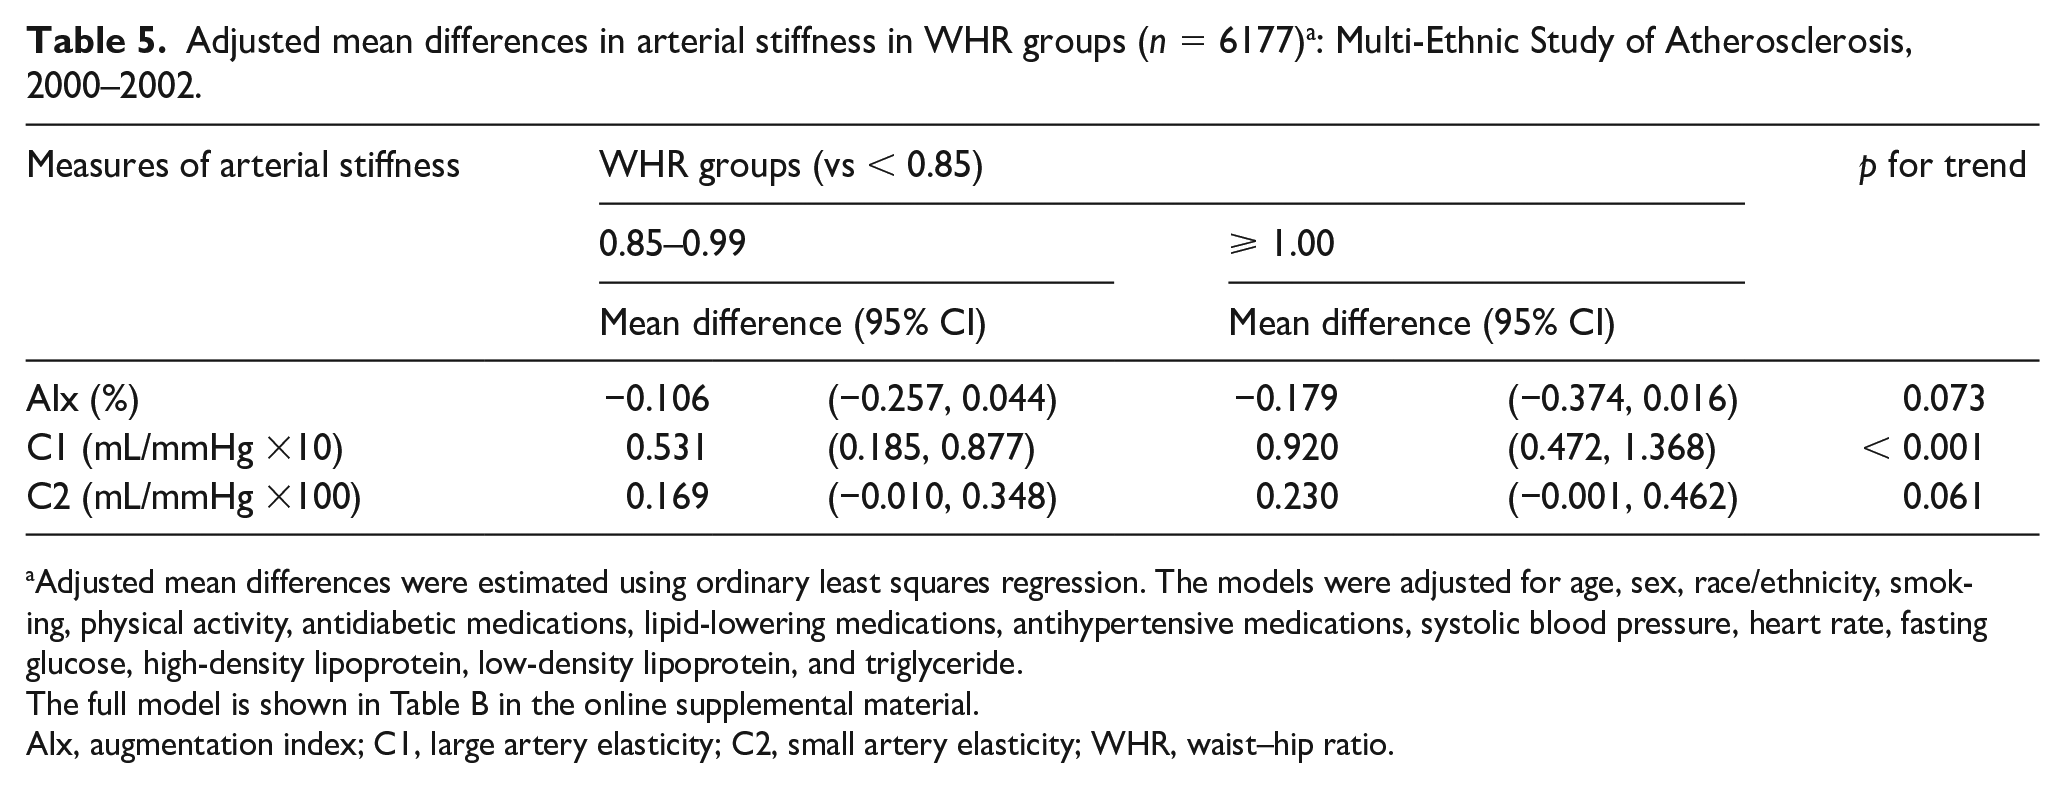
Adjusted mean differences were estimated using ordinary least squares regression. The models were adjusted for age, sex, race/ethnicity, smoking, physical activity, antidiabetic medications, lipid-lowering medications, antihypertensive medications, systolic blood pressure, heart rate, fasting glucose, high-density lipoprotein, low-density lipoprotein, and triglyceride.
The full model is shown in Table B in the online supplemental material.
AIx, augmentation index; C1, large artery elasticity; C2, small artery elasticity; WHR, waist–hip ratio.
C1 and C2 also showed significant graded relationships with BMI. Compared to the normal group, C1 increased by an average of 0.78 mL/mmHg × 10 (95% CI: 0.48, 1.07), 1.22 (95% CI: 0.88, 1.56), and 1.66 (95% CI: 1.00, 2.33) in the Overweight, Obese, and Very Obese groups, which represents a 6%, 11%, and 15% increase over the Normal group (p for trend < 0.001). C2 showed the strongest graded relationship with BMI among all measures of arterial stiffness. Compared to the Normal group, the mean difference was 0.31 mL/mmHg × 100 (95% CI: 0.16, 0.46), 0.74 (95% CI: 0.57, 0.92), and 1.49 (95% CI: 1.15, 1.83) for Overweight, Obese, and Very Obese groups. These represented a 9%, 21%, and 40% increase over the Normal group (p for trend < 0.001).
As seen in Table 5, the multivariable analysis for WHR showed similar graded relationships with arterial stiffness. The mean difference in C1 between Normal and Overweight groups was 0.53 mL/mmHg × 10 (95% CI: 0.19, 0.88) and between Normal and Obese groups was 0.92 (95% CI: 0.47, 1.37). These represented a 3.4% and 5.6% increase over the Normal group (p for trend < 0.001).
We further investigated potential heterogeneous obesity–arterial stiffness relationships in participant subgroups by age, sex, and race. Although there were significant interaction effects between BMI and sex on C1 and C2, the trend of lower arterial stiffness associated with higher BMI remained unchanged. For example, the inverse relationship between BMI and arterial stiffness was stronger in men than in women. A significant interaction between WHR and race on C1 was observed; the significant inverse relationship between WHR and C1 was observed in white, black, and Chinese American groups but not in the Hispanic group. Further, we found significant divergent relationships between WHR and AIx and between WHR and C2 by age groups, as shown in Figure 1. The inverse relationships between WHR and AIx and between WHR and C2 were only significant among those 45–54 years of age. No such interaction by age was found between BMI and any of the arterial stiffness measures.
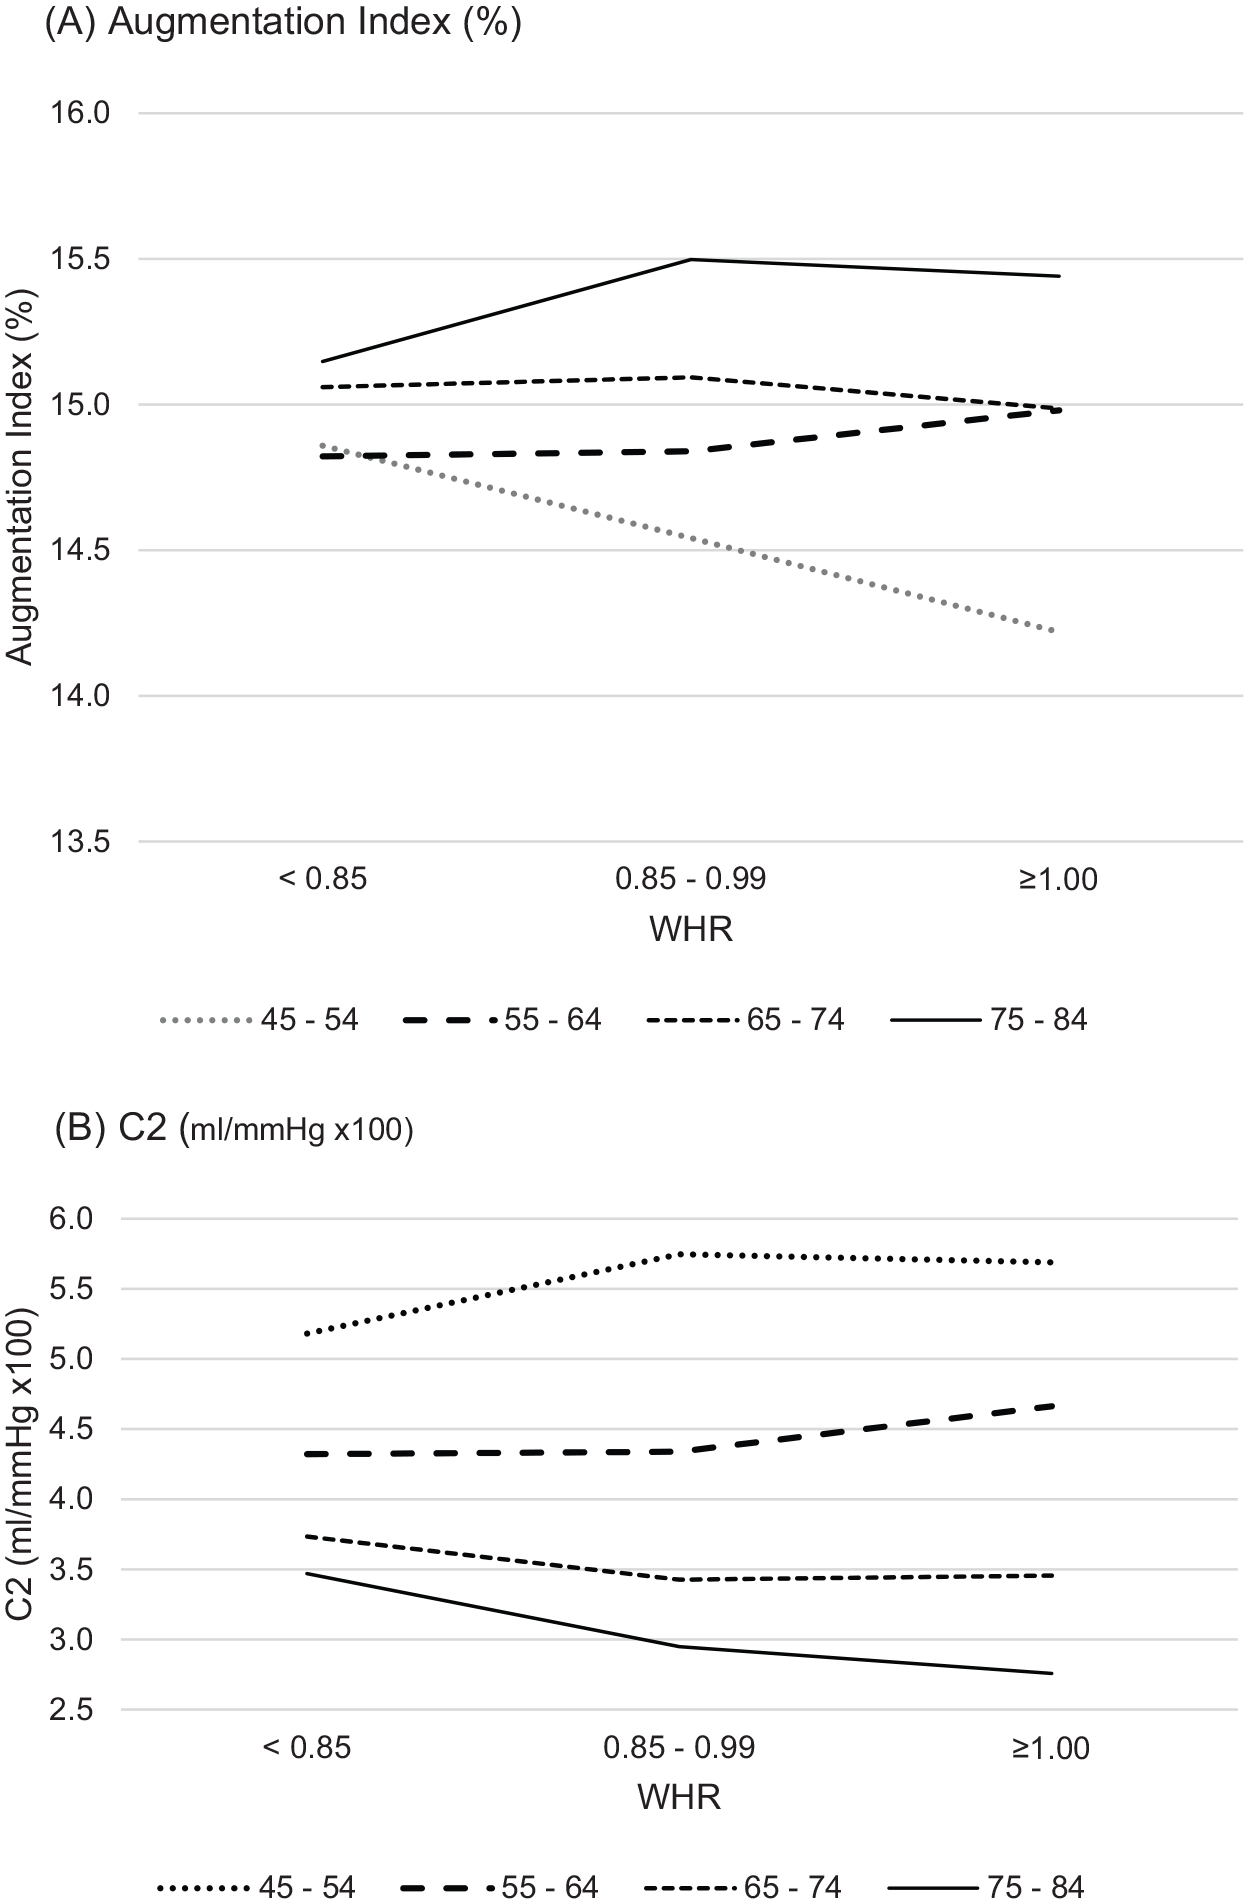
Arterial stiffness by WHR and age categoriesa: Multi-Ethnic Study of Atherosclerosis, 2000–2002. (A) AIx (%); (B) C2 (mL/mmHg ×100).
The sensitivity analyses showed that the patterns of the associations of C2 and C2 × SVR with WHR were similar in that both C2 and C2 × SVR were increasing for participants aged < 65 and decreasing for those aged 65 or older. Their adjusted least squares means are plotted in the online supplemental Figure A. Full results of the sensitivity analyses are presented in online supplemental Tables D and E.
Discussion
In this ethnically diverse community cohort, we found that higher obesity, as measured by both BMI and WHR, is significantly associated with lower arterial stiffness, as defined by high AIx and low C1 and C2, independent of common CVD risk factors. In particular, BMI had significant graded relationships with all three measures of arterial stiffness. The strongest relationship was observed between BMI and C2 with the Obese and Very Obese groups having values 21% and 40% higher than the Normal group. As for WHR, there was significant effect modification by age group in the association between WHR-based obesity and arterial stiffness in that such an inverse association exists only among persons < 55 years of age between normal (WHR < 0.85) and Overweight (0.85 ⩽ WHR < 0.99) groups.
Our results contrast with several previous studies showing obesity as a risk factor for increased arterial stiffness. A recent meta-analysis reported a significantly higher arterial stiffness measured by carotid–femoral PWV, brachial–ankle PWV, and AIx in healthy obese and overweight subjects. 27 This positive relationship between BMI and arterial stiffness occurs early in life, as seen in children 28 and young adults, 29 in hypertensive 30 and nonhypertensive individuals. 31 Central or visceral adiposity measured by WHR was also significantly associated with increased arterial stiffness in individuals with African and Asian ancestry 32 and in the elderly. 33 Further, one study of more than 1500 participants reported that WHR was independently related to increased arterial stiffness measured by carotid–femoral PWV in men. 34
On the other hand, there are studies showing inverse relationships between obesity and arterial stiffness. Higher BMI was associated with lower arterial stiffness measured by PWV among Africans. 35 Beyond reduced arterial stiffness, an increasing number of studies are reporting favorable CV and other health outcomes in obese individuals with existing CVD, further supporting the obesity paradox. For example, higher BMI was also associated with better progress following coronary artery bypass grafting, 36 reduced risk of CV events and complications after percutaneous coronary interventions, 37 lower mortality among patients with CHD, 38 reduced risk of major amputation and death in a large cohort of nonelderly men with diabetes, 39 better vascular function measured by flow-mediated dilation and carotid intima–media thickness in healthy subjects. 18
It is possible that BMI as the measure of obesity may have contributed to inconsistencies in the reported relationships between obesity and arterial stiffness. BMI may not be a good measure of adiposity, since it does not differentiate between excess fat, muscle, or bone mass. 40 One study that included a subset of the data reported here demonstrated that BMI and total abdominal muscle tissue were associated with lower arterial stiffness (i.e. higher C2), whereas visceral adipose tissue was associated with higher arterial stiffness (i.e. lower C2), showing visceral fat may be a better marker than BMI to estimate detrimental effects of excess adiposity on arterial stiffness. 41 Muscle mass seems to have an inverse relationship with arterial stiffness. Reduced muscle mass and increased visceral fat were independently associated with increased arterial stiffness in postmenopausal women with type II diabetes. 42 Further, higher PWV was associated with muscle mass decline 43 and low thigh muscle mass among middle-aged to elderly men 44 but not women. 33
However, these inconsistent results may not be entirely attributed to inaccurate measurement of adiposity. Recent studies show that arterial stiffness is paradoxically low not only in people with higher BMI but also in people with higher body fat accumulation. In one study, all the measures of adiposity including BMI, WHR, body fat percentage, and body roundness index were inversely associated with arterial stiffness measured by brachial–ankle PWV and cardio–ankle vascular index (CAVI). 45 Another study reported that WHR was inversely associated with carotid–femoral PWV in an adjusted model. 34 Our study findings are consistent with these previous studies and showed the inverse associations between different measures of adiposity, including BMI and WHR, and arterial stiffness measured by AIx, C1, and C2, independent of demographic factors and comprehensive CV risk factors. To better understand our findings, we took age into consideration and explored the age interaction of BMI and WHR on arterial stiffness.
It is noteworthy that the inverse association of WHR on arterial stiffness is present only among people aged less than 55 years old, while there is no age interaction with BMI on arterial stiffness. This is consistent with a previous study reporting an inverse relationship between body fat percentage and aortic stiffness in a younger age group (vs a positive relationship in an older age group). Similar to our finding, no such divergent interaction with age was found with BMI. 46 Among the elderly, the inverse association of adiposity (WHR) on arterial stiffness noted in younger (or nonelderly) individuals may be counteracted by other factors, such as decreased insulin sensitivity. Insulin resistance, which is common with aging 47 and central obesity, 48 is associated with arterial stiffness. 49 Actions of glucocorticoids, which can be considered hormones of aging, 50 may also play a role in the inverse relationship between WHR and arterial stiffness that disappears in the elderly. Glucocorticoids cause central fat deposition and peripheral fat depletion, and are known to be associated with adiposity-derived inflammatory factors.51,52 There is strong evidence on the association between subclinical inflammation and arterial stiffness in the general population. 53 On the other hand, the BMI measure includes weight of muscle mass, which is associated with less arterial stiffness. 43 Our finding of the inverse relationship between BMI and arterial stiffness that remained in old age groups may reflect that elderly individuals with more muscle mass have less arterial stiffness than their less muscular counterparts.
Strengths and limitations
The strength of the present study includes a large sample size, racial/ethnic diversity, the use of reliable measures of arterial stiffness, and adjustment for comprehensive CV risk factors. Several limitations must also be noted. The cross-sectional design limits the ability to establish a temporal order in the relationship between obesity and arterial stiffness. The possibility of residual confounding exists, despite adjusting for several potential confounders. For example, a study based on the same cohort and other studies have shown that sleep apnea is associated with arterial stiffness54,55 but this information was not available as sleep study was not performed at the time of Exam 1. The limitation regarding the measures of arterial stiffness is important to note. The gold standard measure of arterial stiffness is carotid–femoral PWV, but this measure was not available at Exam 1. Survival bias is also one of the limitations although the risk of cardiovascular events prior to age 45 is fairly low. Further, the choice of 0.85 and 1.00 to define WHR categories may make our findings less generalizable according to the conventional thresholds. Finally, our results should be interpreted cautiously because the computation of C1 and C2 involves SVR, which is an estimate from physical measures including height and weight. The unexpected association of obesity with C1 and C2 may have been affected by SVR.
Conclusion
This study demonstrated that the subjects with higher BMI and WHR were more likely to have less arterial stiffness defined as low AIx and high C1 and C2, independent of common CVD risk factors, alluding to the obesity paradox. Our findings illustrate the complexity of the relationship between body habitus and arterial stiffness. Further research should investigate underlying mechanisms of divergent relationships of BMI and WHR on arterial stiffness among the elderly. Considering the prevalence of obesity and the prognostic value of arterial stiffness in the future development of CVD, explicating the elusive association between obesity and arterial stiffness will have significant implications for the early detection and prevention of CVD.
Supplemental Material
Supplementary_Figure_A – Supplemental material for Association of obesity with arterial stiffness: The Multi-Ethnic Study of Atherosclerosis (MESA)
Supplemental material, Supplementary_Figure_A for Association of obesity with arterial stiffness: The Multi-Ethnic Study of Atherosclerosis (MESA) by Jeongok G. Logan, Hyojung Kang, Soyoun Kim, Daniel Duprez, Younghoon Kwon, David R. Jacobs, Nketi Forbang, Jennifer Mason Lobo and Min-Woong Sohn in Vascular Medicine
Supplemental Material
Supplementary_Table_A – Supplemental material for Association of obesity with arterial stiffness: The Multi-Ethnic Study of Atherosclerosis (MESA)
Supplemental material, Supplementary_Table_A for Association of obesity with arterial stiffness: The Multi-Ethnic Study of Atherosclerosis (MESA) by Jeongok G. Logan, Hyojung Kang, Soyoun Kim, Daniel Duprez, Younghoon Kwon, David R. Jacobs, Nketi Forbang, Jennifer Mason Lobo and Min-Woong Sohn in Vascular Medicine
Supplemental Material
Supplementary_Table_B – Supplemental material for Association of obesity with arterial stiffness: The Multi-Ethnic Study of Atherosclerosis (MESA)
Supplemental material, Supplementary_Table_B for Association of obesity with arterial stiffness: The Multi-Ethnic Study of Atherosclerosis (MESA) by Jeongok G. Logan, Hyojung Kang, Soyoun Kim, Daniel Duprez, Younghoon Kwon, David R. Jacobs, Nketi Forbang, Jennifer Mason Lobo and Min-Woong Sohn in Vascular Medicine
Supplemental Material
Supplementary_Table_C – Supplemental material for Association of obesity with arterial stiffness: The Multi-Ethnic Study of Atherosclerosis (MESA)
Supplemental material, Supplementary_Table_C for Association of obesity with arterial stiffness: The Multi-Ethnic Study of Atherosclerosis (MESA) by Jeongok G. Logan, Hyojung Kang, Soyoun Kim, Daniel Duprez, Younghoon Kwon, David R. Jacobs, Nketi Forbang, Jennifer Mason Lobo and Min-Woong Sohn in Vascular Medicine
Supplemental Material
Supplementary_Table_D – Supplemental material for Association of obesity with arterial stiffness: The Multi-Ethnic Study of Atherosclerosis (MESA)
Supplemental material, Supplementary_Table_D for Association of obesity with arterial stiffness: The Multi-Ethnic Study of Atherosclerosis (MESA) by Jeongok G. Logan, Hyojung Kang, Soyoun Kim, Daniel Duprez, Younghoon Kwon, David R. Jacobs, Nketi Forbang, Jennifer Mason Lobo and Min-Woong Sohn in Vascular Medicine
Supplemental Material
Supplementary_Table_E – Supplemental material for Association of obesity with arterial stiffness: The Multi-Ethnic Study of Atherosclerosis (MESA)
Supplemental material, Supplementary_Table_E for Association of obesity with arterial stiffness: The Multi-Ethnic Study of Atherosclerosis (MESA) by Jeongok G. Logan, Hyojung Kang, Soyoun Kim, Daniel Duprez, Younghoon Kwon, David R. Jacobs, Nketi Forbang, Jennifer Mason Lobo and Min-Woong Sohn in Vascular Medicine
Footnotes
Acknowledgements
Declaration of conflicting interests
The authors declared no potential conflicts of interest with respect to the research, authorship, and/or publication of this article.
Funding
The authors disclosed receipt of the following financial support for the research, authorship, and/or publication of this article: this research was supported by contracts HHSN268201500003I, N01-HC-95159, N01-HC-95160, N01-HC-95161, N01-HC-95162, N01-HC-95163, N01-HC-95164, N01-HC-95165, N01-HC-95166, N01-HC-95167, N01-HC-95168, and N01-HC-95169 from the National Heart, Lung, and Blood Institute, and by grants UL1-TR-000040, UL1-TR-001079, and UL1-TR-001420 from the National Center for Advancing Translational Sciences (NCATS).
Supplementary material
The supplementary material is available online with the article.
References
Supplementary Material
Please find the following supplemental material available below.
For Open Access articles published under a Creative Commons License, all supplemental material carries the same license as the article it is associated with.
For non-Open Access articles published, all supplemental material carries a non-exclusive license, and permission requests for re-use of supplemental material or any part of supplemental material shall be sent directly to the copyright owner as specified in the copyright notice associated with the article.