
Abstract
Carotid artery grayscale ultrasound echogenicity and texture features predict cardiovascular disease events. We evaluated the longitudinal effects of smoking cessation on four grayscale ultrasound measures. This was a secondary analysis of data from 188 age, sex, and body mass index (BMI)-matched smokers (94 eventual abstainers [EA], 94 continued smokers [CS]) from a smoking cessation trial that had carotid ultrasound examinations at baseline and after 3 years. General linear models that included time, smoking group (EA or CS), and a time*smoking interaction term were used to examine the impact of smoking abstinence on carotid artery grayscale marker values at year 3. Participants were mean (SD) 50.3 (11.4) years old (57% female, 86% white). The baseline grayscale median value (GSM) was inversely correlated with age, BMI, insulin resistance, and smoking pack-years (r = −0.20 to –0.30, p < 0.007 for all). There was a significant time*smoking status interaction for predicting GSM at year 3: GSM decreased significantly in the EA group compared to the CS group (–3.63 [13.00] vs CS 0.39 [12.06] units; p = 0.029). BMI increased more in the EA than the CS group (2.42 [3.00] vs CS 0.35 [2.57] kg/m2; p < 0.001). After adjusting for changes in BMI, the time*smoking status interaction no longer was significant (p = 0.138). From baseline to year 3, contrast increased similarly in both groups. Entropy and angular second moment did not change significantly in either group. Changes in carotid ultrasound echogenicity and grayscale texture features during a smoking cessation attempt are modest and mostly related to weight gain.
Clinicaltrials.gov Identifier: NCT01553084
Introduction
Cigarette smoking increases cardiovascular disease (CVD) risk by impairing endothelial function and by causing dyslipidemia, diabetes mellitus, inflammation, platelet activation, coagulation cascade activation, and reduced fibrinolysis.1–7 These pathophysiological changes along with free radicals and oxidants in cigarette smoke create a pro-oxidant, atherogenic milieu in which oxidatively modified low-density lipoprotein particles are engulfed by macrophages which transform into foam cells, leading to further lipid deposition and plaque formation in the arterial wall.2,5,7,8 Arterial wall changes due to cigarette smoking and other CVD risk factors can be detected by novel ultrasound techniques that characterize arterial wall echogenicity and other grayscale texture features. These features predict future CVD events in healthy middle-aged adults. 9 We previously described associations of increasing age and smoking burden (cigarettes per day, pack-years) with lower carotid arterial echogenicity among adult smokers. 10 Smoking cessation has numerous health benefits and reduces risk of CVD events and mortality, even though its effects on some CVD risk factors are mitigated by weight gain, which can occur after a quit attempt. 1 The effects of smoking cessation on arterial wall echogenicity and other arterial grayscale texture features have not been reported previously. Such information would be helpful in understanding changes in arterial structure and tissue composition associated with smoking cessation. We evaluated the longitudinal effects of smoking cessation on four grayscale carotid ultrasound measures previously demonstrated to predict future CVD risk. 9
Methods
Study participants
This was a secondary analysis of 188 participants (n = 94 eventual abstainers [EA] and 94 age, sex, and body mass index (BMI)-matched continued smokers [CS]) from the Wisconsin Smokers Health Study 2 (WSHS-2). WSHS-2 was a 3-year longitudinal smoking cessation clinical trial designed to examine the efficacy of smoking cessation treatments, and the impact of smoking and cessation on cardiovascular and pulmonary health, by examining the biomarkers and risk factors that put smokers at greatest risk for CVD and CVD events (clinicaltrials.gov identifier: NCT01553084).11,12 The study protocol was approved by the University of Wisconsin-Madison Health Sciences Institutional Review Board; all participants provided informed consent.
The vast majority of WSHS-2 participants made an aided quit attempt (n = 1319). Inclusion and exclusion criteria have been published previously.11,12 All participants were ⩾ 18 years of age, smoked at least five cigarettes/day and were motivated to quit smoking. Exclusion criteria were contraindications to using nicotine replacement therapies or varenicline, untreated hypertension, or recent hospitalization for myocardial infarction, congestive heart failure or diabetes mellitus. 12 Some participants from the Wisconsin Smokers’ Health Study-1 were not eligible for the clinical trial but were willing to continue to participate in the longitudinal cohort and received smoking cessation that was safe and appropriate for them (n = 258). We identified WSHS-2 participants who smoked at baseline but who were abstinent at the year 1 and year 3 visits and had carotid ultrasound examinations (n = 102) at baseline. The SAS macro gmatch 13 was used to match (1:1) 102 continuing smokers with 102 continuous abstainers. Matching criteria were sex (exact match), age (± 5 years), race (exact match), and baseline BMI (± 5 kg/m2). Of the 102 eventual abstainers, eight were eliminated due to poor quality images (not measurable images at baseline and/or year 3). Of the 102 continued smokers, eight were eliminated due to poor quality images (not measurable images at baseline and/or year 3 [one of these eight had bilateral carotid interventions performed, carotid endarterectomy on the right side, and a carotid stent placed on the left side] or did not return for year 3 ultrasound imaging). Thus, data from 94 EA participants and 94 CS participants were analyzed for this study (Figure 1).
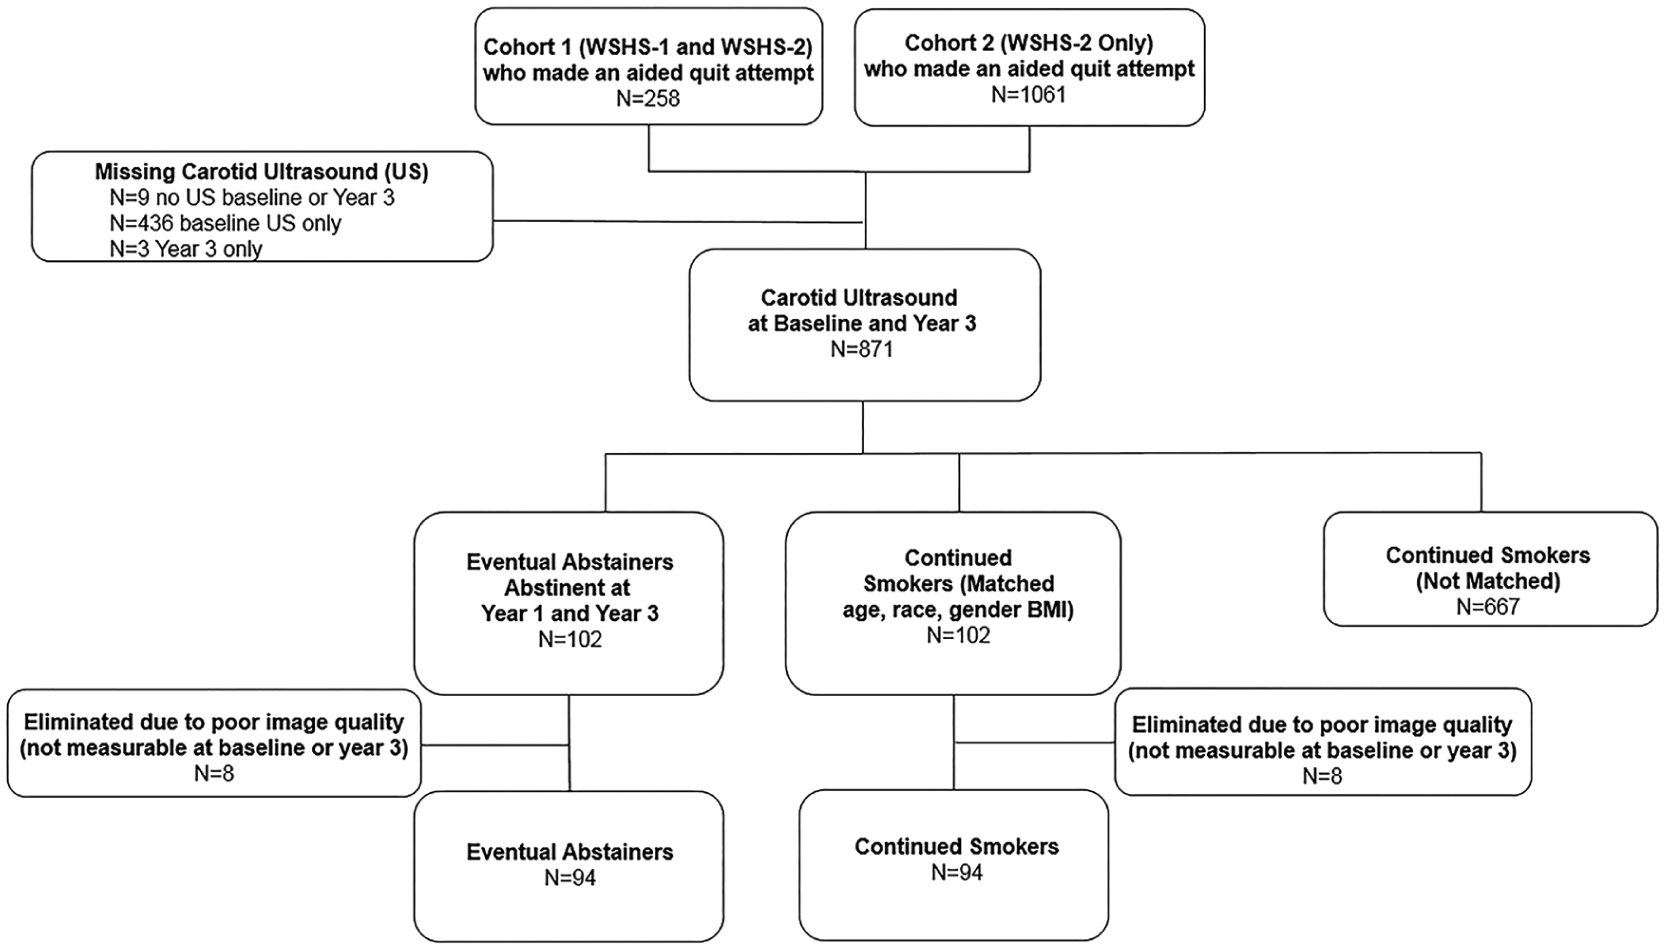
Participant flow diagram.
Assessments
Baseline and year 3 assessments included: anthropometric measures, seated blood pressures, and fasting blood samples to assess total cholesterol, low-density lipoprotein cholesterol (LDL-C), high-density lipoprotein cholesterol (HDL-C), triglycerides, glucose, high-sensitivity C-reactive protein (hsCRP), and white blood cell count (WBC). Laboratory measurement techniques have been previously described. 11 The homeostasis model of insulin resistance (HOMA-IR) was calculated as insulin (µU/mL) * glucose (mmol/L)/22.5. 14 Participants also provided a breath sample for carbon monoxide (CO) assay. Questionnaires and interviews were administered to assess smoking burden, including the number of cigarettes smoked/day (CPD) and the number of years smoked. 11 Pack-years were calculated by taking the current number of CPD, dividing this amount by 20 (the number of cigarettes contained in one pack) and multiplying by the number of years smoked. Tobacco dependence was assessed with the Fagerström Test for Cigarette Dependence (FTCD).15,16
Carotid artery ultrasound and grayscale measurements
Carotid ultrasound was performed at baseline and year 3. Methods for performing carotid imaging have been previously described.10,17 Digital images of the distal far wall of the right and left common carotid arteries were acquired using a Siemens CV70 ultrasound system and L10-5 linear transducer (Siemens Medical Solutions, Malvern, PA, USA) using the same imaging preset consisting of dynamic range 70 dB, grayscale map L, overall gain and time-gain compensation (TGC) optimized per patient, and standardized depth of 4.0 cm unless a deeper depth was needed.
After acquisition, all images were transferred digitally for access by LifeQ Medical plaque texture analysis software (LifeQ Medical, Cyprus) for grayscale echogenicity and texture feature measurements. Images were normalized so that the blackest area of the blood was assigned a grayscale value of zero and the middle two-fourths of the brightest white area of the adventitia was assigned a grayscale value of 190.10,18–21 All images were standardized to a pixel density of 20/mm after normalization.10,18,21,22 The image crop module of the software was used to segment the distal 1.0 cm of the far wall of the right and left common carotid arteries for grayscale feature extraction and measurement.10,21 The grayscale features extracted and used for analyses were grayscale median (GSM) 10 and entropy (first-order statistics from the image histogram), contrast measured using the gray level difference statistics method (GLDS-CON)21,23 and angular second moment (ASM) using the spatial gray level dependence matrices method (SGLDM-ASM) as previously described (Table 1).9,10,21,23–25
Grayscale features.
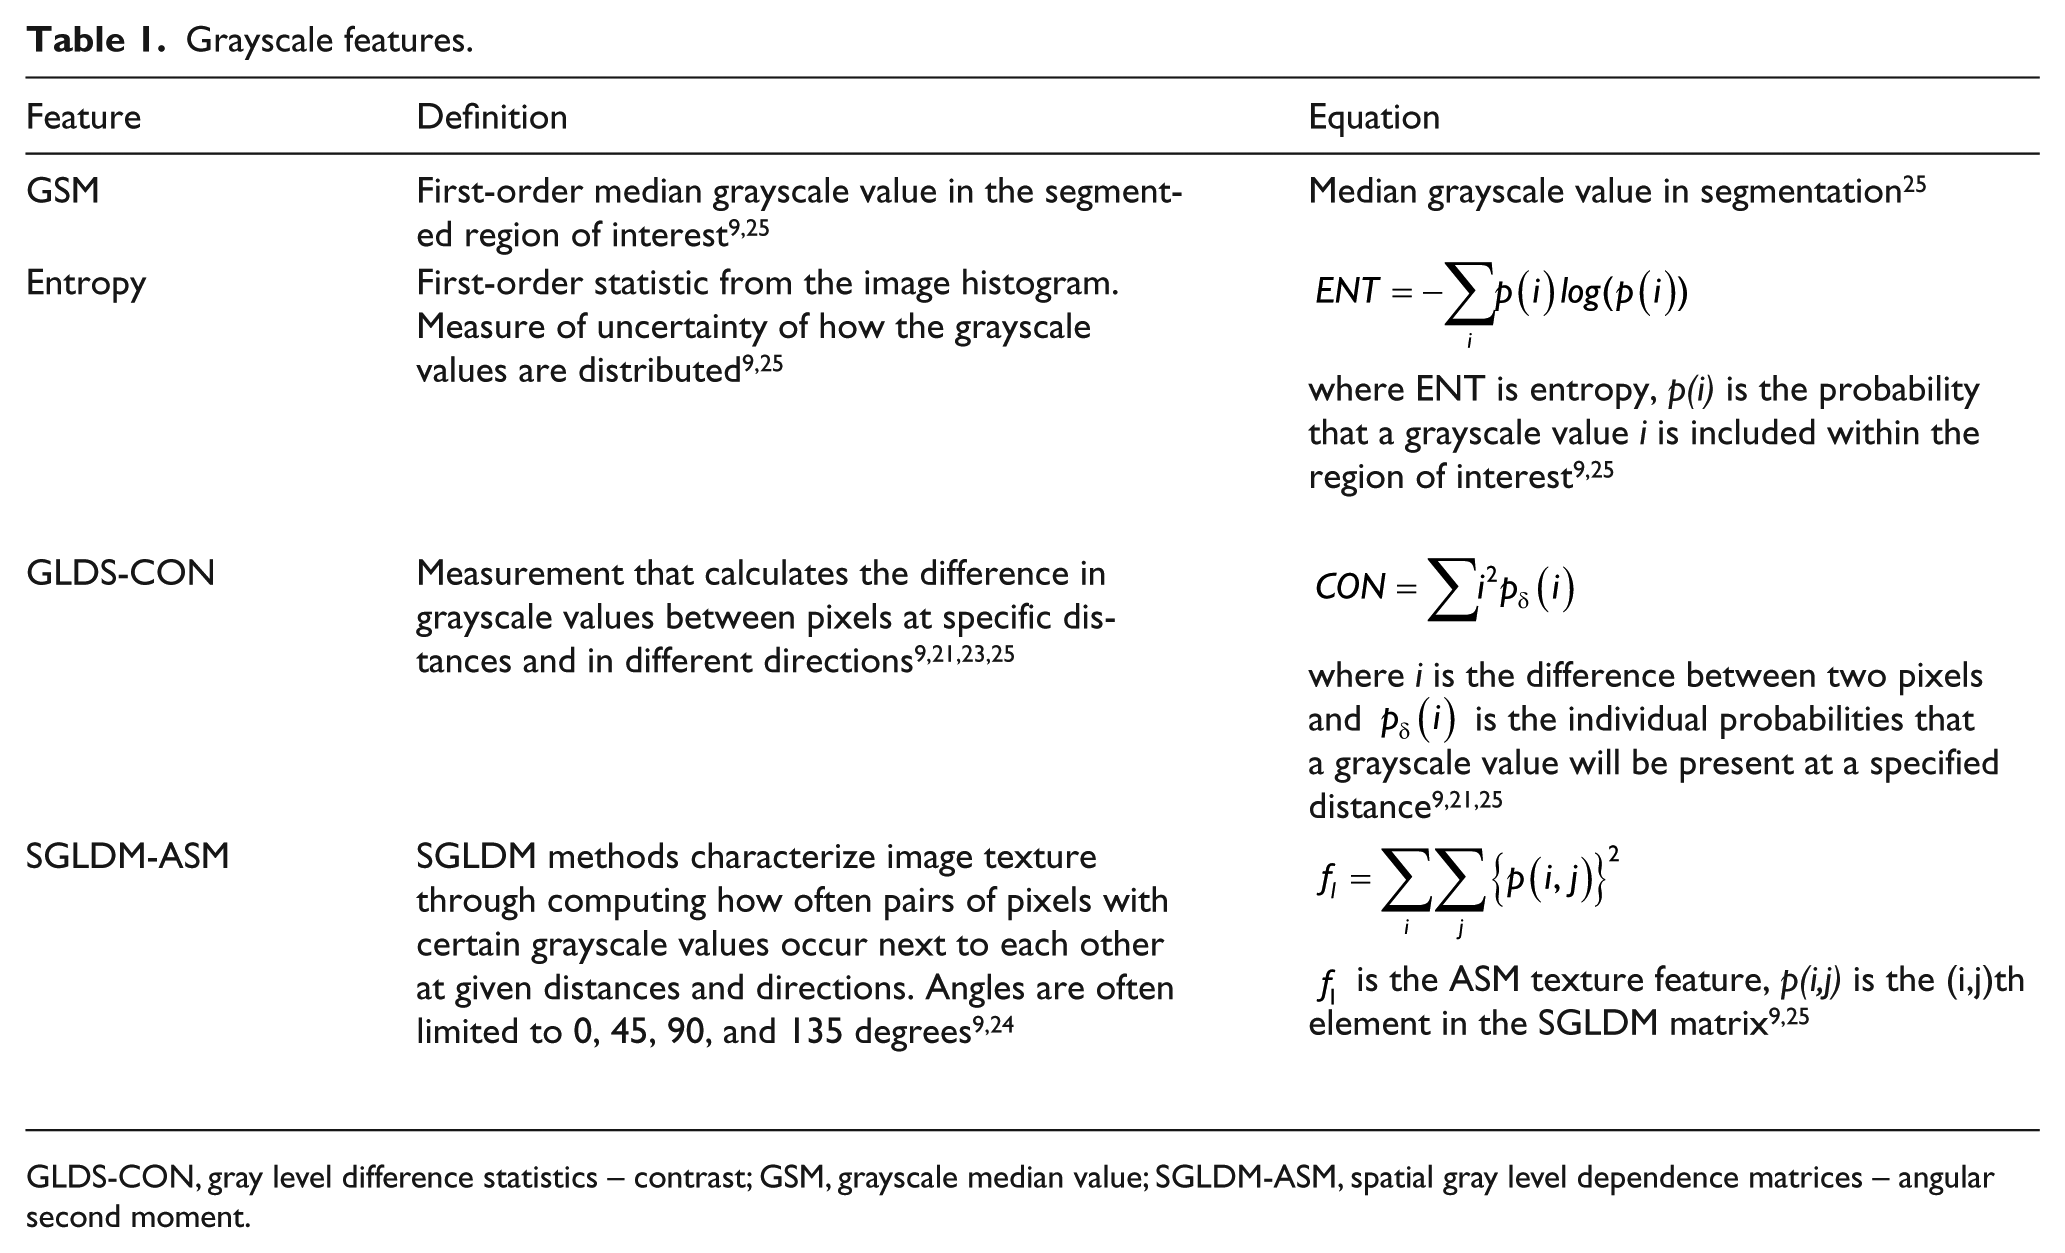
GLDS-CON, gray level difference statistics – contrast; GSM, grayscale median value; SGLDM-ASM, spatial gray level dependence matrices – angular second moment.
Statistical analysis
Statistical analyses were performed using SPSS software, Version 25.0 (IBM Corporation, Armonk, NY, USA). All variables were examined for normal distribution. Variables with an absolute skew value greater than 2.0 (CO, CRP, WBC, HOMA-IR, and triglycerides) were natural log-transformed for all hypothesis testing. All analyses used the minimum GSM,9,26 entropy, and GLDS-CON values between the right and left sides and the maximum SGLDM-ASM value between the right and left sides. 9 All change variables were calculated as the year 3 value minus the baseline value. Grayscale texture features were the lowest value at year 3 minus the lowest value at baseline for GSM, entropy, and GLDS-CON and the highest value of SGLDM-ASM at year 3 and baseline. Pearson’s correlation coefficients were used to examine relationships between the four grayscale markers and smoking parameters (CPD, pack-years, FTCD, and exhaled carbon monoxide) and CVD risk factors (systolic blood pressure, diastolic blood pressure, total cholesterol, LDL-C, triglycerides, non-HDL-C, CRP, WBC, and HOMA-IR). Between-group comparisons were made with t-tests, chi-squared tests, and Fisher’s exact tests. General linear models (GLMs) that included time, smoking group status (EA or CS), and time*smoking status as predictors were used to examine the impact of smoking abstinence at year 3 on grayscale marker values.
Results
Participants at baseline
At baseline, participants were mean (SD) 50.3 (11.4) years old, 57% were female, and 86% were white. They smoked 16.8 (7.6) CPD, reported 26.4 (17.9) pack-years, had exhaled CO 8.8 (6.9) ppm, range 2–72 ppm (median 8.0 [IQR 7.0 ppm]), and had a mean FTCD score of 4.6 (2.2) (Table 2). Of the 188 participants, 37 (19.7%) were taking lipid-lowering medication, 15 (8.0%) were taking diabetes medication, and 54 (28.7%) were taking anti-hypertensive medication (Table 2). There were no baseline differences in smoking or CVD risk factor parameters between groups other than the number of individuals taking diabetes medication (three in the EA and 12 in the CS groups, p = 0.028).
Participant characteristics at baseline.
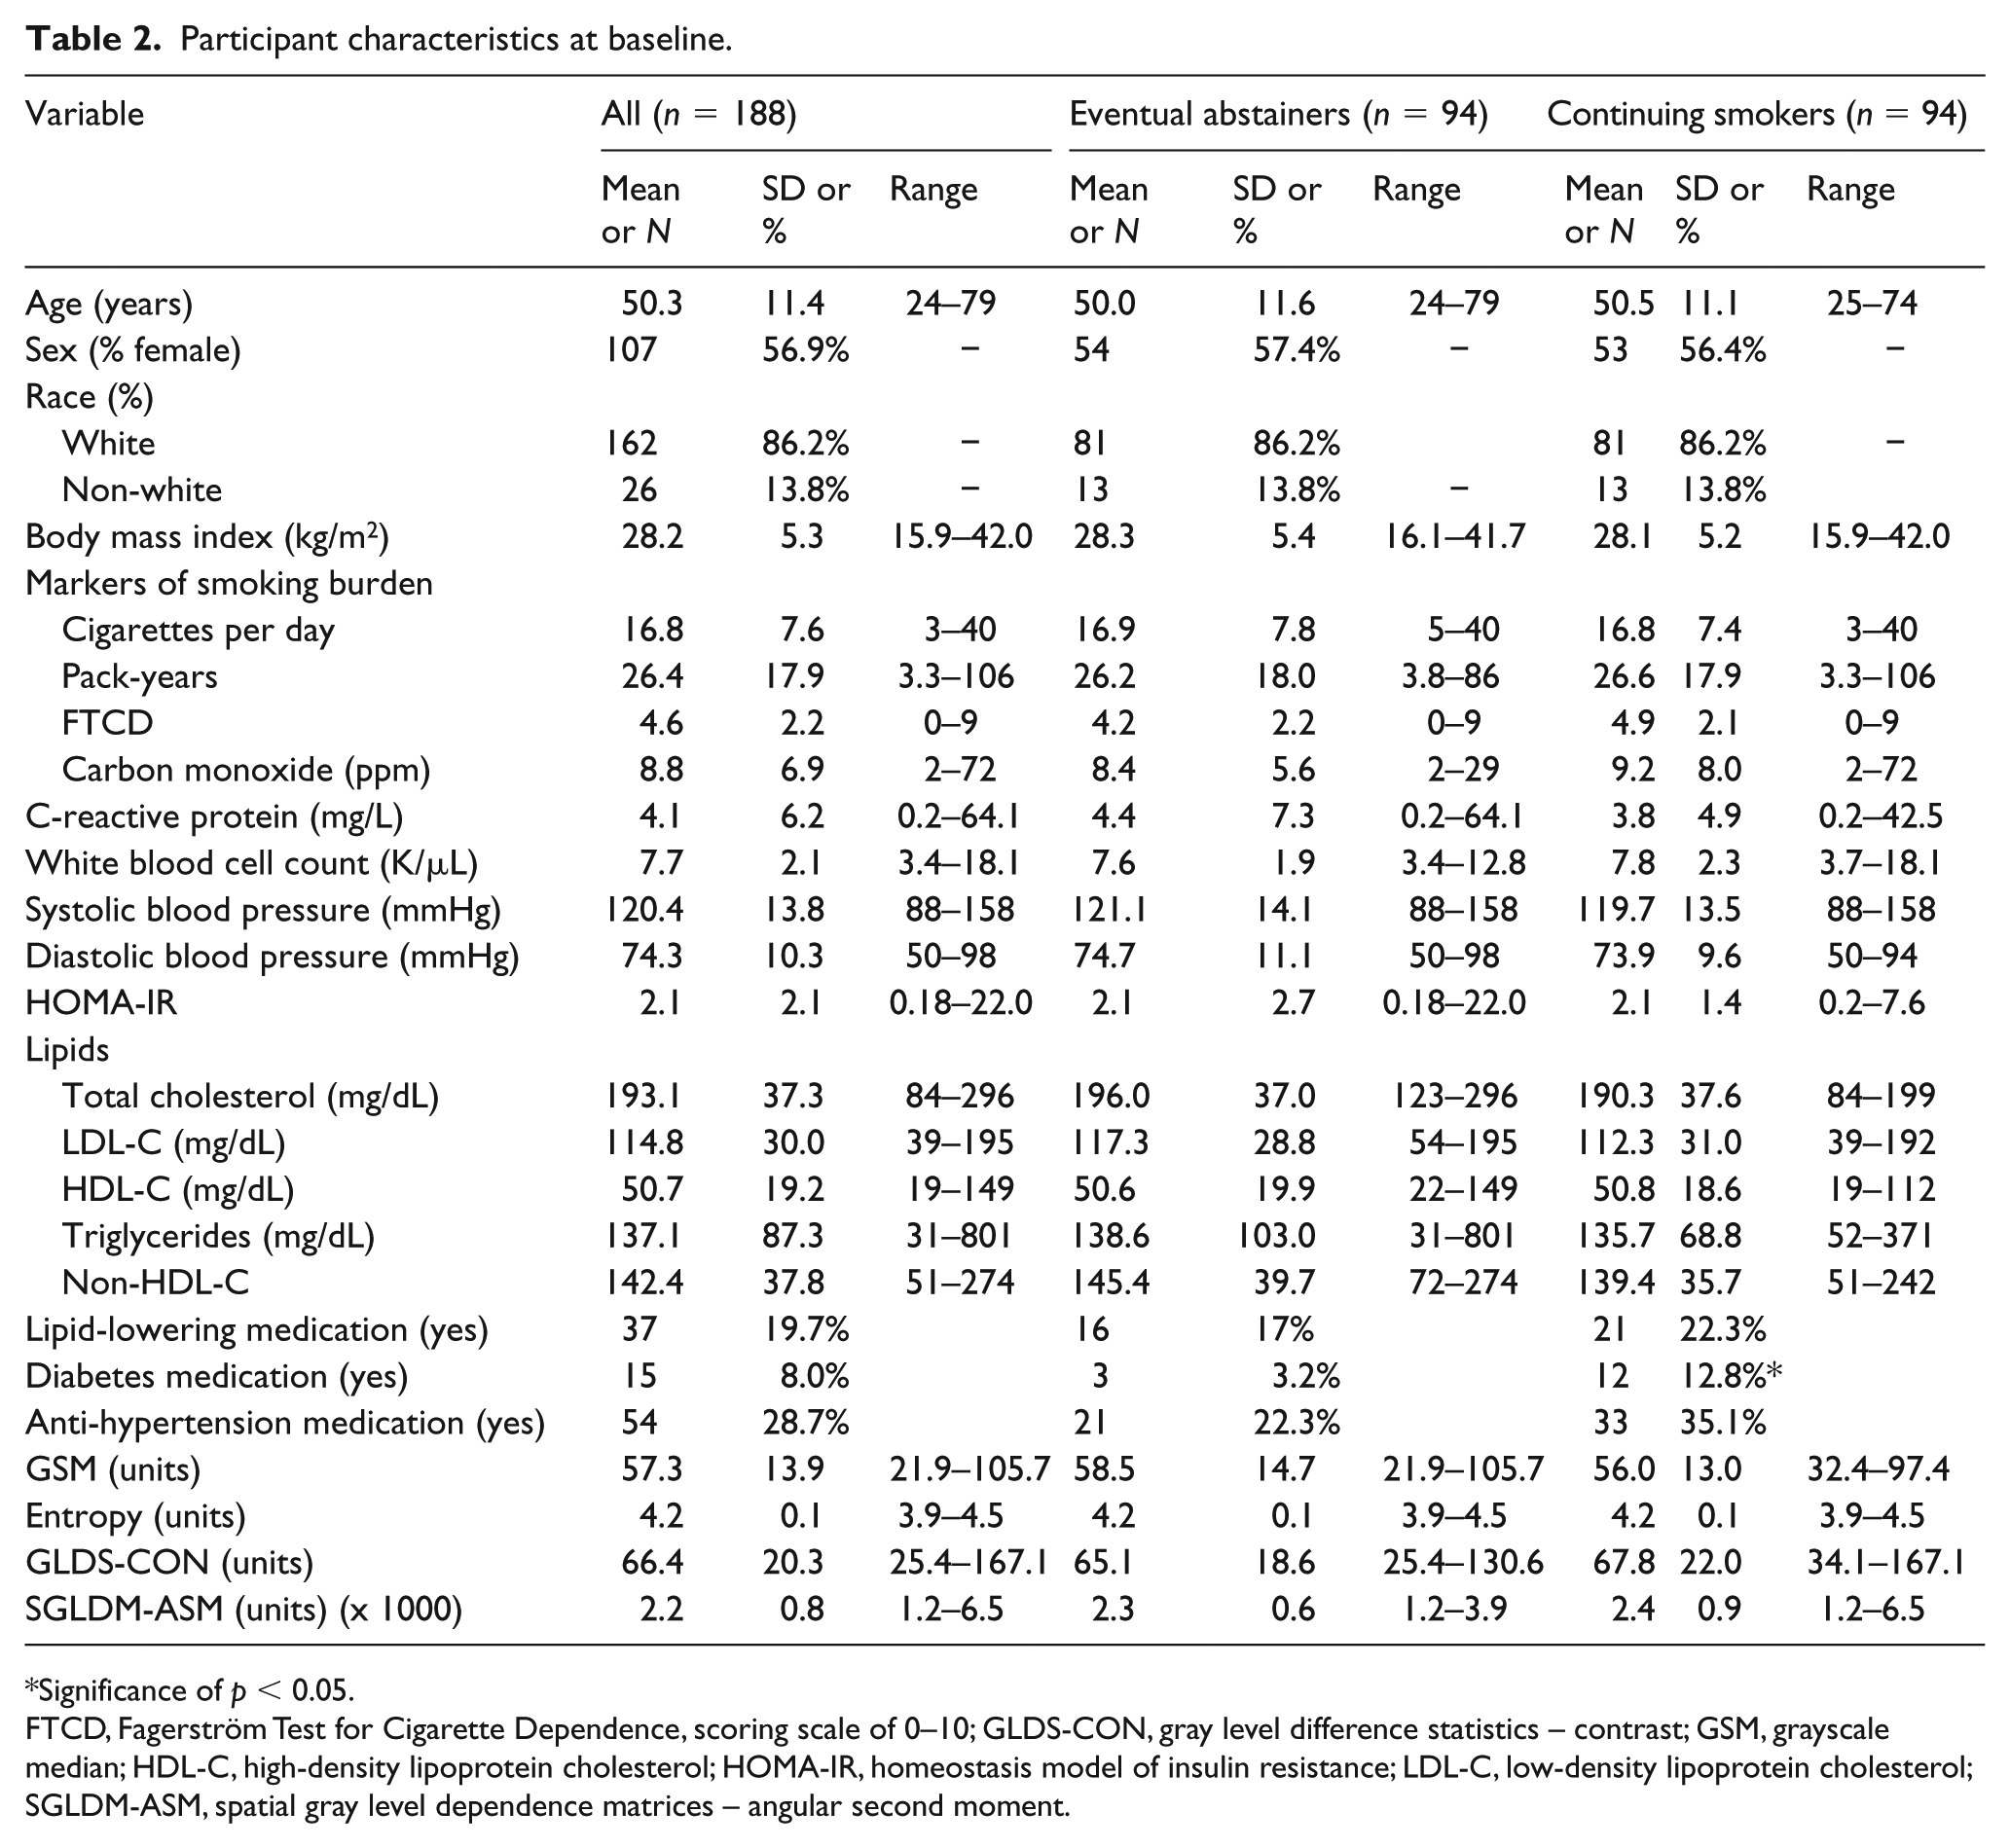
Significance of p < 0.05.
FTCD, Fagerström Test for Cigarette Dependence, scoring scale of 0–10; GLDS-CON, gray level difference statistics – contrast; GSM, grayscale median; HDL-C, high-density lipoprotein cholesterol; HOMA-IR, homeostasis model of insulin resistance; LDL-C, low-density lipoprotein cholesterol; SGLDM-ASM, spatial gray level dependence matrices – angular second moment.
Correlations of grayscale markers with smoking and other CVD risk factors at baseline
Baseline GSM was inversely correlated with CPD (r = −0.15, p = 0.038) and pack-years (r = −0.20, p = 0.006), as well as age (r = −0.25, p = 0.001), BMI (r = −0.27, p < 0.001), Ln WBC (–0.15, p = 0.044), and Ln HOMA-IR (r = −0.30, p < 0.001) and directly correlated with HDL-C (r = 0.15, p = 0.046). Entropy, GLDS-CON, and SGLDM-ASM were not significantly correlated with any of the baseline smoking measures or CVD risk factors.
Changes in CVD risk factors and relations with cessation
CVD risk factor changes were observed over 3 years in both groups with significant between-group differences in changes from baseline to year 3 in BMI, WBC, HOMA-IR and GSM. The EA group experienced greater increases in BMI and HOMA-IR and greater reductions in WBC compared to the CS group. Specifically, the EA group gained significantly more weight than the CS group (2.42 [3.00] vs 0.35 [2.57] kg/m2, p < 0.001). The number of participants taking anti-hypertensive, diabetes, and lipid-lowering medications increased from baseline to year 3 similarly in both groups (Table 3).
Changes in cardiovascular disease risk factors and grayscale markers.
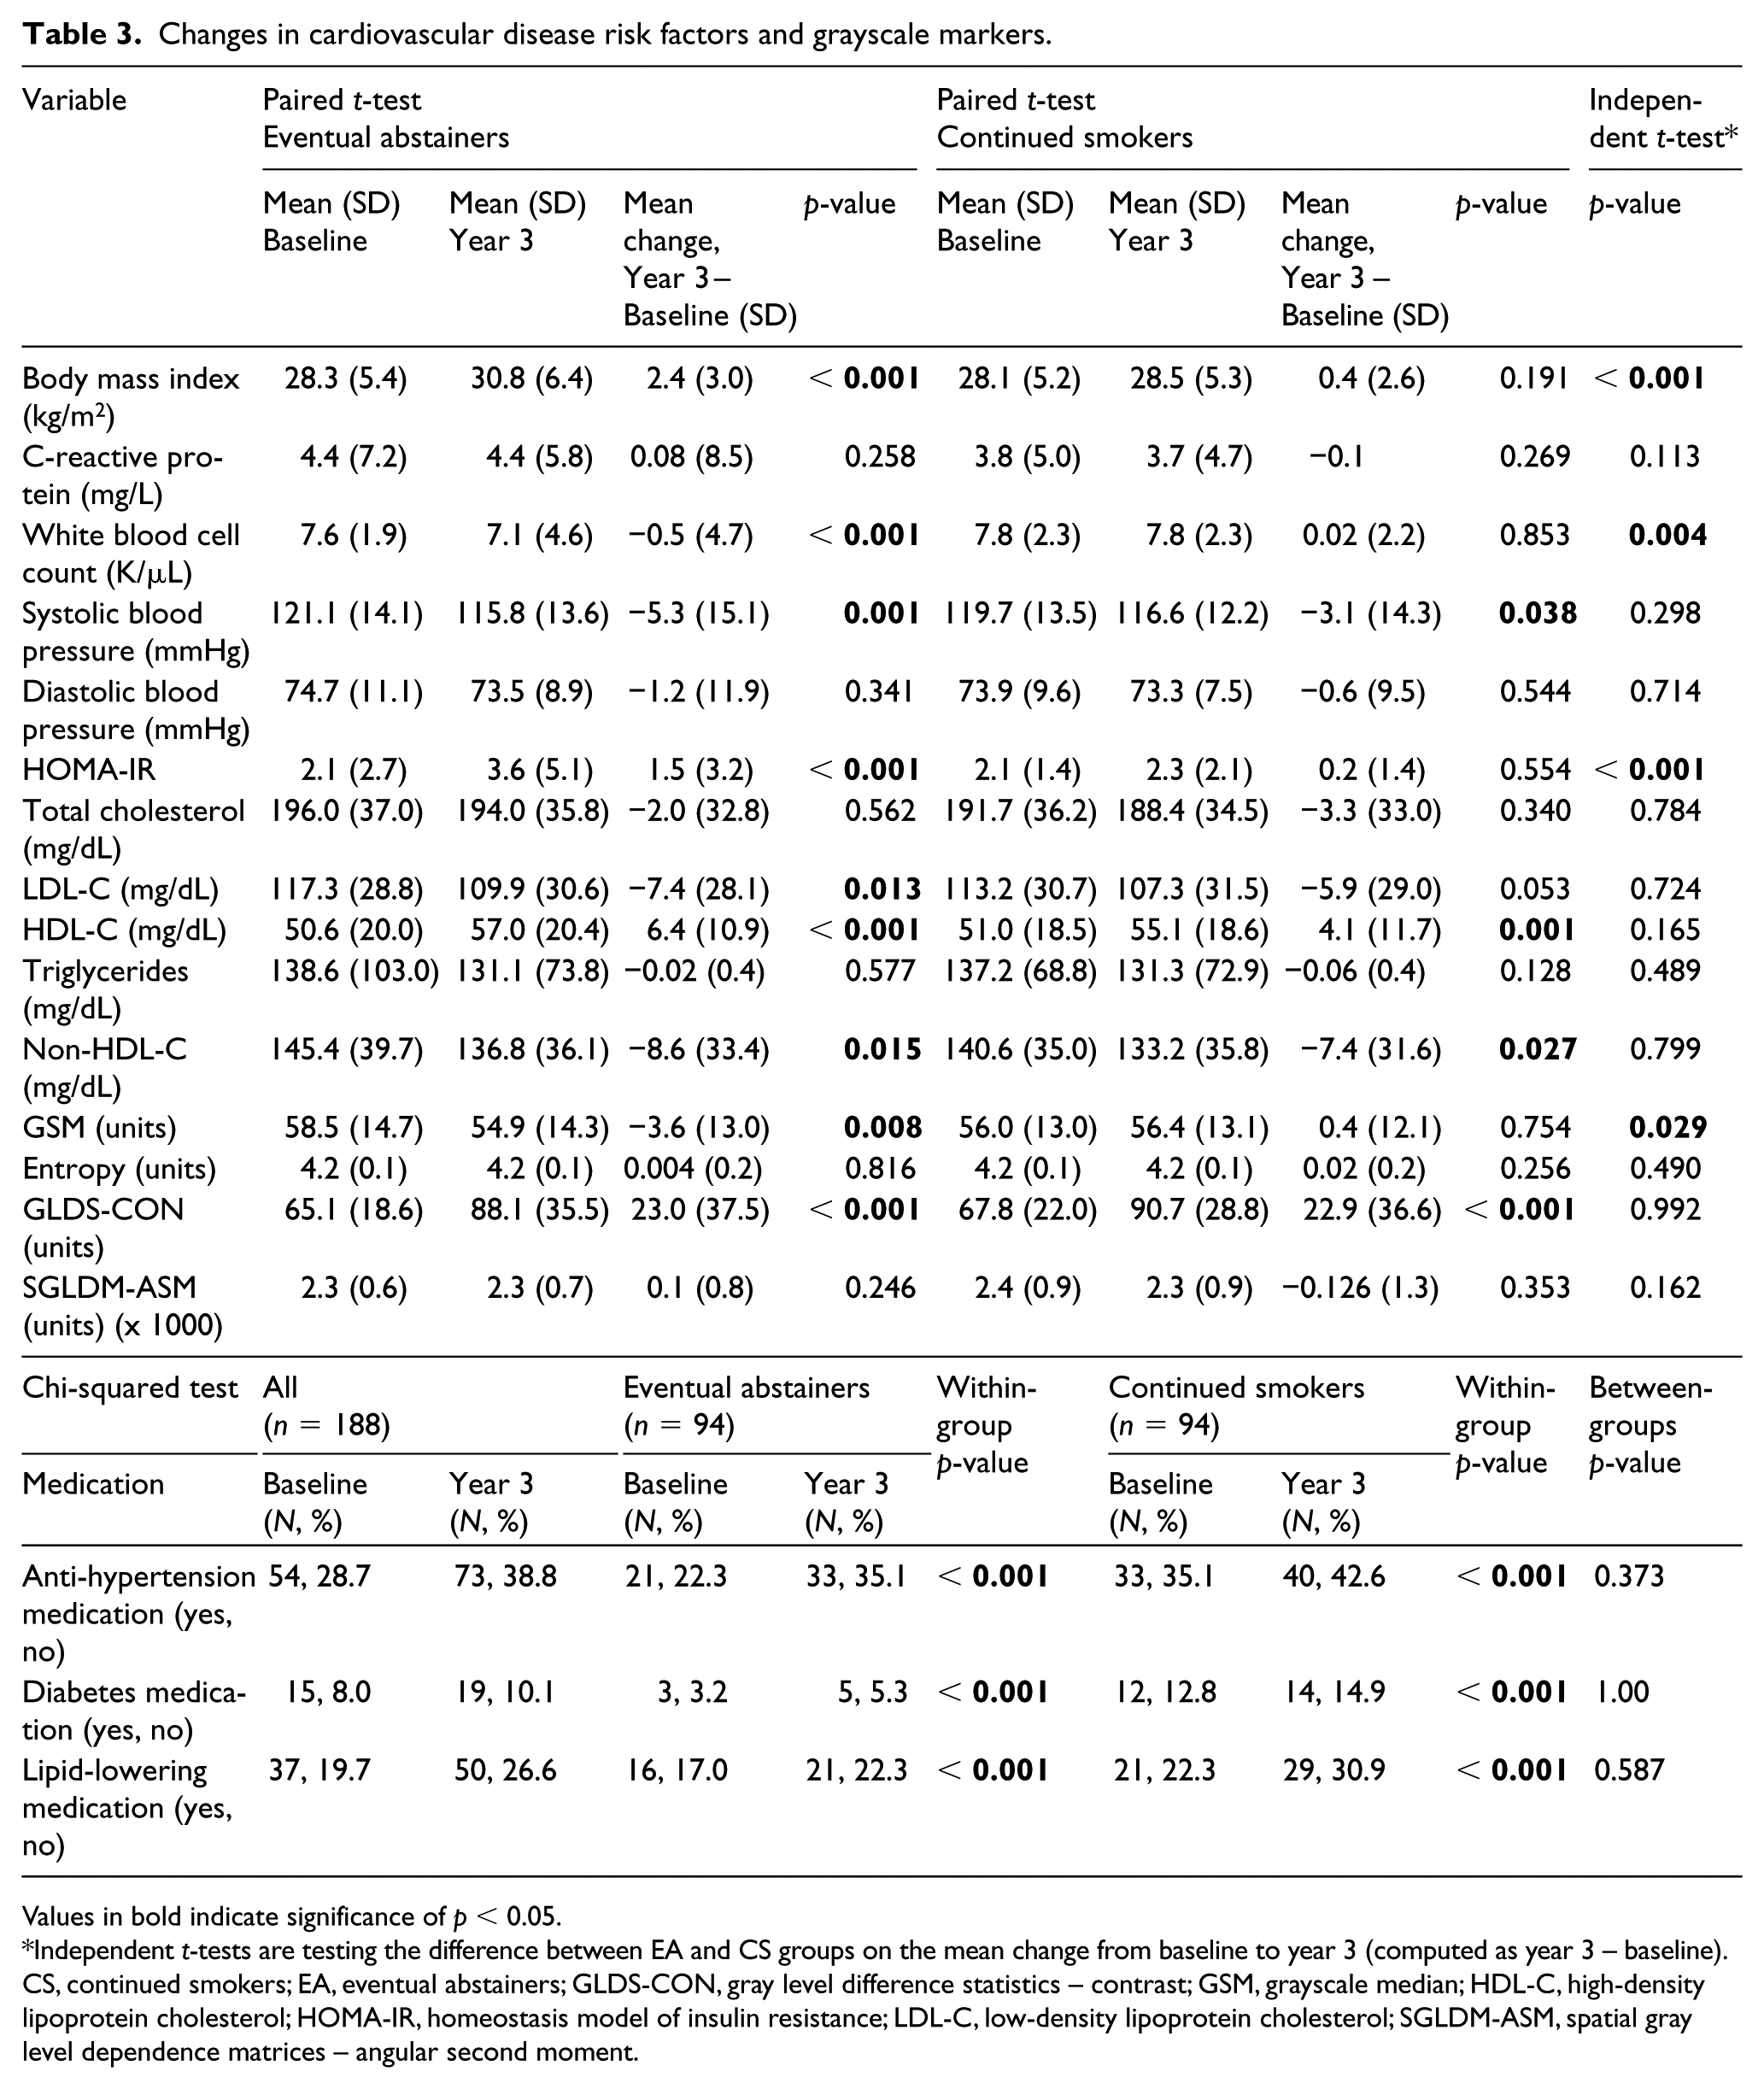
Values in bold indicate significance of p < 0.05.
Independent t-tests are testing the difference between EA and CS groups on the mean change from baseline to year 3 (computed as year 3 – baseline).
CS, continued smokers; EA, eventual abstainers; GLDS-CON, gray level difference statistics – contrast; GSM, grayscale median; HDL-C, high-density lipoprotein cholesterol; HOMA-IR, homeostasis model of insulin resistance; LDL-C, low-density lipoprotein cholesterol; SGLDM-ASM, spatial gray level dependence matrices – angular second moment.
Changes in grayscale markers and relations with cessation
There was a significant time*smoking status (EA or CS) interaction in predicting the GSM value at year 3 (p = 0.029) (Figure 2). The EA group had a decrease in GSM while the CS group did not (EA = −3.63 units, p = 0.006 vs CS = 0.39 units, p = 0.763) (Figure 3). Changes in GSM were inversely correlated with changes in BMI (r = −0.17, p = 0.021), Ln hsCRP (r = −0.16, p = 0.027), and Ln HOMA-IR (–0.15, p = 0.056). After adjusting for changes in BMI, the time*smoking status interaction was no longer significant (p = 0.138). GLDS-CON increased in both groups from baseline to year 3 but was not significantly different between groups. The change in GLDS-CON was weakly correlated with changes in triglycerides (r = 0.15, p = 0.041) but no other CVD risk factors. Entropy and SGLDM-ASM did not change significantly from baseline to year 3 within either group; their changes were not related to changes in any CVD risk factor.
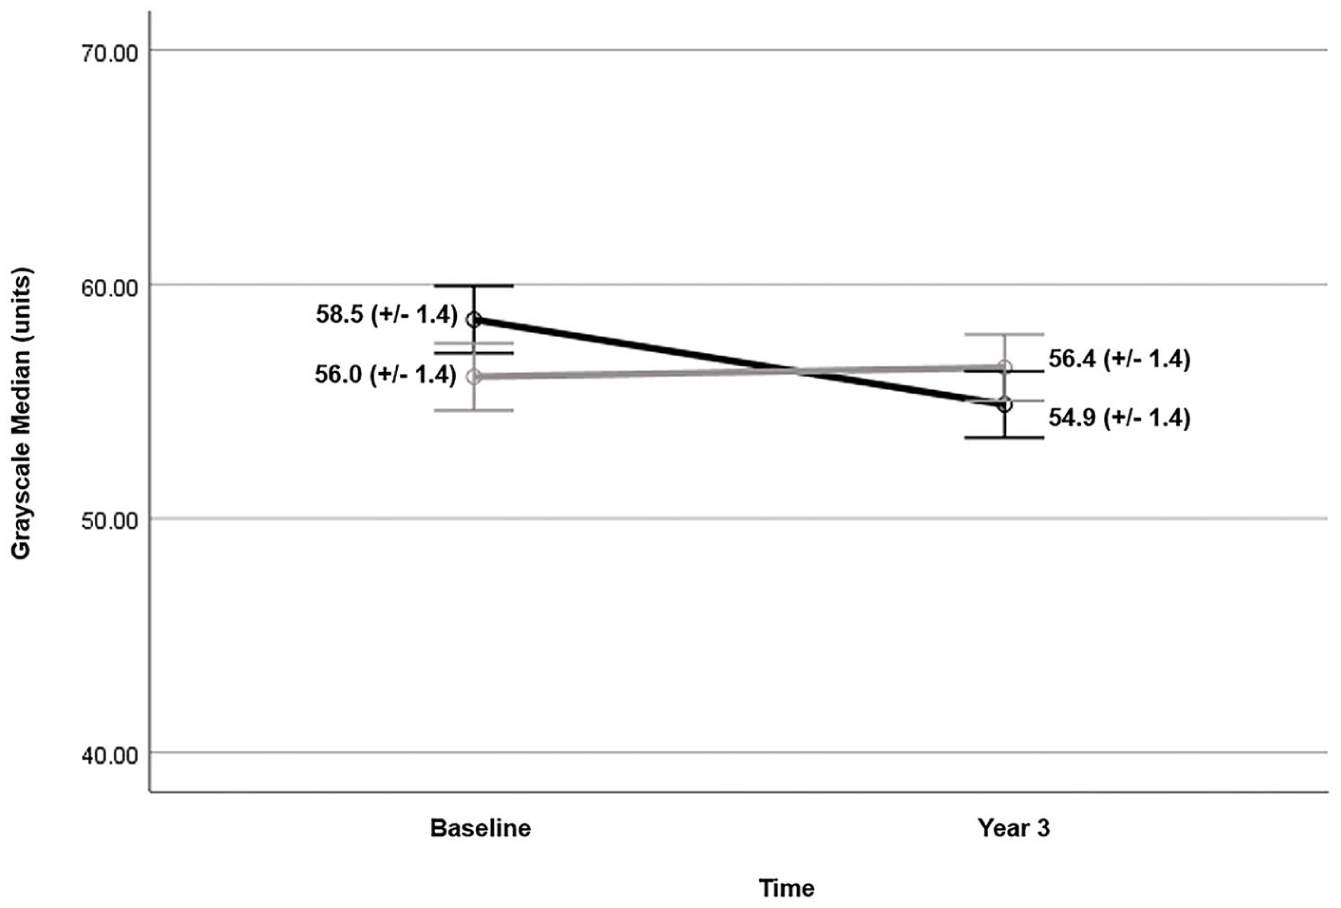
Mean GSM value (± SE) at baseline and year 3 for eventual abstainers (black line) and continued smokers (gray line). Eventual abstainers demonstrate a small change in mean GSM (–3.63 units) between baseline and year 3 imaging. There was a significant time*smoking status interaction in predicting the GSM value at year 3 (p = 0.029).
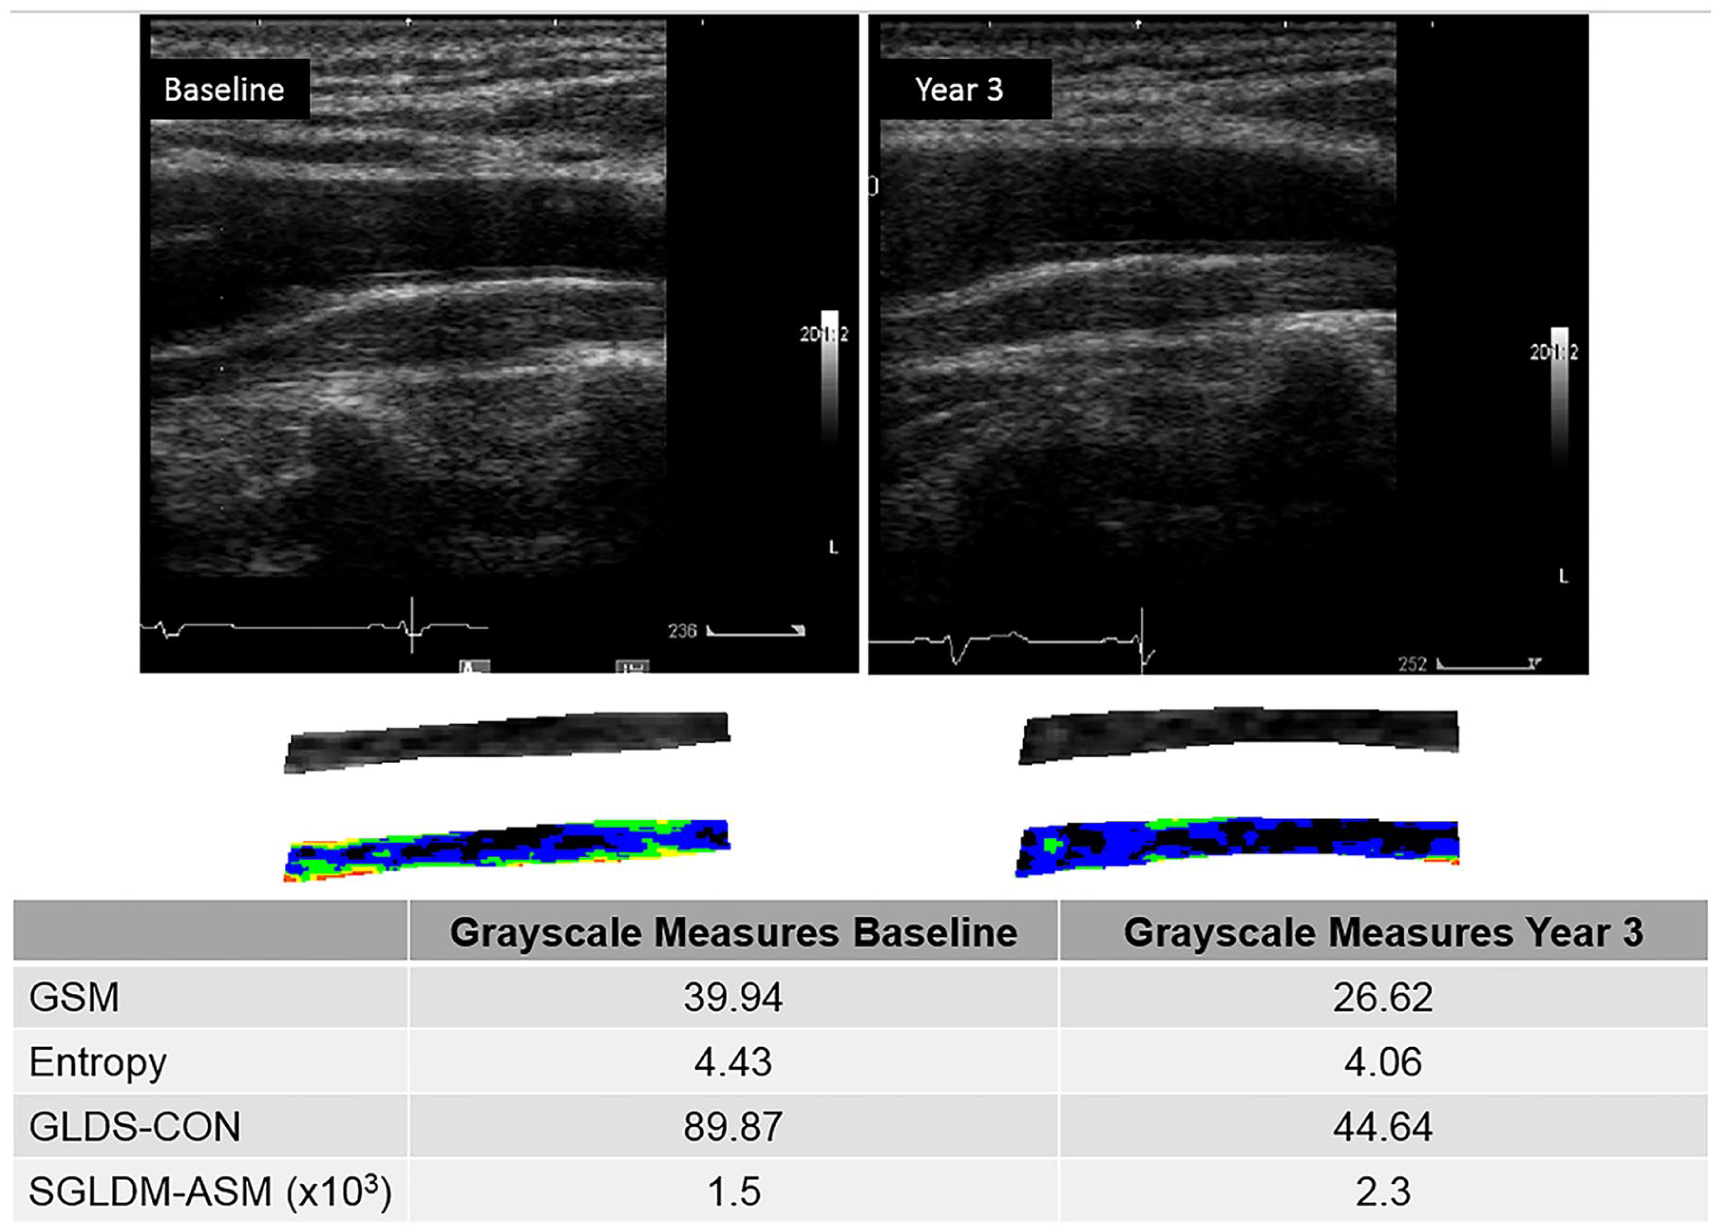
Normalized and standardized grayscale images at baseline and year 3 demonstrating a decrease in GSM value from baseline to year 3. In this subject, the GSM decreased from 39.94 units at baseline to 26.62 units at year 3.
Discussion
In this study of age, sex, and BMI-matched CS and EA, we demonstrated that after 3 years smoking cessation was associated with a small change in GSM, a measure of arterial wall echogenicity. However, the observed decrease in GSM was small (–3.63 units) compared to the mean GSM (58.49 units) and the between-groups difference no longer significant after controlling for change in BMI. Eventual abstainers gained more weight than participants who continued to smoke. This finding and inverse associations between GSM and BMI, hsCRP, and HOMA-IR suggest that among smokers making a quit attempt, GSM changes may reflect insulin resistance and perhaps inflammation related to weight gain, and this metric does not adequately capture the salutary effects of smoking cessation on CVD risk. Our findings are consistent with other studies that have demonstrated associations of lower GSM with increasing age, BMI, dyslipidemia, hypertension, and circulating markers of oxidative stress and inflammation.9,10,27–29 We hypothesize that as BMI increases, tissue composition and arterial wall structure are altered due to inflammatory cell infiltration, which alters the echogenicity and texture features seen on an ultrasound image.9,10,21,28,30 Ultrasound grayscale features differ based on scatterer sizes in phantoms, thus confirming that ultrasound grayscale images are representative of the medium that the sound wave is traversing.21,30 Thus, as tissue composition and structure of the arterial wall are altered either by weight gain and changes in overall health (i.e. treatment of hypertension, dyslipidemia, diabetes mellitus), changes in arterial wall tissue composition and/or structure result in changes in the grayscale image (echogenicity and texture features). We previously demonstrated cross-sectional, inverse associations of lower GSM with age, CPD, and pack-years of smoking. 10
In the MESA study, increasing GLDS-CON and SGLD-ASM, but not GSM, independently predicted future coronary heart disease and CVD events. That significant between-groups differences in GLDS-CON, SGLD-ASM, and entropy were not observed in our study suggests that multiple pathophysiological processes occur with smoking and smoking cessation. Therefore, changes in carotid ultrasound grayscale measures, like changes in carotid intima-media thickness, 31 do not detect the known, salutary effects of smoking cessation on arterial injury and CVD risk unlike brachial artery endothelial function, exercise measures, certain lipoproteins, and certain inflammation and oxidation markers associated with CVD risk, which improved with smoking cessation, despite weight gain.3–6,17,31
Though the carotid artery ultrasound grayscale texture features we studied could not detect beneficial effects of smoking cessation on the arterial wall, carotid artery plaque GSM improves with lipid-lowering therapy using statins, 32 and brachial artery GLDS-CON improves with anti-inflammatory treatment with methotrexate in individuals with human immunodeficiency virus and with a walking program in people with peripheral artery disease.30,33 Thus, grayscale texture features of the arterial wall with smoking and smoking cessation reflect ultra-structure changes associated with other CVD risk factor changes rather than smoking.
Limitations
Although these data were collected prospectively and our groups were well matched, the study was relatively small and the ultrasound technology used to acquire the carotid images no longer is state-of-the-art, so small between-groups differences may have been missed; however, such small differences are unlikely to be clinically relevant. Sonographers were allowed to adjust the TGC and overall gain to optimize the images. Though presets were the same throughout the study, TGC could have been adjusted in an uncontrolled fashion by the sonographers, decreasing our chances of detecting a small difference despite grayscale range normalization. Smoking cessation status was determined by 7-day point prevalence confirmed by exhaled CO ⩽ 5 ppm. Although CO is an acceptable form of bioverification, 34 it has a shorter half-life than other biomarkers such as cotinine (CO half-life = 2–8 h, cotinine half-life = 9–16 h). 34 Finally, uncontrolled introduction of lipid-lowering and anti-hypertensive medications may have altered carotid artery tissue composition irrespective of smoking status and it is possible that 3 years may not have been long enough to see changes in carotid measures; however, in studies of lipid-lowering therapy, the percentage increase in GSM in the lowest quintile was significantly related to the percentage decrease in LDL-C levels over a 2-year time period. 35 In our studies of brachial artery grayscale, changes with exercise and an anti-inflammatory intervention were detected within 6 months of therapy. 30
Conclusions
GSM, a measure of echogenicity, significantly decreased in individuals who quit smoking; however, the difference was very small and, after adjusting for weight gain, was no longer was significant. Thus, these ultrasound measures do not detect the known, salutary effects of smoking cessation on arterial injury and CVD risk. Smoking cessation is the primary way for all smokers to improve their health.
Footnotes
Declaration of conflicting interests
The authors declared the following potential conflicts of interest with respect to the research, authorship, and/or publication of this article: C Mitchell – Davies Publishing Inc.: authorship of textbook; Elsevier, Wolters-Kluwer: author of textbook chapters, royalties; WL Gore & Associates: contracted research grants to UW Madison. ME Piper – None. SS Smith – None. CE Korcarz – None. MC Fiore – None. TB Baker – None. JH Stein – Eli Lilly and Co.: Data and Safety Monitoring Board (DSMB), not CV-related medication.
Funding
The authors disclosed receipt of the following financial support for the research, authorship, and/or publication of this article: grant R01 HL109031 from the National Heart, Lung, and Blood Institute and grant K05 CA139871 from the National Cancer Institute.