
Abstract
Novel technology permits quantification of common carotid artery (CCA) displacement, which is traditionally ignored. We evaluated associations with CCA displacement and cardiovascular disease (CVD) risk and events in a large, multi-ethnic cohort. Right CCA longitudinal displacement (LD), transverse displacement (TD), and grayscale median (GSM) were evaluated using ultrasound speckle-tracking and texture analysis software in 2050 participants. Regression analyses were used to define relationships between CCA LD, TD, GSM, and CVD risk factors. Cox proportional hazards models were used to assess relationships between LD, TD, and incident CVD events. Participants were mean (SD) 64 (10) years old. There were 791 cases with a CVD event over a 12-year median follow-up. The mean LD was 0.29 (0.20) mm. In multivariable models including age, sex, race/ethnicity, heart rate, and CVD risk factors, LD was associated positively with active smoking (β = 0.08, p < 0.001) and inversely with black (β = −0.08, p < 0.001), Chinese (β = −0.05, p < 0.001), and Hispanic (β = −0.04, p < 0.05) race/ethnicities relative to white individuals, heart rate (β = −0.03/10 beats/min, p < 0.001), and diastolic blood pressure (β = −0.01/5 mmHg, p < 0.05). In fully adjusted models, LD and TD were associated with GSM (p < 0.01), but neither predicted incident CVD events (LD: hazard ratio (HR) 0.77 [0.48 to 1.24], p = 0.3; TD: HR 1.12 [0.8 to 1.57], p = 0.5). CCA LD and TD are associated with race/ethnicity and CVD risk factors but not incident CVD events. LD and TD are not measures of arterial stiffness but their association with GSM suggests that lower LD and TD may be related to structural changes within the carotid arterial wall.
Keywords
Introduction
Arterial stiffness is tightly linked with hypertension and is associated with development of heart failure, stroke, myocardial infarction, and death.1–5 The Distensibility Coefficient (DC) and Young’s Elastic Modulus (YEM) are commonly used measurements of local arterial stiffness that can be used to quantify carotid artery compliance and elasticity.2,6 These measurements are well-established in the scientific literature7,8 and primarily rely on circumferential arterial or transverse displacement (TD); however, the formulae used to make these calculations assume that the longitudinal motion of the carotid artery is negligible compared to radial movement. 9
Recent advances in imaging technology using velocity vector imaging (VVI) now permit accurate and reproducible noninvasive measurements of carotid artery longitudinal displacement (LD) and TD using a two-dimensional speckle tracking algorithm;9–12 however, it is unclear what physiological phenomenon LD and TD measurements actually are characterizing. Published reports have presented conflicting ideas about whether LD represents a novel stiffness measure or a marker of shear stress along the endothelial layer of the arterial wall.10,13–16 There exists no substantial published research on TD, though intuitively it may be similar to traditional local measures of radial arterial stiffness like DC and YEM. If LD and TD are predictive of cardiovascular disease (CVD) events, these measures could be used to augment and improve upon local measures of arterial stiffness (DC and YEM) using ultrasound, which traditionally have not been as strong as systemic measures of arterial stiffness like pulse wave velocity (PWV).
We sought to determine associations of LD and TD with CVD risk factors, grayscale median (GSM; a measure of echolucency and an indicator of early arterial injury),17–19 and other measures of arterial stiffness (carotid DC and YEM, aortic DC) to further understand the causes and implications of carotid TD and LD and if carotid artery LD and TD could predict future CVD events in a large multi-ethnic cohort with extended follow-up.
Materials and methods
Study participants and design
The Multi-Ethnic Study of Atherosclerosis (MESA) is a large, prospective, cohort study investigating the prevalence, causes, and progression of subclinical CVD. The MESA is a population-based sample of 6814 men and women aged 45–84 years who were free of known CVD at baseline, recruited from six United States communities. The study objectives and design have been published previously. 20 The current analysis uses a case-cohort design that included all 791 cases within the MESA that had a CVD event (myocardial infarction, resuscitated cardiac arrest, definite angina followed by revascularization, stroke, stroke death, coronary heart disease (CHD), CHD death, other atherosclerotic death, other CVD death) over a median of 12 years of follow-up. A random sample of the entire MESA cohort (n = 1412) was selected as the cohort group. Using this design, some participants included in the random subcohort also were cases (n = 153). For purposes of the descriptive results in Table 1, we compared the cases to the portion of the random subcohort that are non-cases (n = 1259). The total sample size is thus 2050 participants (Figure 1). An advantage of a case-cohort design over a case-control design is that the selected subcohort is a random sample of the overall MESA population and can be used for analysis of several endpoints of interest. 21
Demographics and cardiovascular risk factors by case-cohort status.
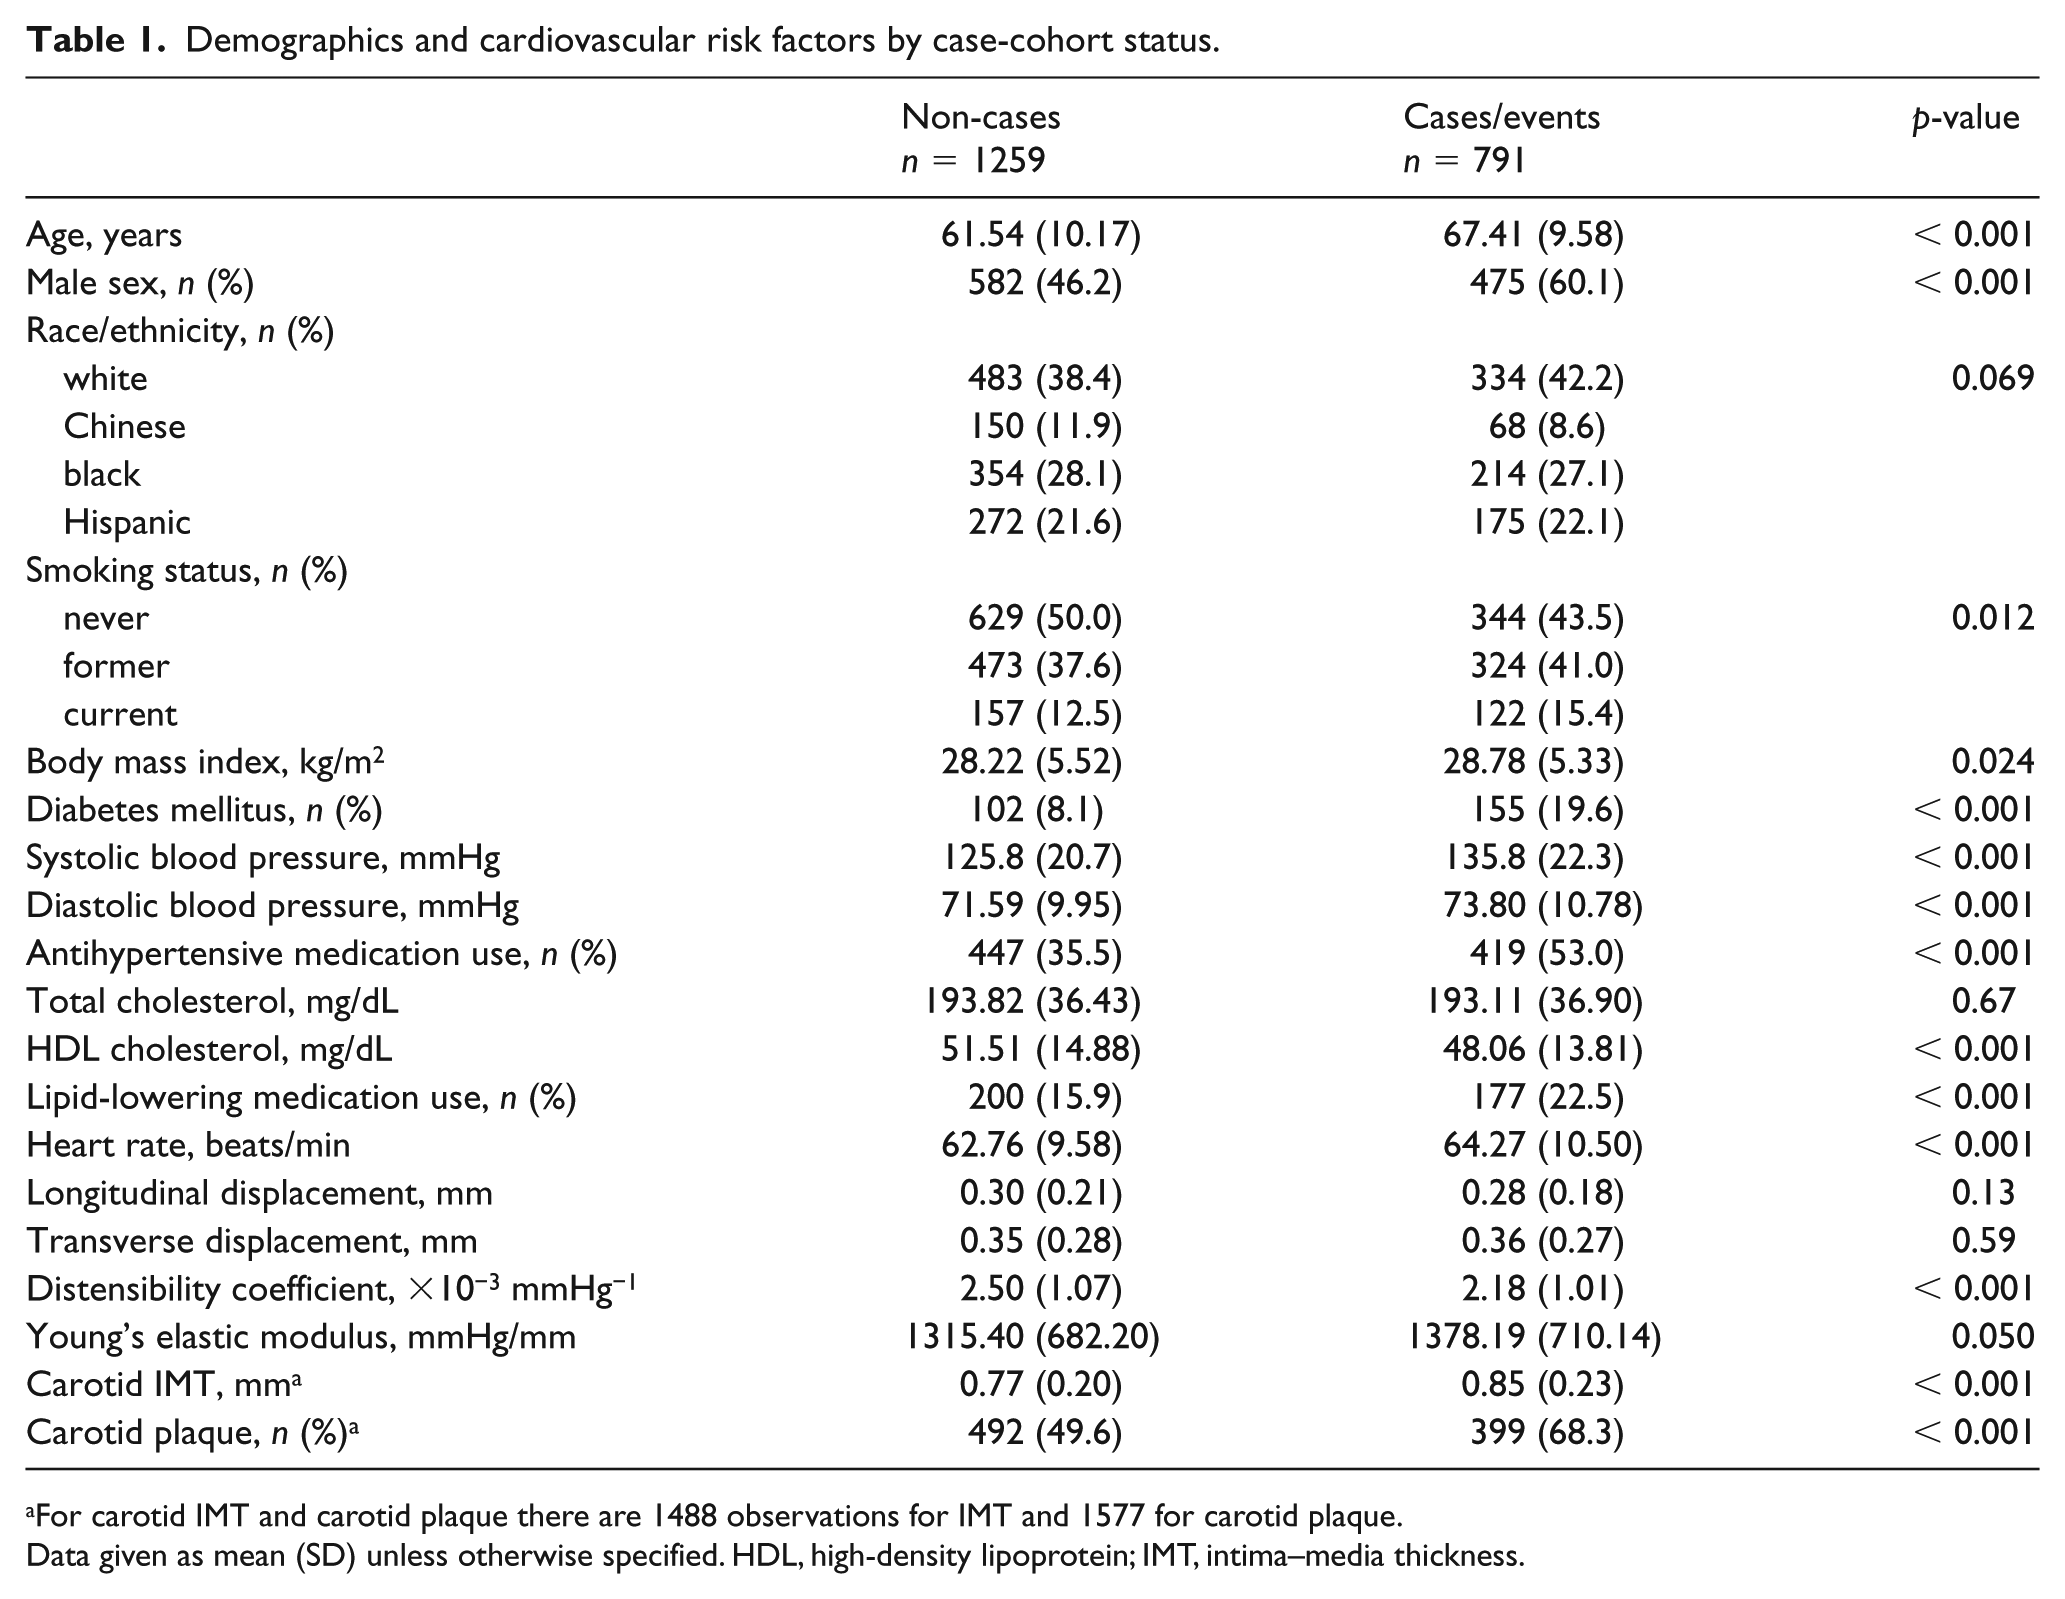
For carotid IMT and carotid plaque there are 1488 observations for IMT and 1577 for carotid plaque.
Data given as mean (SD) unless otherwise specified. HDL, high-density lipoprotein; IMT, intima–media thickness.
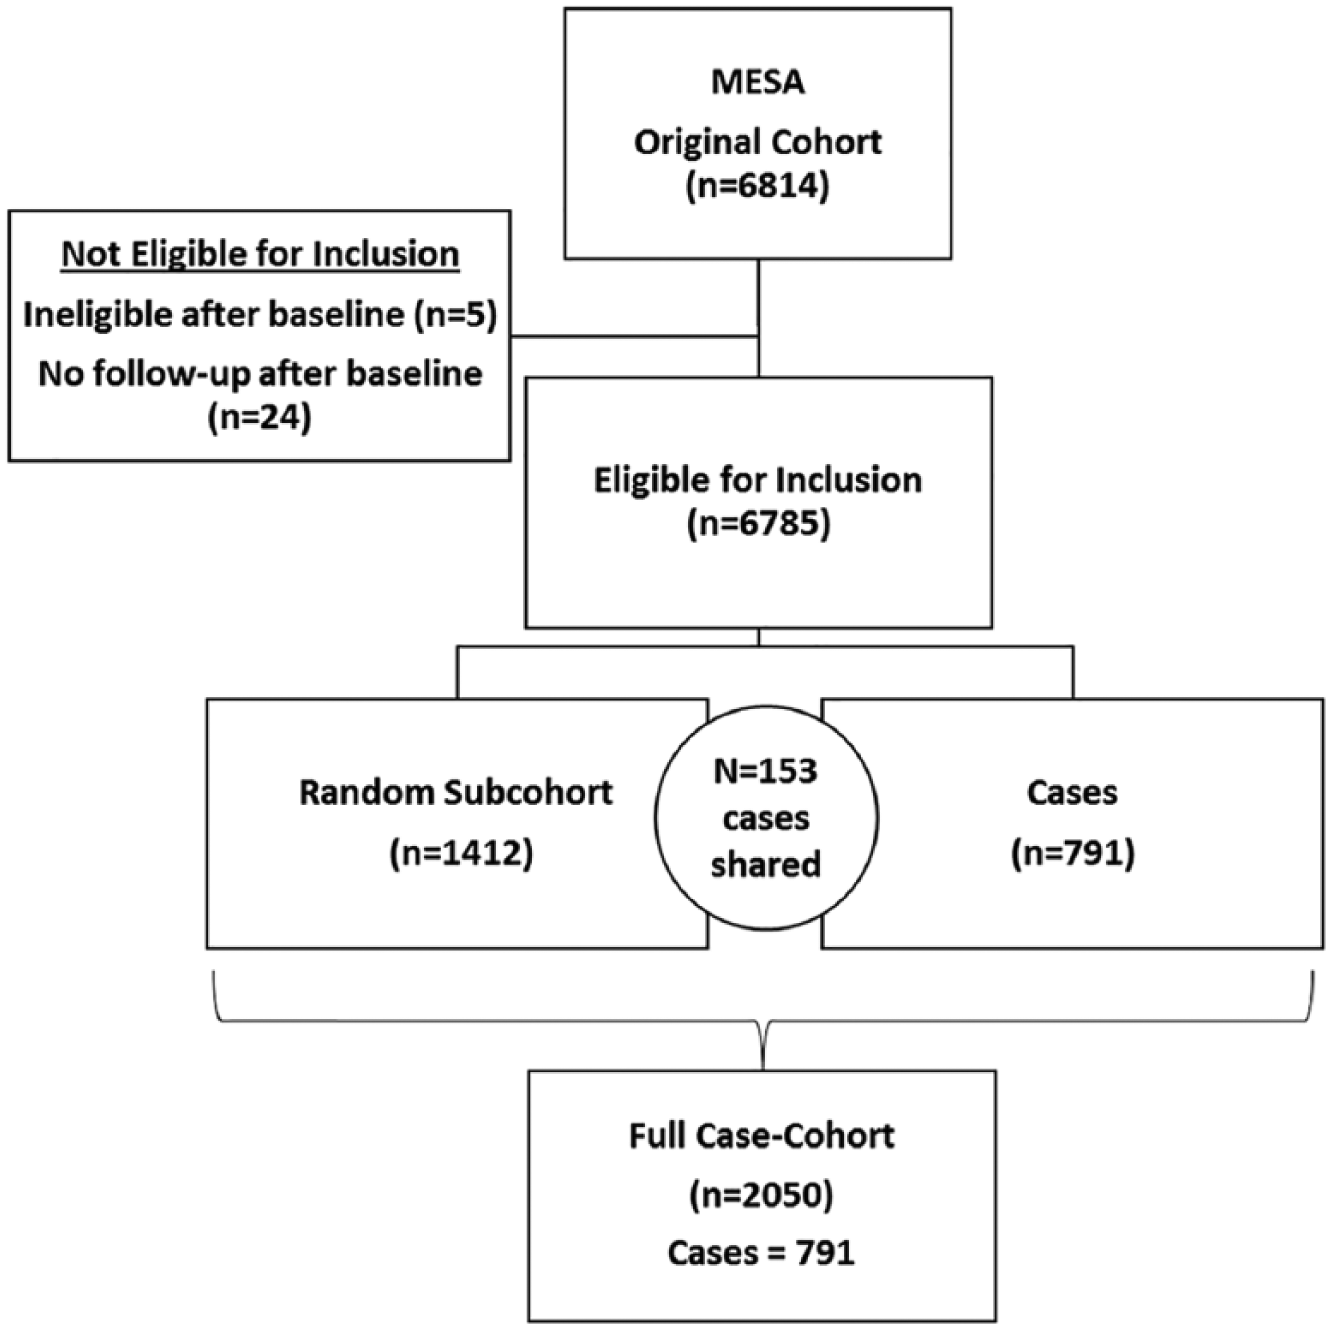
Description of the case-cohort design. MESA, Multi-Ethnic Study of Atherosclerosis.
All participants provided written informed consent. This study was approved by the Institutional Review Boards at all participating field centers, reading centers, and the coordinating center.
Measurement of longitudinal displacement and transverse displacement and grayscale median
The carotid imaging protocol for the MESA and our technique and protocol to measure carotid artery displacement have been described previously. 10 Our protocol was developed and validated using VVI analysis software (TomTec, Unterschleißheim, Germany). A region of interest was identified by measuring 0.5 cm caudal from the carotid bulb along the far wall of the distal common carotid artery (CCA), using an onscreen measuring tool (Microsoft Windows Ruler). Three additional points were placed 1.75 mm apart in a line extending caudally at the intima–media interface (Figure 2). Each point was tracked in both the longitudinal (LD) and radial/transverse (TD) plane across three to five cardiac cycles. The LD and TD measurements of the carotid artery were determined by measuring the absolute value of the total distance each point traveled during the cardiac cycle in the longitudinal (LD) and radial/transverse (TD). LD and TD were averaged for the three to five beats selected for tracing. Intra- and inter-reader variability to ensure reproducibility of this technique from the current lab have been previously reported. 10
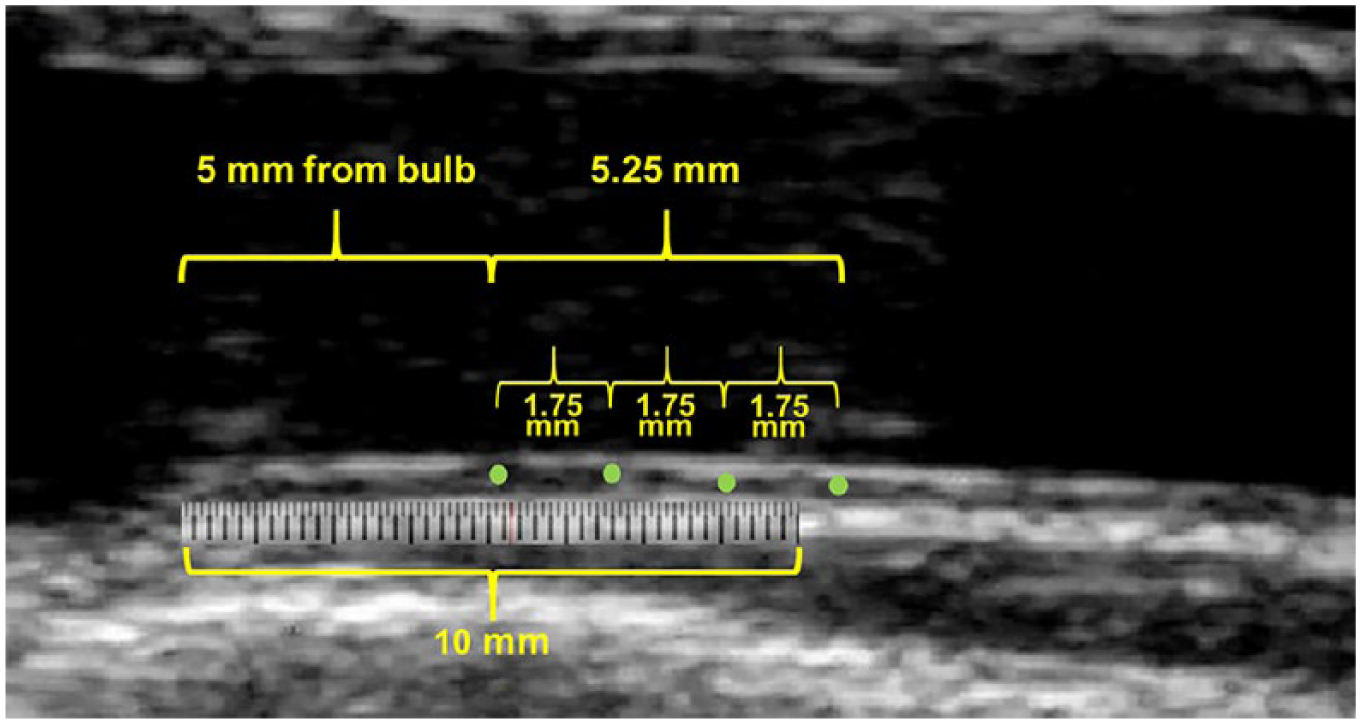
Measurement of carotid artery displacement. Image of the right CCA. The overlay schematic of the tracing point locations (green dots) are used for the determination of longitudinal displacement. A region of interest was identified by measuring 5 mm caudal from the carotid bulb along the far wall of the distal CCA, using an onscreen measuring tool (Microsoft Windows Ruler). Points were placed 1.75 mm apart, extending caudally. Each point was placed at the intima–media interface.
Measurement protocols for GSM also have been described previously.17,22,23 Image viewing software was used to convert the carotid ultrasound DICOM files into BITMAP images (AccessPoint; Freeland Systems, LLC, Alpharetta, GA, USA) that were normalized to assign the blackest area of the blood a grayscale value of 0 and the whitest area of the middle two-fourths of the adventitia a grayscale value of 190 and then were standardized to a uniform pixel density of 20/mm using LifeQ Medical Software (Nicosia, Cyprus).23–25 The distal 1.0 cm of the far wall of the right CCA was traced utilizing an online ruler tool to define the length of 1.00 cm. GSM of the CCA intima–media complex was calculated by taking the median gray level value within the traced region of interest in the arterial wall. 17
Traditional carotid artery stiffness measurements
Ultrasound also was used to measure carotid artery DC (10−3 mmHg−1) and YEM (mmHg).26,27 Systolic and diastolic diameters were determined as the largest and smallest diameters during the cardiac cycle. All measurements were performed in triplicate from two to three consecutive cardiac cycles to derive the mean internal diameter at peak systole and mean internal and external diameters at end-diastole using AccessPoint Web, version 3.0 (Freeland Systems, LLC). 27 Each of these measurements was calculated using standard formulae and have been previously described in detail within MESA.26–29
Cardiovascular disease events
Participants were followed from the baseline examination for a median of 12 years of follow-up. They, or a proxy, were contacted by telephone every 9–12 months to inquire about interim hospital admissions, CVD outpatient diagnoses, and deaths. Events were verified with death certificates and medical records. Two physicians, blinded to study data, independently reviewed and classified CVD events. In cases of disagreement, a mortality and morbidity committee determined the final classification. Criteria for MESA CVD events have been published previously. 30 A detailed description of the MESA follow-up methods is available at http://www.mesa-nhlbi.org.
Statistical analysis
For LD and TD, we performed a case-cohort analysis that defined cases as participants who had any CVD event as defined above. We designed our study using a case-cohort design to optimize power in a limited sample size. After excluding 29 participants who were ineligible for the MESA study or who had no follow-up data, 791 participants with CVD events were identified as cases (n = 153 identified in the random subcohort + 638 additional cases). GSM was measured in a separate random sample of participants who had one or more carotid plaques identified on ultrasound images. 17 Out of the 2050 participants in our present analysis, there was a subset of 723 participants with GSM measures that was included as exploratory analyses. Sample size selection was based on a range of possible effect sizes (1.1–1.5) comparing the highest tertile of LD to the lower tertiles from pilot data. 10 Assuming the censoring and event rates observed in MESA, detecting an effect size of 1.3 with > 85% power would require 18.5% of the full cohort to be randomly sampled into the subcohort. For efficiency, the completely random subsample of MESA participants used in the pilot data was also included in our total case-cohort sample of 2050. All analyses are weighted by the inverse of the sampling probability. For the cases, the selection probability is one; for the cohort, the sampling fraction was 21%. When using sampling weights, it is necessary to use robust standard error estimates to accurately model the variance. These analyses were conducted using the pweights option in Stata.
Results are reported as mean (SD) for continuous variables, or percentages for categorical variables. Differences between groups were evaluated with two-sided Student t-tests or chi-squared tests. Pearson correlations were used to define relationships between displacement, traditional CVD risk factors, and traditional measures of arterial stiffness (carotid artery DC and carotid artery YEM). Similar analyses were performed for GSM. Multivariable regression models were used to evaluate independent predictors of LD. Models were (1) unadjusted and (2) adjusted for age, race/ethnicity, sex, and traditional cardiovascular risk factors and hypertension medication use. Hazard ratios (HR) and 95% CIs of LD for CVD and CHD events were computed using Cox proportional hazards models with adjustment for age, sex, and race. To account for the sampling design, these models were weighted by the inverse of the sampling probability and robust standard errors were used. Inter-reader variability was assessed with correlation coefficients and Bland–Altman plots after randomly selecting and remeasuring 30 images from all six MESA sites and were excellent (LD: 0.953 [0.901–0.978]; TD: 0.995 (0.99–0.997). Statistical significance was set at p < 0.05. Stata Statistical Software, Release 15 (StataCorp, LLC, College Station, TX, USA) was used to perform all statistical analyses.
Results
Baseline characteristics
Participants were mean (SD) 64 (10) years old, 48% were female and the participants were ethnically and racially diverse (40% white, 28% black, 22% Hispanic, 10% Chinese). Baseline characteristics for cases and the randomly selected non-cases are presented in Table 1. As expected, cases were older (67.4 (9.6) vs 61.5 (10.2) years, p < 0.001) and more likely to be male (60.1% vs 46.2%, p < 0.001) than the non-cases. Race/ethnicity was reasonably matched between the two groups. Cases had higher blood pressure (135.8 (22.3)/73.8 (10.8) mmHg vs 125.8 (20.7)/71.6 (10.0) mmHg, p < 0.001) and were more likely to be taking antihypertensive medications (53.0% vs 35.5%, p < 0.001) than the non-cases. Traditional arterial stiffness measurements at baseline consistently were more abnormal in the cases compared to the non-cases (DC: 2.2 (1.0) × 10−3 mmHg−1 vs 2.5 (1.1) × 10−3 mmHg−1, p < 0.001; YEM: 1378.2 (710.1) vs 1315.4 (682.2) mmHg, p = 0.05).
Carotid displacement and CVD risk factors
At baseline, LD and TD were similar between the cases and the non-cases (LD: 0.28 (0.18) vs 0.30 (0.21) mm, p = 0.13; TD: 0.36 (0.27) vs 0.35 (0.28) mm, p = 0.6). In unadjusted models, LD and TD were both inversely associated with male sex (LD: β = −0.033, p = 0.004; TD: β = −0.084, p < 0.001). LD was also inversely associated with all non-white ethnicities (β = −0.059, p < 0.001) while TD was inversely associated with only Chinese ethnicity (β = −0.07, p = 0.008, compared to white ethnicity). Similar findings were seen with regard to male sex in the fully adjusted multivariable models that included age, sex, race/ethnicity, heart rate, and CVD risk factors (as shown in Table 2). After adjustment, LD and TD were also both associated positively with active smoking (LD: β = 0.08, p < 0.001; TD: β = 0.06, p < 0.01). LD was weakly inversely associated with heart rate (β = −0.03/10 beats/min, p < 0.001) and diastolic blood pressure (β = −0.01/5 mmHg, p < 0.05) and TD was weakly inversely associated with antihypertensive medication use (β = −0.04, p = 0.04) and with total cholesterol (β = −0.005/10 mg/dL, p = 0.021). Neither LD nor TD were associated with age or systolic blood pressure (Table 2).
Adjusted cross-sectional associations with carotid longitudinal and transverse displacement.
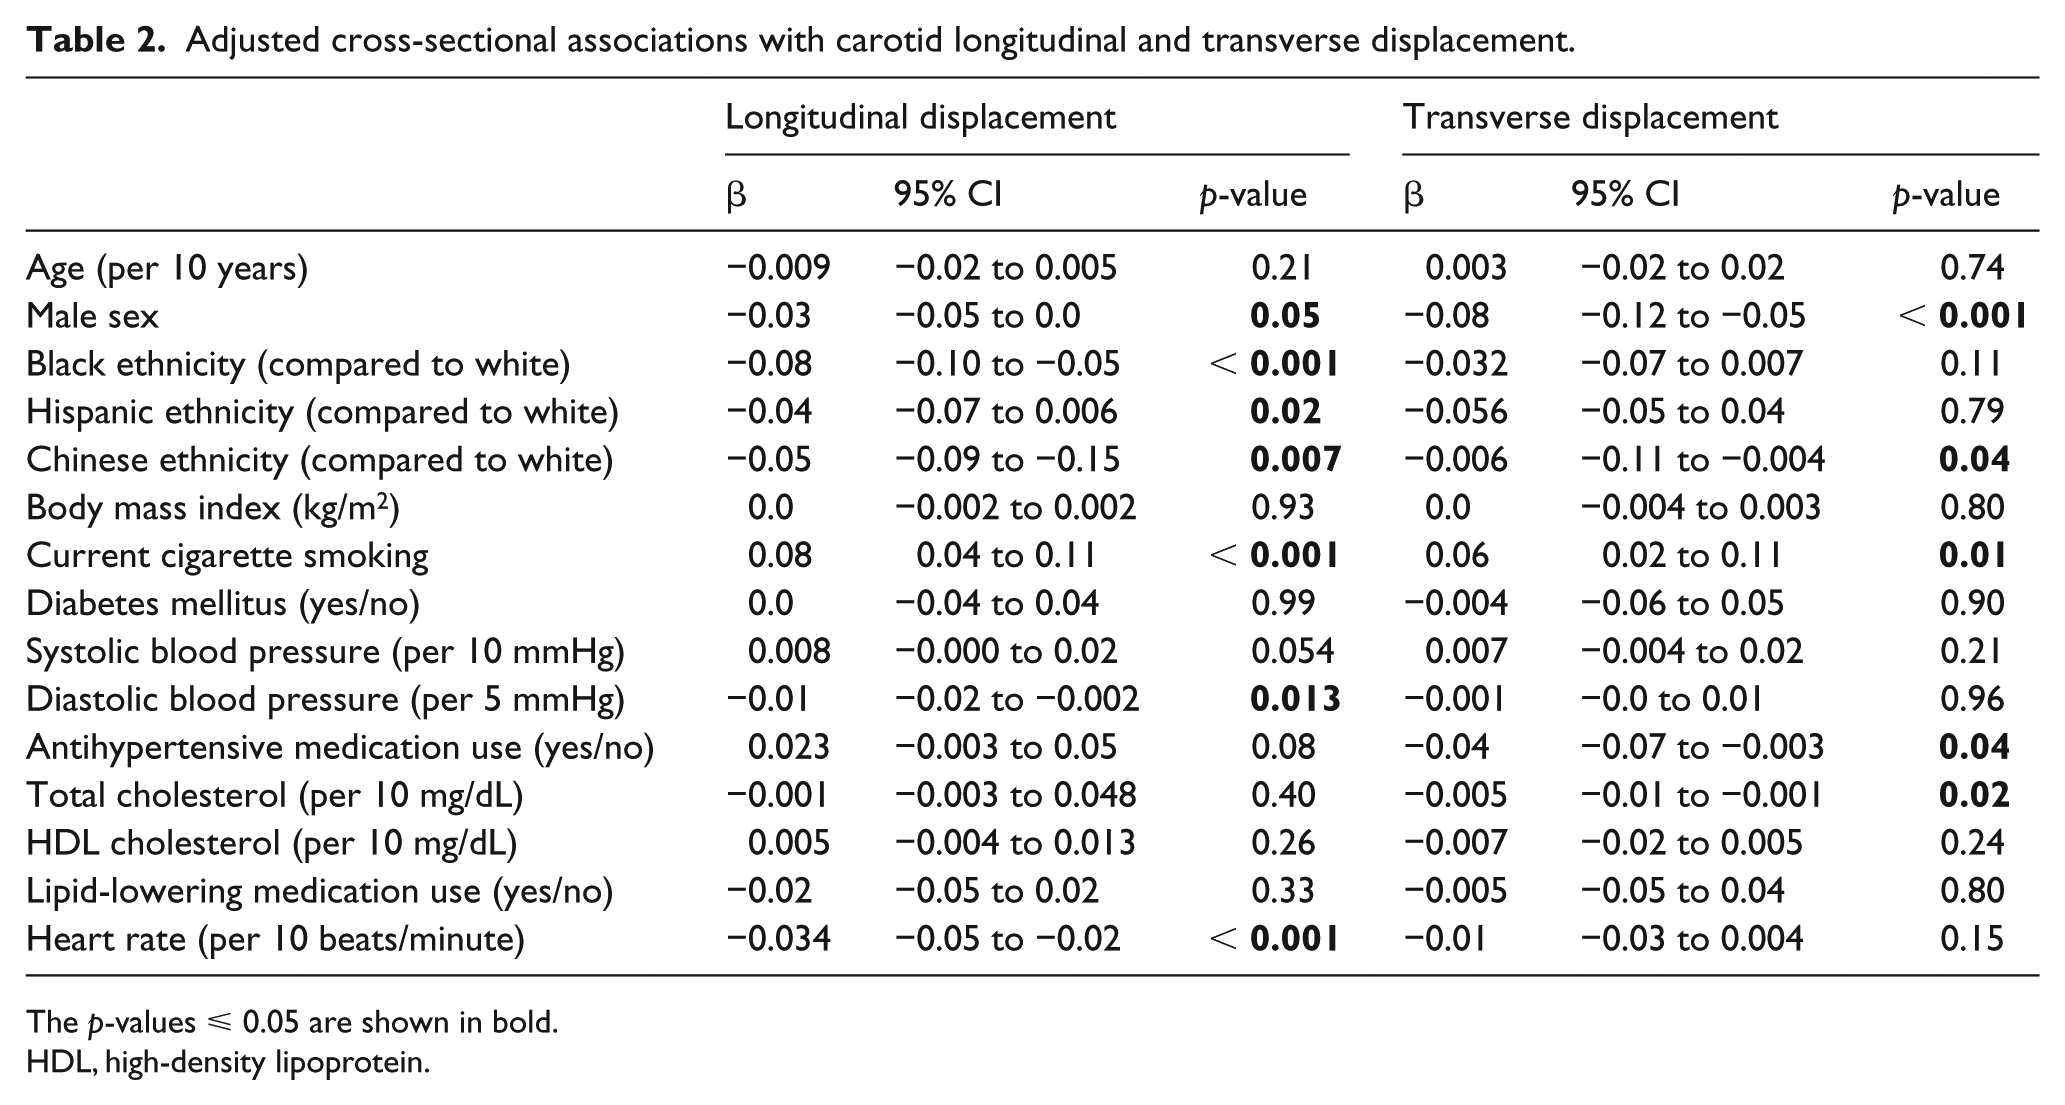
The p-values ⩽ 0.05 are shown in bold.
HDL, high-density lipoprotein.
Carotid displacement and other carotid artery stiffness measures
Baseline LD was positively but weakly correlated with DC (r = 0.08, p = 0.003) and aortic distensibility (r = 0.08, p = 0.027) and correlated inversely with YEM (r = −0.09, p = 0.002). More prominent correlations were seen with TD and DC (r = 0.12, p < 0.001) and YEM (r = −0.14, p < 0.001).
In the subset of participants with grayscale measures (n = 723), LD was not correlated significantly with GSM (r = 0.05, p = 0.17) in the unadjusted model, but TD showed greater positive correlations with GSM (r = 0.21, p < 0.001). After adjusting for age, sex, and race/ethnicity, there was a borderline association with LD and GSM (β = 1.58 [–0.13 to 3.29]; p = 0.069). The associations between LD and GSM were greatest in the fully adjusted model that included carotid intima–media thickness and plaque presence (β = 2.78 [0.68 to 4.74]; p = 0.009). There also were significant associations with TD and GSM (all p < 0.001) in all adjusted models, as shown in Table 3.
Multivariable regression models of longitudinal and transverse displacement by grayscale median. a
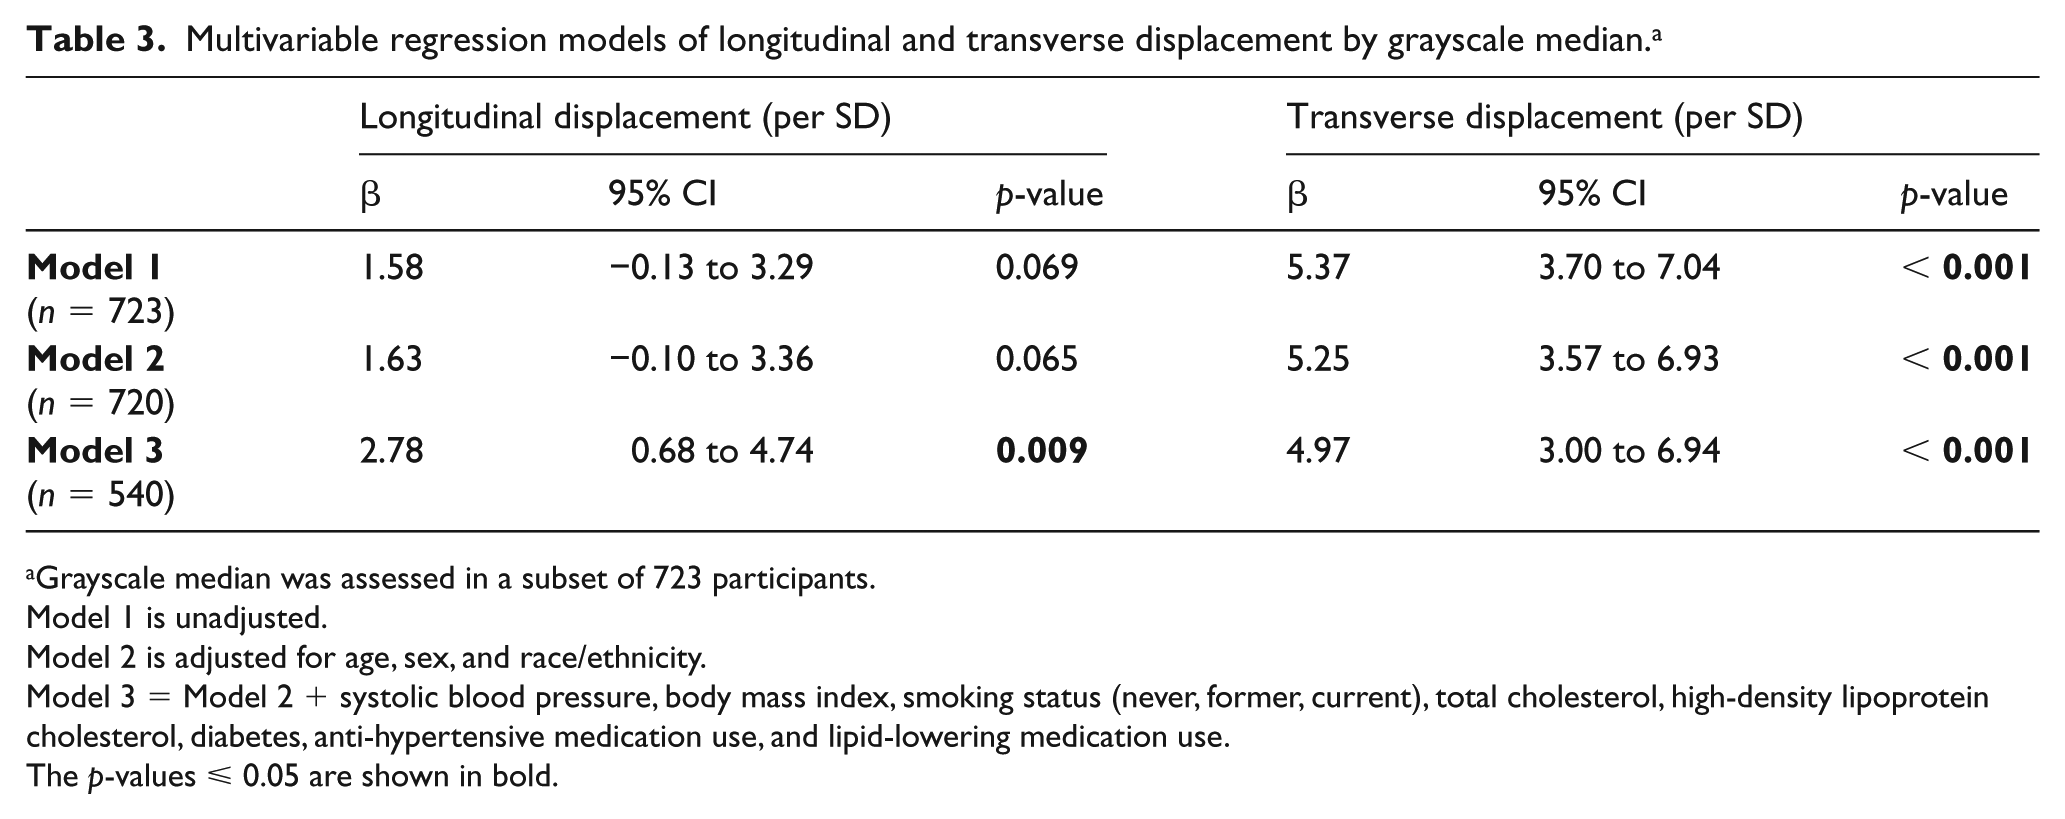
Grayscale median was assessed in a subset of 723 participants.
Model 1 is unadjusted.
Model 2 is adjusted for age, sex, and race/ethnicity.
Model 3 = Model 2 + systolic blood pressure, body mass index, smoking status (never, former, current), total cholesterol, high-density lipoprotein cholesterol, diabetes, anti-hypertensive medication use, and lipid-lowering medication use.
The p-values ⩽ 0.05 are shown in bold.
Carotid displacement and future CHD and CVD events
Over a median of 12 years of follow-up, there were 791 CVD events, 538 CHD events, and 236 stroke events, as shown in Table 4. In adjusted models of LD as a continuous variable, there was no significant association between LD and risk of incident CVD events (hazard ratio (HR): 0.77 [0.48 to 1.24]; p = 0.3), CHD events (HR: 0.79 [0.46 to 1.36]; p = 0.4), or stroke events (HR: 0.92 [0.49 to 1.75]; p = 0.8). Similarly, in adjusted models, there were no significant associations with TD and CVD events (HR: 1.12 [0.8 to 1.57]; p = 0.5), CHD events (HR: 1.07 [0.73 to 1.58]; p = 0.7), or stroke events (HR: 1.16 [0.71 to 1.91]; p = 0.6). Kaplan–Meier curves for incident CVD events by quartiles of LD and TD are shown in Figure 3.
Risk factor-adjusted cox regression models for predicting incident events.
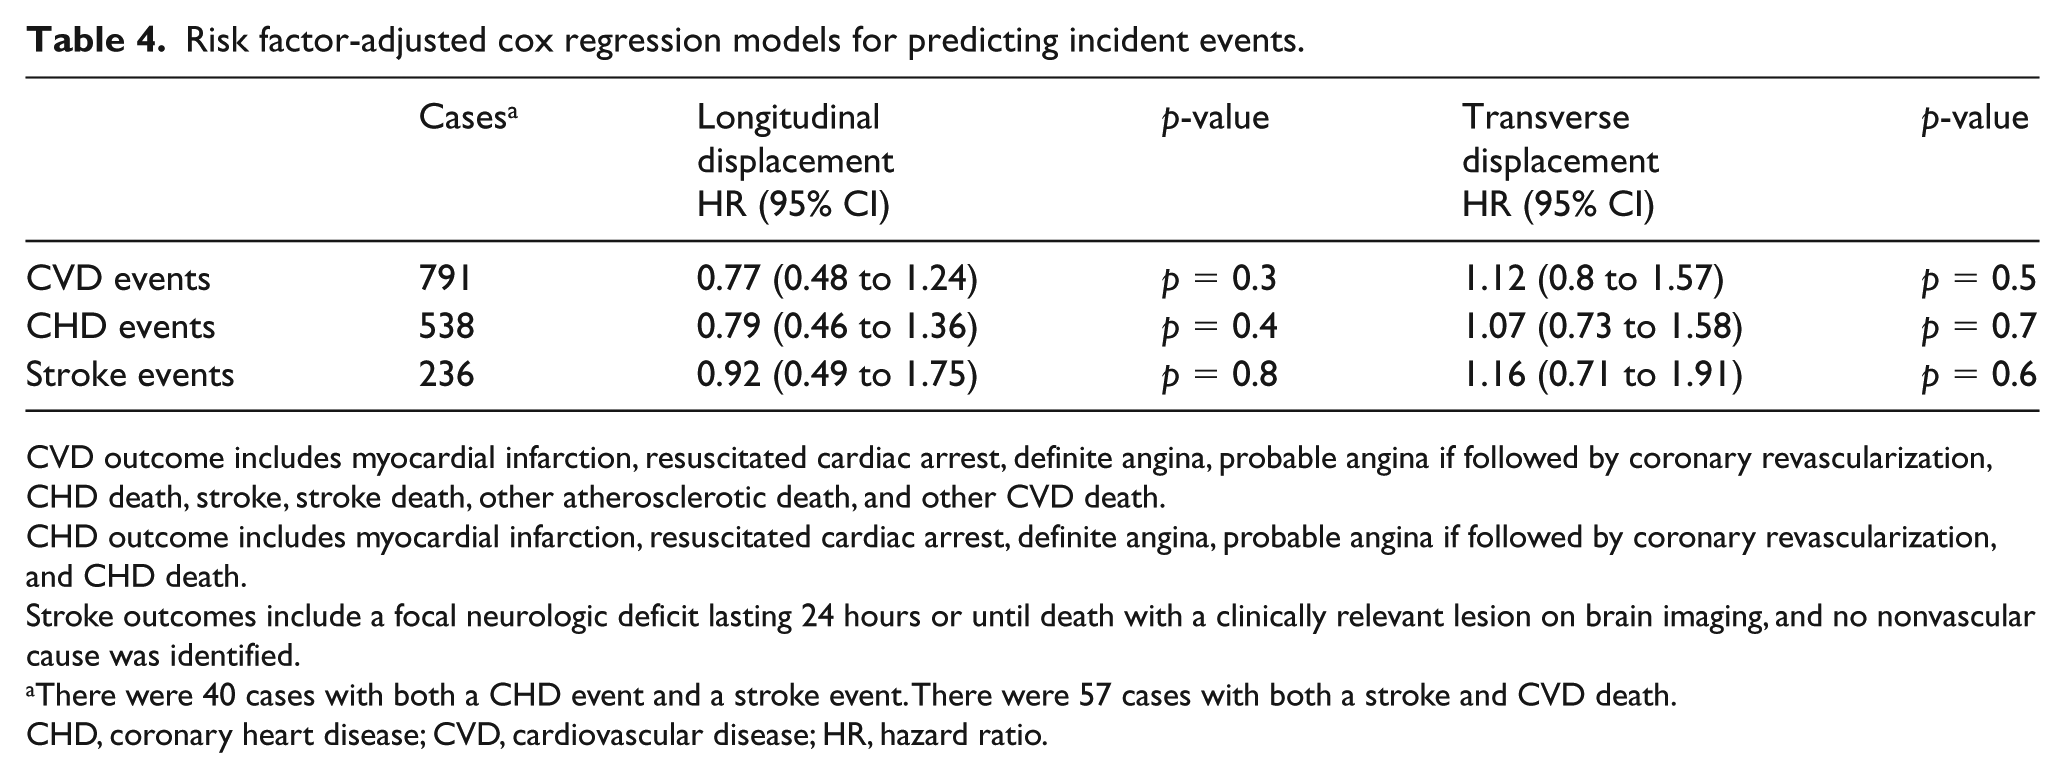
CVD outcome includes myocardial infarction, resuscitated cardiac arrest, definite angina, probable angina if followed by coronary revascularization, CHD death, stroke, stroke death, other atherosclerotic death, and other CVD death.
CHD outcome includes myocardial infarction, resuscitated cardiac arrest, definite angina, probable angina if followed by coronary revascularization, and CHD death.
Stroke outcomes include a focal neurologic deficit lasting 24 hours or until death with a clinically relevant lesion on brain imaging, and no nonvascular cause was identified.
There were 40 cases with both a CHD event and a stroke event. There were 57 cases with both a stroke and CVD death.
CHD, coronary heart disease; CVD, cardiovascular disease; HR, hazard ratio.
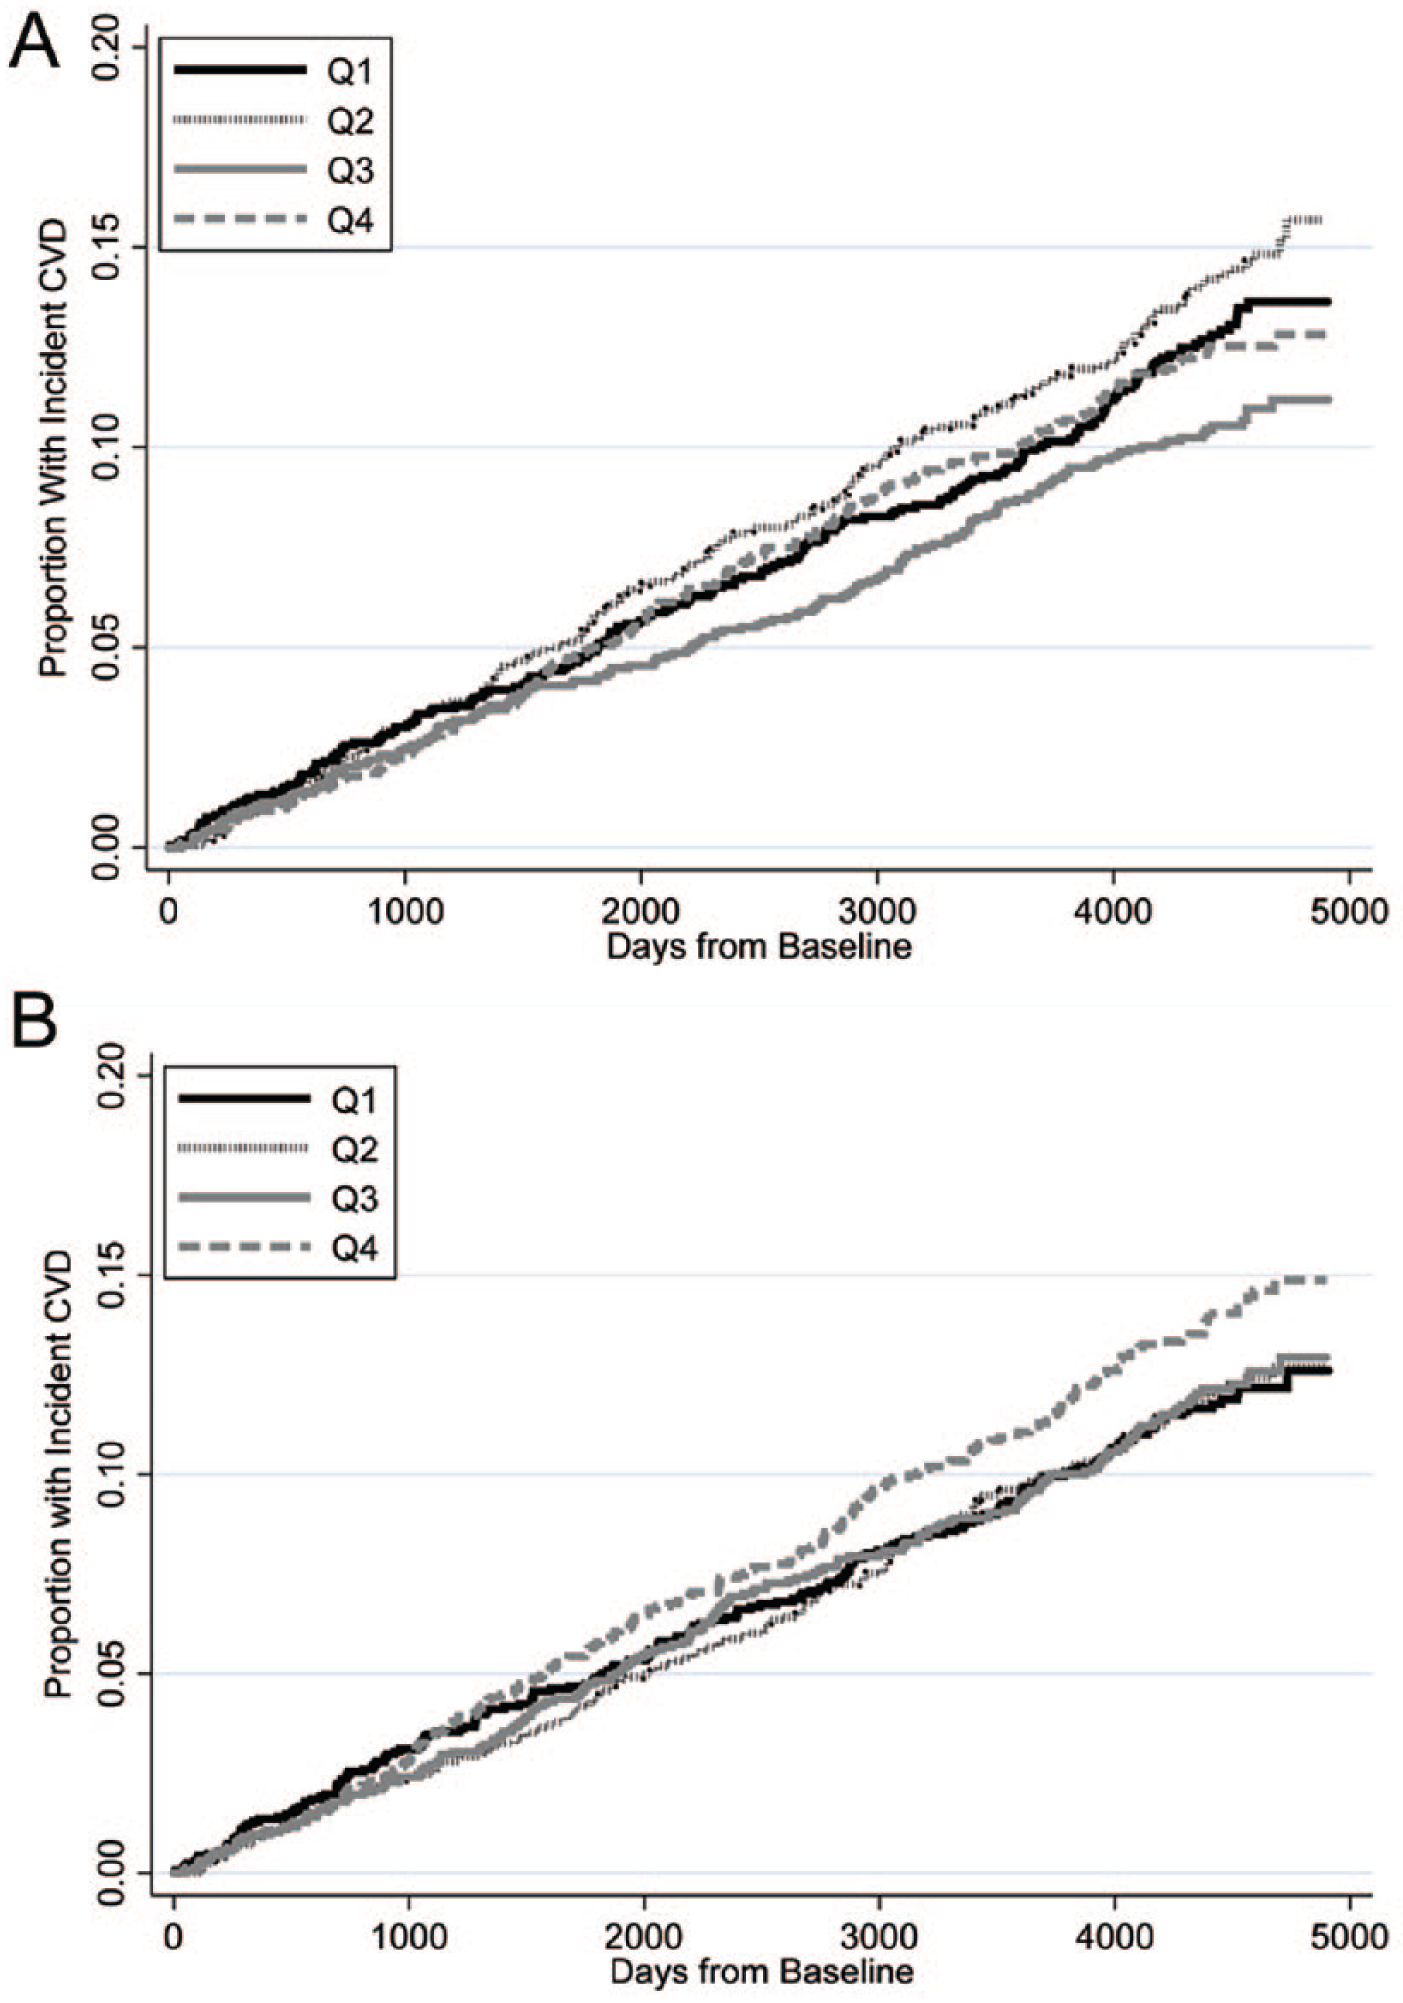
Kaplan–Meier curves for incident CVD events by quartiles of CCA longitudinal displacement (A) and transverse displacement (B).
Discussion
Local arterial stiffness measures primarily have been used in epidemiology and physiology studies to assess CVD risk and associations with hypertension and changes in blood pressure. Recent advances in ultrasound image analysis permit direct measurement of LD and TD in the carotid artery using VVI technology.3,4,10 With the advent of vascular ultrasound speckle tracking, the small distances of both LD and TD can be directly and accurately measured throughout the cardiac cycle. 10 Despite the capability of measuring carotid arterial wall motion with propagation of blood, there are still significant discrepancies in the published literature regarding associations between LD, TD, CVD risk factors, and their ability to predict CVD events.10,13,14,31–34 There also is significant variability in LD and TD measurement techniques. Most of the studies that evaluated longitudinal arterial motion or LD have a much smaller sample size than the current study10,14–16,33,35,36 and no studies to our knowledge, besides our pilot study, 10 have evaluated LD or TD in a multi-ethnic cohort with extended follow-up. Better understanding of the associations and predictive capabilities of these novel measures is critical because commonly used measures of local arterial stiffness such as DC and YEM simplify the complex three-dimensional structure of the carotid artery or aorta into a two-dimensional representation by assessing changes in the long-axis vessel diameter between systole and diastole. DC and YEM calculations assume that any non-radial motion (i.e. LD) of the vessel wall is completely negligible so they are not included in the formulae used to calculate these measurements. 9 Unlike other prior studies that evaluated LD and TD, our analysis used a standardized, validated, and reproducible approach to measure carotid displacement with a free-trace algorithm that makes no geometric assumptions about the carotid artery.
We analyzed images from a large, prospective, longitudinal study with over a dozen years of follow-up in a novel case-cohort fashion. This design allowed us to analyze baseline associations with LD and TD and to fully capitalize on the considerable number of CVD events that occurred during 12 years of follow-up. Similar to our pilot study, 10 we found inverse associations with all non-Caucasian ethnicities and LD but only Chinese ethnicity was associated inversely with TD. We also found inverse associations between male sex and both LD and TD as well as modest inverse associations of LD with resting heart rate and diastolic blood pressure. Our observations are consistent with previously reported associations between LD, TD, and male sex, 37 certain ethnicities,27,38 blood pressure,38,39 and YEM and DC, as well as with increased CVD risk. 40 However, in our study, neither LD nor TD were associated with age or systolic blood pressure, which are two of the strongest predictors of traditional arterial stiffness measures. This is a striking contrast between carotid DC and YEM, which are routinely correlated with advancing age and hypertension in MESA.27,38
These findings, combined with the weak or non-existent correlations between carotid artery LD and TD with carotid artery DC and carotid artery YEM, challenge previous notions that LD or TD are measuring arterial stiffness.13,14,31,32 Since LD and TD are not measuring arterial stiffness or compliance, it is less surprising that they did not predict CVD events in those without baseline CVD. The absence of significant associations with traditional CVD risk factors such as advancing age and hypertension and more traditional stiffness measures like DC and YEM, combined with the lack of the ability of either LD or TD to predict CVD events is of major importance to the field. Our study confirms that longitudinal (non-radial) arterial motion can be safely ignored when calculating the elasticity and distensibility of the carotid artery.
Despite the absence of predictive value or associations with measures of arterial stiffness, LD and TD may provide insight into arterial wall tissue characteristics. We found significant associations between LD, TD, and GSM, a marker of early arterial injury. 17 While these associations may support the hypothesis that LD and TD could be markers of shear forces on the carotid arterial wall that cause injury at the cellular level, these differences did not predict CVD events over 12 years of follow-up. An alternative but compelling explanation is that the differences in LD and TD are unrelated to shear stress and the associations between LD and TD measurements with GSM are related to differences in the ability of the software to detect and track matched speckles over time in images that had differences in echogenicity during the image acquisition. 34 Images with lower tissue echogenicity have less reliable speckle tracking. 34 We attempted to minimize these differences by normalizing the darkest area in each image to a GSM value of 0, but the ability to track speckles using block matching is greater when tissue echogenicity is high. 34
Limitations
These data are from a large, well-established prospective longitudinal study. Though the data were analyzed in a case-cohort fashion, it still is an observational study with potential unaccounted for biases and confounding. Image quality and reproducibility were excellent; however, several factors may affect LD and TD measurements, including respiratory variation and transducer probe movement. In nearly all individuals, carotid ultrasound loops were long enough that these artifacts could be mitigated. While there were a large number of events, it is possible that the sampling power of the study was not strong enough to detect very small associations with CVD events and carotid displacement. Also, GSM was measured only in a subset of participants, which could impact the generalizability of our findings regarding associations of LD and TD with GSM. Although the ultrasound machines and transducers were the same and the presets used during carotid artery image acquisition were similar at each site, differences in echogenicity can impact the ability to accurately track speckles and could account for some of the associations between displacement measures and GSM.
Conclusions
Carotid displacement measurements (LD and TD) are associated with race and ethnicity, but not age or systolic blood pressure or traditional measures of arterial stiffness. More importantly, neither LD nor TD reliably predict incident CVD events, confirming that non-radial motion can be safely ignored when calculating other measures of local carotid arterial stiffness.
Footnotes
Acknowledgements
Declaration of conflicting interests
The authors declared the following potential conflicts of interest with respect to the research, authorship, and/or publication of this article: CC Mitchell receives royalties for textbook chapters from Elsevier and Wolters-Kluwer and research grants from WL Gore & Associates (paid to University of Wisconsin Madison). JH Stein receives royalties from the Wisconsin Alumni Research Foundation for a patent related to carotid artery wall thickness and arterial age (not used in this study). The other authors have no disclosures.
Funding
The authors disclosed receipt of the following financial support for the research, authorship, and/or publication of this article: this work was supported by American Heart Association Midwest Grant-In-Aid 16GRNT29090009; contracts HHSN268201500003I, N01-HC-95159, N01-HC-95160, N01-HC-95161, N01-HC-95162, N01-HC-95163, N01-HC-95164, N01-HC-95165, N01-HC-95166, N01-HC-95167, N01-HC-95168, and N01-HC-95169 from the National Heart, Lung, and Blood Institute; grant ES015915 from the National Institute of Environmental Health Sciences; and grants RR024156 and RR025005 from the National Center for Research Resources. This publication was developed under Science To Achieve Results (STAR) research assistance agreement RD831697 from the Environmental Protection Agency. It has not been formally reviewed by the Environmental Protection Agency. The views expressed in this document are solely those of the authors. The Environmental Protection Agency does not endorse any products or commercial services mentioned in this publication.