
Abstract
Diabetes mellitus (DM) and chronic kidney disease (CKD) separately are known to facilitate the progression of medial arterial calcification (MAC) in patients with symptomatic peripheral artery disease (PAD), but their combined effect on MAC and associated mediators of calcification is not well studied. The association of MAC and calcification inducer bone morphogenetic protein (BMP-2) and inhibitor fetuin-A, with PAD, is well known. Our aim was to investigate the association of MAC with alterations in BMP-2 and fetuin-A protein expression in patients with PAD with DM and/or CKD. Peripheral artery plaques (50) collected during directional atherectomy from symptomatic patients with PAD were evaluated, grouped into no-DM/no-CKD (n = 14), DM alone (n = 10), CKD alone (n = 12), and DM+CKD (n = 14). MAC density was evaluated using hematoxylin and eosin, and alizarin red stain. Analysis of inflammation, neovascularization, BMP-2 and fetuin-A protein density was performed by immunohistochemistry. MAC density, inflammation grade and neovessel content were significantly higher in DM+CKD versus no-DM/no-CKD and CKD (p < 0.01). BMP-2 protein density was significantly higher in DM+CKD versus all other groups (p < 0.01), whereas fetuin-A protein density was significantly lower in DM+CKD versus all other groups (p < 0.001). The combined presence of DM+CKD may be associated with MAC severity in PAD plaques more so than DM or CKD alone, as illustrated in this study, where levels of calcification mediators BMP-2 and fetuin-A protein were related most robustly to DM+CKD. Further understanding of mechanisms involved in mediating calcification and their association with DM and CKD may be useful in improving management and developing therapeutic interventions.
Keywords
Introduction
Diabetes mellitus (DM) is a major risk factor to develop peripheral artery disease (PAD). DM associated with chronic kidney disease (CKD) may further accelerate PAD progression. 1 Although intimal arterial calcification is studied in the arterial wall limited to the intimal layer above the internal elastic lamellar layer (IEL), medial arterial calcification (MAC) in the medial layer below the IEL is not well characterized in endarterectomy specimens in PAD. Endarterectomy specimens include the intimal layer along with the medial layer. In PAD, MAC indicates advanced lesion progression. 2 Furthermore, MAC is associated with increased cardiovascular mortality in patients with DM, up to 1.5 to 4.2-fold.3,4
Histological features of plaques from patients with DM and PAD are characterized by increased inflammation, neovascularization, and intraplaque hemorrhage.5–7 In addition, CKD also enhances macrophage infiltration and plaque angiogenesis. 8 Furthermore, dystrophic calcification, including intimal and MAC, may contribute to disease progression, impaired plaque remodeling, loss of elasticity, and luminal occlusion.
Although intimal calcification is well documented, the role of medial calcification and ossification in patients with PAD with both DM and CKD has not been well characterized. Dystrophic MAC may be associated with a homeostasis imbalance of calcification inducers and inhibitors, including bone morphogenetic protein-2 (BMP-2) and fetuin-A protein. 9 The majority of these proteins have calcium and apatite binding properties and accumulate in areas of vascular calcification, where they may serve a variety of functions including regulation of apatite crystal nucleation and growth. 10
This study is not designed to comment on the role of CKD or DM, which may directly alter MAC via calcification mediators, rather to investigate their association.
Methods
Specimen collection and processing
Atherectomy specimens collected from superficial femoral artery from patients with symptomatic PAD with and without DM and/or CKD from February 2008 to April 2010 were obtained from a pathology bio-bank repository for evaluation. Patients were grouped as patients with symptomatic PAD and ‘no-DM/no-CKD’ (n = 14), ‘DM alone’ (n = 12), ‘CKD alone’ (n = 10), and ‘DM+CKD’ (n = 14). None of the patients was receiving dialysis and all were below the class III CKD category as per the National Kidney Foundation classification. 11 Exclusion criteria included cancer, terminal illness, pregnancy and age < 18 years old. All the study materials were totally blinded for the pathologist and study observers. This study conforms to the Declaration of Helsinki and was approved by the Investigational Review Board of the Icahn School of Medicine at Mount Sinai, New York. All participants gave written informed consent.
Atherectomy specimens from superficial femoral artery (weighing 25–100 mg) were collected at the time of intervention using the SilverHawk Plaque Excision System (FoxHollow Technologies, Redwood City, CA, USA) from 50 patients with symptomatic PAD, with and without DM and/or CKD. The plaque specimens were washed in saline solution and fixed in 10% buffered formalin and then processed into paraffin blocks. Multiple plaque fragments (5–20) were obtained from each patient.
Quantification of medial arterial calcification
Hematoxylin and eosin (H&E) staining was used for plaque characterization to screen for the presence or absence of lipid gruel, intra-plaque hemorrhage and organized thrombus. Calcification appears as amorphous dark bluish-purple granules when stained by H&E stain. Calcification was scored as present or absent in the intimal and medial layers of the peripheral plaques. The percentage incidence of the presence of calcification in the intima and media was calculated among the total plaques by evaluating 20 high-power fields (HPF) from each group. (Percentage (%) of calcification positive fields.)
Alizarin red stain was used to analyze reddish orange calcium stained areas, which were traced using computerized planimetry and measured in the intima and media. Calcium density was calculated by dividing the area occupied by alizarin red calcium by the total plaque area under 20× magnification; n = 20 HPF per group. Images were acquired and analyzed using an Olympus BX50 microscope and Zedec QuantIm software. (Arbitrary units (arb. unit) – alizarin red positive stain area/HPF.)
Quantification of inflammation and neovascularization
Formalin-fixed paraffin embedded sections were stained with a mouse monoclonal antibody against human CD68/CD3 (Dako Inc., Santa Clara, CA, USA) linked to a red chromogen for inflammation, and a mouse monoclonal antibody against human CD34 (Dako Inc.) for neovascularization linked to a blue chromogen using double-label immunohistochemistry as previously published. 12 Double-label immunostaining with CD68/CD3 in red chromogen was used to grade inflammation and quantified using planimetry microscopy incorporated with Zedec QuantIm software (Olympus BX50) with a high-power objective (40×); inflammation was graded as follows: score 0 = mild inflammation (0–5 inflammatory cells), score 1 = moderate inflammation (6–25 inflammatory cells), score 2 = severe inflammation (more than 25 inflammatory cells). (Score of total inflammatory cells/plaque.)
Double-label immunostaining with CD34 in blue chromogen was used to quantify neovessel in the intimal and medial layers of peripheral plaques. Using a high-power microscope objective (40×), neovessels were manually counted in the intimal and medial layers and enumerated together as total neovessels per plaque. (Total number of microvessels/plaque.)
Quantification of bone morphogenetic protein-2 and fetuin-A protein
Diaminobenzidine (DAB) label immunochemistry was performed using a specific primary mouse monoclonal antibody for BMP-2 protein at 1:100 dilutions (ABCAM Inc., Cambridge, MA, USA) and a mouse monoclonal primary antibody for fetuin-A protein at 1:100 dilutions (ABCAM Inc.) adopting appropriate secondary antibodies (Elite Vectastain; Vector Lab Inc., Burlingame, CA, USA). The immunostained slides with BMP-2 and fetuin-A were used to measure the positive (BMP-2) and negative (fetuin-A) regulators of calcification. Appropriate positive (human colon tissue was used for BMP-2 antibody; human liver tissue was used for fetuin-A antibody) and mouse negative controls (Dako Inc.) were used in all immunochemistry protocols. The density of BMP-2 and fetuin-A were measured by counting the total positively stained cells in the intima and media of peripheral plaques and dividing the total number of BMP-2/fetuin-A positive stained cells by the total plaque area measured per HPF. (Arbitrary units (arb. unit) – BMP-2/fetuin-A positive stain cells/HPF.)
Analysis for the vascular smooth muscle cells (SMC) expressing BMP-2 and fetuin-A protein was performed in a subgroup of atherectomy specimens by quantifying the number of α-Smooth Muscle Actin (SMA)-expressing cells that coexpress BMP-2 or fetuin-A. Primary antibodies against the following antigens were used: rabbit polyclonal α-SMA (PA1-37024 – Thermo Fisher Scientific, Waltham MA, USA; 1:100 dilution), mouse monoclonal α-SMA (FITC-F3777 – Sigma Aldrich, St. Louis MO, USA; 1:500 dilution), mouse monoclonal BMP-2 (ab6285 – ABCAM Inc.; 1:100 dilution), and fetuin-A (NBP1-91192 – Novus Biologicals, Centennial CO, USA; 1:200 dilution). Additionally, controls were included in parallel by substituting the primary antibody for immunoglobulin G (IgG) or specific IgG isotypes from the same species and at the same final concentration as the primary antibody. Secondary antibodies donkey anti-mouse Alexa Fluor 488 or anti-rabbit Alexa Fluor 594 (A-21202 and A-21207, respectively – Themo Fisher Scientific; 1:500 dilution) were used. Mounting medium containing DAPI (H-1200 – Vector Labs Inc.) was then applied. Immunofluorescence images were obtained using an EVOS FL microscope (Thermo Fisher Scientific). Quantification of co-expression of α-SMA and BMP-2 or α-SMA and fetuin-A was performed in a blinded fashion by counting the α-SMA cells positive for either BMP-2 (8–16 HPF of view per group) or fetuin-A (9–11 HPF of view per group) and dividing by the total number of cells in the same field view; this was presented as percentage positive BMP-2 or fetuin-A; the same amount of slides were included from each patient. Analysis of the percentage of signal co-expression was done using ImageJ software (National Institutes of Health, Bethesda, MD, USA). (Percentage (%) of co-positive cells/plaque.)
Statistical analysis
Data are presented as mean ± SD, or percentages for frequency data. Comparisons between groups were performed using univariate analysis of variance with age as a covariate and Bonferroni’s post hoc test for multiple comparisons. Age was included as a covariate for the analyses of dependent variables because of its significant correlation with the grouping variables. Statistical significance was set at the nominal p < 0.05 level. All analyses were performed using IBM SPSS Statistics, Version 20 (IBM Corp., Armonk, NY, USA).
Results
The distribution of demographic and clinical parameters including sex, body mass index (BMI), hypertension, coronary artery disease, and smoking was similar among the groups; only mean age showed differences, with the youngest population (65 ± 6 years) for the DM group and the oldest (78 ± 6 years) in the CKD group (p = 0.003, DM vs CKD) (Table 1); to obviate the differences between the age groups, analysis was performed adjusting age for all comparisons presented in this study. As expected, mean estimated glomerular filtration rate (eGFR) was significantly lower and mean creatinine levels significantly higher in the two groups with CKD patients compared to the no-DM/no-CKD and DM only groups. Similarly, significantly higher levels of fasting serum glucose and HbA1C (p < 0.001) were recorded in the two groups with diabetic patients compared to no-DM/no-CKD and CKD only groups. Intimal calcification had a higher occurrence in DM+CKD (21.4%) followed by CKD alone (16.7%), and DM alone (10%); there was no intimal calcification in the no-DM/no-CKD specimens. The occurrence of medial calcification was highest in DM+CKD (100%), followed by DM alone (80%), CKD alone (75%), and no-DM/no-CKD (43%) (Figure 1A–I). Medial calcium density was significantly higher in patients with both DM and CKD (DM+CKD, p = 0.003 vs no-DM/no-CKD; p = NS vs DM and p = 0.027 vs CKD) (Table 2, Figure 1A–I). Inflammation grade was significantly higher among patients with DM and CKD (DM+CKD, p < 0.001 vs no-DM/no-CKD; p = NS vs DM and p = 0.001 vs CKD) (Table 2, Figure 2A–E). Neovascularization density was significantly higher in DM and CKD (DM+CKD, p < 0.001 vs no-DM/no-CKD; p < 0.001 vs DM and p < 0.001 vs CKD) (Table 2, Figure 2A–E). BMP-2 protein density was higher in the intima and media among patients with DM and CKD (DM+CKD, p < 0.001 vs no-DM/no-CKD; p < 0.001 vs DM and p < 0.002 vs CKD) (Table 2, Figure 3A–E). Conversely, fetuin-A protein density shows a progressive decrease in the intima and media in patients with DM and/or CKD (DM+CKD, p < 0.001 vs no-DM/no-CKD; p < 0.001 vs DM and p < 0.001 vs CKD) (Table 2, Figure 4A–E). BMP-2 protein expression in SMCs, identified by immunofluorescence, was higher in the intima and media of atherectomy specimens from patients with DM and CKD (DM+CKD, p = < 0.001 vs no-DM/no-CKD; p = < 0.001 vs DM and p = 0.04 vs CKD) (Table 2, Figure 5A–E, Supplemental Figure 1). Conversely, fetuin-A protein expression in SMCs shows a significant decrease in the intima and media in patients with DM and CKD (DM+CKD, p < 0.001 vs no-DM/no-CKD; p < 0.001 vs DM and p < 0.001 vs CKD) (Table 2, Figure 6A–E, Supplimental Figure 1).
Demographics and clinical characteristics.
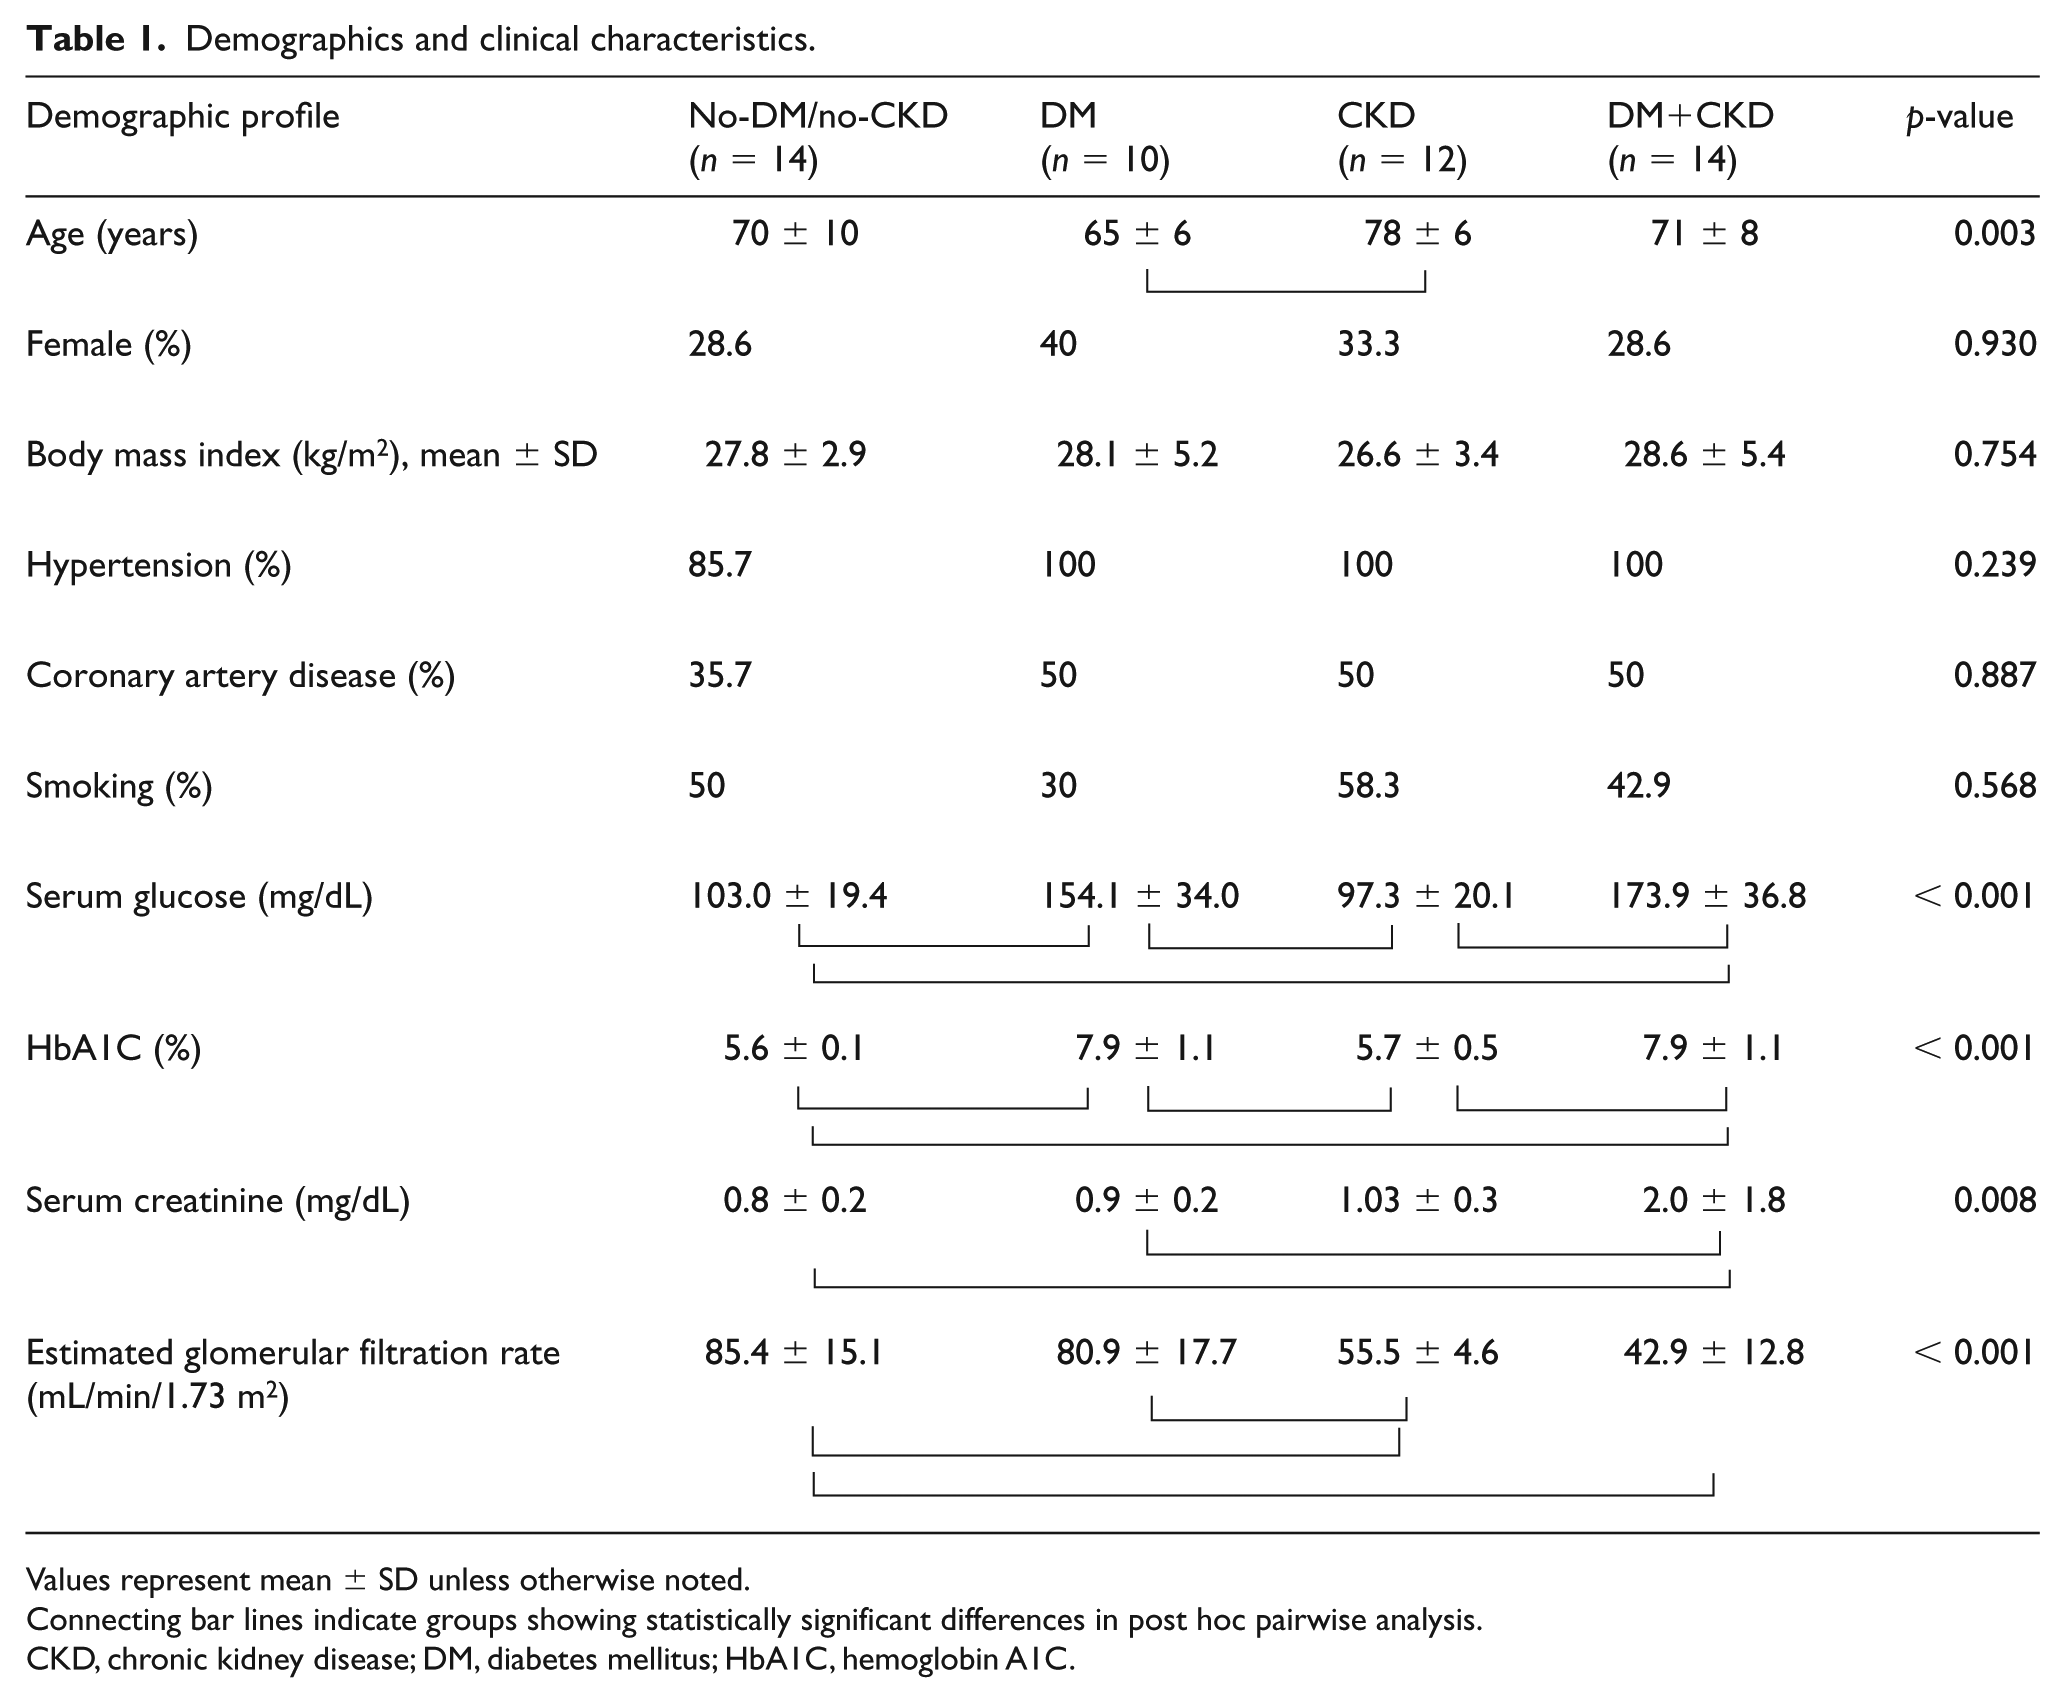
Values represent mean ± SD unless otherwise noted.
Connecting bar lines indicate groups showing statistically significant differences in post hoc pairwise analysis.
CKD, chronic kidney disease; DM, diabetes mellitus; HbA1C, hemoglobin A1C.
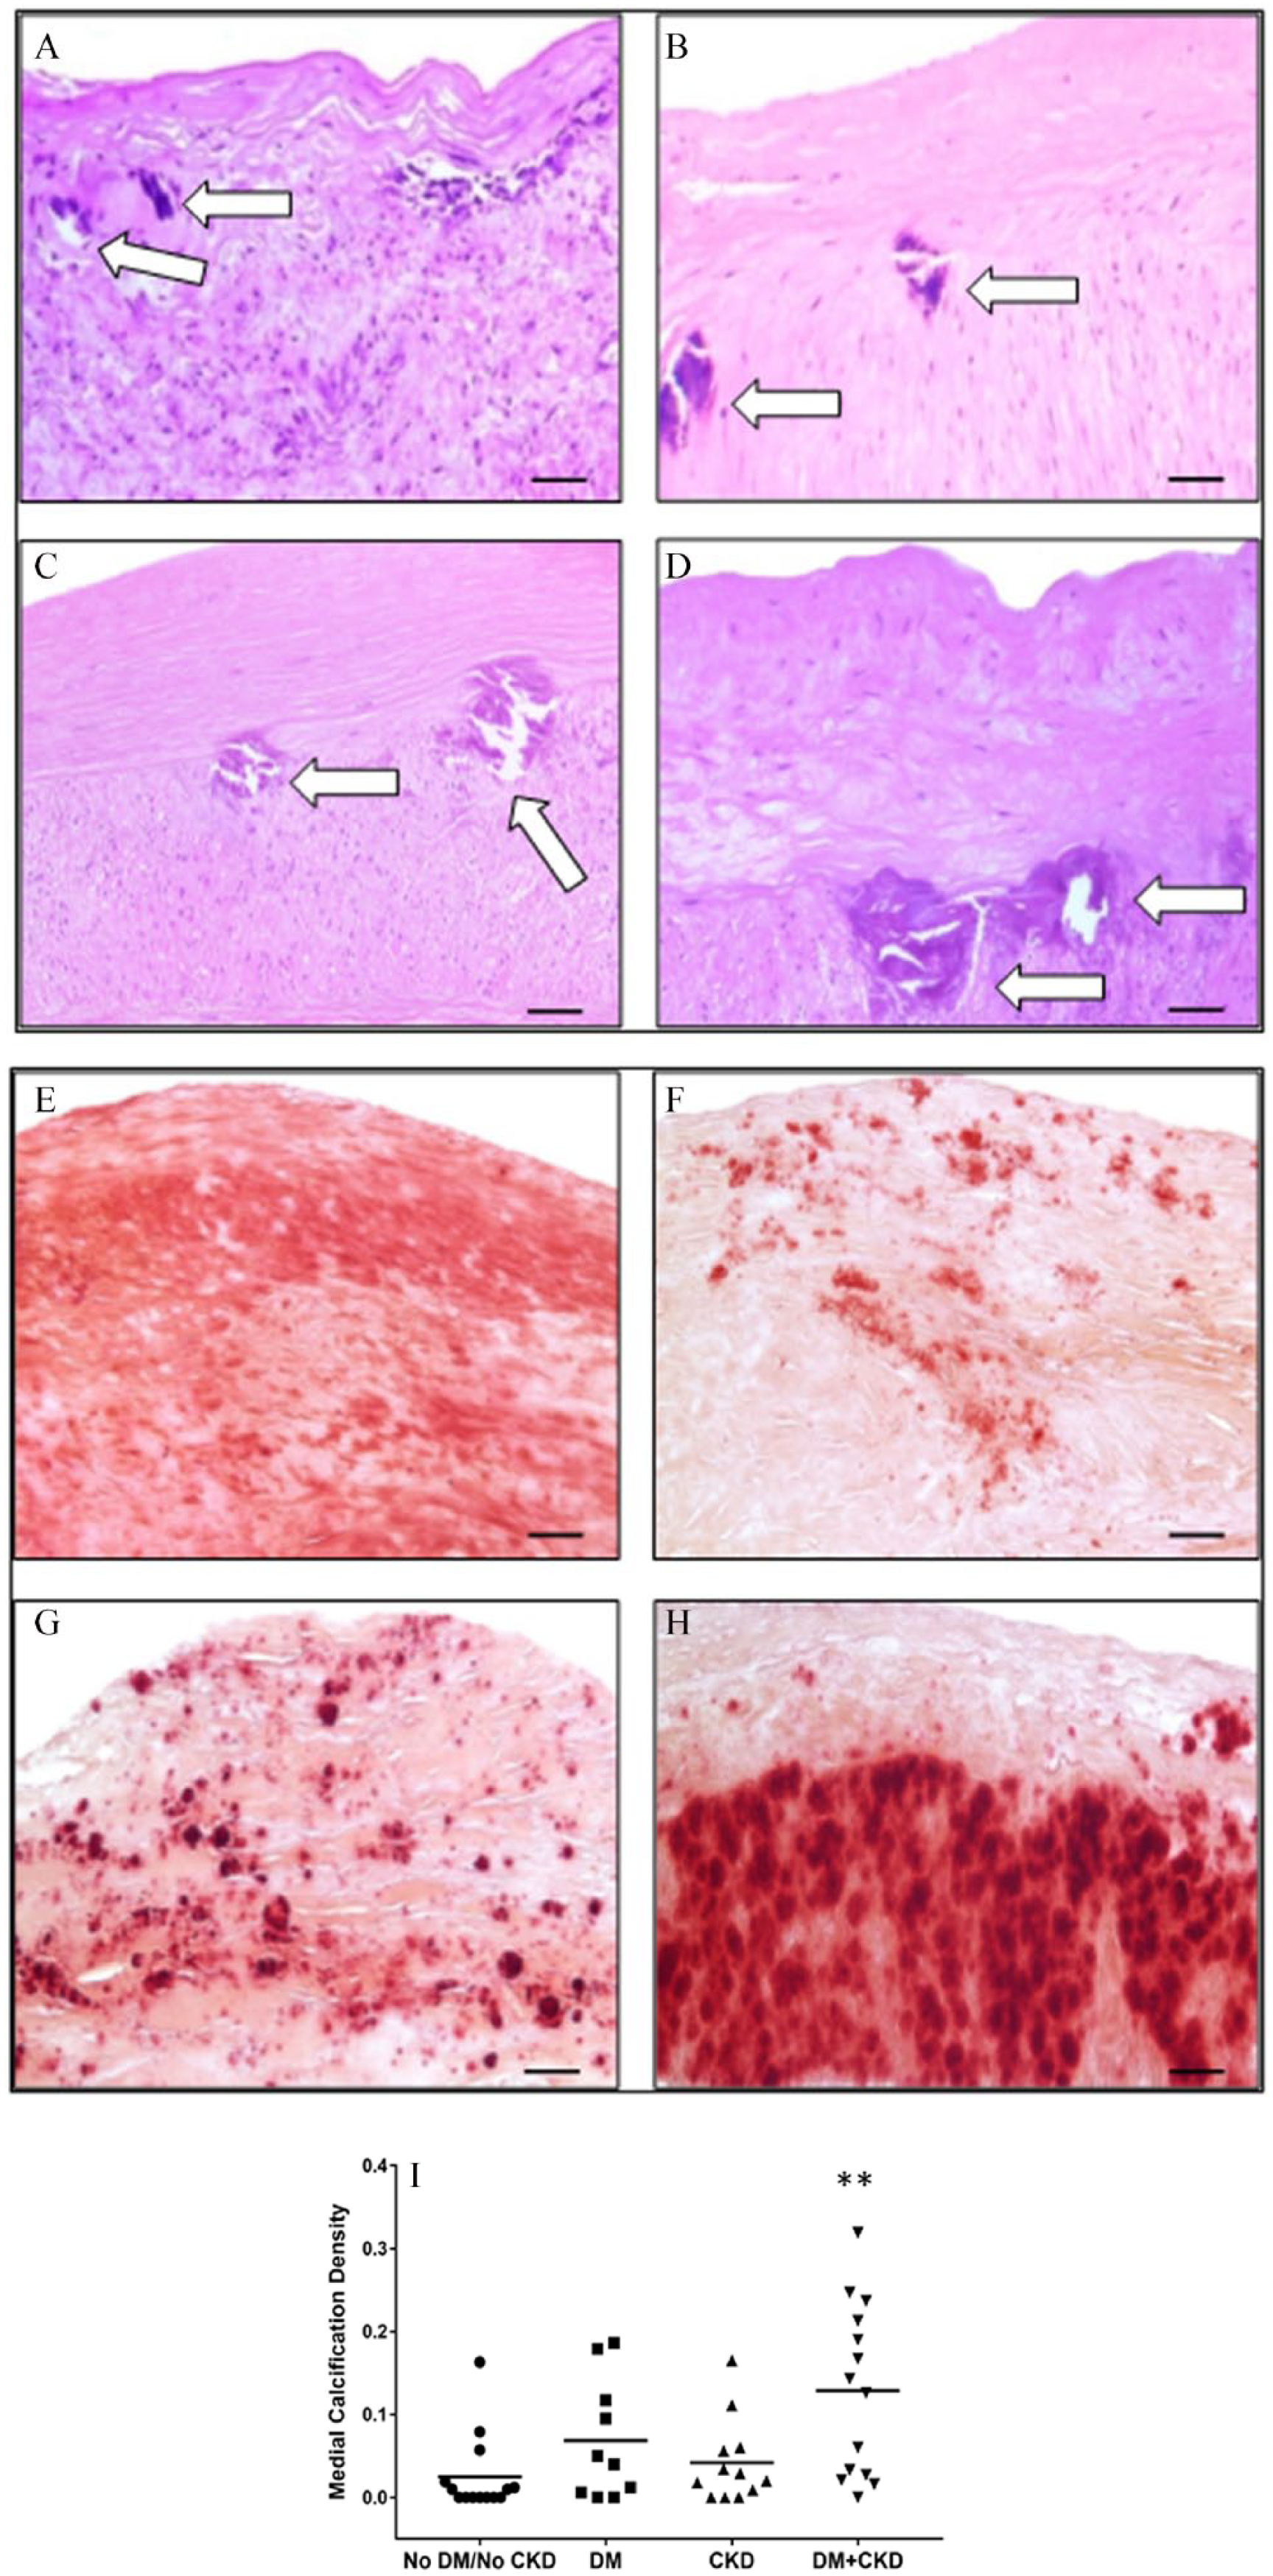
Presence of medial calcification in atheroma plaques. Hematoxylin and eosin stained sections show the presence of medial calcification (white arrows indicate calcification) in plaques from patients without DM or CKD (A), with DM only (B), with CKD only (C), and with DM+CKD (D) (20× magnification, scale bars = 50 μm). Alizarin red stained sections from peripheral plaques showing MAC (red-orange stain) in plaques from patients without DM or CKD (E), with DM only (F), with CKD only (G), and with DM+CKD (H) (20× magnification, scale bars = 50 μm). (I) Scattergram of the medial calcification density illustrating the extent of medial calcification density among groups.
Histopathological profiles in the groups.
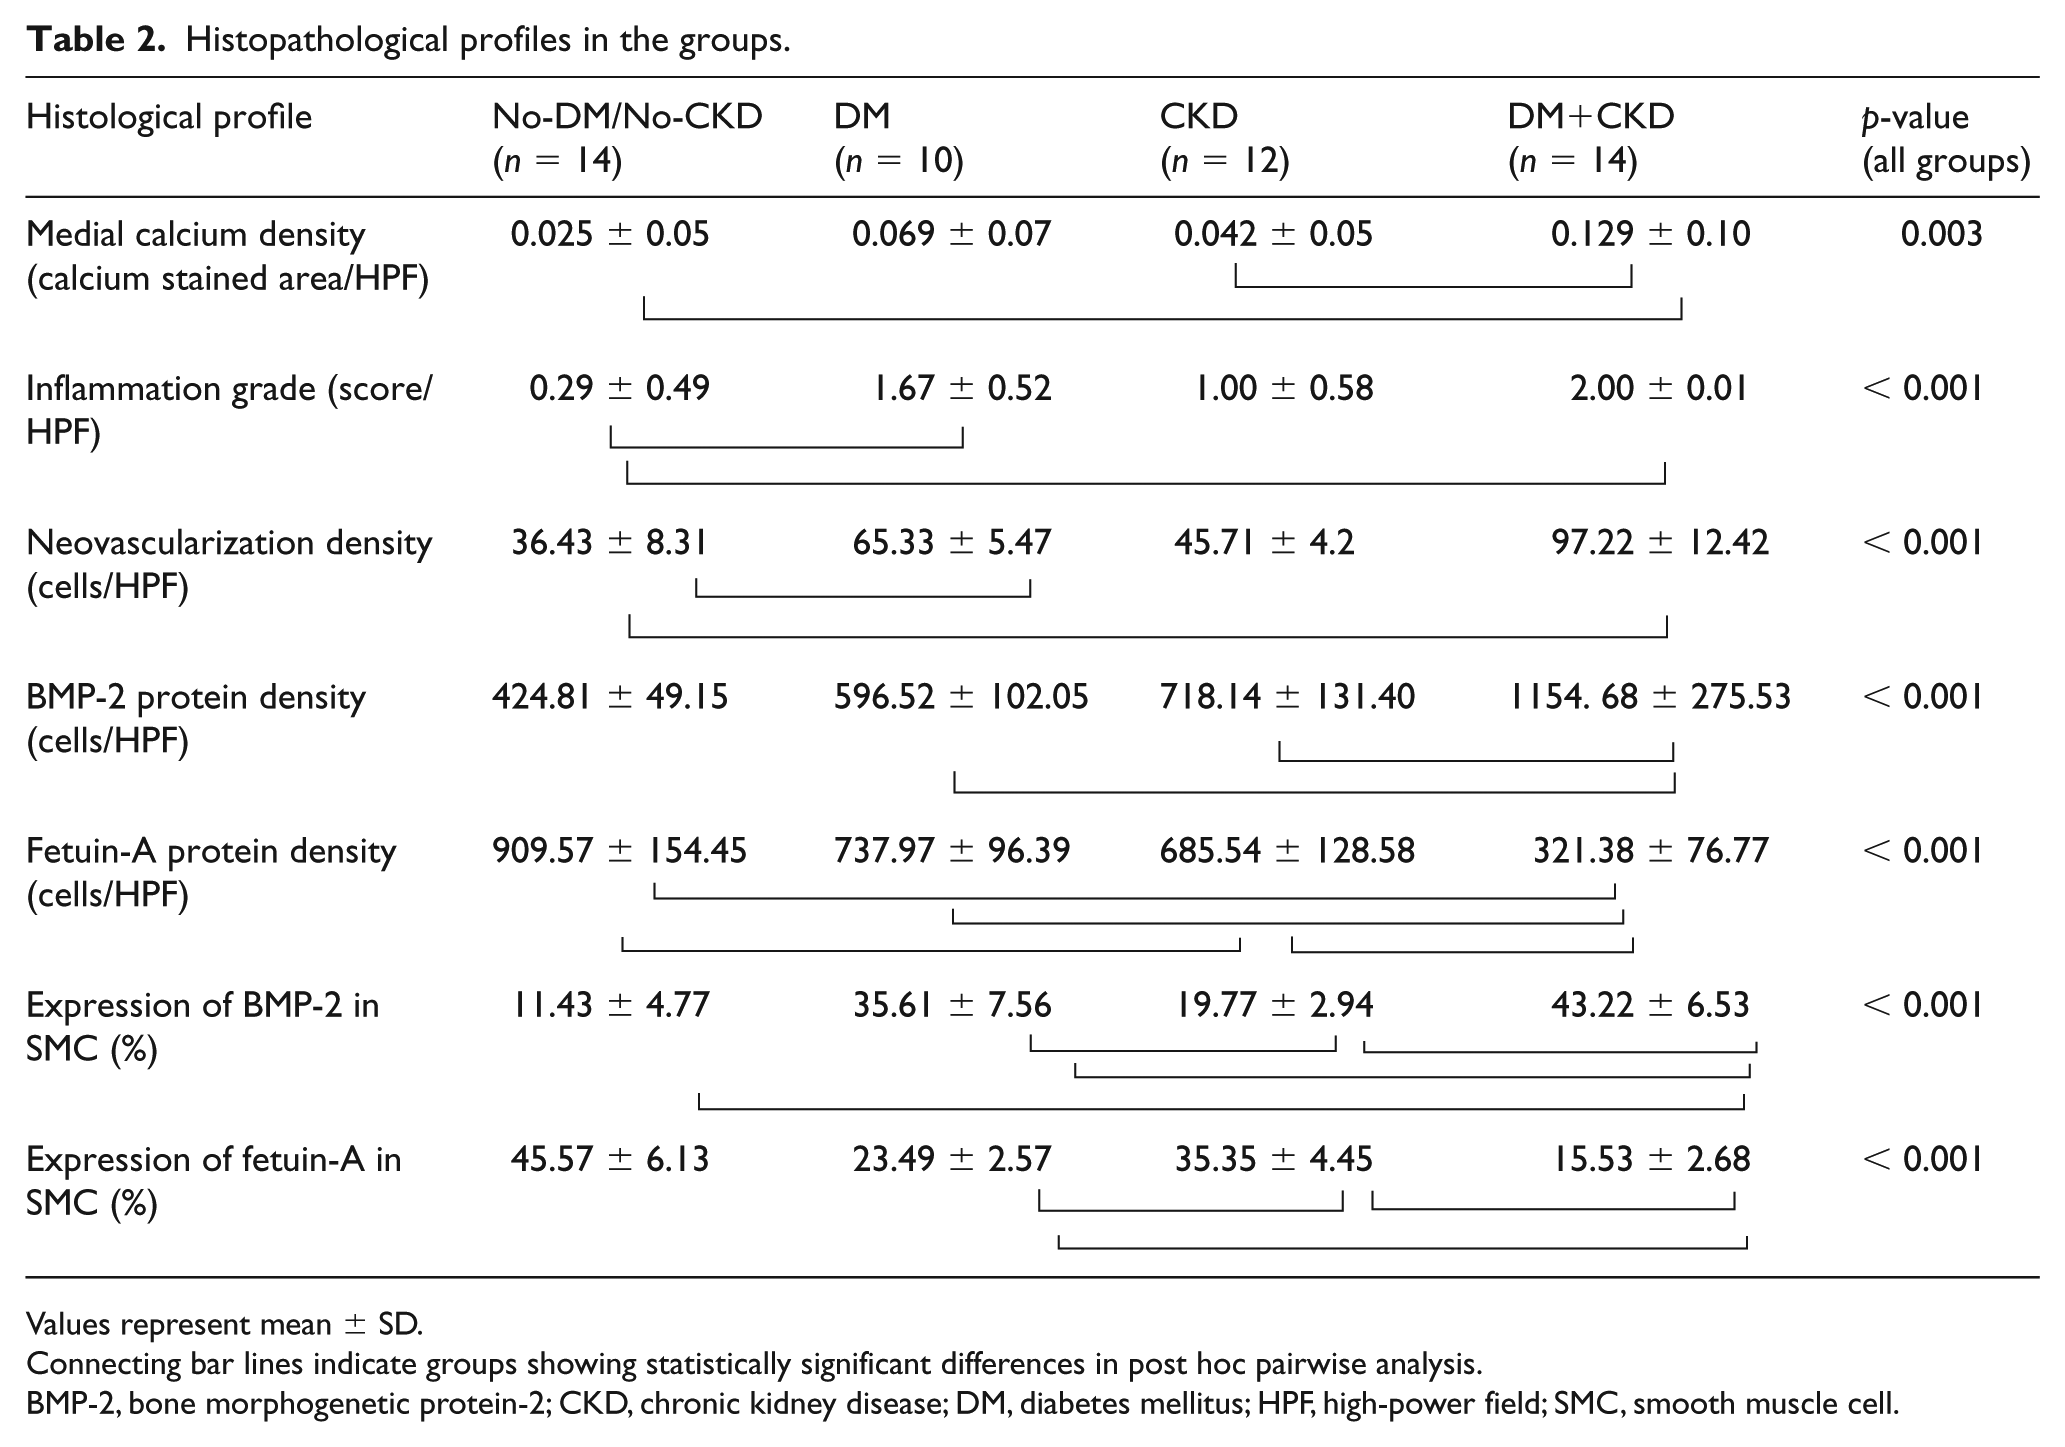
Values represent mean ± SD.
Connecting bar lines indicate groups showing statistically significant differences in post hoc pairwise analysis.
BMP-2, bone morphogenetic protein-2; CKD, chronic kidney disease; DM, diabetes mellitus; HPF, high-power field; SMC, smooth muscle cell.
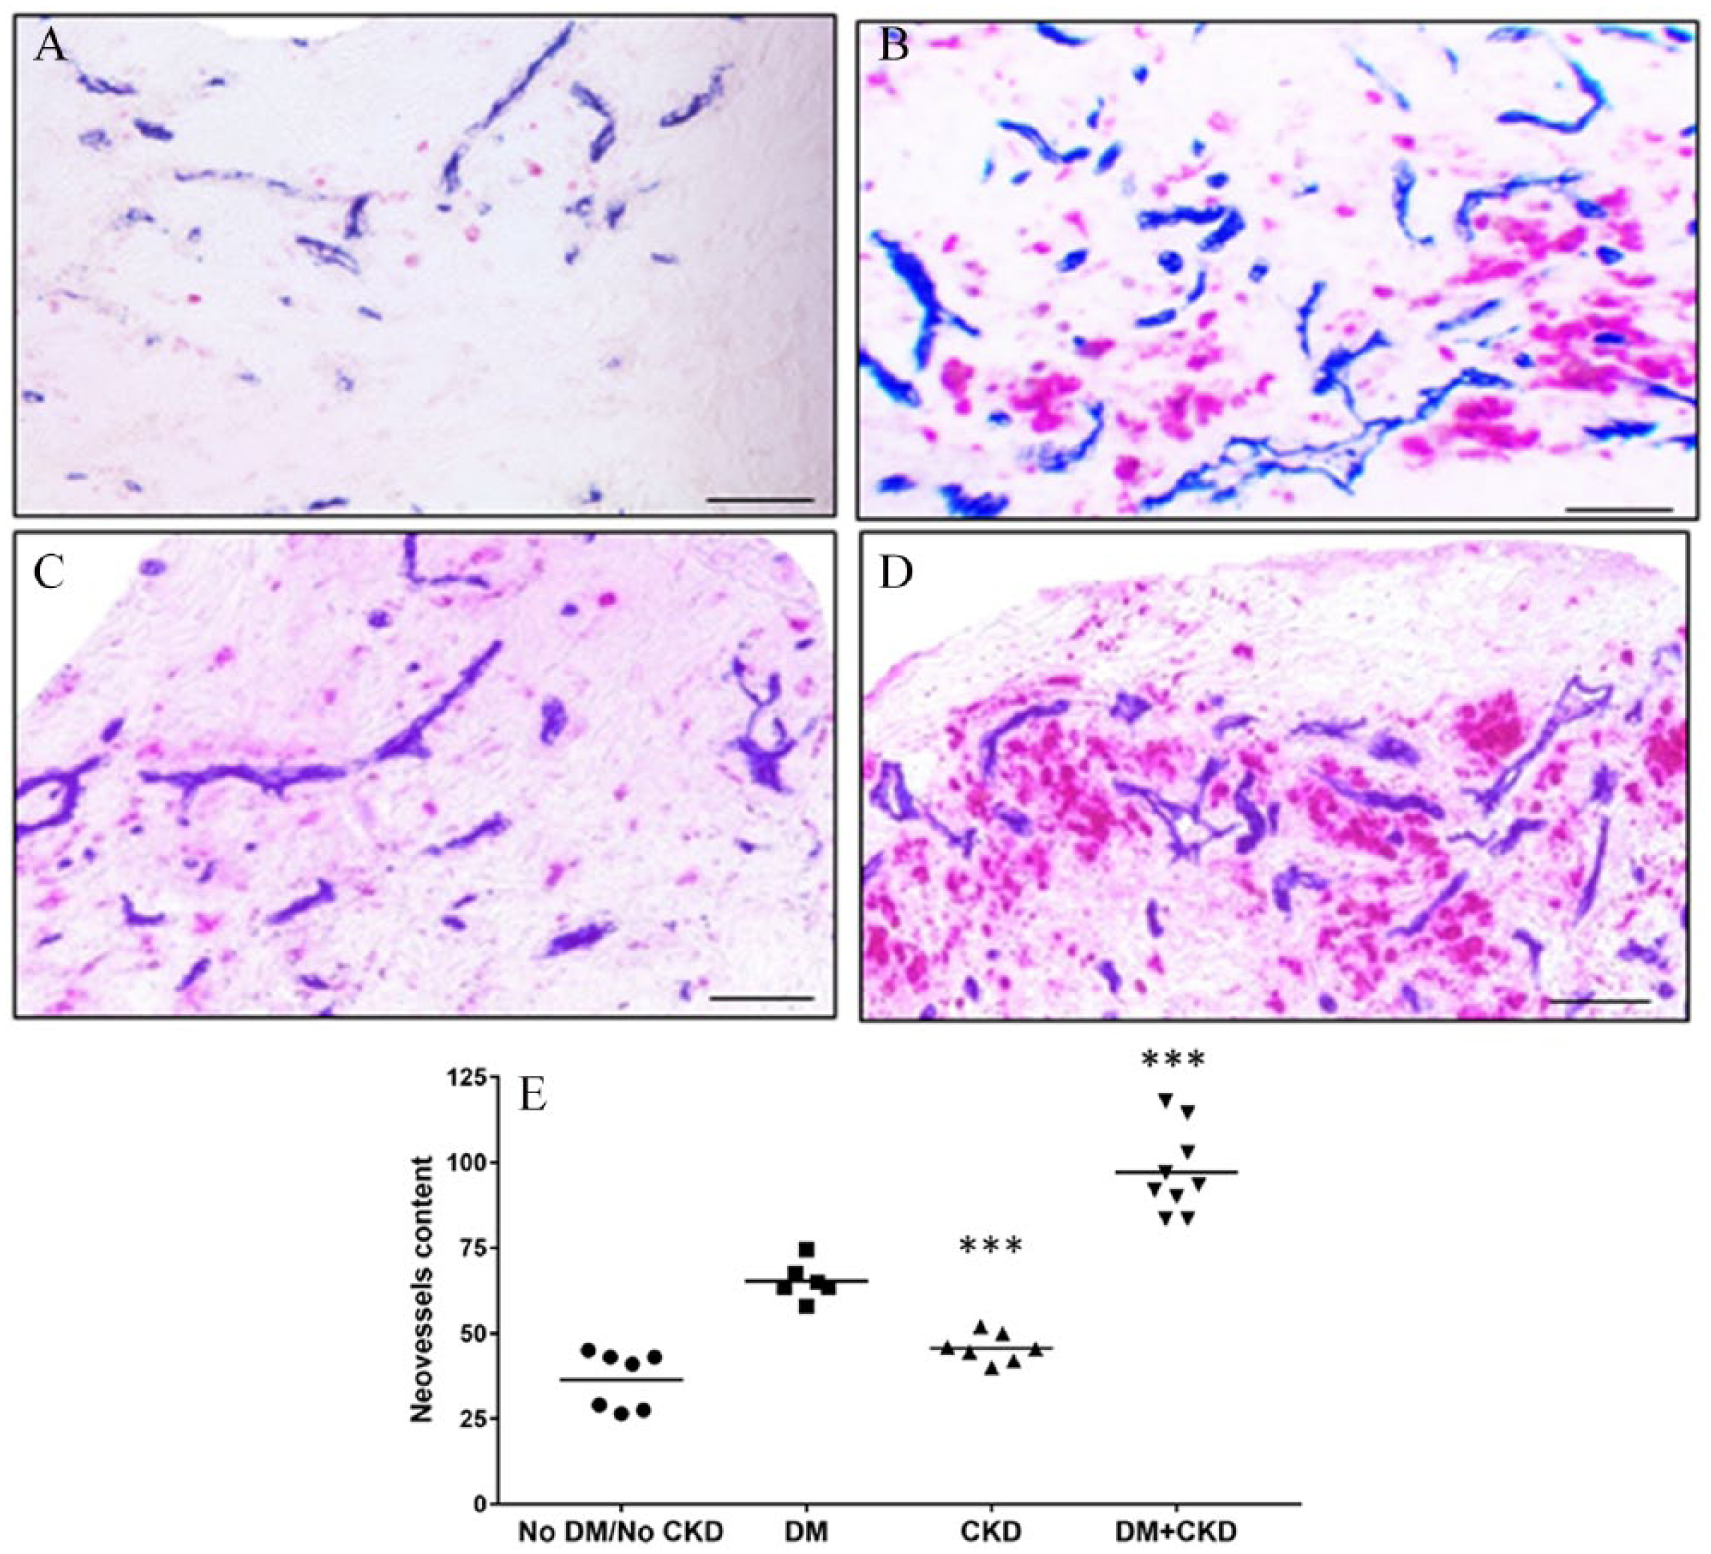
Inflammatory cells and neovessel formation. Double-label immunohistochemistry stained sections showing the distribution of inflammatory cells (stained in red chromogen for CD68/CD3) and neovessels (stained in blue chromogen for CD34) in plaques from patients without DM or CKD (A), with DM only (B), with CKD only (C), and with DM+CKD (D) (20× magnification, scale bars = 50 μm). (E) Scattergram of neovessel content, amongst the groups.
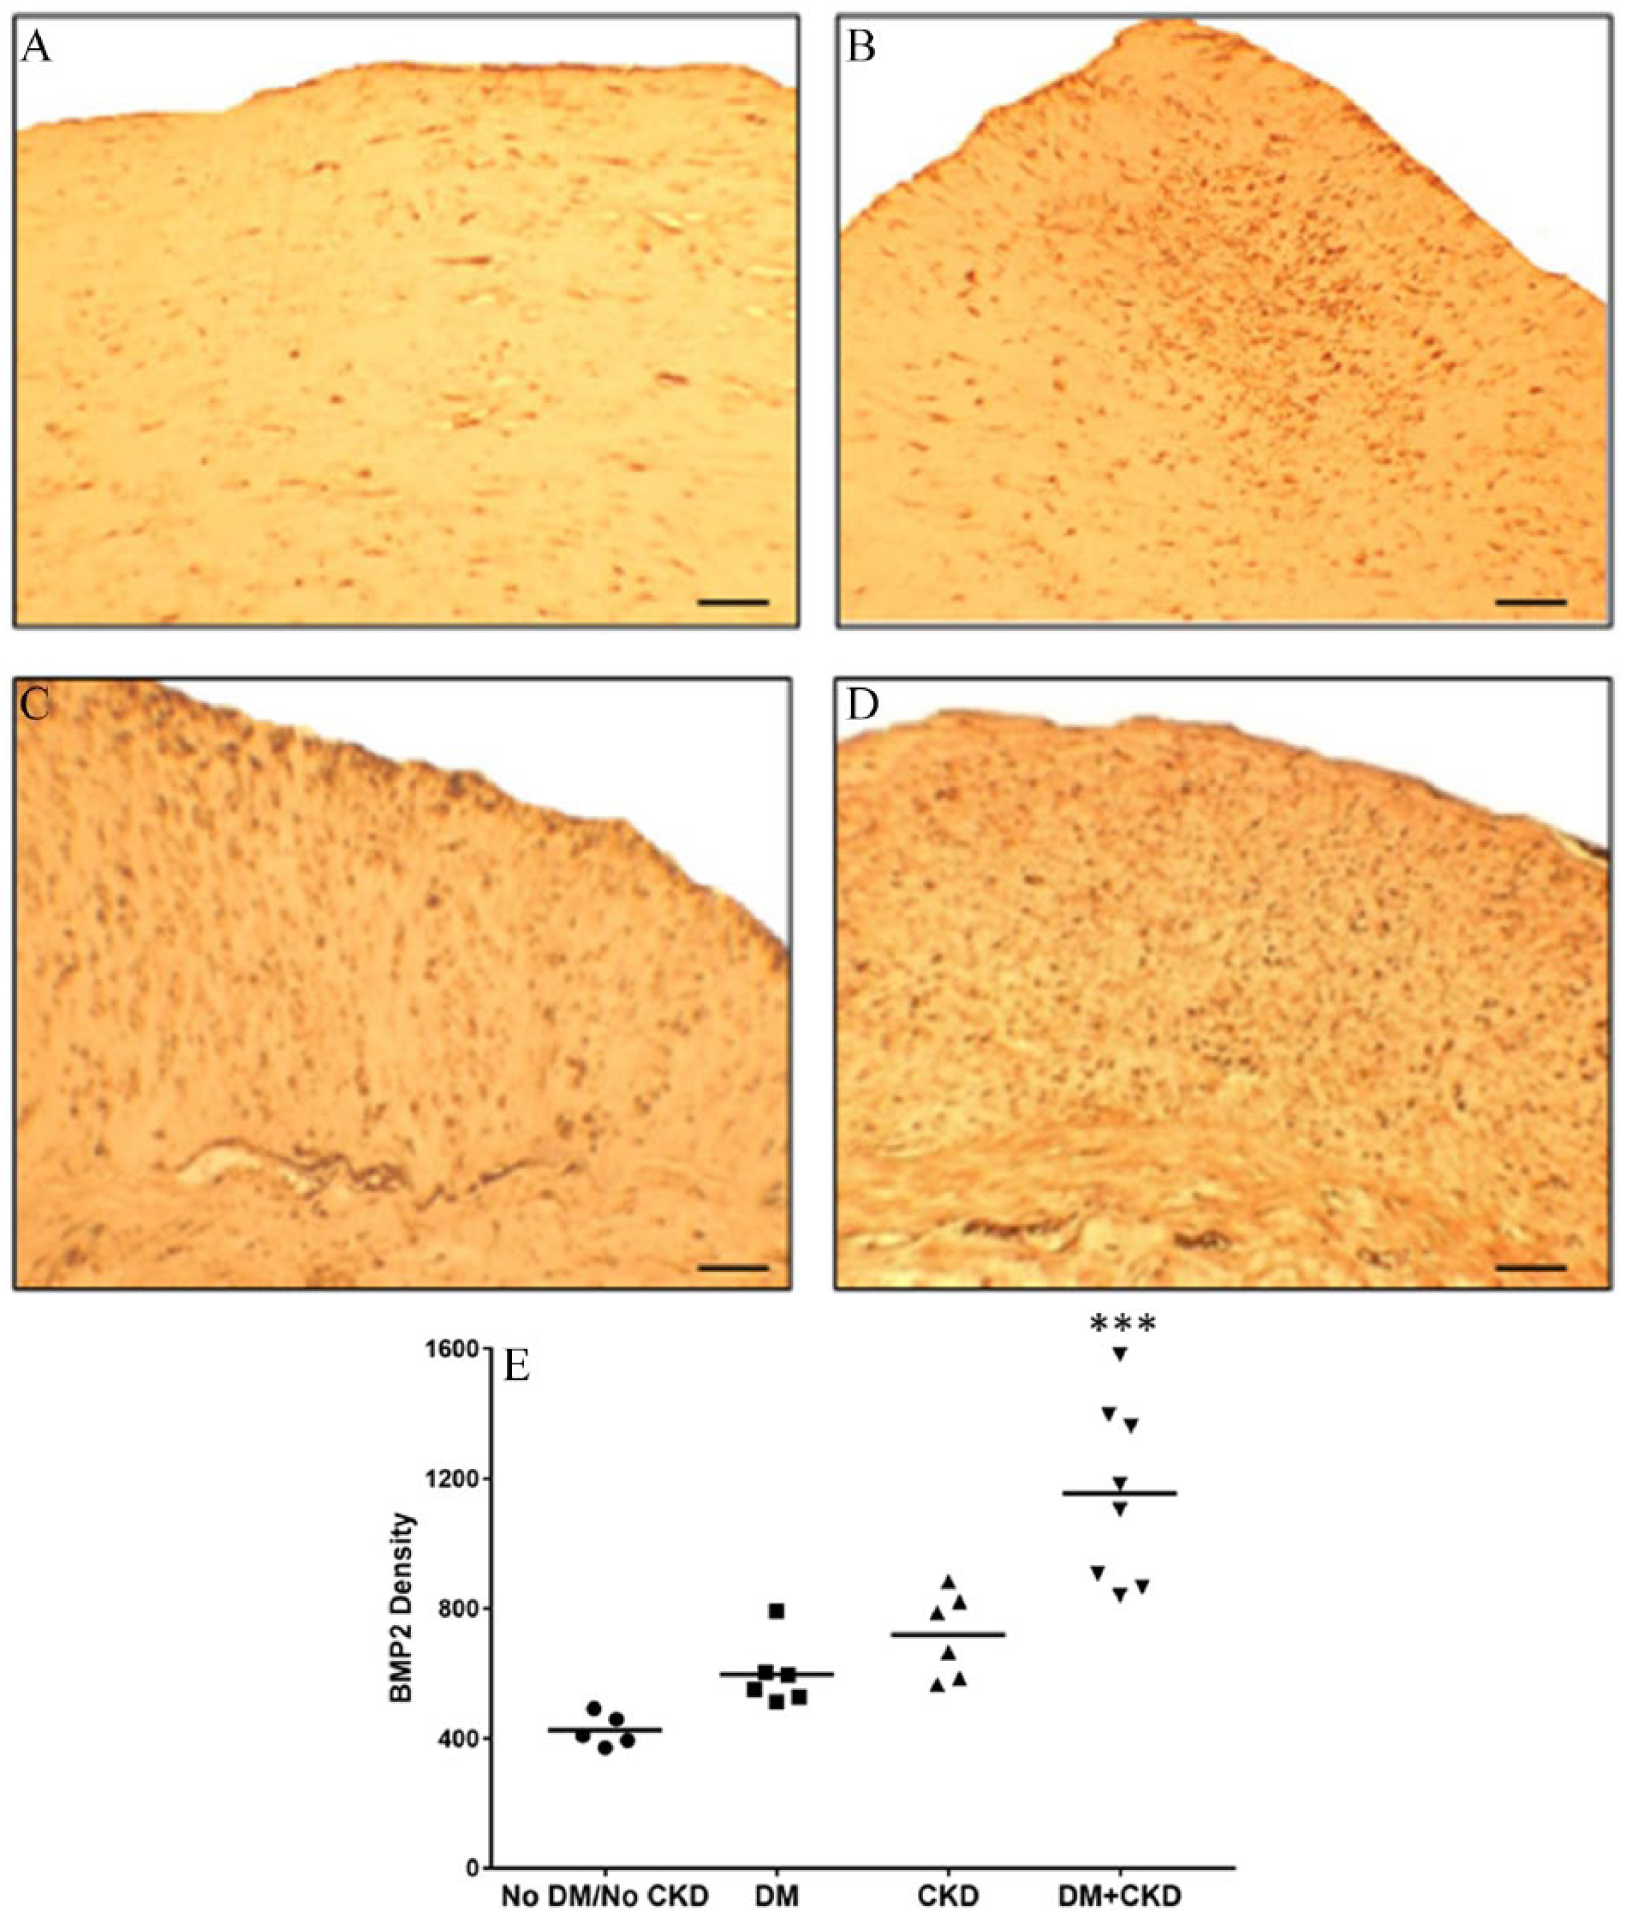
BMP-2 density. Immunostaining for BMP-2 using diaminobenzene brown chromogen labeling, showing BMP-2 expression in the intimal and medial layers of peripheral atherosclerotic plaques from patients without DM or CKD (A), with DM only (B), with CKD only (C), and with DM+CKD (D) (20× magnification, scale bars = 50 μm). (E) Scattergram shows results of quantitative analysis of BMP-2 protein density levels in peripheral plaques among groups.
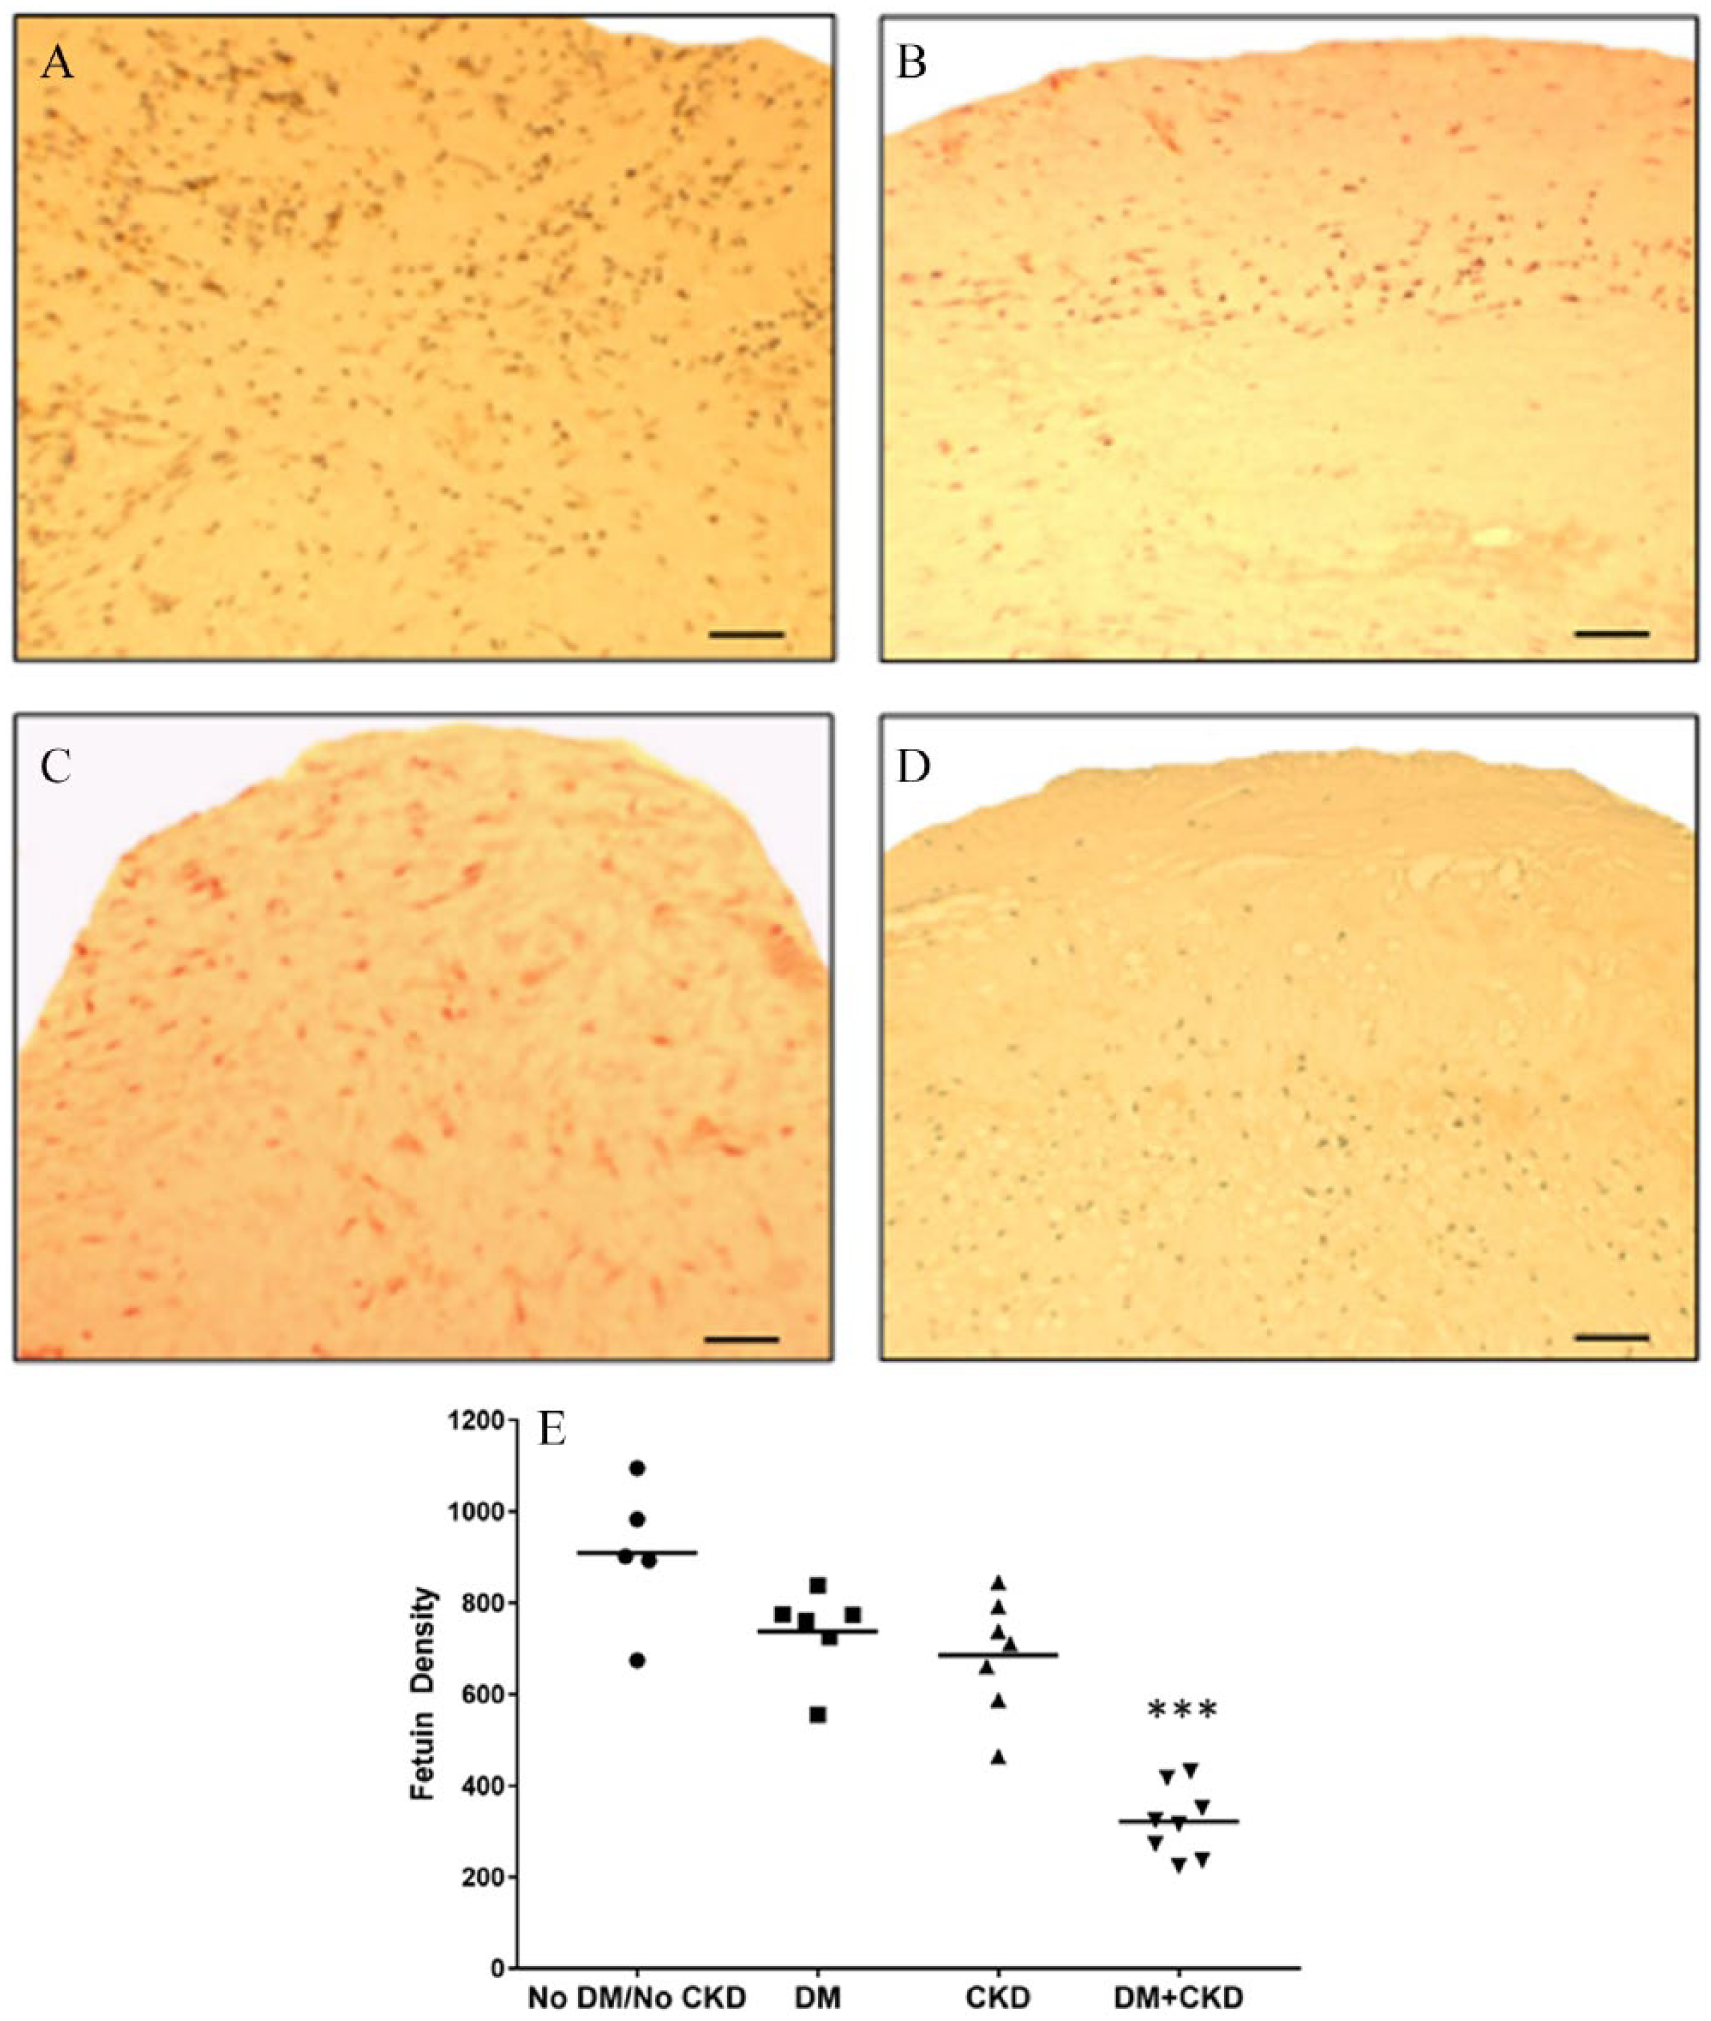
Fetuin-A density. Immunostaining for fetuin-A with mouse monoclonal antibody using diaminobenzene brown chromogen labeling, showing fetuin-A expression (brown) in the intimal and medial layers of peripheral atherosclerotic plaques from patients without DM or CKD (A), with DM only (B), with CKD only (C), and with DM+CKD (D) (20× magnification, scale bars = 50 μm). (E) Scattergram shows results of quantitative analysis of fetuin-A protein density levels in peripheral plaques among groups.
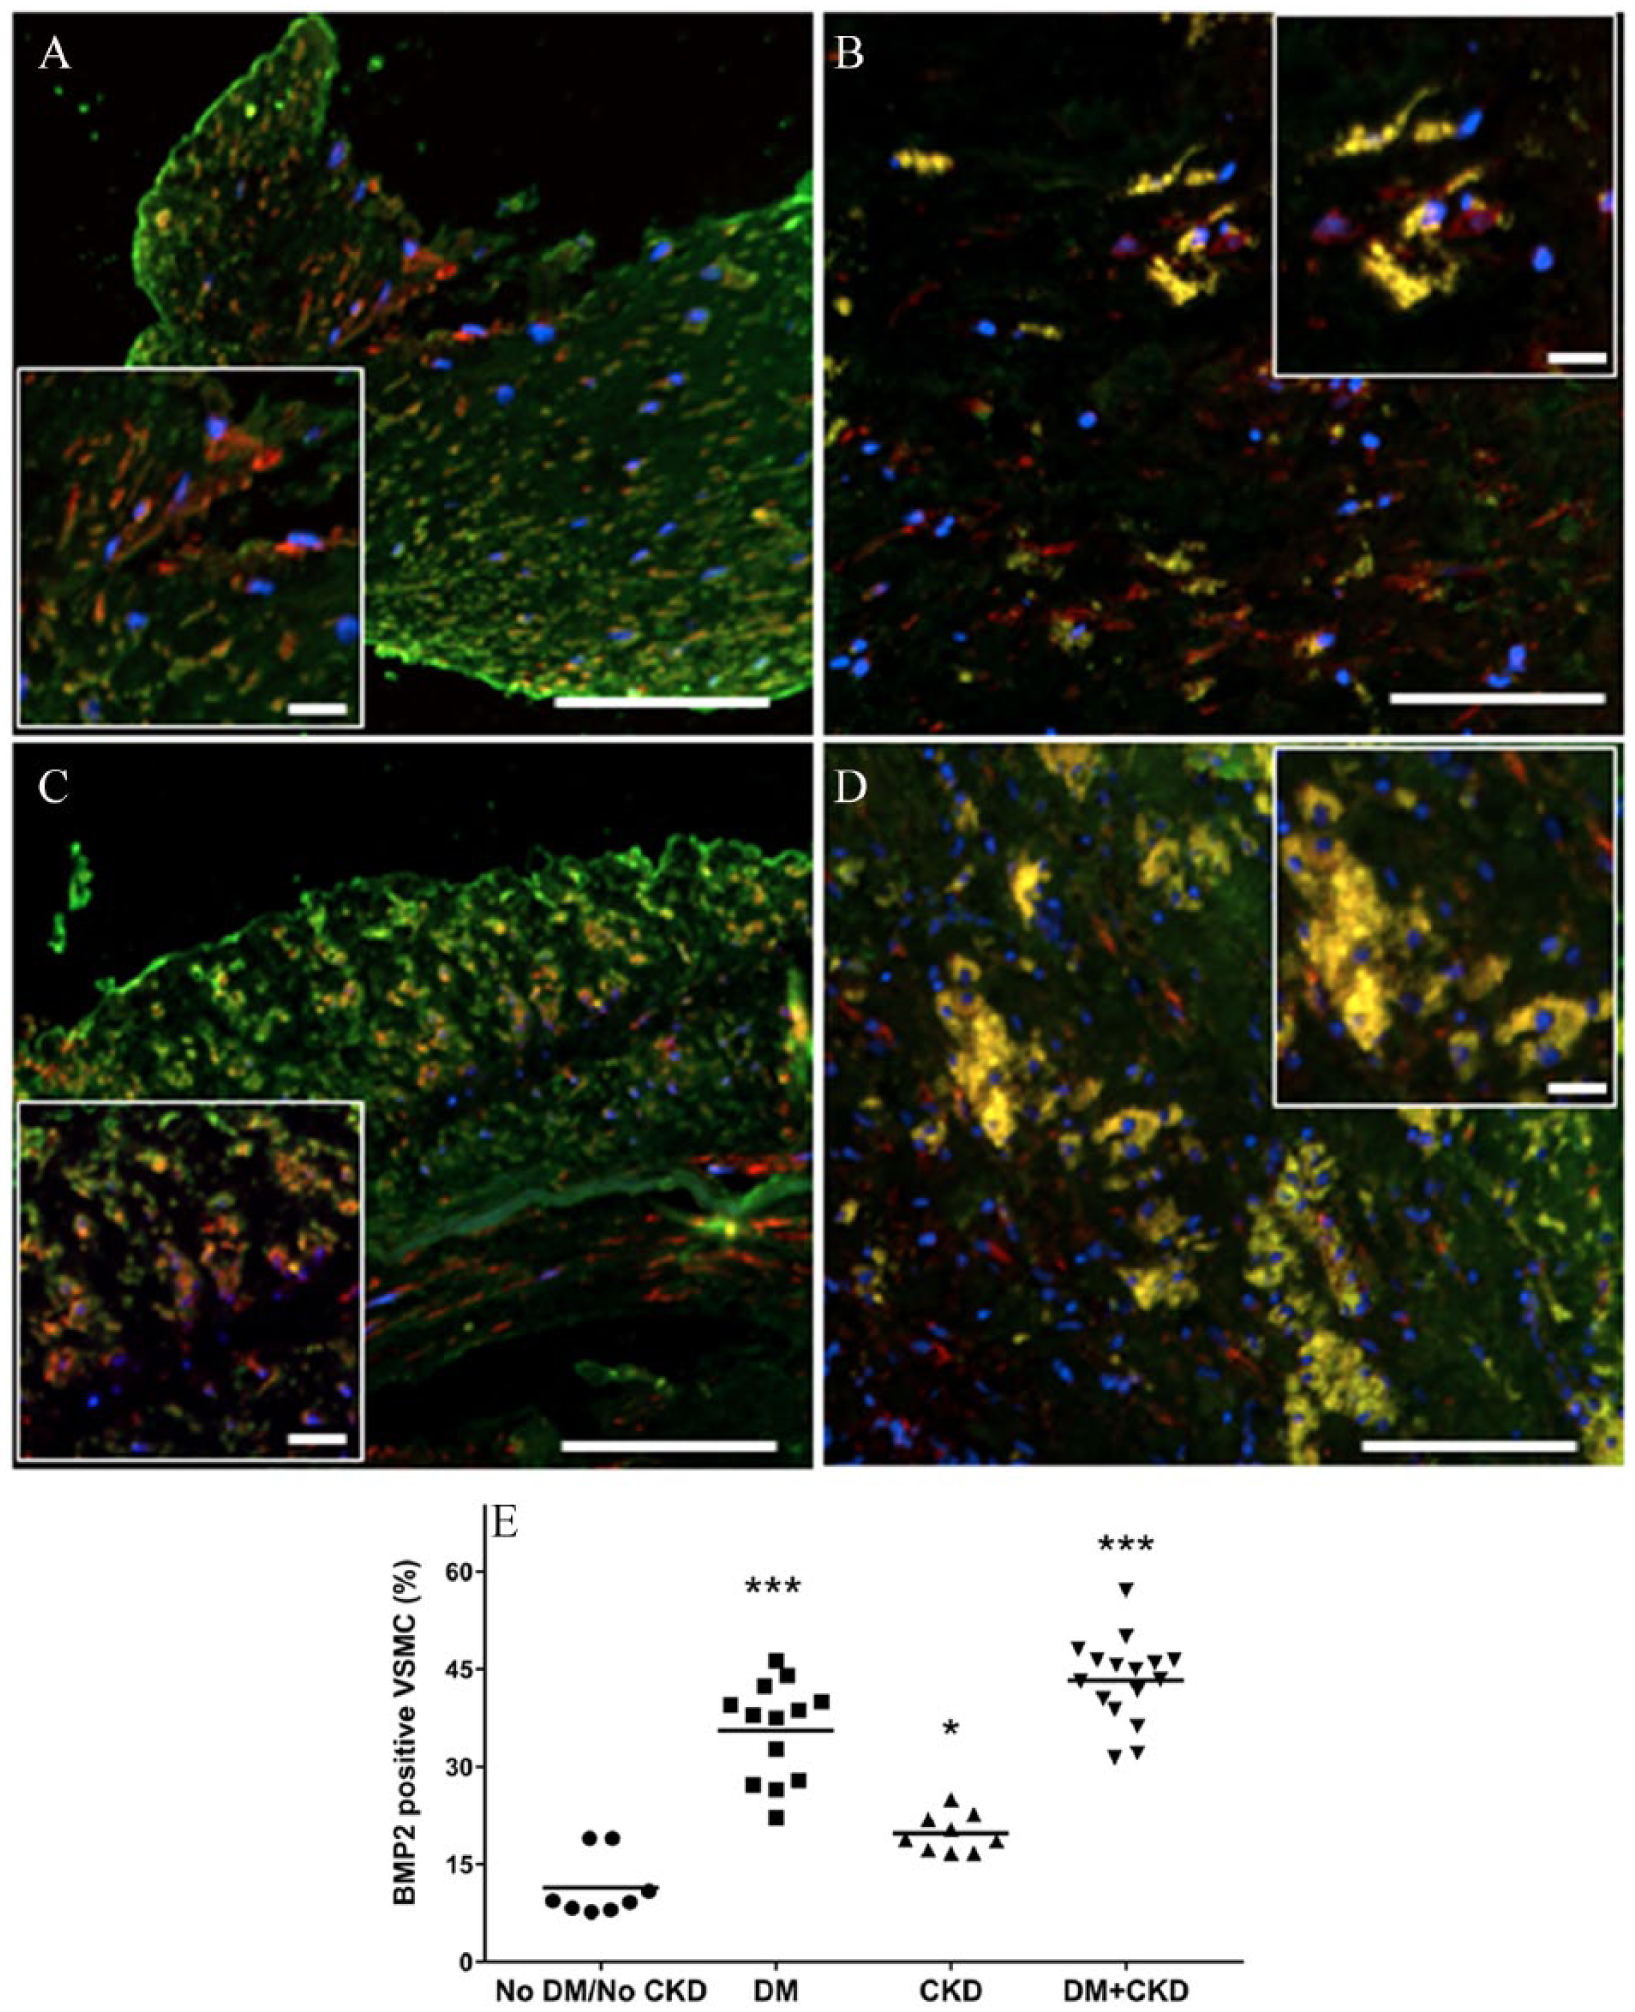
SMCs expressing BMP-2. Immunofluorescence staining for α-SMA (red) and BMP-2 (green) in peripheral atherosclerotic plaques with MAC from patients without DM or CKD (A), with DM only (B), with CKD only (C), and with DM+CKD (D); SMCs positive for BMP-2 visualized in yellow (20× magnification, scale bars = 100 μm; insets, scale bars = 20 μm). (E) Scattergram shows results of quantitative analysis of SMCs (α-SMA+) expressing BMP-2 in peripheral atherosclerotic plaques among DM/CKD/DM+CKD/noDM noCKD groups.
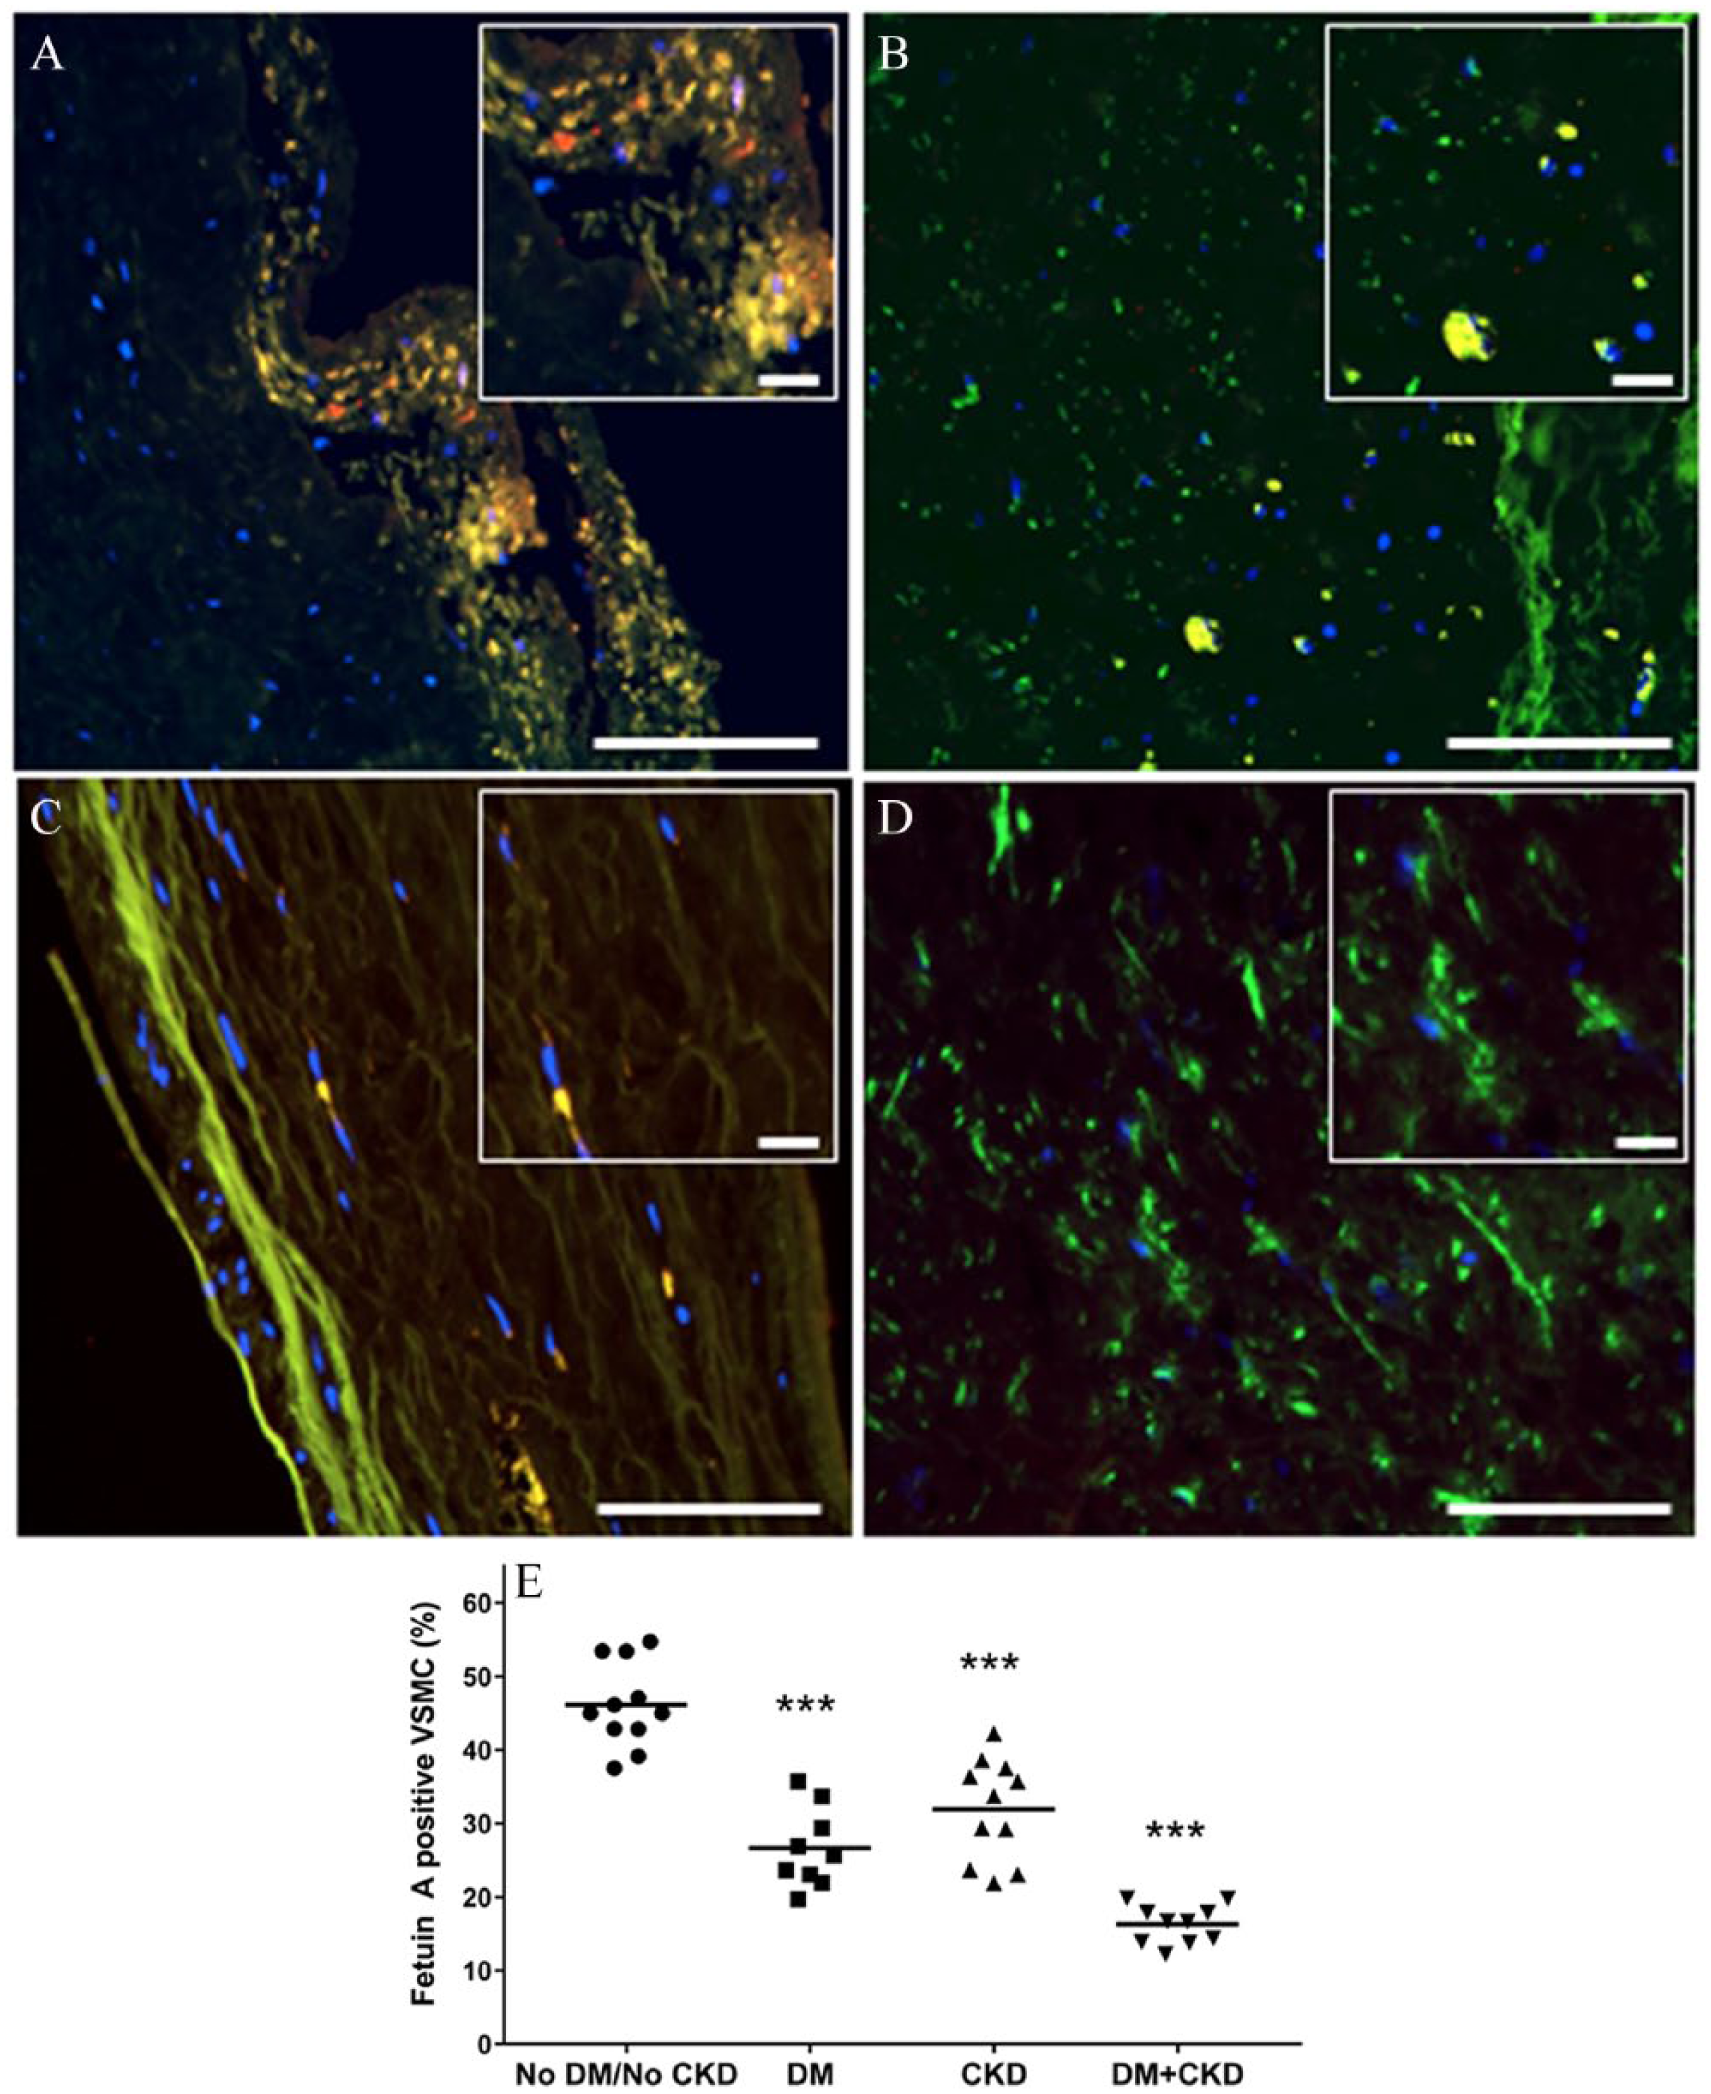
SMCs expressing fetuin-A. Immunofluorescence staining for α-SMA (green) and fetuin-A (red) in peripheral atherosclerotic plaques with MAC from patients without DM or CKD (A), with DM only (B), with CKD only (C), and with DM+CKD (D); SMCs positive for fetuin-A visualized in yellow (20× magnification, scale bars = 100 μm; insets, scale bars = 20 μm). (E) Scattergram shows results of quantitative analysis of SMCs (α-SMA+) expressing fetuin-A in peripheral atherosclerotic plaques among DM/CKD/DM+CKD/noDM noCKD groups.
Discussion
DM is associated with inflammation, neovascularization, intraplaque hemorrhage, oxidative stress, and endothelial dysfunction. 5 Concurrently, CKD alters mineral homeostasis with calcium and phosphate imbalance. 13 Normally, the calcification process is orchestrated by a balanced homeostasis of calcification mediators promoted by inducers and inhibitors 10 ; calcification evolves from an altered homeostasis of these mediators. BMP-2, first identified by Bostrom et al. in human calcified plaque, is produced by endothelial cells and plays a pivotal role in the induction of calcification. 14 In DM, there is dysregulated BMP signaling that may lead to increased BMP-2 protein expression. 15 On the other hand, fetuin-A is a potent calcification inhibitor, preventing calcium deposition by binding and clearing calcium salts. 16 Fetuin-A is known to be reduced in CKD and associated with enhanced vascular calcification. 17 This may be a contributing factor in our observation of reduced fetuin-A in plaques from patients with DM+CKD. Furthermore, fetuin-A can also inhibit apoptosis and enhance phagocytosis, and its incorporation into vesicles completely abrogates their ability to calcify. 18 Both BMP-2 and fetuin-A may play a role in the transformation of mesenchymal cells and vascular SMCs toward an osteochondrocytic fate, which may also augment MAC. 19 Indeed, heterotrophic ossification, a feature of osseous metaplasia with lamella of osteoid deposition, was detected in our study in some focal areas amidst a calcified region of the vascular media in a plaque from a patient with DM+CKD (online supplemental Figure 2).
Consistent with the above data, this study documented an incremental and significant increase in MAC density in DM+CKD, which was confirmed by both H&E and alizarin red special stain for calcium deposition. We also observed an increase in inflammation and neovascularization in the DM+CKD group, both of which are features of rupture-prone vulnerable plaques.
BMP-2 is a protein expressed in vascular SMC, promoting SMC differentiation into osteogenic potential, modulated by transcriptional factors (Cbfa, Msx-2), and enhances calcification. 20 Studies have reported augmented BMP-2 expression was associated with hyperglycemia, uremia, and inflammation.20,21 This study illustrates that MAC was associated with an increase in BMP-2 protein. In addition, we show that SMCs express BMP-2 protein in PAD plaques with medial arterial calcification, illustrating a significant BMP-2 increase associated with DM and CKD compared to no-DM/no-CKD.
Fetuin-A is abundantly expressed in cultured human fibroblasts and SMCs. 22 In addition, confocal microscopy demonstrated that fetuin-A is internalized by SMC and concentrated as intracellular vesicles. 23 Studies show that fetuin-A exhibits an inhibitory effect in the process of MAC. 24 Our study shows a decrease in fetuin-A expression with an increase in MAC. We also show specifically decreased expression of fetuin-A protein in SMCs of PAD plaques with MAC in patients with DM and CKD.
Study limitations
This is a cross-sectional study, based on the analysis of histopathological samples from four clinical groups, and no fresh tissue was available for gene expression. In addition, radiological calcium scores and endocrine evaluations were not available to rule out other etiologies for vascular calcification. The samples for this study came specifically from patients with symptomatic PAD who underwent superficial femoral artery atherectomy; there were no patients with severe CKD undergoing dialysis in this population. All the patients had mild to moderate CKD in the group with CKD+DM; however, the difference in the eGFR was significantly different between these two groups and with the control group.
Conclusion
These findings suggest that although DM and CKD alone may be responsible for lesion progression, these conditions appear to have an additive effect such that when they occur together the extent of MAC deposition is further increased. This may have significant clinical relevance, as MAC increases arterial stiffness and hypertension, which subsequently increase left ventricular pressure and failure. 25 Understanding these associated risk factors may guide us to careful screening and early detection of MAC in DM/CKD, and the use of specific therapies, which may prevent MAC progression and its clinical squeal.
Patients with PAD associated with DM or CKD have higher levels of MAC, but the presence of both DM and CKD increases MAC to significantly higher levels. Higher expression of calcification promoter protein BMP-2 and decreased expression of inhibitor fetuin-A protein is evident in plaques from patients with PAD with concomitant DM and CKD versus those with DM or CKD only. Further understanding of the mechanisms involved in mediating calcification and their association with DM and CKD may be useful in improving management and developing therapeutic interventions.
Supplemental Material
10.1177_1358863X19842276__Supplementary_figure_1 – Supplemental material for Incremental effects of diabetes mellitus and chronic kidney disease in medial arterial calcification: Synergistic pathways for peripheral artery disease progression
Supplemental material, 10.1177_1358863X19842276__Supplementary_figure_1 for Incremental effects of diabetes mellitus and chronic kidney disease in medial arterial calcification: Synergistic pathways for peripheral artery disease progression by Prakash Krishnan, Pedro R Moreno, Irene C Turnbull, Meerarani Purushothaman, Urooj Zafar, Arthur Tarricone, Sandeep Singla, Annapoorna Kini, Samin Sharma, Jagat Narula, Juan J Badimon and K-Raman Purushothaman in Vascular Medicine
Supplemental Material
10.1177_1358863X19842276__Supplementary_figure_2 – Supplemental material for Incremental effects of diabetes mellitus and chronic kidney disease in medial arterial calcification: Synergistic pathways for peripheral artery disease progression
Supplemental material, 10.1177_1358863X19842276__Supplementary_figure_2 for Incremental effects of diabetes mellitus and chronic kidney disease in medial arterial calcification: Synergistic pathways for peripheral artery disease progression by Prakash Krishnan, Pedro R Moreno, Irene C Turnbull, Meerarani Purushothaman, Urooj Zafar, Arthur Tarricone, Sandeep Singla, Annapoorna Kini, Samin Sharma, Jagat Narula, Juan J Badimon and K-Raman Purushothaman in Vascular Medicine
Footnotes
Declaration of conflicting interests
The authors declared no potential conflicts of interest with respect to the research, authorship, and/or publication of this article.
Funding
The authors disclosed receipt of the following financial support for the research, authorship, and/or publication of this article: the authors acknowledge funding from Cardiovascular Institute and Endovascular Interventional Surgery, Icahn School of Medicine at Mount Sinai, New York. This work was also supported partly by the National Heart, Lung, and Blood Institute (1K01HL133424 to Irene C Turnbull).
Supplementary material
The Supplementary material is available online with the article.
References
Supplementary Material
Please find the following supplemental material available below.
For Open Access articles published under a Creative Commons License, all supplemental material carries the same license as the article it is associated with.
For non-Open Access articles published, all supplemental material carries a non-exclusive license, and permission requests for re-use of supplemental material or any part of supplemental material shall be sent directly to the copyright owner as specified in the copyright notice associated with the article.