
Abstract
Fusion imaging is standard for the endovascular treatment of complex aortic aneurysms, but its role in follow up has not been explored. A critical issue is renal function deterioration over time. Renal volume has been used as a marker of renal impairment; however, it is not reproducible and remains a complex and resource-intensive procedure. The aim of this study is to determine the accuracy of a fusion-based software to automatically calculate the renal volume changes during follow up. In this study, computerized tomography (CT) scans of 16 patients who underwent complex aortic endovascular repair were analysed. Preoperative, 1-month and 1-year follow-up CT scans have been analysed using a conventional approach of semi-automatic segmentation, and a second approach with automatic segmentation. For each kidney and at each time point the percentage of change in renal volume was calculated using both techniques. After review, volume assessment was feasible for all CT scans. For the left kidney, the intraclass correlation coefficient (ICC) was 0.794 and 0.877 at 1 month and 1 year, respectively. For the right side, the ICC was 0.817 at 1 month and 0.966 at 1 year. The automated technique reliably detected a decrease in renal volume for the eight patients with occluded renal arteries during follow up. This is the first report of a fusion-based algorithm to detect changes in renal volume during postoperative surveillance using an automated process. Using this technique, the standardized assessment of renal volume could be implemented with greater ease and reproducibility and serve as a warning of potential renal impairment.
Introduction
The endovascular treatment of complex aneurysms has evolved as an alternative to open repair 1 and it has become the standard of care in many jurisdictions. Although outcomes are durable,2–5 renal impairment during follow up is still a critical issue, and difficult to quantify. Many different markers, such as renal volume, stent angulation and stent stenosis, have been used to predict renal impairment.4,6,7 Using a combination of these variables is not a reproducible method to assess renal impairment, despite being a complex and resource-intensive process.
Advanced imaging techniques, such as three-dimensional (3D) fusion, significantly reduce radiation exposure and contrast utilization in endovascular aneurysm repair (EVAR), as well as in complex endovascular procedures. 8 However, utilizing the principles of fusion imaging in follow up has not been explored. The aim of this study was to determine the accuracy of fusion-based techniques to automatically calculate the renal volume changes during follow up with automated segmentation software, and standardize its use.
Materials and methods
Study population
We selected the computerized tomography (CT) scans of 16 patients who went under complex aortic endovascular repair in our centre to include in this analysis. This group included eight patients who underwent fenestrated endovascular aneurysm repair (FEVAR) with no complications throughout follow up and eight patients who sustained at least one renal artery occlusion during follow up. We assumed that renal artery occlusion would be the most dramatic event leading to renal volume change. The patients were drawn from the local experience of cases performed between 2012 and 2016. Inclusion required a renal event with at least one CT scan after the event occurred. Controls were chosen to match patients with renal events. Demographics of both groups are included in Table 1.
Demographic characteristics divided by groups.
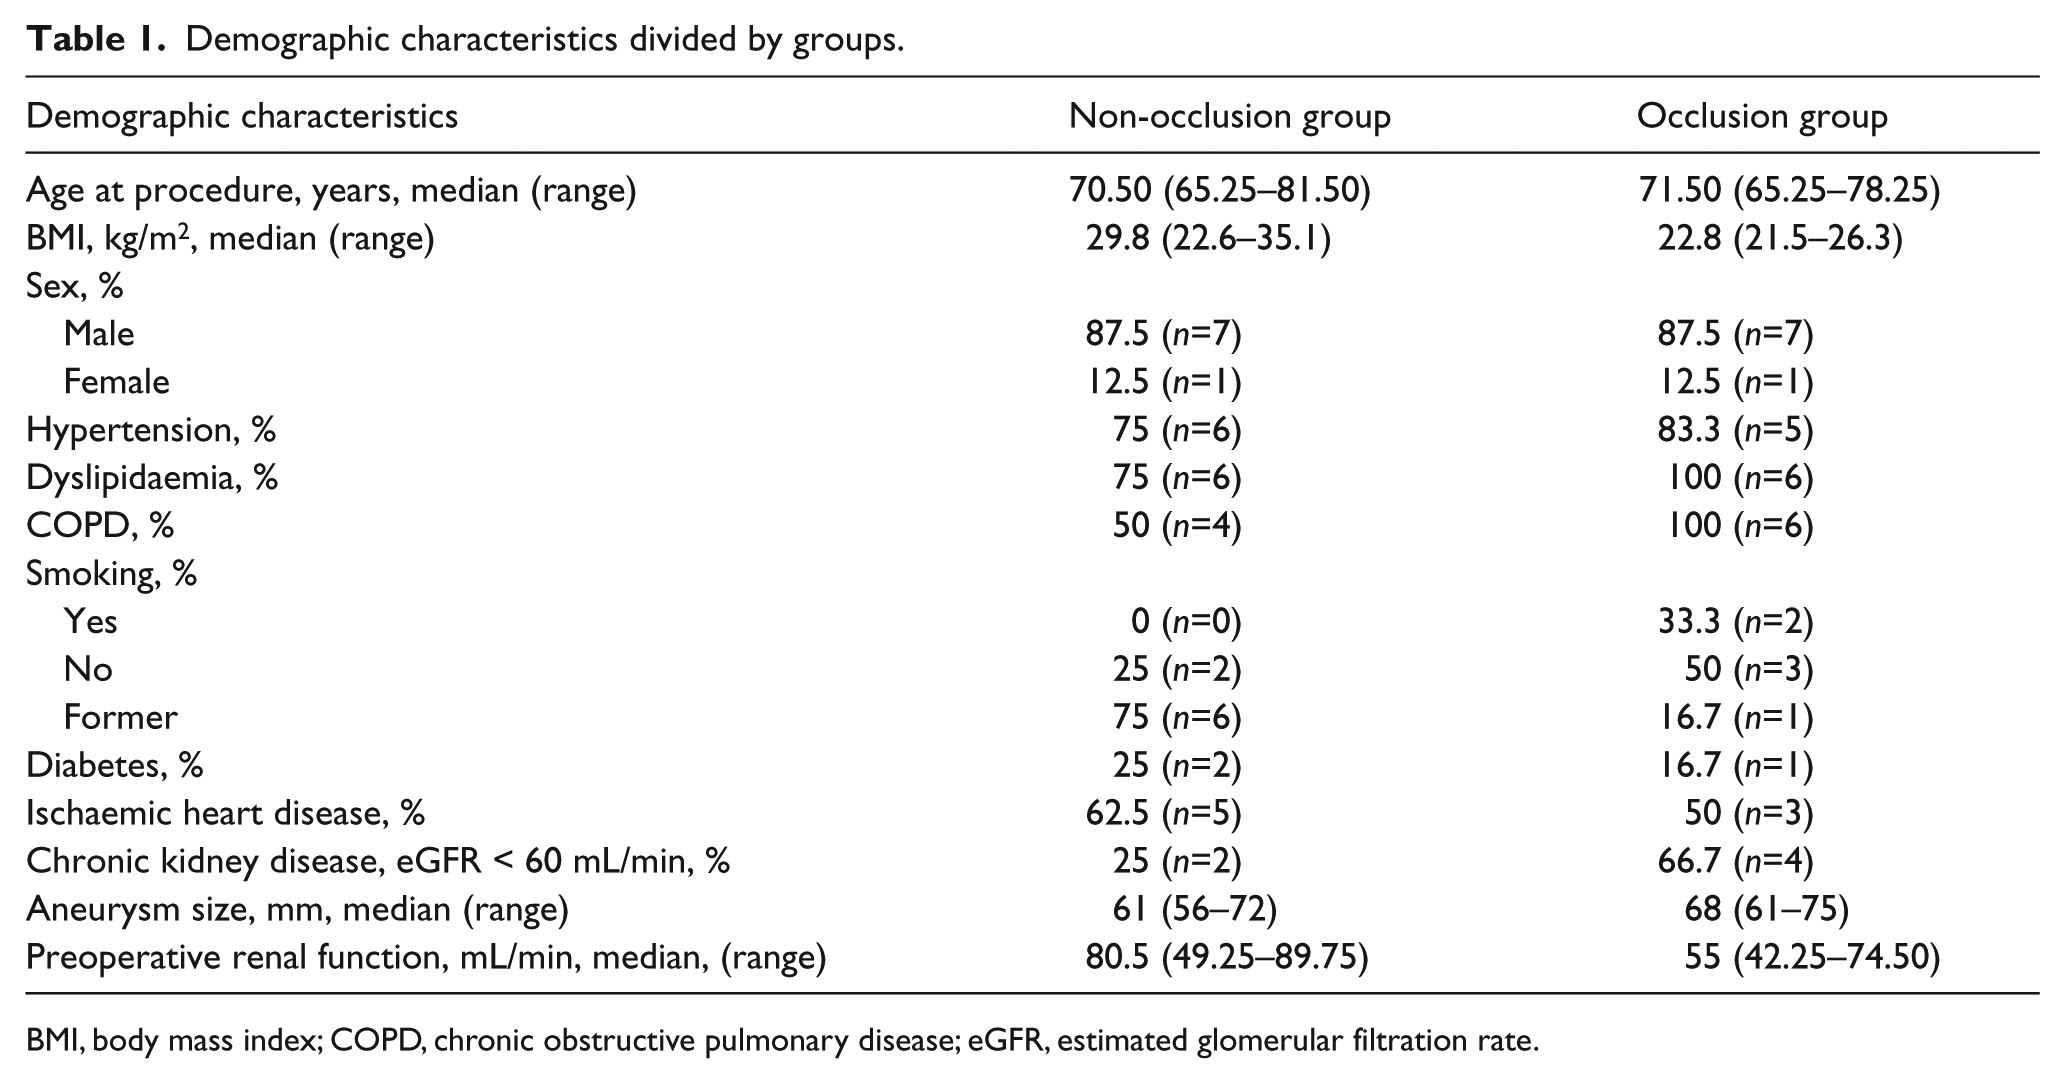
BMI, body mass index; COPD, chronic obstructive pulmonary disease; eGFR, estimated glomerular filtration rate.
Retrospectively, both preoperative, 1-month and 1-year follow-up CT scans were analysed using a conventional approach of semi-automatic segmentation in conventional software, and using a second approach exploring new software with automatic segmentation. The rationale behind analysing serial images is to determine the degree of accuracy this method has in assessing change in renal volume, as it is well established that devascularization of a kidney leads to progressive shrinkage of the kidney over time. Ethical approval of the local institution was waived as this is a retrospective observational study.
Renal function
The eGFR was determined by the abbreviated Modification of Diet in Renal Disease (MDRD) study equation (eGFR [mL × min−1 × 1.73 m−2] = 186 × [serum creatinine]−1.154 × [age]−0.203 × [0.704 if female] × [1.210 if African American]). The eGFR was calculated preoperatively, and at the 1-month and 1-year follow up.
Imaging analysis
Using the conventional system, CTs were interrogated using a multiplanar 3D workstation (AquariusNet software; TeraRecon Inc., San Mateo, CA, USA). Renal events were agreed by two investigators. The volume of each kidney was calculated with the following method: after selection of an area of interest, a semi-automated post-processing algorithm extracted the renal contour based on pixels of similar attenuation; the pelvicalyceal system, fat and vessels in the renal sinus, and renal cysts were excluded by manual correction on multiplanar views (to correct for any confounding automatic inclusion); finally, the renal volume was estimated with an algorithm embedded in the software package (in cubic cm) (Figure 1). The robustness of this method has been published in a previous study. 9 Predicted postoperative eGFR was calculated by renal volume change using the equation developed by Shimoyama et al. 10 : predicted postoperative eGFR = preoperative eGFR × (postoperative renal volume/preoperative renal volume). The correlation between the predicted and the observed postoperative eGFR has been quantified.
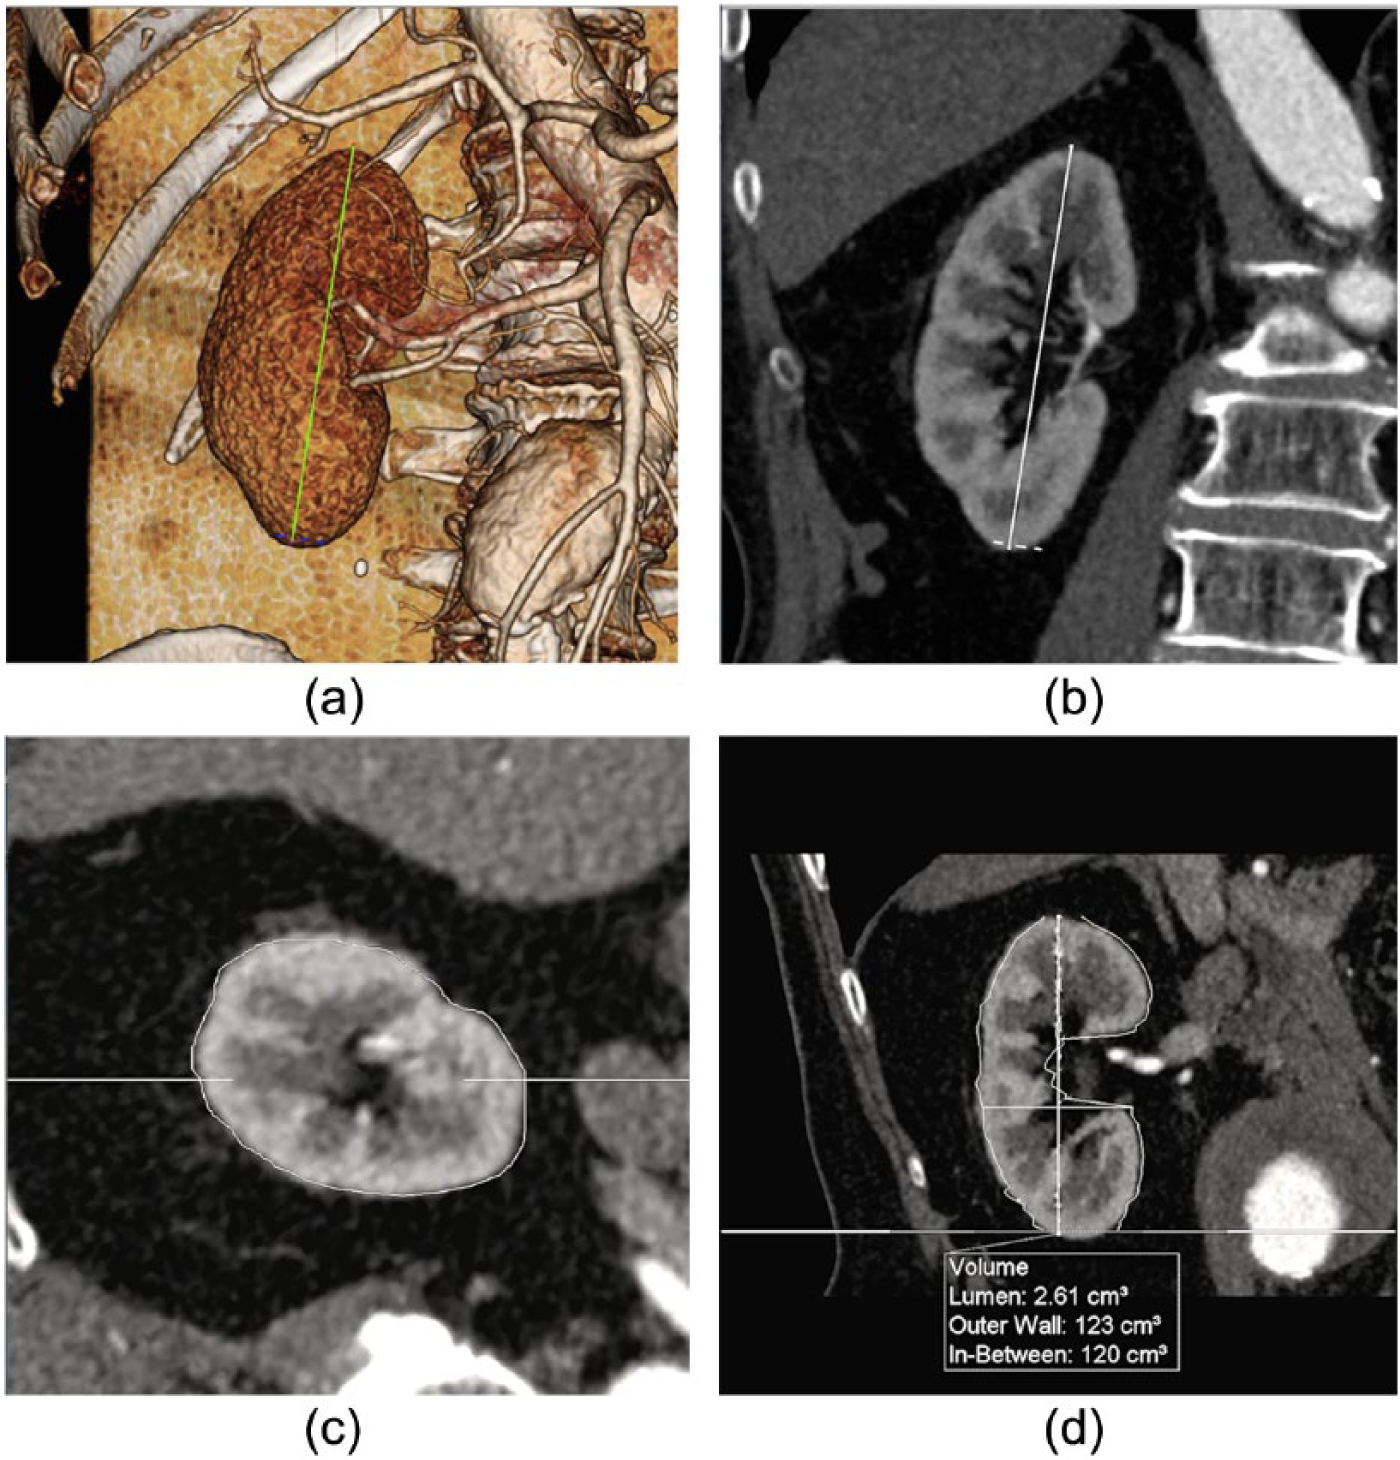
Renal volume calculated with the semi-automated software. (a) Three-dimensional VR reconstruction of the kidney selected. The green line depicts maximum length. (b) MPR view of the kidney selected. (c) Renal contour in an axial view. (d) Estimation of renal volume.
An overview of the new fusion-based method is shown in Figure 2. The operator used the ITK-SNAP image viewer (www.itksnap.org) 11 to manually select six points in the preoperative CT and a single point in the postoperative CT. These points were used to provide a starting position and region-of-interest for the automatic fusion algorithm.
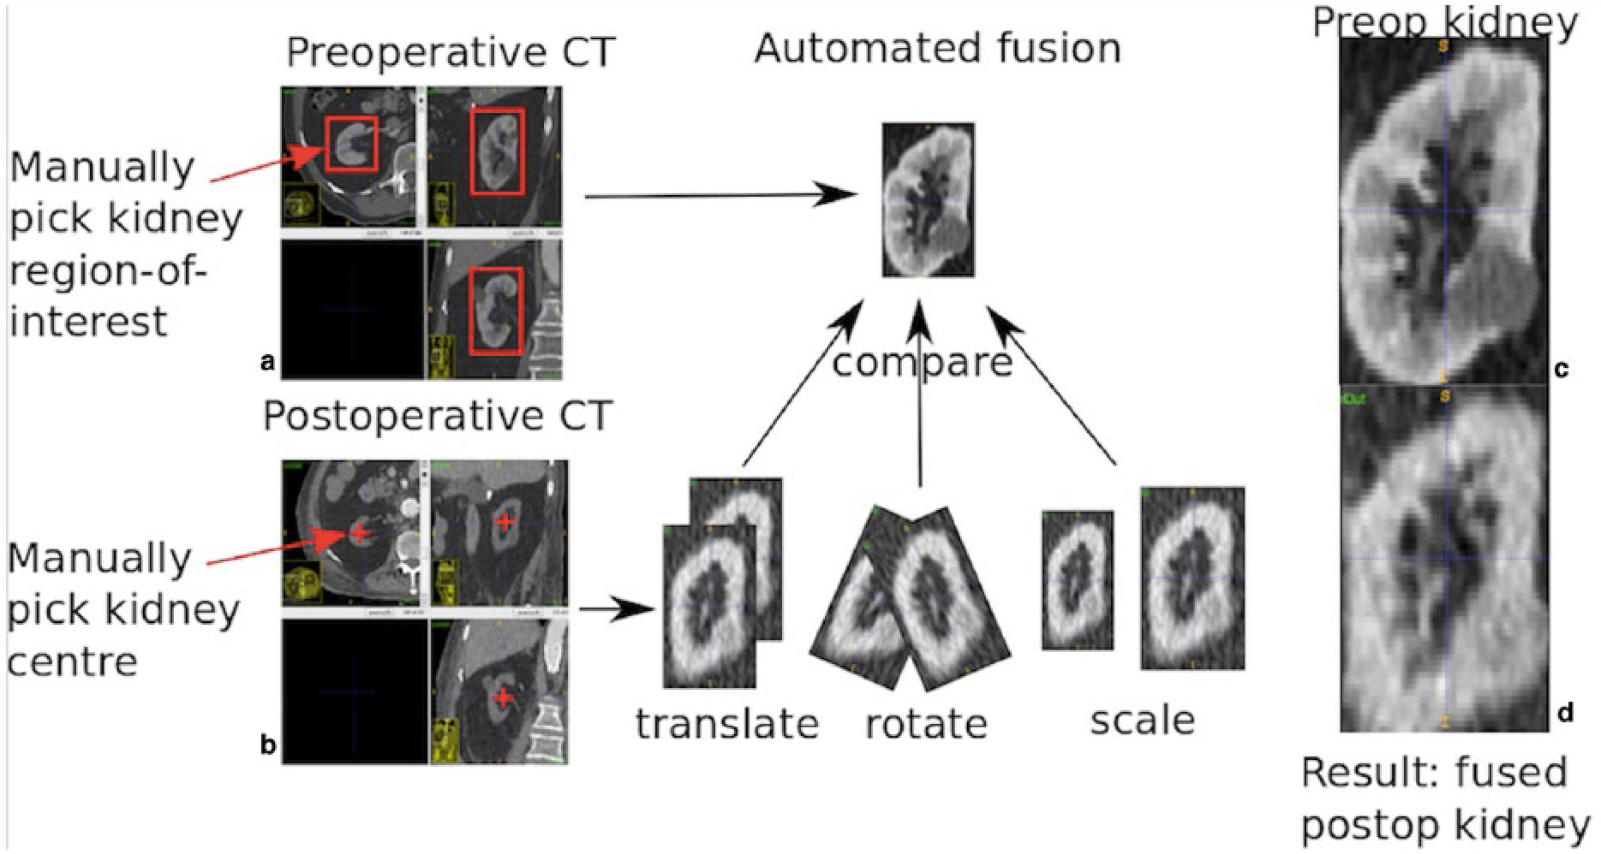
Renal volume calculated with the new fusion-based automatic software. (a) Manually selected points in the preoperative CT scan. (b) Manually selected kidney centre in the postoperative CT scan. The kidneys are then represented in orthogonal views on post-processing software so their three-dimensional volume can be assessed. (c) Preoperative kidney volume. (d) Postoperative kidney positioned and scaled, needing to be enlarged by 81% to accurately fuse with preoperative kidney.
The algorithm then proceeds automatically and iteratively translates, rotates and scales the postoperative CT and compares it with the preoperative image of the kidney. The images are compared using a statistical measure (correlation coefficient) applied to the underlying voxel intensity values. When an optimum fusion is achieved the postoperative kidney will be positioned and scaled so it closely resembles the preoperative kidney. The amount of scaling applied to fuse the images is a measurement of change in kidney size – the scaling occurs automatically in two dimensions and the degree of change is calculated by the programme. In the example shown, the algorithm increased the size of the postoperative kidney by a factor of 1.81 to accurately fuse with the preoperative kidney. Alternatively, this could be stated as: the postoperative kidney has shrunk to 55% (1/1.81) of its preoperative volume.
For each kidney and at each time point the percentage of change in renal volume compared to the preoperative one has been calculated using both techniques and the reliability of ratings has been assessed.
Statistical analysis
Statistical analysis was performed in IBM SPSS Statistics, version 20 (IBM Corp., Armonk, NY, USA). Descriptive statistics were generated, and the correlation between predicted and observed eGFR was calculated with the Pearson correlation. The reliability of ratings has been assessed with the intraclass correlation coefficient (ICC) and the Pearson correlation. The test value was defined as p < 0.05.
Results
Table 1 summarizes the demographic characteristics of the 16 patients included in the study, divided by group. The median preoperative eGFR was 80.5 mL/min (49.25–89.75) in the group without renal occlusion during follow up and 55 mL/min (42.25–74.50) in the occlusion group. Renal volume assessment was feasible for all CT scans included in the study. Correlation between predicted eGFR, based on renal volume calculated with the semi-automated process, and observed eGFR was r=0.844 is depicted in Figure 3. Divided into non-occlusion and occlusion groups, the correlation was r=0.899 (p=0.001) and r=0.800 (p=0.031), respectively.
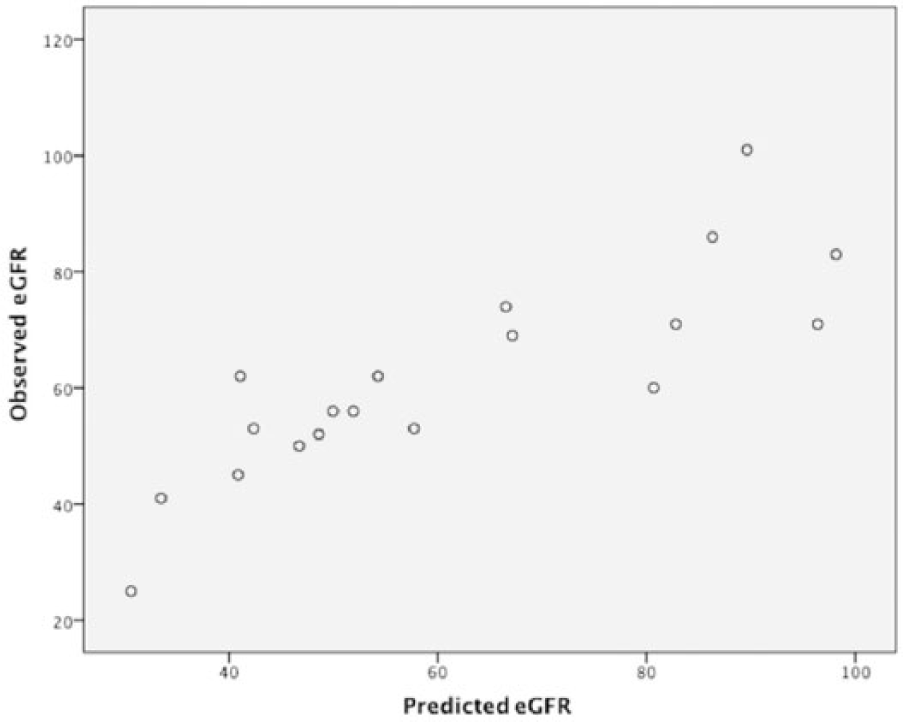
Correlation between predicted eGFR, based on renal volume calculated with the semi-automated process, and observed eGFR.
We assessed the reliability of both analysis techniques using the ICC. For the left kidney, the ICC was 0.794 and 0.877 at 1-month and 1-year follow up, respectively. For the right side, the ICC at 1 month was 0.817 and at 1 year was 0.966. For each kidney and at each time point, the Pearson correlation coefficient was 0.770, 0.811, 0.710 and 0.942, respectively. For a small number of kidneys (~5%) differences greater than 30% between automated and semi-automated methods were observed. Methods are being tested to improve robustness and automatically detect these outliers.
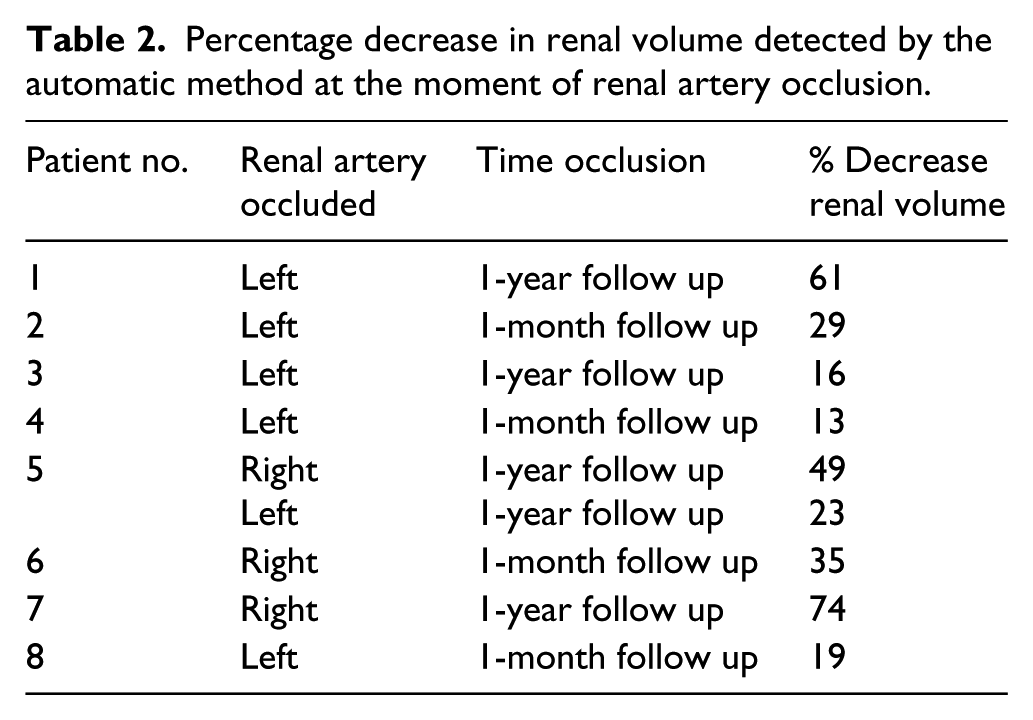
Table 2 describes the ability of the automated technique to detect a decrease in renal volume for patients with occluded renal arteries when preoperative imaging is compared with the moment of detecting renal occlusion.
Percentage decrease in renal volume detected by the automatic method at the moment of renal artery occlusion.
Discussion
In this study we demonstrate the accuracy of fusion-based software to automatically detect and calculate renal volume changes during follow up after aortic endovascular repair. Using the established, reproducible, semi-automated technique to calculate renal volume, 9 we have calculated renal volume in a sample of 16 patients. Using a process involving fusion techniques, we were able to assess the automated detection of renal volume and calculation of volume changes in CT images gained throughout the surveillance period. In addition to comparing patients with and without any renal changes, the automated detection accurately ascertained the presence of renal volume both with and without contrast, and identified renal artery occlusion accurately. We believe this new technique may provide a robust, timely and reliable method for advanced analysis of postoperative surveillance studies – thereby, a more accurate assessment can be performed in routine practice outside of investigational protocols.
As shown in different studies, renal volume is a reproducible and valid marker of renal impairment when decreased blood supply or anatomic causes for renal impairment are present. Renal volume has been assessed in various urologic studies as a predictor of graft function in living donor transplantation.12,13 Furthermore, other urologic studies have observed a strong correlation between renal volume, calculated with enhanced and unenhanced CT, and renal function estimated with nuclear medicine renal scans. 14 This methodology to assess the renal volume is a complex and resource-intensive procedure which requires expensive and complex software, an extensive learning curve, and time. These characteristics may render it impractical for use in a busy daily practice outside of investigational applications, and inaccessible in many resource-limited environments. The precision of the method used for renal volume assessment in this article has been evaluated by applying the equation developed by Isotani et al. 15 and Shimoyama et al. 10 These authors developed an equation to predict postoperative renal function after nephrectomy by renal volume change and they found a correlation between predicted and observed eGFR of 0.83. Applying this equation, our correlation between predicted and observed eGFR was 0.844, a result comparable with the already published literature. Thus, we believe that this process may produce a functional method to detect changes in kidney volume, which, if automated, could provide a predictive and automatic notification regarding renal malperfusion to clinicians who are mandated to survey patients following aortic aneurysm repair.
The relationship between vascular clinicians and advanced imaging has been evolving over three decades. Isovoxel imaging and post-processing software has made 3D manipulation of anatomic images possible, and facilitated the use of complex endovascular stent grafts for the repair of thoracoabdominal and juxtarenal aneurysms. Advanced imaging techniques such as 3D fusion have been recently introduced into operative procedures with the advent of hybrid operating theatres and fixed imaging systems capable of performing cone-beam CT scans in the operative environment. Use of advanced imaging has changed practice where available because it has been demonstrated to reduce radiation exposure and contrast utilization in both EVAR and complex endovascular procedures.16–18 The potential postoperative applications remain unexplored in either hardware or software-based systems. With the aim of extending fusion techniques during follow up, we have tested the accuracy of a fusion-based software to automatically calculate renal volume during follow up. Compared to the previously tested semi-automated process, the percentage of decrease in renal volume detected by the automatic fusion-based software is reliable, with an ICC of 0.877 (p= 0.001) at 1 year of follow up for the left kidney and 0.966 (p<0.001) for the right kidney. These data validate fusion-based software as a reliable tool to automatically measure renal volume. In addition, in the vast majority of our cases with renal occlusion, the fusion-based automatic software detected at least a 25% decrease in renal volume on the CT scan at the moment of detection when compared with the preoperative CT scan.
If a study of the renal event rate in the published literature were undertaken, it would be observed that renal artery angulation should play some role in the discussion of renal volume loss. Renal artery angulation has been assessed in different studies to determine its impact and correlation with renal function during follow up 19 and is hypothesized to be the cause of renal impairment after aneurysm repair. However, despite careful analysis, even observed changes of renal artery angulation after implantation of fenestrated and branched devices 4 have not been reliably associated with renal impairment. The same results have been published by Ou et al., 6 finding no relation between postoperative renal impairment and the changes in the stent and vessel orientation, even if all the patients suffering stent deformation presented renal impairment. This failure of correlation even remains true when hemodynamic outcomes are improved with caudal orientation of renal stents. 20 Thus, despite much suspicion that forced anatomic changes may bear some culpability for the deterioration of renal function often seen after aneurysm repair, contemporary imaging techniques have failed to provide proof. We believe a functional indicator, such as renal volume, which links anatomic change to important perfusion-related outcomes, provides a surrogate measure of stent performance, and may be a better indicator of the four-dimensional behaviour of the stents. If automated, this could become a powerful and useful tool for clinicians who have a busy aneurysm practice. Furthermore, the ability to detect change using an imaging technique that does not involve contrast makes it more practical for use in patients who have low-grade renal impairment from any cause.
Limitations
This study is a retrospective, pilot study to test the feasibility and accuracy of this technique and thus included only a limited number of patients. Another limitation can be considered the reproducibility of the semi-automated method, but it has been tested applying the formula developed by Isotani et al. 15 Furthermore, the impact of asymmetric changes in renal volume, as in the scenario where one of two accessory renal arteries is embolized, has not been fully assessed. More work is needed to make this process fully automated and applicable to imaging processing platforms in all jurisdictions.
Conclusion
This is the first report of a fusion-based algorithm to detect changes in renal volume during postoperative surveillance using an automated process. Using this technique, the standardized assessment of renal volume could be implemented with greater ease and reproducibility in the current follow up of endovascular procedures. Renal volume has been demonstrated to be a reliable marker of renal impairment.
Footnotes
Dr. R Eugene Zierler served as Guest Editor for this manuscript.
Declaration of conflicting interests
The authors declared the following potential conflicts of interest with respect to the research, authorship, and/or publication of this article: Tara Mastracci is a consultant for Cook Medical. G Penney is a co-funder and employee of Cydar Ltd.
Funding
The authors disclosed receipt of the following financial support for the research, authorship, and/or publication of this article: Tara Mastracci receives research/educational support from Cydar Ltd.