
Abstract
The cardio-ankle vascular index (CAVI) is a measure of global arterial stiffness. We hypothesized that CAVI is associated with left ventricular (LV) function and geometry in individuals without structural heart disease. We measured CAVI in 600 participants (mean age 60.3±14.6 years, 54% men) without history of atherosclerotic cardiovascular disease who were referred for transthoracic echocardiography. Linear regression analysis was used to assess the association of CAVI with LV function (peak mitral annular systolic s’ and early diastolic velocity e’) and structure (LV mass index (LVMI) and relative wall thickness (RWT)). Older age, male sex, lower body mass index, history of hypertension, diabetes and chronic kidney disease were each associated with a higher CAVI (adjusted R2 = 0.56, all p < 0.01). A higher CAVI was associated with lower s’ and e’, and greater RWT, independent of age, sex, systolic BP and other conventional cardiovascular risk factors (all p < 0.05); a borderline association of higher CAVI with greater LVMI (p = 0.05) was present. Associations with e’, s’ and RWT were similar in women and men but the association with LVMI was stronger in women than in men (p for interaction = 0.02, multivariable-adjusted β = 6.92, p < 0.001 in women; p > 0.1 in men). In conclusion, a higher CAVI, a measure of global arterial stiffness, is associated with worse LV systolic function, worse diastolic relaxation, and greater LV RWT in both men and women, and with LVMI in women.
Keywords
Introduction
Arterial stiffness increases with age and in the presence of elevated blood pressure (BP). 1 Higher arterial stiffness leads to increased left ventricular (LV) wall thickness and impaired diastolic relaxation, 2 thereby increasing the risk of incident hypertension, cardiovascular events and all-cause mortality. 3 The associations of blood pressure (BP) and measures of arterial load with LV diastolic function and structure have been previously reported.4–7 The associations of arterial stiffness, as measured by derivatives of pulse wave velocity (PWV), with LV function and structure have varied in previous studies.7–10 Carotid–femoral PWV (cf-PWV), a widely used measure of arterial stiffness, is associated with cardiovascular events. 11 However, it does not capture the elastic properties of the proximal aorta. 12 Also, it is not easily obtained in the office setting given the requirement for groin exposure. The cardio-ankle vascular index (CAVI) is a measure of global arterial stiffness calculated from brachial–ankle PWV, aortic wall stiffness β and BP. 13 It is highly correlated with brachial–ankle PWV and cf-PWV and is easily assessed in the office setting without the need for groin exposure and with good reproducibility. 14 A recent study demonstrated that CAVI, similar to brachial–ankle or cf-PWV, was predictive of mortality. 15 The association of CAVI with LV geometry and diastolic function has been mainly studied in Asian cohorts, and in select samples such as those with coronary heart disease16,17 or on hemodialysis. 18 No prior studies of CAVI have been performed to assess the associations with LV function and geometry in individuals without atherosclerotic cardiovascular diseases (ASCVD). We hypothesized that (1) higher arterial stiffness as measured by CAVI, is associated with worse LV systolic function, worse diastolic relaxation, and with LV mass and concentric geometry (assessed by relative wall thickness (RWT)); and (2) these associations differ by sex. To test these hypotheses, we measured CAVI in patients referred for two-dimensional transthoracic echocardiography (2D-TTE) at Mayo Clinic and who were without known ASCVD, overt LV systolic dysfunction and structural cardiac disease. We assessed the determinants of CAVI, characterized the associations of CAVI with LV systolic function, early diastolic relaxation and LV geometry, and tested sex differences in these associations.
Methods
Study population
The study was approved by the Mayo Institutional Review Board and all participants gave informed consent. We recruited patients (aged 18–80 years) referred to the Mayo Clinic echocardiographic laboratory for 2D-TTE examination. We excluded those with history of significant cardiovascular diseases, including myocardial infarction, stroke, peripheral artery disease, revascularization for vascular diseases, hypertrophic cardiomyopathy, open chest surgery, LV ejection fraction < 50%, more than moderate valvular stenosis or regurgitation, or pulmonary hypertension (right ventricular systolic pressure >50 mmHg), or with a history of malignancy. We abstracted following information from the institutional electronic health record (EHR), including demographics, conventional cardiovascular risk factors (hypertension, diabetes, hyperlipidemia and chronic kidney disease) – manually ascertained based on previous diagnoses, and self-reported smoking history (ever vs never) – routinely archived in the EHR.
Our main goal was to assess whether CAVI was associated with LV mass index (LVMI) and RWT. We calculated the sample size based on the correlation of cf-PWV with LVMI and RWT reported in the Framingham study (n = 5799), 19 in which the effect sizes were 0.12 and 0.16, respectively. With a sample size of 600, we had 84% power to detect such a correlation with LVMI and 98% power to detect such a correlation with RWT at the two-sided significance level of 0.05. Between 12 June 2015 and 30 June 2016 we recruited 662 patients. We excluded three patients with regional wall motion abnormality, five with significant valvular diseases requiring intervention, one with severe pulmonary hypertension newly identified during TTE evaluation, 10 patients with low-quality CAVI data, and 43 patients who withdrew after providing informed consent, resulting in a sample size of 600 for the final analysis.
Assessment of CAVI
CAVI was assessed at rest on the day of the TTE examination, using a VaSera VS-1500® device (Fukuda Denshi Co., Japan). It is an oscillometric measure, employing limb cuffs and a phonocardiograph, accounting for the time of the pulse wave arrival at the ankle from the heart by using phonocardiograph signal detections to identify the time of opening of the aortic valve. The CAVI was calculated by the device automatically based on the following equation: CAVI = a [2ρ / (systolic BP – diastolic BP) × Ln (systolic BP/diastolic BP) × PWV2] + b, where ρ is blood density, PWV is pulse wave velocity from the aortic valve to ankle, a and b are constants to convert the values of CAVI to those of Hasegawa’s heart–femoral PWV (Figure 1).13,14
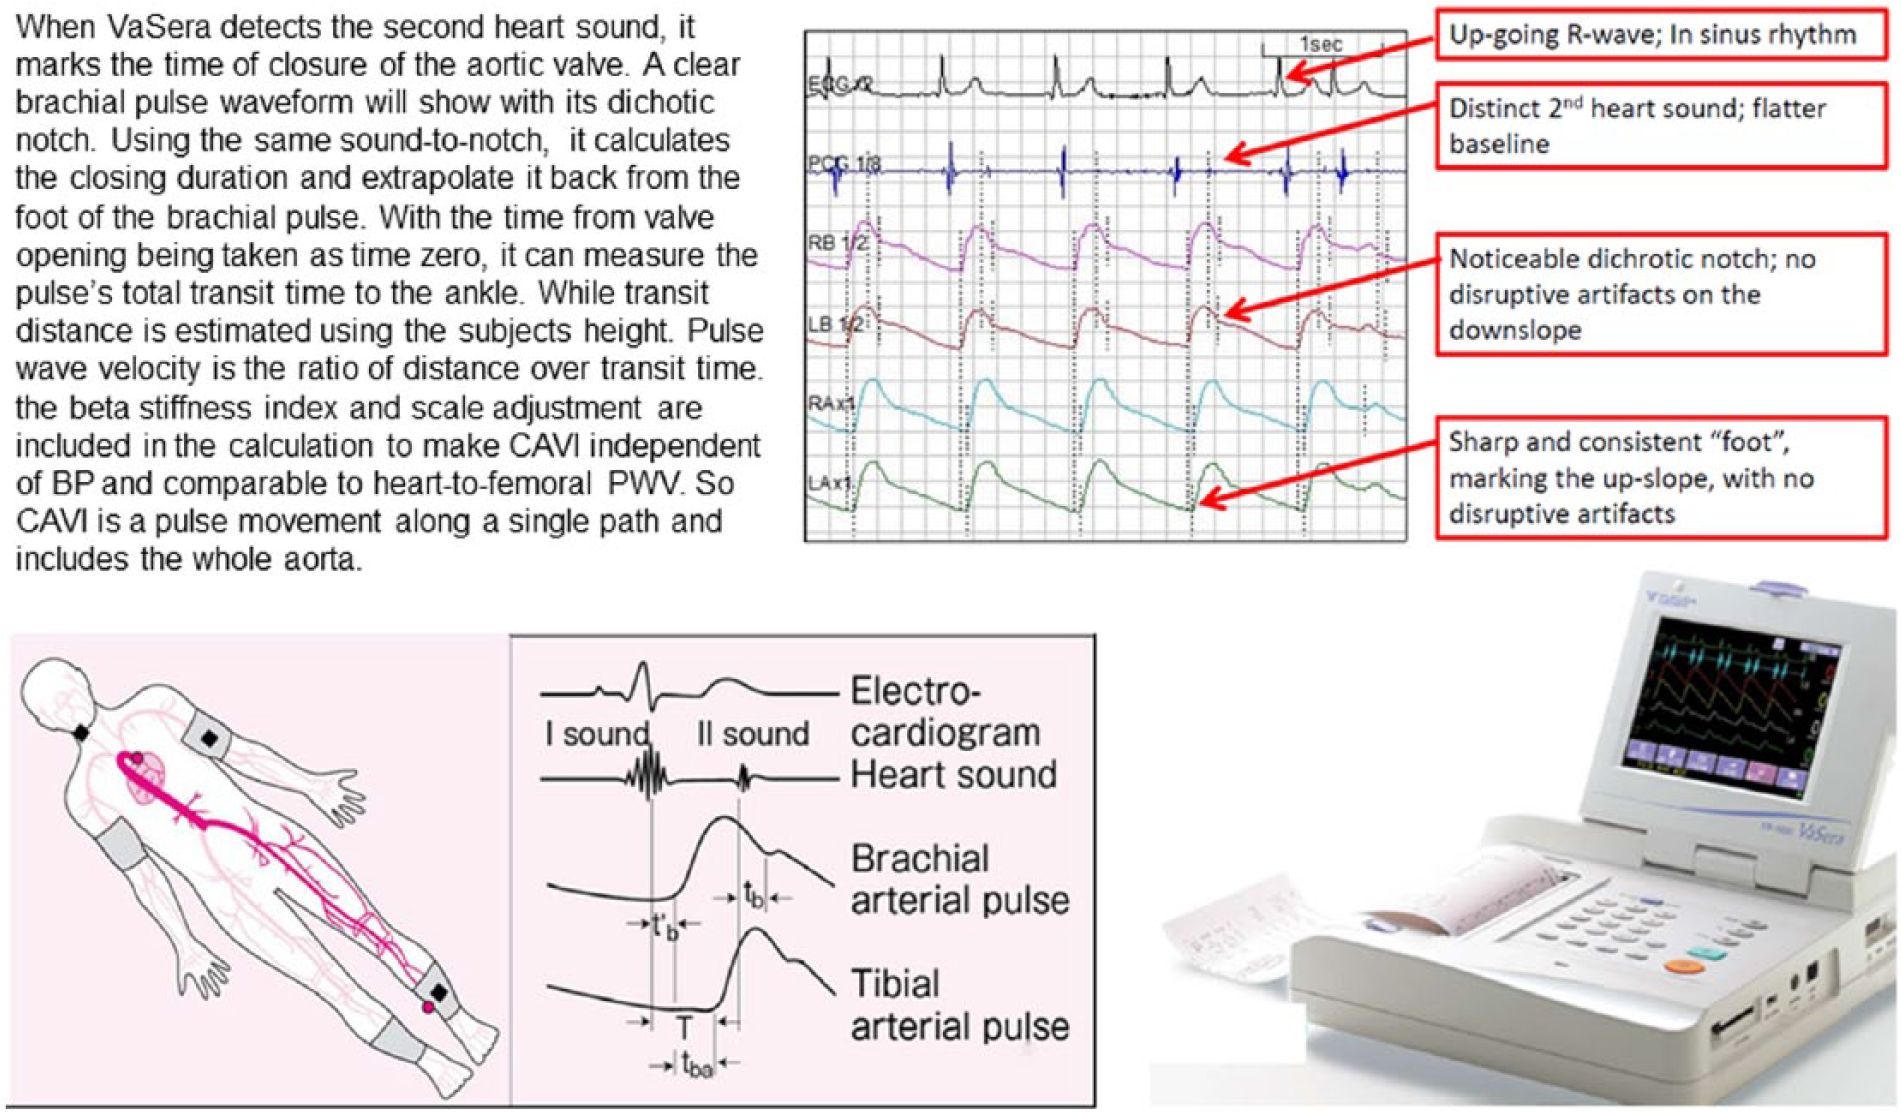
Illustration of how the cardio-ankle vascular index (CAVI) is calculated. (Illustrations used with permission from Fukuda Memorial Foundation for Medical Technologies.)
Echocardiographic evaluation
LV end-systolic and diastolic dimensions, septal and posterior wall thickness, LV ejection fraction, systolic and diastolic function were measured according to the guidelines of the American Society of Echocardiography.20,21 The average of the peak mitral annular systolic (s’) and early diastolic velocity (e’) at the medial and lateral wall was used to estimate LV systolic function and early diastolic relaxation using tissue Doppler. The ratio of early transmitral filling velocity (E) and e’ (E/e’) was used to estimate LV filling. LV mass was calculated from the simplified cubed equation formula and indexed to body surface area (LVMI). RWT was used as a surrogate of LV concentric geometry and calculated from the sum of LV septal and posterior wall thickness divided by LV internal dimension at the end of diastole.
Statistical methods
Patient characteristics in women and men were compared by t-test or chi-squared test. Candidate determinants of CAVI included age, sex, body mass index (BMI), systolic BP (SBP), diastolic BP (DBP), heart rate, hypertension, diabetes, hyperlipidemia, smoking status (ever), chronic kidney disease (CKD); s’ and e’ were log-transformed to reduce skewed distribution. Associations of clinical variables with CAVI and associations of CAVI with LVMI, RWT, log-s’ and log-e’ were assessed by multivariable linear regression analyses, after adjustment for age and sex. Age and sex interactions with CAVI were assessed. Multivariable stepwise regression analysis was used to select the most significant variables using p ≤ 0.25 to enter and p > 0.1 to leave the model, starting from all clinical variables and interaction terms. Variables retained in the model after stepwise elimination were used to construct final models. A two-sided p-value < 0.05 for main effect and < 0.1 for interaction were considered statistically significant.
Results
Patient characteristics are shown in Table 1. Briefly, the mean age of participants was 60.3±14.6 years, 54% were men, and ~ 60% had hypertension or hyperlipidemia. The prevalence of hyperlipidemia and ever-smoking was higher in men than women, whereas the prevalence of hypertension, diabetes and CKD were similar in both sexes. Women had worse s’, better e’ and lower LVMI than men, and the mean RWT and E/e’ were similar in both sexes. Men had a higher CAVI than women.
Patient characteristics for all participants and stratified by sex.
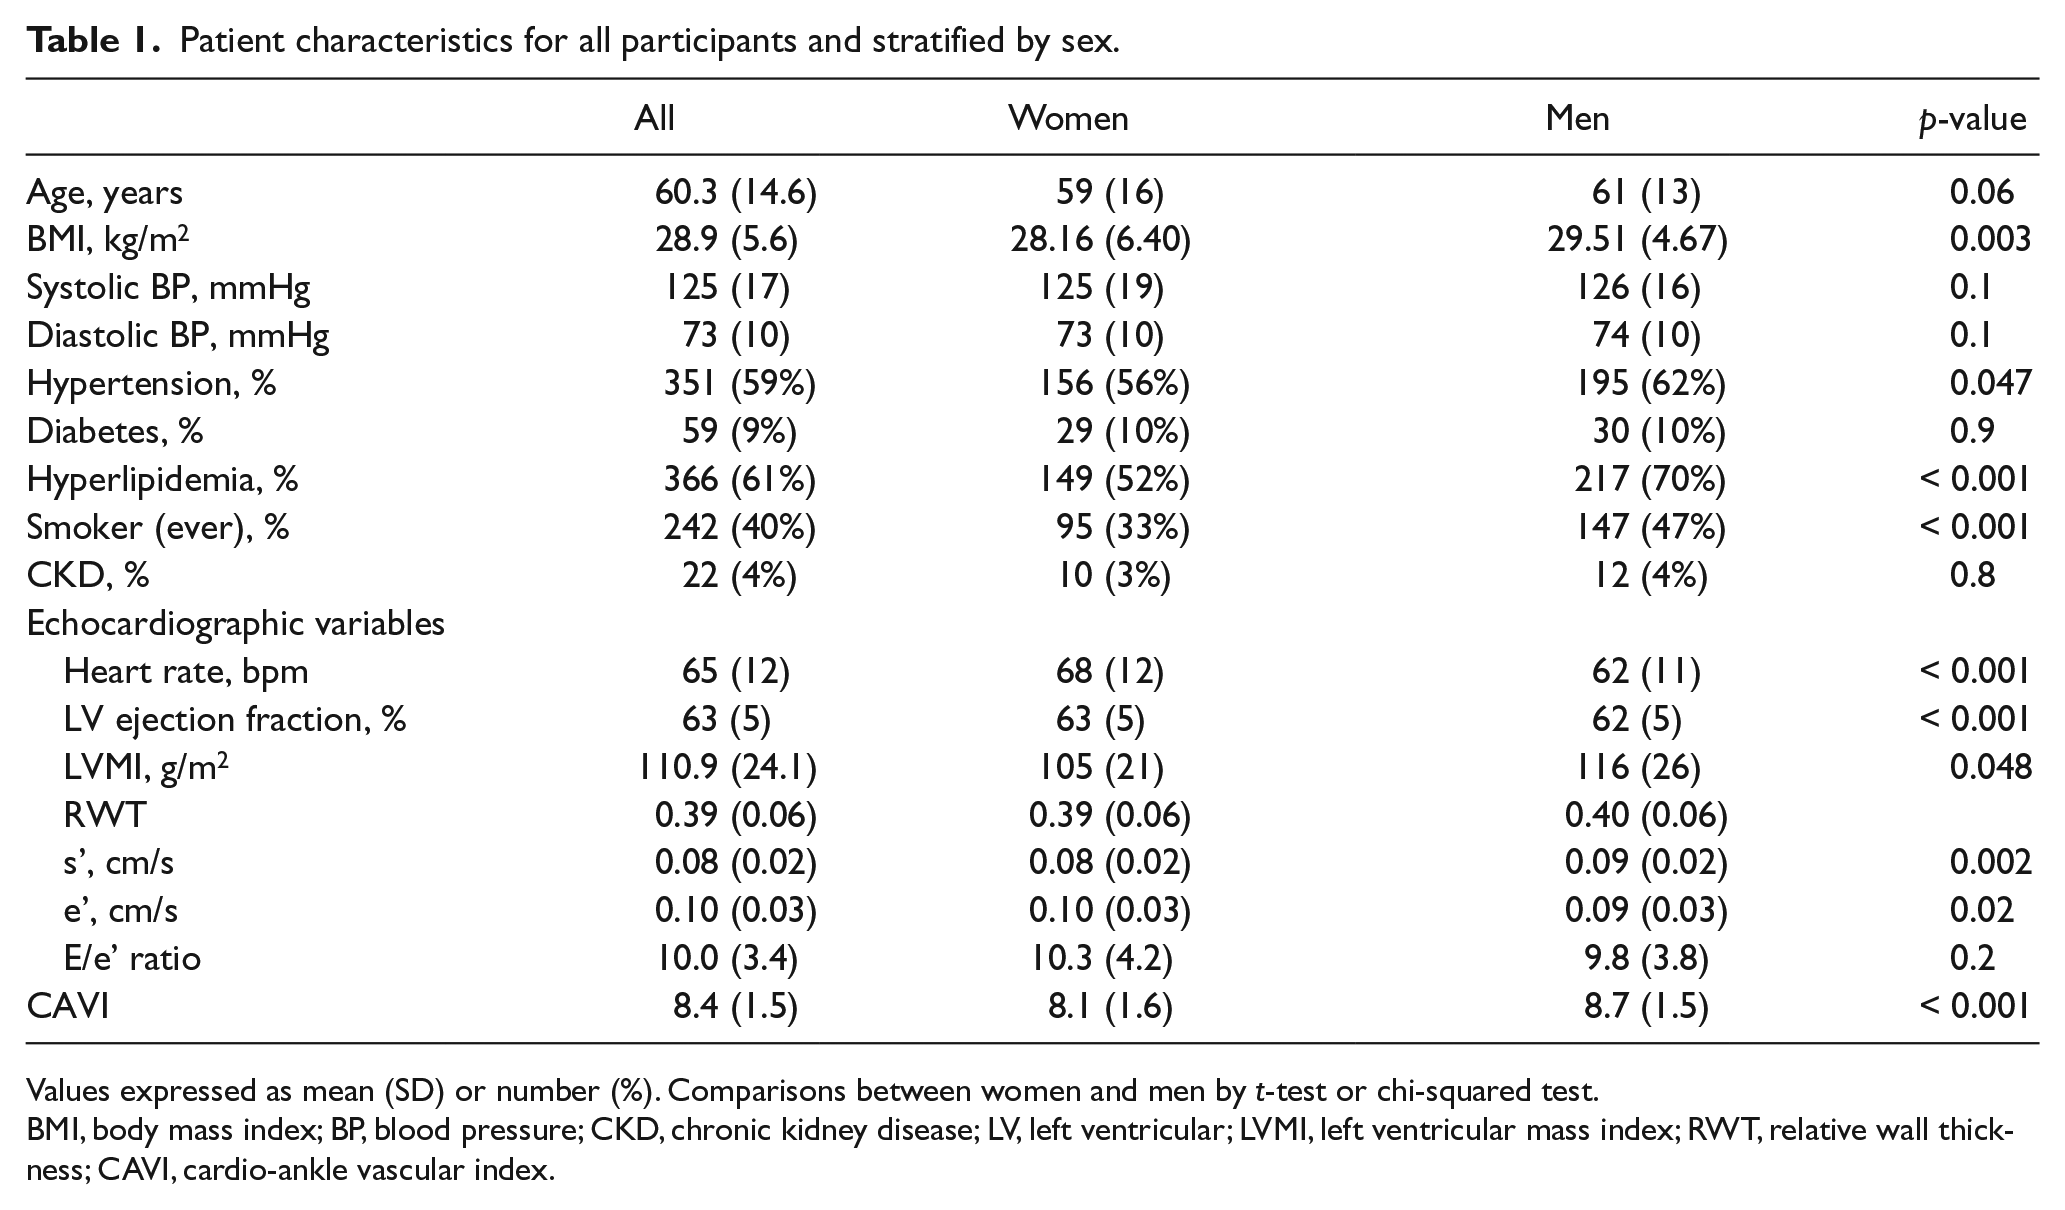
Values expressed as mean (SD) or number (%). Comparisons between women and men by t-test or chi-squared test.
BMI, body mass index; BP, blood pressure; CKD, chronic kidney disease; LV, left ventricular; LVMI, left ventricular mass index; RWT, relative wall thickness; CAVI, cardio-ankle vascular index.
Older age and male sex were associated with a higher CAVI (univariate β = 0.07 and 0.27, respectively, both p < 0.001). After adjustment for age and sex, a lower BMI, a higher SBP, hypertension and CKD were each associated with a higher CAVI (all p < 0.05). The final multivariable linear regression model (Table 2) explained 56% of the interindividual variation in CAVI. When the analyses were stratified by sex (Table 2), age, BMI and CKD were associated with CAVI in both women and men; SBP was associated with CAVI in women; DBP, hypertension, hyperlipidemia and diabetes were associated with CAVI in men.
Determinants of CAVI in all participants and stratified by sex.
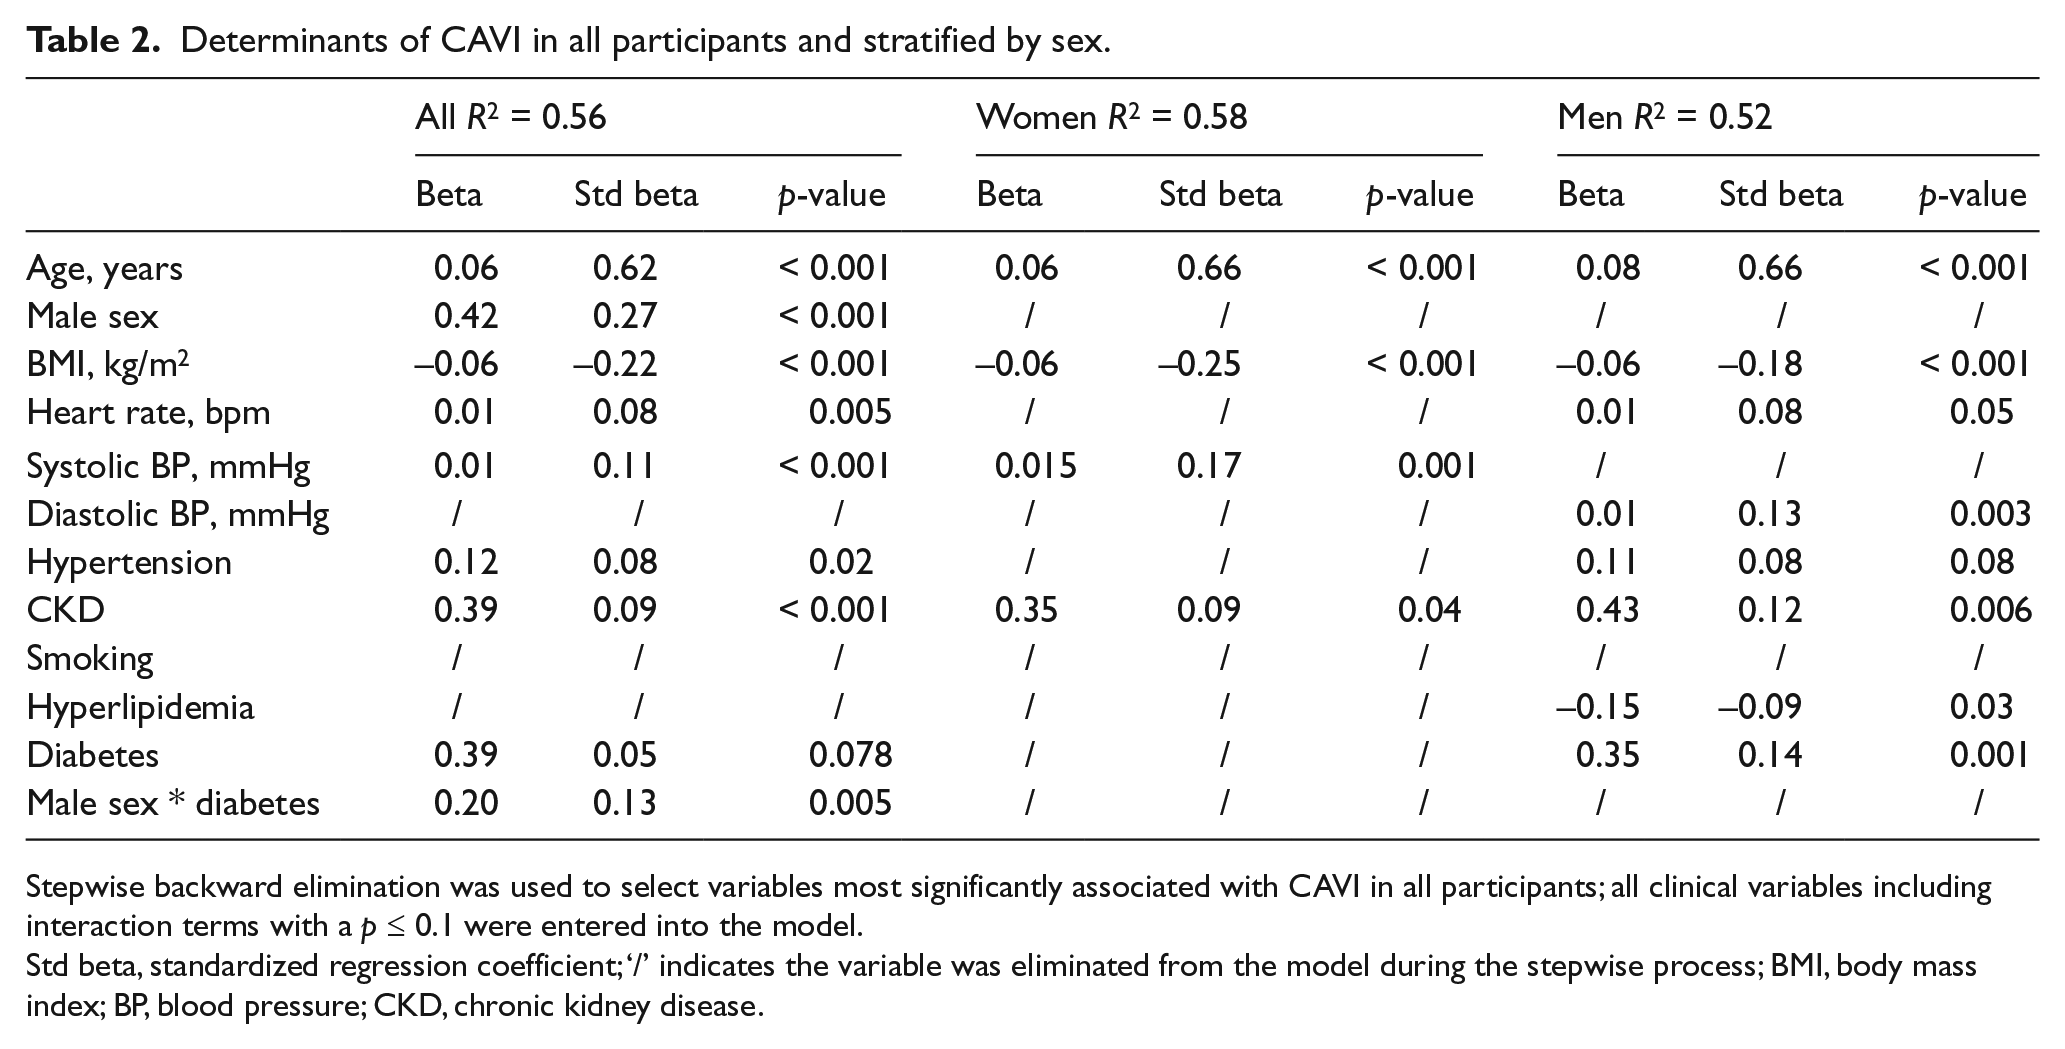
Stepwise backward elimination was used to select variables most significantly associated with CAVI in all participants; all clinical variables including interaction terms with a p ≤ 0.1 were entered into the model.
Std beta, standardized regression coefficient; ‘/’ indicates the variable was eliminated from the model during the stepwise process; BMI, body mass index; BP, blood pressure; CKD, chronic kidney disease.
A higher CAVI was associated with a worse log-s’ (univariate β = −0.04, p < 0.001); the association remained significant after adjustment for age, sex and LV ejection fraction (multivariable-adjusted β = −0.02, p = 0.04). No significant interaction of CAVI with sex was detected (p for interaction ≥ 0.2). A higher CAVI remained associated with a worse log-s’ after adjustment for remaining covariates (multivariable-adjusted β = −0.25, p = 0.001).
A higher CAVI was associated with a lower log-e’ (univariate β = −0.01, p < 0.001). In the final regression model for log-e’, age, BMI, DBP and CAVI remained associated with a lower log-e’ (multivariable-adjusted β = −0.01, –0.004, –0.004, –0.04, respectively, all p ≤ 0.03) and together explained 40% of the interindividual variation in log-e’. CAVI remained associated with log-e’ after further adjustment for LVMI or RWT or both (multivariable-adjusted β = −0.04, p < 0.001 for all). When LVMI and RWT were both included, the association of LVMI with log-e’ was stronger than RWT (multivariable-adjusted β = −0.002, p = 0.003 for LVMI; β = 0.20, p = 0.3 for RWT). In sub-analysis, a higher CAVI was associated with a higher log-E/e’ in men (multivariable-adjusted β = 0.09, p = 0.004), but not in women (p = 0.8) (p for interaction of sex with CAVI = 0.02). Multivariable-adjusted log-s’ and log-e’ based on quartiles of CAVI are shown in Figure 2.
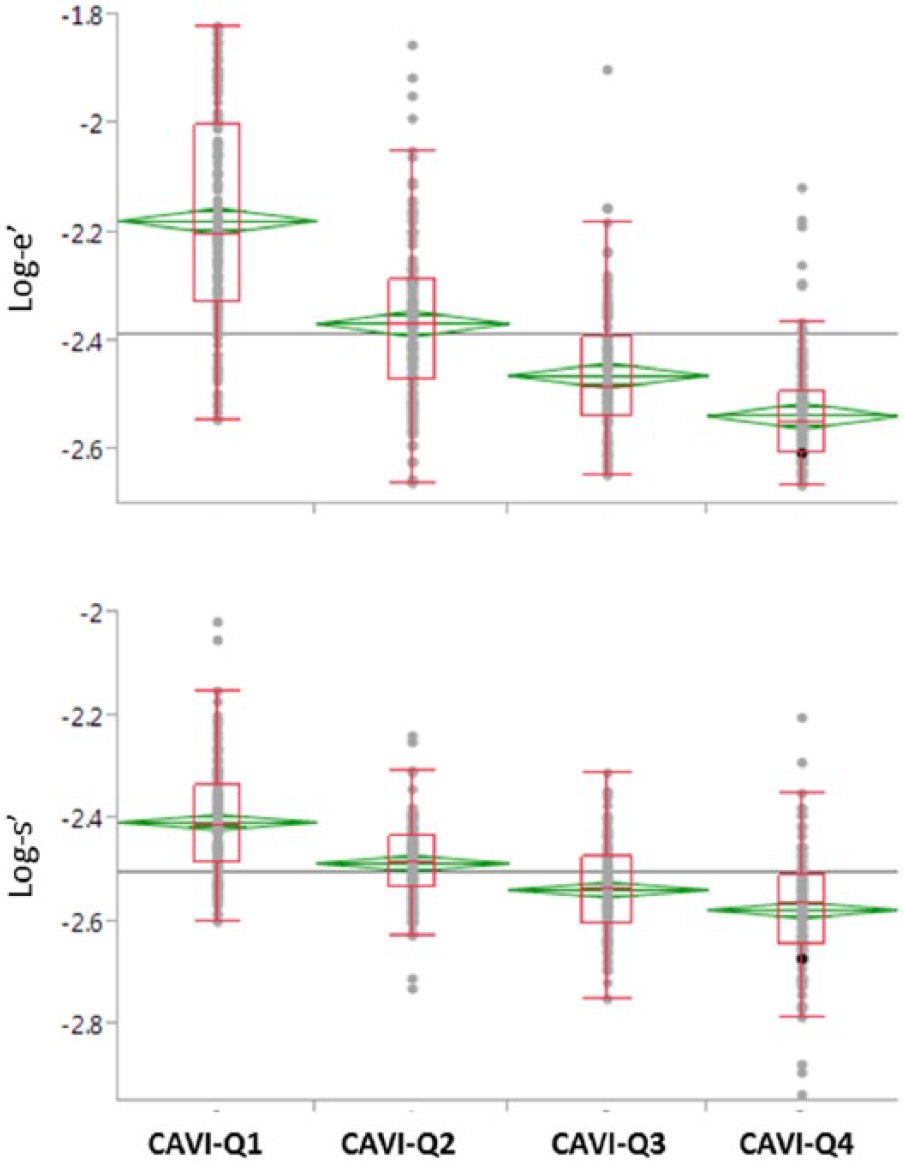
Multivariable-adjusted log-s’ and log-e’ according to quartiles of the cardio-ankle vascular index (CAVI). Q1: CAVI ≤ 7.35; Q2: 7.35 < CAVI ≤ 8.51; Q3: 8.51 < CAVI ≤ 9.46; Q4: CAVI > 9.46. P for ANOVA < 0.001 for both comparisons. Diamonds indicate the mean of that CAVI quartile. Box plots indicate 25% and 75% quartiles, and 95% confidence interval of that CAVI quartile.
A higher CAVI was associated with a greater LVMI and RWT (univariate β = 2.43 and 0.01, respectively, both p < 0.001). Sex modified the associations of CAVI with LVMI, and the association of BMI with RWT (p for sex interaction, both < 0.03).
The univariable and multivariable adjusted associations of CAVI with LVMI and RWT are presented in Table 3. In multivariable linear regression analysis, variables independently associated with LVMI were: age (β = 0.28), BMI (β = −0.50), DBP (β = 0.14), HR (β = −0.30), hyperlipidemia (β = −13.37, all p < 0.05) and CAVI*sex, but not CAVI (p for CAVI*sex = 0.02, p for CAVI = 0.5). Sex-specific associations with LVMI are shown in Table 4. In women, CAVI, BMI and diabetes remained associated with higher LVMI; in men, CAVI was not associated with LVMI after stepwise regression. Variables independently associated with RWT were: BMI (β = 0.002), DBP (β = 0.002), HR (β = 0.001), hyperlipidemia (β = 0.007), diabetes (β = −0.09), CKD (β = 0.16), and CAVI (β = 0.04, all p < 0.05). Sex modified the association of BMI with RWT (p = 0.07). In both women and men, age and CAVI were associated with RWT; hyperlipidemia, diabetes and age*diabetes were associated with RWT in women; BMI, HR, CKD, smoking and age*smoking were associated with RWT in men (Table 4).
Sex-specific associations of CAVI with LVMI and RWT.
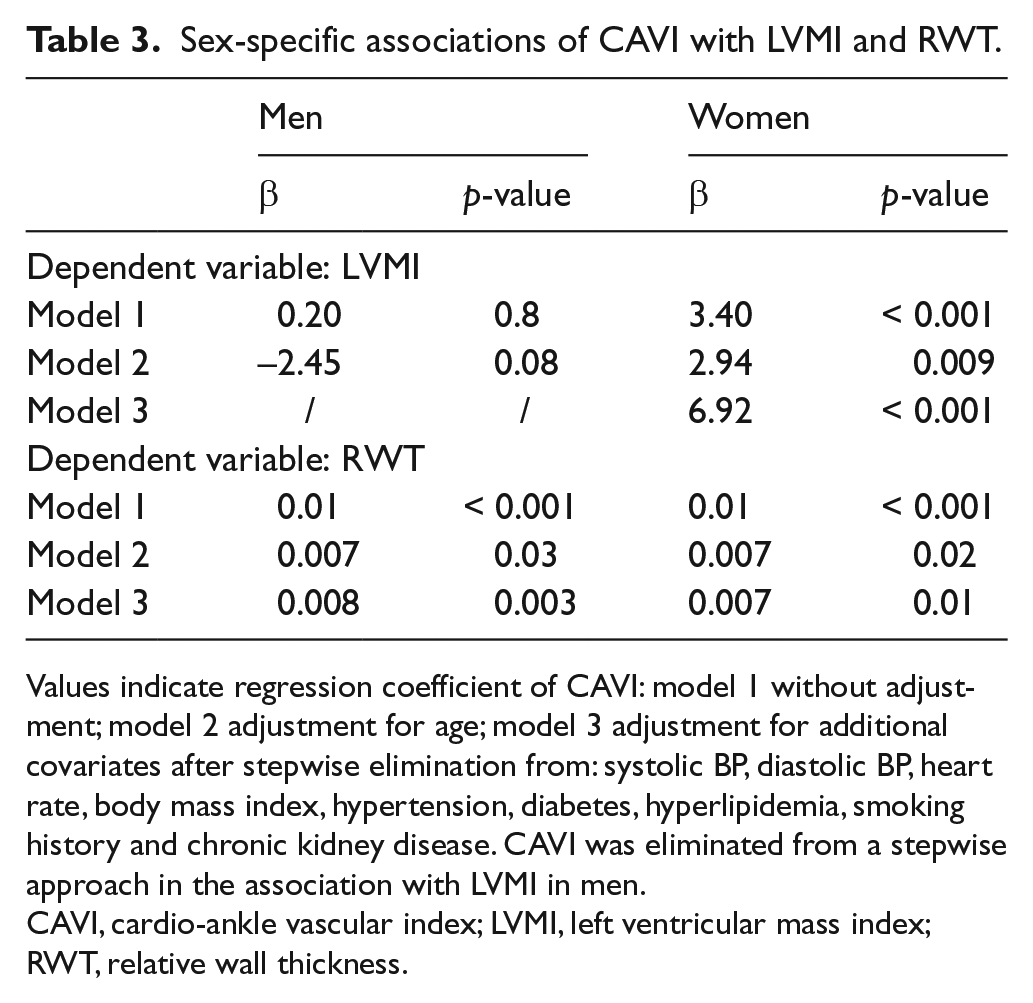
Values indicate regression coefficient of CAVI: model 1 without adjustment; model 2 adjustment for age; model 3 adjustment for additional covariates after stepwise elimination from: systolic BP, diastolic BP, heart rate, body mass index, hypertension, diabetes, hyperlipidemia, smoking history and chronic kidney disease. CAVI was eliminated from a stepwise approach in the association with LVMI in men.
CAVI, cardio-ankle vascular index; LVMI, left ventricular mass index; RWT, relative wall thickness.
Multivariable linear regression analysis of LVMI and RWT stratified by sex.
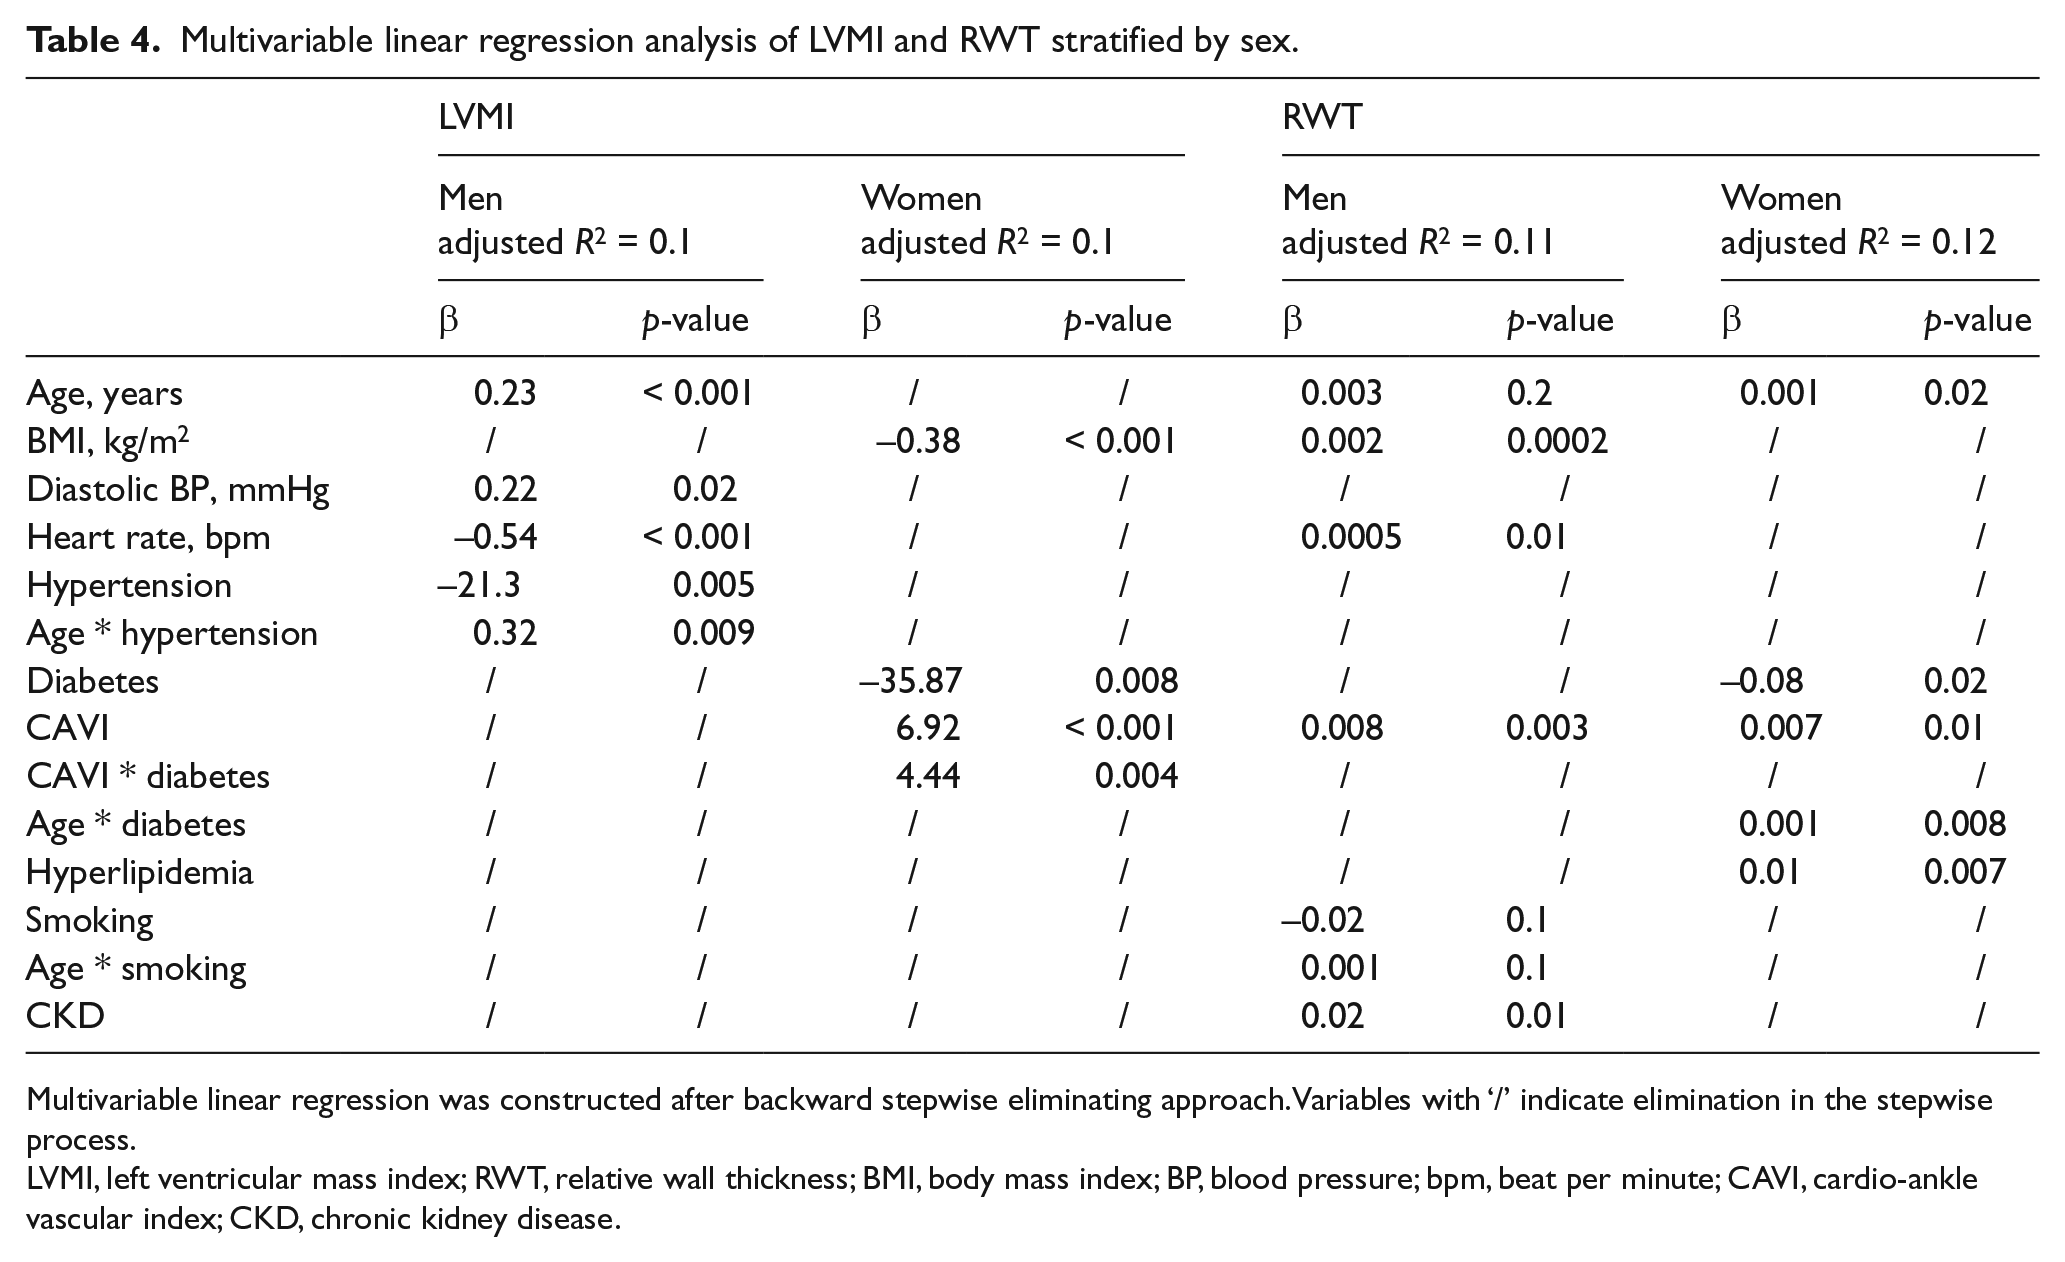
Multivariable linear regression was constructed after backward stepwise eliminating approach. Variables with ‘/’ indicate elimination in the stepwise process.
LVMI, left ventricular mass index; RWT, relative wall thickness; BMI, body mass index; BP, blood pressure; bpm, beat per minute; CAVI, cardio-ankle vascular index; CKD, chronic kidney disease.
Discussion
In a prospective study of individuals without ASCVD or structural heart disease, we assessed associations of CAVI with LV geometry, systolic function and diastolic relaxation. The major findings of our study are: (1) older age, male sex, lower BMI, history of hypertension and CKD are associated with a higher CAVI; and (2) a higher CAVI is associated with greater RWT, worse systolic function and worse diastolic relaxation assessed by tissue Doppler, independent of BP and conventional risk factors. In addition, we demonstrated CAVI to be associated with LVMI in women; and a stronger association of a higher CAVI with greater early diastolic filling in men than in women.
Determinants of CAVI
Two large population-based studies have reported variables associated with CAVI, one in 1380 healthy Koreans 22 and the other in 1014 Japanese without ASCVD. 23 Older age, male sex, lower BMI and higher SBP were independently associated with a higher CAVI in multivariable regression analysis. Several studies assessed the determinants of CAVI in patients with cardiovascular risk factors, such as those with metabolic syndrome, 24 hypertension, 25 or hyperlipidemia, 26 revealing age as the most significant contributor to CAVI and a higher CAVI in men than in women. We confirmed previously reported associations of age, sex, BMI and SBP with CAVI, and these together accounted for 54% of the interindividual variation in CAVI. Hypertension, diabetes and CKD accounted for an additional 2% (Table 2). Conventional cardiovascular risk factors play an important role in ASCVD. The modest effect of these variables on interindividual variation in CAVI suggests different pathways mediate arterial stiffness and atherosclerosis in addition to pathways common to both conditions.
The association of BMI with PWV has varied in previous reports.27–30 This may be due to different methodologies employed to assess PWV. An inverse association may result from ‘a vascular adaptation’ to obesity, 31 including decreased peripheral vascular resistance and vasodilation to accommodate greater hemodynamic arterial load for a larger body size. Insulin is a vasodilator and the association of obesity-related insulin-resistance with decreased arterial stiffness has been reported. 32 Longitudinal studies of BMI and arterial stiffness, or body fat, 33 may help elucidate the effect of obesity on arterial stiffness.
We noted that the association of CKD with a higher CAVI was stronger than with factors such as hypertension, hyperlipidemia, smoking or diabetes (Table 2). The kidneys are a low-resistance and high-flow organ and, thus, vulnerable to increased arterial load. Arterial stiffening leads to increased renal pulsatility that can damage glomeruli and decrease renal function.34,35 Conversely, endothelial dysfunction, increased oxidative stress, and the activation of the renin-angiotensin-aldosterone system in the presence of impaired renal function 36 may contribute to greater arterial stiffness in patients with CKD than in those without. Previous studies reported increased arterial stiffness in patients with end-stage CKD compared to healthy participants.13,37,38 The association of higher arterial stiffness with CKD stage/reduced renal function were reported in the Chronic Renal Insufficiency Cohort study (CRIC) 39 and a Japanese cohort. 40 However, Upadhyay et al. did not find arterial stiffness to be associated with incident CKD in the Framingham Heart Study. 41
Associations of CAVI with LV function and geometry
We previously reported the association of greater aortic characteristic impedance (Zc), a determinant of pulsatile arterial load, with worse LV longitudinal strain in adults from hypertensive families. 42 Consistent with this finding, we found that a higher CAVI, a measure of aortic wall stiffness, was associated with worse LV longitudinal movement as measured by s’, independent of LV ejection fraction. Our results highlight the effect of arterial stiffness on LV longitudinal function in the setting of preserved LV ejection fraction. The association of a higher CAVI with worse log-e’ was consistent with results from the Framingham Heart Study. 7 Interestingly, despite the association of a higher CAVI with worse e’ in both sexes, the association of CAVI with E/e’ was stronger in men than in women. Increased diastolic filling as assessed by E/e’ is an adaptive response of the LV to compensate for impaired diastolic relaxation (assessed by e’ in our study). A weaker association of CAVI with early diastolic filling in women than in men as opposed to a similar association with diastolic relaxation in both sexes, in addition to a stronger association of a higher CAVI with greater LVMI in women than in men, suggests greater susceptibility of diastolic relaxation and concentric geometry to altered arterial stiffness in women than in men.
Kaess et al. 7 reported that the association of cf-PWV with LVMI and LV wall thickness was not independent of BP in participants of the Framingham Heart Study, as did a study of hypertensive families in which cf-PWV was not associated with LVMI or sex difference. 4 Ohyama et al. 8 reported a significant association of higher aortic arch PWV with greater LVMI and LV concentricity (ratio of LV mass over volume) in participants of the Multi-Ethnic Study of Atherosclerosis (MESA). A similar association of proximal aortic wall stiffness with LVMI was reported in participants of the AGES-Reykjavik study. 43 Our study is the first to report an association of CAVI with LV function and geometry in adults without ASCVD or structural heart diseases. CAVI reflects global arterial stiffness and includes the proximal aortic segment which is not accounted for by cf-PWV. This may explain differences in results using different measures of PWV. Of note, the association of CAVI with LV mass and RWT in our study is similar to that of proximal aortic stiffness measured by magnetic resonance (MR) in previous reports,8,43 suggesting that the impact of LV afterload determined by the elastic property of proximal aorta on LV that may not be captured by cf-PWV. The lack of sex differences in the association of CAVI with LVMI in previous studies may be due to differences in patient characteristics.
The property of the proximal aorta is the primary determinant of arterial stiffness, affecting the magnitude of both pulsatile and resistive arterial load, and velocity of the forward-traveling wave and reflected wave. Mid-late systolic arterial load is increased by early arrival of the reflected wave to the left ventricle and was associated with worse early-diastolic relaxation in the Asklepios study 44 and incident heart failure in the MESA study. 45 Zc, 46 arterial compliance and wave reflection 5 that correspond to early versus late systolic arterial load, respectively, all have been shown to be associated with LV hypertrophy or remodeling. Further study is needed to assess the association of CAVI with components of arterial load and measures from wave separation analysis which may decompose the effect of CAVI on LV function and geometry according to the time-domain of the cardiac cycle.
Our study is the first to report an association of CAVI with LV function and geometry in a large referral population. CAVI can be performed rapidly, with good reproducibility in the office setting and at the same time, without errors or variation in measurement generated by body surface measures. 14 As such, it may be useful for office-based assessment of arterial stiffness to refine risk prediction in primary prevention. In addition, as a measure of global stiffness that includes the proximal aorta, CAVI could be used to assess the impact of LV afterload on cardiac function and structure, and may predict adverse cardiovascular outcomes directly related to LV dysfunction and LV structural abnormalities.
Limitations
Several limitations merit consideration. First, our cohort consisted of patients referred for echocardiography at a tertiary medical center. However, the prevalence of conventional risk factors in our study was similar to that in other community-based studies.47,48 Second, this is a cross-sectional study and we are unable to draw any causal inferences for the observed associations. Longitudinal studies may provide further evidence for causality. Third, our study did not include measures from pulse wave analysis (cf-PWV, forward and reflected wave) and measures of pulsatile and resistive arterial load. Thus, we were unable to assess the correlation of CAVI with these measures, or compare these parameters with CAVI for their associations with LV function and geometry. Fourth, we did not have information on hypertensive medications which may confound our analysis of CAVI.
Conclusion
In conclusion, we assessed the association of CAVI with LV geometry, systolic function and early diastolic relaxation in 600 adults without ASCVD. We demonstrated that a higher CAVI was associated with worse s’, worse e’ and greater RWT; and the association with LVMI was stronger in women than in men. Additional studies are needed to assess whether CAVI is predictive of adverse cardiovascular events.
Footnotes
Declaration of conflicting interests
The authors declared no potential conflicts of interest with respect to the research, authorship, and/or publication of this article.
Funding
The authors disclosed receipt of the following financial support for the research, authorship, and/or publication of this article: the study was supported by a research grant from Fukuda Memorial Foundation for Medical Technologies. The sponsor had no role in the study design or interpretation of results.