
Abstract
Objective
To investigate the inter-relationships between left ventricular mass (LVM), left ventricular (LV) geometry and arterial stiffness parameters (aortic pulse wave velocity [Ao-PWV] and heart rate-corrected augmentation index [c-AIx]) in patients with chronic heart failure (CHF).
Methods
This study was a secondary analysis of existing data that were collected from patients with CHF New York Heart Association class I–III with reduced ejection fraction (HFrEF) or preserved ejection fraction (HFpEF). Transthoracic echocardiography was performed on all patients, along with measurement of arterial stiffness parameters (Ao-PWV and c-AIx) using sphygmocardiography.
Results
A total of 73 patients (58 males) with a mean ± SD age of 55.9 ± 11.6 years were enrolled in this study. Of these, 20 patients (27.4%) had systemic hypertension, 46 (63.0%) had type 2 diabetes mellitus. Ischaemic heart disease was the main aetiology of CHF (63 of 73 patients; 86.3%). In multiple linear regression, the left ventricular mass index (LVMI) was significantly associated with c-AIx (β = –1.59) and EF (β = –1.51). Comparison of Ao-PWV among the four LV geometric patterns revealed significant differences.
Conclusion
In this cohort of CHF patients, LVMI was predicted by c-AIx and EF. The corresponding values of Ao-PWV were parallel in different LV geometric patterns and confirmed their adverse prognostic values.
Keywords
Introduction
Cardiovascular diseases and their complications are among the main cause of death worldwide. 1 The list of recognized cardiovascular risk factors identifies left ventricular hypertrophy (LVH) as an independent risk factor, which was associated with significant cardiovascular morbidity and mortality in the Framingham Heart Study population. 2 While defined as an increase in the muscle mass of the left ventricle (LV) and described as a risk factor, LVH appears to be an adaptive process in response to systemic and regional haemodynamic factors and hence can also be described as target organ damage. 3 In addition to LV mass (LVM) itself, the geometric pattern of the LV carries its own independent prognostic significance. For example, the Framingham Heart Study demonstrated that subjects with concentric hypertrophy had the worst prognosis, followed by those with eccentric hypertrophy, concentric remodelling and normal geometry. 4 Patients with chronic heart failure (CHF) are expected to have an element of LVH, either because of a pre-existing hypertensive heart disease that has become complicated by CHF; 5 or because of pre-existing coronary artery disease that predisposes to the development of LVH, even when blood pressure is normal. 6
Recently, arterial stiffness (AS) has also been recognized as an independent cardiovascular risk factor, with major prognostic importance particularly attributed to carotid-femoral (aortic) pulse wave velocity (Ao-PWV), more than augmentation index (AIx). 7 The Framingham Heart Study reported that a single standard deviation increase in Ao-PWV was associated with a 48% increase in risk for a first major cardiovascular event. 8 Increased Ao-PWV in patients with CHF in particular is strongly associated with a poor prognosis. 9 In addition to an increased cardiovascular risk, higher Ao-PWV together with a higher LVM plays a role in the development of cognitive impairment in later age in the general population;10,11 a phenomenon that is commonly linked to heart failure. 12 The relationship however between arterial stiffness and LVM in patients with CHF has not been specifically studied. Previous studies have shown that AS, in particular the parameter of backward wave pressure, contributes to LVM and LVH.13,14 The present study aimed to observe the inter-relationships between LVM, LV geometry and AS parameters in patients with CHF.
Patients and methods
Study design and patient population
This study was a secondary analysis of existing data that were collected from patients with CHF New York Heart Association (NYHA) class I–III with reduced ejection fraction (HFrEF) or preserved ejection fraction (HFpEF). These patients had participated in a prospective, randomized, double-blind, placebo-controlled study that assessed the short-term effect of allopurinol treatment on AS parameters. 15 This study was conducted at King Fahd Hospital of the University-AL Khobar, Saudi Arabia between February 2011 and August 2013.
Patients aged >18 years with clinically stable, compensated CHF (NYHA functional class I–III) with reduced or preserved ejection fraction (EF) were recruited to the study. Heart failure was defined by the presence of exercise intolerance, along with signs of volume overload (pulmonary congestion, raised jugular venous pressure and peripheral oedema). Reduced systolic function was defined as left ventricular EF <50%. All patients received optimal anti-heart failure medications and they were on sodium restriction (defined as <3 g/day) and fluid restriction (<1.5 l/day). Clinical stabilization of cardiac status and optimal medications were required for at least 3 months before enrolment. Patients were excluded if they had any of the following: (i) creatinine clearance of <60 ml/min; (ii) admission to hospital within the previous 3 months due to decompensated heart failure or new ischaemic event; (iii) uncontrolled blood pressure (BP) (>160/100 mmHg).
The protocol was approved by the Research Ethics Committee, Deanship of Scientific Research, Imam Abdulrahman Bin Faisal University, Dammam, Saudi Arabia (no. 201065). Written informed consent was obtained from all patients and the study was conducted in accordance with the Declaration of Helsinki.
Study procedure
Transthoracic echocardiography was performed using a Vivid E9 machine (GE Medical Systems, Waukesha, WI, USA) equipped with a 3 MHz transducer. Parasternal and apical 2-dimensional echocardiogram (2D) was also performed.
Measurement of LVM
The LVM was calculated according to the guidelines of the American Society of Echocardiography and the European Association of Cardiovascular Imaging, using linear measurements derived from 2D images according to the following equation:
16
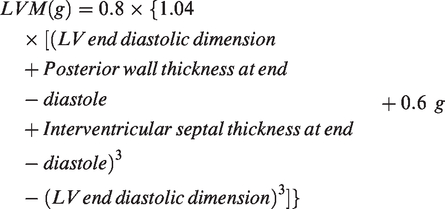
The LVM was indexed to body surface area (BSA) (g/m2) and referred to as the left ventricular mass index (LVMI) because of the strong association between LVM and BSA. 17 Left ventricular relative wall thickness (RWT) was calculated using the formula (2 × posterior wall thickness)/(LV end-diastolic dimension). 16 This allows further classification of LV geometry, according to the following criteria: 16 (i) patients with normal LVM can either have normal geometry (RWT ≤0.42) or concentric remodelling (RWT ≥0.42); (ii) patients with increased LVM can have either concentric hypertrophy (RWT ≥0.42) or eccentric hypertrophy (RWT ≤0.42).
Measurement of AS parameters
Patients had to report in a fasted state (12 h) within 2 weeks of their echocardiography visit. Water and morning medications were allowed. After 30 min of supine rest, two readings of BP were taken using a CARESCAPE V100 vital signs monitor with Dinamap technology (GE El Seif Healthcare Arabia, Riyadh, Saudi Arabia). Pulse wave analysis (PWA) and pulse wave velocity (PWV) were measured using a SphygmoCor® system (AtCor Medical Pty Ltd., Sydney, Australia). PWA was started by performing eight readings of AIx that were corrected for a heart rate of 75 beats/min (c-AIx). PWA software allows derivation of the corresponding central BP data from the derived central pressure wave for systolic BP (c-SBP), diastolic BP (c-DBP), mean arterial pressure (c-MAP) and pulse pressure (c-PP). The types of arterial pressure waves were characterized into four types: A, B, C and D; 18 where AIx was >12%, >0.0% and ≤ 12%, ≤0.0% or >>12%, respectively (Supplement 1). Furthermore, aortic backward wave pressure and reflection index were determined from the wave separation analysis of the SphygmoCor®-derived aortic waveform. PWV followed by two readings for Ao-PWV (carotid-femoral) and two readings for brachial pulse wave velocity (carotid-radial). Details on the methodology, reporting and interpretation of AS parameters were covered in the original study. 15
Statistical analyses
All statistical analyses were performed using Minitab statistical software, version 18 (Minitab Inc., State College, PA, USA). Baseline data are presented as mean ± SD for continuous variables and as number and percentages for categorical variables. Median and ranges of values were used for data that were not normally distributed. Comparisons were made using unpaired Student’s t-test for continuous variables or the χ2-test for categorical variables. The Mann–Whitney U-test was used for data that were not normally distributed. Relationships between continuous variables were quantified using Spearman’s rank correlation coefficient. The primary endpoint (i.e. the interaction between AS parameters (Ao-PWV and c-AIx) and LVMI) was tested using multiple regression analysis. One-way analysis of variance and Kruskal–Wallis tests were used for the secondary endpoint (i.e. the comparison of AS parameters among different LV geometry patterns). A P-value <0.05 was considered statistically significant.
Results
This study analysed data from 73 patients (58 males, 15 females) with CHF NYHA class I–III. The most common aetiology of CHF was ischaemic heart disease (63 of 73 patients; 86.3%). Of the 73 patients, 20 (27.4%) had a history of systemic hypertension, 46 patients (63.0%) had type 2 diabetes mellitus and six (8.2%) had atrial fibrillation (Table 1). The peripheral BP, AS parameters, LVM, LVMI and biochemical characteristics of the patients are presented in Table 2. The mean ± SD central BP figures for the entire study cohort were as follows (mmHg): c-SBP was 119.3 ± 18.7 (95% confidence interval [CI] 114.9, 123.6); c-DBP was 73.3 ± 11.0 (95% CI 70.7, 75.8); c-MAP was 92.6 ± 12.7 (95% CI 89.6, 95.5); and c-PP was 46.0 ± 15.2 (95% CI 42.5, 49.6). The baseline lipid profile data for the entire study cohort were as follows (median [interquartile range]; mg/dl): total cholesterol 150.0 (94.0–264.0), triglycerides 133.0 (22.0–380.0), high-density lipoprotein cholesterol 37.0 (22.0–70.0) and low-density lipoprotein cholesterol 87.0 (55.0–187.0).
Baseline clinical and demographic characteristics of the entire study cohort (n = 73) and the patients with chronic heart failure (CHF) stratified according to the absence or presence of left ventricular hypertrophy (LVH) and whether they had reduced ejection fraction (HFrEF) or preserved ejection fraction (HFpEF).

Data presented as mean ± SD or n of patients (%). Median (interquartile range) used for data that were not normally distributed.
aComparisons were made using unpaired Student’s t-test for continuous variables or χ2-test for categorical variables; Mann–Whitney U-test was used for data that were not normally distributed; NS, no significant between-group difference (P ≥ 0.05).
bSeven patients did not have their diastolic function assessed (in six, it was technically difficult; and in one, the patient had permanent atrial fibrillation).
BMI, body mass index; HHD, hypertensive heart disease; DCM, dilated cardiomyopathy; DM, diabetes mellitus; CM, cardiomyopathy; NYHA, New York Heart Association; ACEIs, angiotensin-converting enzyme inhibitors; ARBs, angiotensin receptor blockers; CCBs, calcium channel blockers.
Baseline haemodynamic, arterial stiffness, left ventricular and biochemical characteristics of the entire study cohort (n = 73) and the patients with chronic heart failure (CHF) stratified according to the absence or presence of left ventricular hypertrophy (LVH) and whether they had reduced ejection fraction (HFrEF) or preserved ejection fraction (HFpEF).

Data presented as mean ± SD or n of patients (%). Median (interquartile range) used for data that were not normally distributed.
aComparisons were made using unpaired Student’s t-test for continuous variables or χ2-test for categorical variables; Mann–Whitney U-test was used for data that were not normally distributed; NS, no significant between-group difference (P ≥ 0.05).
bReadings were based on 69 patients.
The patient population was then subdivided into two groups based on the presence or absence of LVH according to a normal range of 49–115 g/m2 for males and 43–95 g/m2 for females. 16 Accordingly, 20 patients (27.4%) were found to have LVH (five of them had underlying hypertension and two had hypertensive heart disease as an aetiology of CHF); while the remaining 53 did not have LVH (Table 1). Significantly higher values of LVM and LVMI were observed in patients with LVH compared with those without (P ≤ 0.001 for both comparisons) (Table 2). Patients with LVH were associated with less favourable LV geometry patterns (P ≤ 0.001) and they had significantly higher serum uric acid concentrations (P = 0.010) compared with the patients without LVH. The patients were subdivided into two groups according to their ejection fraction: 47 patients had HFrEF and 26 patients had HFpEF (Tables 1 and 2). With this classification, patients who had HFpEF had a significantly higher pulse pressure, higher aortic backward wave pressure, along with smaller LVM and LVMI, and a more favourable LV geometry as compared with patients who had HFrEF (P < 0.05 for all comparisons) (Table 2). Comparing their central BP and lipid profile data based on the presence of LVH or EF, the only significant difference that was observed was a higher c-PP in patients with HFpEF compared with those who had HFrEF (mean ± SD c-PP 51.9 ± 15.1 versus 42.8 ± 14.4 mmHg, respectively; P = 0.016).
Spearman’s rank correlation coefficient analysis for LVM and LVMI with age, body mass index (BMI), peripheral BP, central BP, EF and AS parameters showed that both LVM and LVMI had an inverse correlation with EF (P < 0.001 for both comparisons); and a positive correlation with serum creatinine (P < 0.05 for both comparisons) and serum uric acid (for LVMI only; P < 0.05) (Table 3). Neither LVM nor LVMI had any significant correlation with BP, either peripheral or central readings. The interaction between SBP and LVMI was plotted separately for those patients with LVH and those without LVH (Figure 1) and in patients with HFpEF and HFrEF (Figure 2). In terms of possible relationships with AS parameters, LVM had a significant inverse correlation with AIx for both the raw and heart rate-corrected values (P < 0.05 for both comparisons) (Table 3).
Correlation of clinical and arterial stiffness parameters with left ventricular mass and left ventricular mass index in the entire study cohort (n = 73) of patients with chronic heart failure.

*P < 0.05, **P < 0.001; Spearman’s rank correlation.

Scatterplot of left ventricular mass index (LVMI) versus systolic blood pressure in patients based on presence of left ventricular hypertrophy (LVH). Patients without LVH (A; n=53) and patients with LVH (B; n=20).

Scatterplot of left ventricular mass index (LVMI) versus systolic blood pressure in patients based on whether they had preserved ejection fraction (HFpEF; A; n = 26) or reduced ejection fraction (HFrEF; B; n = 47).
A multiple linear regression analysis involving all patients was performed to determine the predictors of LVMI (the outcome, dependent variable). Explanatory or independent variables included in the model were basic demographic factors (age, sex, BMI, SBP, PP), central SBP, central PP, c-AIx, aortic PWV, uric acid, serum creatinine, EF or the presence of underlying hypertension or type 2 diabetes mellitus. For LVMI as the dependent variable, significant predictors were c-AIx (β = –1.59, P = 0.002) and EF (β = –1.51, P ≤ 0.001). This suggests that patients with higher LVMI were likely to have lower AIx and lower EF. This model explained over 50% of the variability in LVMI, as indicated by R-square (Table 4). The inverse interaction between LVMI and c-AIx was explored further by subdividing the patient group according to sex, age (older or younger than the median age of 56 years) or based on the subtype of their arterial pressure waveform (type A, 55 patients; type B, nine patients; type C, one patient; type D, eight patients). In this subgroup analysis, age and sex continued to show an inverse interaction between LVMI and c-AIx (data not shown), whereas there was a different finding for the different arterial pressure waveforms. In Figure 3, patients with types B and C were analysed as one category (more healthy waveforms), while patients with types A and D were analysed as another category (more pathological waveforms).
Multiple linear regression model for left ventricular mass index for the entire study cohort (n = 73) of patients with chronic heart failure.


Scatterplot of left ventricular mass index (LVMI) versus heart rate-corrected augmentation index (c-AIx) in patients stratified according to their pulse wave type (type A, 55 patients; type B, nine patients; type C, one patient; type D, eight patients).
Comparison of the Ao-PWV values according to their LV geometric remodelling patterns identified that 32 patients had normal geometry, 14 had concentric remodelling, 20 had eccentric hypertrophy and seven had concentric hypertrophy. There were significant differences in the median Ao-PWV values in the four groups: 8.18, 10.03, 10.50 and 11.15 m/s, respectively (P = 0.019) (Table 5). A comparison of the reflection index values among the same categories showed an increasing reflection index for LV subtypes 1 to 4, but this did not reach statistical significance. No significant differences were found when comparing c-AIx and aortic backward wave pressure values among the same categories.
Comparison of aortic pulse wave velocity (PWV), heart rate-corrected augmentation index (c-AIx), aortic backward wave pressure and reflection index among different left ventricular (LV) geometry patterns for the entire study cohort (n = 73) of patients with chronic heart failure.

Data presented as mean ± SD. Median (interquartile range) used for data that were not normally distributed.
aComparisons were made using one-way analysis of variance and Kruskal–Wallis tests; NS, no significant between-group difference (P ≥ 0.05).
bOne patient did not have any baseline data for aortic-PWV and four had missing data on aortic backward wave pressure and reflection index.
LV subtypes: 1, normal geometry; 2, concentric remodelling; 3, eccentric hypertrophy; 4, concentric hypertrophy.
Discussion
Two-dimensional echocardiography remains the most widespread, convenient and standard method for the assessment of LVM, LV geometric remodelling patterns and the detection of LVH. In direct comparison with magnetic resonance imaging, 2D echocardiography provided a reliable performance for LVM assessment and detection of LVH (correlation coefficient of the two imaging modalities, r = 0.8, P < 0.001) with limited influence of image quality. 19 Assessments of AS have become more diverse with the derived indices and criteria reflecting different aspects of the pathophysiology of the arterial tree. Nevertheless, aortic PWV remains the ‘gold standard’ measure of cardiovascular risk. The interaction between measurements of LVM and AS has been previously studied, but mostly in the context of systemic hypertension.20–22
The findings of the present study were consistent with small scale studies conducted on hypertensive populations and it has shown similar findings with regard to the association between LVM and mid-wall fractional shortening,23,24 serum uric acid, 25,26 and serum creatinine level.27,28 However, the lack of a significant interaction between LVMI and blood pressure (most importantly SBP), as demonstrated in the Framingham Heart Study, 29 led to the present study considering the difference in these relationships based on the presence of LVH and underlying EF (Figures 1 and 2). In patients with CHF in the current study, there was a non-significant positive interaction between SBP and LVMI in patients without LVH and in those HFpEF; while, there was a non-significant inverse interaction between SBP and LVMI in patients with LVH and in those HFrEF.
The LVMI was predicted by two factors with inverse interactions, c-AIx and EF, while Ao-PWV was not found to be a significant predictor. The most abundant, comparable data in the published literature were based on either patients with systemic hypertension or those from community-based studies where the most abundant cardiovascular risk factor was systemic hypertension. For example, a few of these studies failed to show associations between AS indices and LVMI,20,21,30,31but several have shown positive interactions between LVMI and Ao-PWV,13,14,22,32 AIx,33,34 backward wave pressure, 13 cardio-ankle vascular index,35,36 aortic stiffness 37 and ambulatory arterial stiffness index. 25 Mixed results were reported from patients with chronic kidney disease/haemodialysis38–41 and young and healthy adults.42,43
A study consisting of 512 hypertensive patients supported the findings of the present study and showed that AIx correlated inversely with RWT after the age of 65 years, despite the fact that there was a positive correlation for those under 65 years. 44 Such findings were explained by the observation that AIx tends to stabilize or decline after the age of 65 years. 44 Furthermore, an update on 5799 participants from the Framingham Heart Study population (30% were hypertensive) showed that Ao-PWV had a positive association with LVM, while AIx had an inverse association, both of which disappeared when the models were adjusted for mean arterial pressure. 45
The current findings suggest that there might be an age-related stage where degenerative/pathological processes reverse the expected/physiological relationship between LVMI and c-AIx (Figure 3). In the present study, Ao-PWV was highest in patients with concentric hypertrophy, followed by eccentric hypertrophy, concentric remodelling and lowest in normal geometry. This matches the order of prognostic significance that LV geometry had in the Framingham Heart Study population for total cardiovascular events and all-cause mortality over a follow-up period of 8 years. 4 To the best of our knowledge, this is the first study documenting this association in patients with CHF. In the literature, another study demonstrated a similar relationship for carotid-PWV to show a similar pattern with LV geometry in a population with documented or suspected coronary artery disease. 46 While another study showed a similar pattern of worsening Ao-PWV with worsening carotid geometric phenotype in a population-based study, 48% of whom were hypertensive. 47
The main limitations of this current study were the small size of the patient population and the relative lack of statistical power when the subgroups were compared. Comparative interpretation is also compromised because the published literature focuses mainly on patients with systemic hypertension and not cardiac failure. A small study on patients with HFrEF showed AS values similar to this cohort, however their population was a decade older as compared with the present study. 48 Also, there was a paucity of information specifically derived from studies in the Saudi population with regard to BP, AS, LV structural and functional changes with age, and other risk factors, as well as any superimposed pathological process such as CHF.
In conclusion, this current study was conducted among patients with CHF with different LV geometric patterns. The LVMI was predicted by c-AIx and EF. The lack of a significant association between LVMI and BP was likely due to specific characteristics of this small patient population in terms of LVM and EF. However, these results suggest the need for proper epidemiological studies in the Saudi population. Despite the study limitations, the identification of a correlation between Ao-PWV and LV geometry is entirely consistent with the known adverse prognostic significance in relation to future total cardiovascular events and all-cause mortality established in the literature.
Supplemental Material
IMR903623 Supplemental Material - Supplemental material for Inter-relationships between left ventricular mass, geometry and arterial stiffness
Supplemental material, IMR903623 Supplemental Material for Inter-relationships between left ventricular mass, geometry and arterial stiffness by Manal M. Alem and Abdullah M. Alshehri in Journal of International Medical Research
Footnotes
Acknowledgements
The authors are very thankful to all the associated personnel in any reference that contributed in/for the purpose of this research.
Declaration of conflicting interest
The authors declare that there are no conflicts of interest.
Funding
The original prospective, randomized, double-blind, placebo-controlled study from which the data analysed in this current study were derived was funded by the Deanship of Scientific Research at Imam Abdulrahman Bin Faisal University, Dammam, Saudi Arabia (grant no. 20100065).
Supplemental material
Supplemental material for this article is available online.
References
Supplementary Material
Please find the following supplemental material available below.
For Open Access articles published under a Creative Commons License, all supplemental material carries the same license as the article it is associated with.
For non-Open Access articles published, all supplemental material carries a non-exclusive license, and permission requests for re-use of supplemental material or any part of supplemental material shall be sent directly to the copyright owner as specified in the copyright notice associated with the article.