
Abstract
The object of this study was to utilize a novel feed-forward active contour (FFAC) algorithm to find a reproducible technique for analysis of brachial artery reactivity. Flow-mediated dilation (FMD) is an important marker of vascular endothelial function but has not been adopted for widespread clinical use given its technical limitations, including inter-observer variability and differences in technique across clinical sites. We developed a novel FFAC algorithm with the goal of validating a more reliable standard. Forty-six healthy volunteers underwent FMD measurement according to the standard technique. Ultrasound videos lasting 5–10 seconds each were obtained pre-cuff inflation and at minutes 1 through 5 post-cuff deflation in longitudinal and transverse views. Automated segmentation using the FFAC algorithm with initial boundary definition from three different observers was used to analyze the images to measure diameter/cross-sectional area over the cardiac cycle. The %FMD was calculated for average, minimum, and maximum diameters/areas. Using the FFAC algorithm, the population-specific coefficient of variation (CV) at end-diastole was 3.24% for transverse compared to 9.96% for longitudinal measurements; the subject-specific CV was 15.03% compared to 57.41%, respectively. For longitudinal measurements made via the conventional method, the population-specific CV was 4.77% and subject-specific CV was 117.79%. The intraclass correlation coefficient (ICC) for transverse measurements was 0.97 (95% CI: 0.95–0.98) compared to 0.90 (95% CI: 0.84–0.94) for longitudinal measurements with FFAC and 0.72 (95% CI: 0.51–0.84) for conventional measurements. In conclusion, transverse views using the novel FFAC method provide less inter-observer variability than traditional longitudinal views. Improved reproducibility may allow adoption of FMD testing in a clinical setting. The FFAC algorithm is a robust technique that should be evaluated further for its ability to replace the more limited conventional technique for measurement of FMD.
Keywords
Introduction
Flow-mediated dilation (FMD) has emerged over the past 20 years as an important marker of vascular endothelial function that can be measured non-invasively. Celermajer et al. described its clinical utility in a study of children and adults who were at risk for developing atherosclerosis. 1 Endothelial dysfunction, as assessed by impaired brachial artery FMD, has been observed in almost every condition that predisposes to atherosclerosis and cardiovascular disease. 2 In addition, a recent meta-analysis indicates that impairment of brachial artery FMD is significantly associated with future cardiovascular events. 3 Unfortunately, evaluation of brachial artery FMD has not been adopted for more widespread clinical use primarily due to technical limitations that lead to poor inter-observer reproducibility of results. Multiple review papers have all noted that practical challenges, including significant test-to-test variability, have precluded widespread clinical use of this method.4 –6 Other than publication of guidelines to try to standardize brachial artery FMD measurement methodology, there has not been significant progress in improving the techniques for measuring brachial artery reactivity to minimize inter-observer variability.
As ultrasound resolution and computer-aided measurement technology has advanced, evaluation of brachial artery FMD has the potential to translate from the laboratory to the clinic as a measure of endothelial function that may identify the earliest stages of atherosclerosis and help identify patients who may carry additional cardiovascular risk beyond that signified by traditional cardiovascular risk profiles. In addition, measurement of FMD may serve as a guide to determine if drug therapy is efficacious in improving vascular health. Multiple studies, including the Cardiovascular Health Study and the Multi-Ethnic Study of Atherosclerosis, have shown that evaluation of FMD provides additional information in combination with traditional risk stratification (e.g. Framingham Risk Score).7,8
A few studies have focused on refining the technique and analysis of brachial artery FMD in order to improve reproducibility and standardization across research/clinical sites.6,9 As discussed by Corretti et al., 6 the standard image orientation for measuring brachial artery FMD by ultrasound has always been a longitudinal view of the artery, primarily because the arterial boundaries were more easily detectable by early ultrasound technology in this view. Progress in both ultrasound technology and the computational power required for image analysis has led our group to question the methods by which FMD has been measured since its origin.
Cary et al. demonstrated that feed-forward active contours (also called ‘snakes’) could be used to track and measure brachial artery vasomotion on ultrasound images at least as well as manual tracing, and that images obtained in a transverse view were less variable than those obtained in a longitudinal view. 10 Active contours are parametric curves that can find or track the edges of images. They were first introduced by Kass et al. and refined by other investigators. 11 A ‘snake’ is initialized in an image frame and then iteratively deformed throughout subsequent images using the final contour from the previous frame as the next frame’s initialization.
This present study used the feed-forward active contour (FFAC) analysis algorithm to measure the brachial artery FMD of 46 human volunteers in both longitudinal and transverse views with the hypothesis that transverse views would provide less inter-observer variability and would be better suited to larger-scale clinical trials and integration into clinical medicine.
Methods
Brachial artery imaging
The ultrasound studies were performed during morning hours after fasting for 8 hours. Blood pressure was assessed in the contralateral arm prior to initiating imaging protocol. Using a Philips HDI 5000 scanner (Philips Ultrasound, Bothell, WA, USA) and a 15-7-MHz hockey stick transducer, an experienced sonographer performed ultrasound imaging of subjects’ brachial arteries while they were in a recumbent position using anatomic landmarks to ensure imaging of the same segment of the vessel. Anatomic landmarks were used to mimic a ‘real world’ scenario in which subjects might return for repeated follow-up images by different sonographers. Standard presets recommended by the manufacturer for vascular imaging were used. For each subject, the artery was imaged in both long-axis (longitudinal) and short-axis (transverse) planes subsequently after a 30-minute rest period. It was not technically feasible to obtain both longitudinal and transverse images simultaneously as this would introduce too much transducer movement. The sonographer attempted to maintain the constant pressure necessary for proper coupling of transducer to skin. Ultrasound images were stored as cineloops and analyzed offline. For assessment of brachial artery reactivity, a standard brachial sphygmomanometer was placed on the upper forearm and then inflated to 50 mmHg above systolic blood pressure for 5 minutes. Serial video clips of 5–10 seconds each were captured every minute post-cuff deflation at minutes 1 through 5 and analyzed offline in comparison to pre-inflation images. This is in contrast to traditional FMD measurements, which typically do not capture several cardiac cycles and measurements as far out as 5 minutes post-cuff deflation.
Image analysis
All scans, regardless of technical quality, were included in the study. The inclusion of all ultrasound scans was stipulated to assess for accuracy in a ‘real life’ clinical situation where some patients may move during the study and some images may not be optimal due to technical limitations. Automated segmentation by the FFAC algorithm (i.e. snake) was then initiated by three different observers to segment brachial arteries. Two additional observers performed conventional manual segmentation, consisting of the user defining the arterial lumen in end-diastolic images (as determined by corresponding electrocardiogram (ECG) tracings) using the Brachial Analyzer software by Medical Imaging Applications (Coralville, IA, USA). Automated segmentation involved definition of the arterial lumen on only the first frame of each cineloop. The active contour algorithm then segments and measures the artery on all images to generate lumen diameter and area waveforms. Automated segmentation took approximately 15 minutes for each set of longitudinal and transverse cineloops. Artery diameter and cross-sectional area were plotted as waveforms over the cardiac cycles for both longitudinal and transverse images analyzed by FFAC. Figure 1 demonstrates the brachial artery measurement waveforms for diameter and area obtained by automated segmentation. These waveforms closely approximate the expected pulsatility of the artery throughout the cardiac cycle. The measurements from all three observers in both longitudinal and transverse views were then compared. The %FMD was calculated using area (cross-sectional images) and diameter (longitudinal images) measurements at end-diastole, peak-systole and waveform mean.
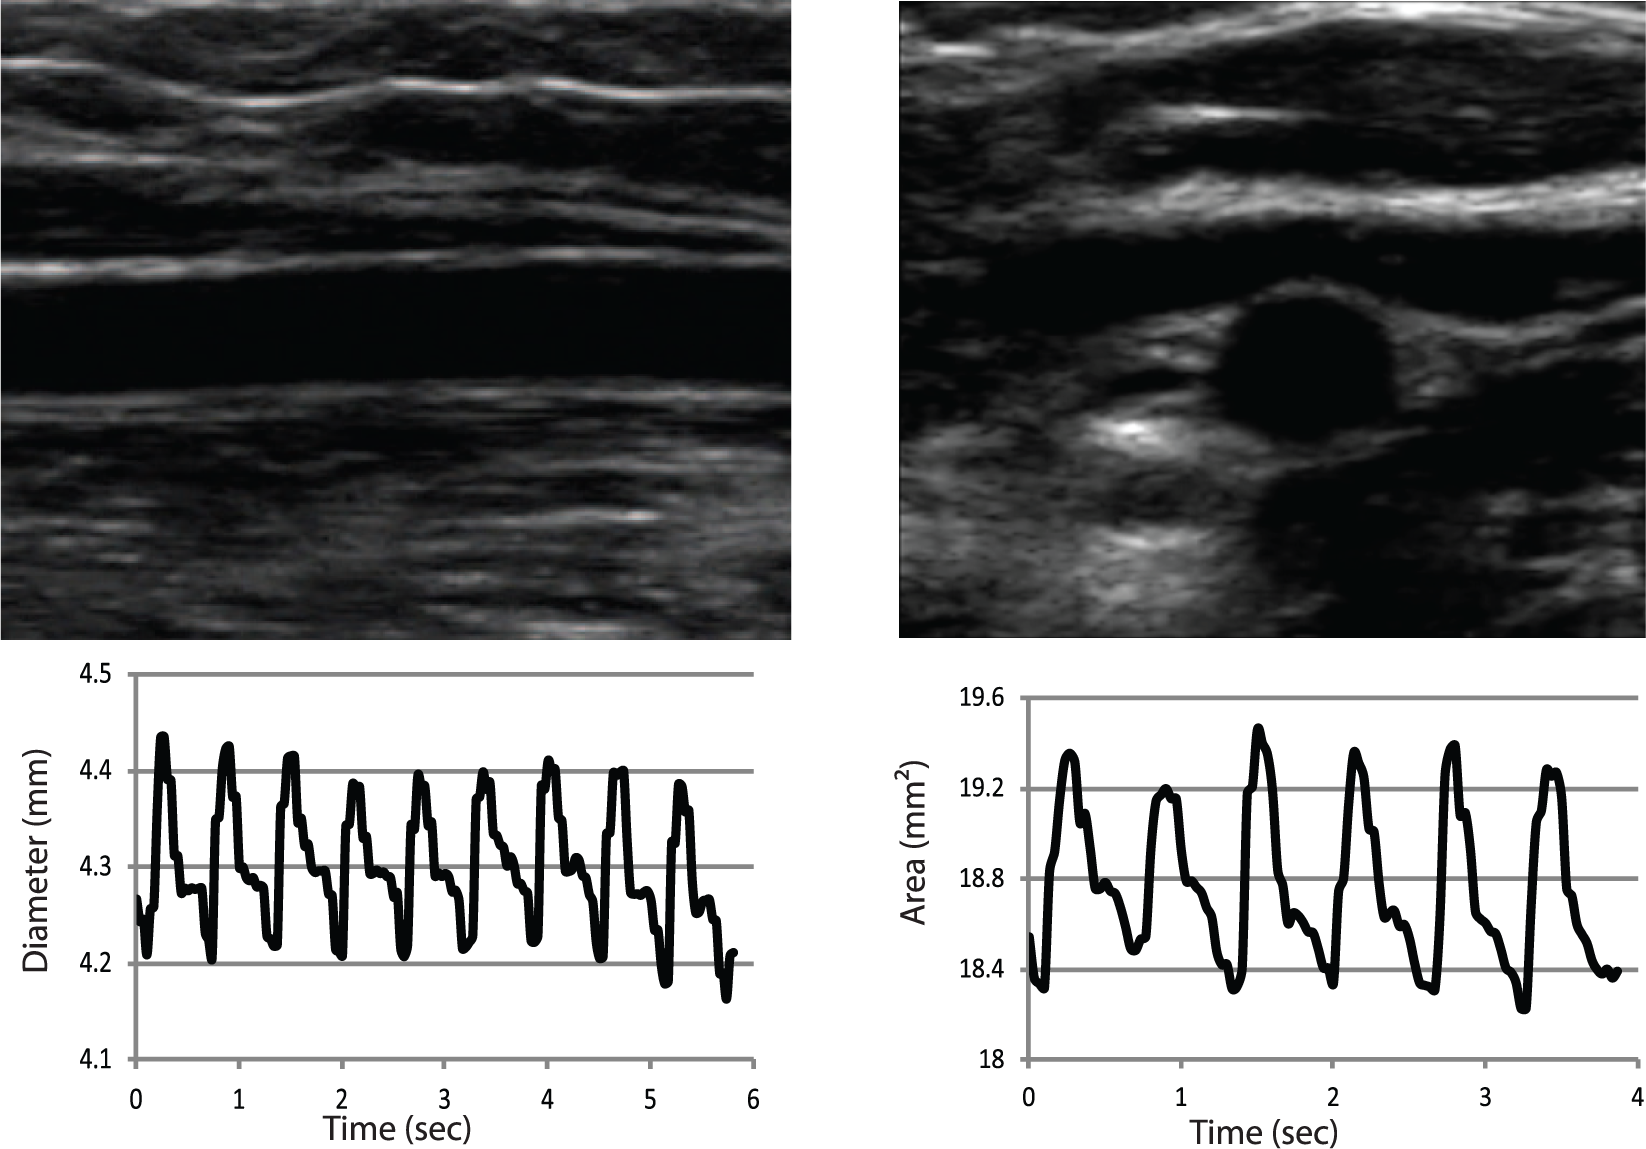
Sample longitudinal (left) and transverse (right) ultrasound images and profiles. The waveforms beneath each ultrasound image show the calculated diameter and area, respectively, from measurements obtained by the feed-forward active contour (FFAC) algorithm.
Statistical methods
Using the three calculated FMD values, coefficients of variation (CVs) were calculated for each subject’s measurements by the three observers (subject-specific observer variation) and for each observer’s population measurements (population-specific CV observer variation). The CV is the quotient of the standard deviation divided by the mean. The subject-specific coefficient of variation represents the variance of calculated FMD for an individual subject when measurements were made by all three observers. The population-specific coefficient of variation represents the variance of calculated FMD when averaged together as a cohort. Mean CVs were calculated both between subjects and within subjects for measurements made at end-diastole, peak-systole, and waveform mean. Intraclass correlation was then calculated to assess the consistency of measurements made by each observer. The same statistical analysis was performed for the conventional FMD measurements. A subsequent analysis was performed in which eight cases were excluded due to poor-quality images.
Results
The study population of 46 participants included 44% men and 56% women with ages ranging from 18 to 65 years; all subjects reported feeling healthy at the time of the study. None of the subjects had a systolic blood pressure above 150 mmHg. The 46 participants provided informed consent prior to their participation in this study and they were not involved in other research protocols. This study was approved by the University of Pennsylvania Institutional Review Board. All scans, regardless of technical quality, were included in the study. The inclusion of all ultrasound scans was stipulated to assess for accuracy in a ‘real life’ clinical situation where some patients may move their arm during the study and some images may not be optimal due to technical limitations.
Figure 1 demonstrates sample images in both the longitudinal and transverse planes as analyzed by the FFAC algorithm. The diameter and area measurements derived from the longitudinal and transverse images are shown plotted in the panels below each image. Each waveform shows the change in luminal dimension over the cardiac cycle. The plots of the vessel size closely approximate the arterial pulse waveform. Each waveform is characterized by a maximum and minimum corresponding to peak-systole and end-diastole. The %FMD was calculated using these measurements at peak-systole, end-diastole, and the mean of the waveform. The longitudinal images typically demonstrate a well-defined luminal margin along the length of the vessel. The transverse images, on the other hand, had well-defined luminal margins at the superficial and deep aspects of the vessel but the lateral margins were not always clearly delineated. The blood vessels often appeared slightly elongated in the horizontal direction due to inadvertent pressure from the transducer during image acquisition. Diameter and area waveforms were derived from the cineloops using the FFAC algorithm. The results demonstrate that the FFAC algorithm was able to track changes in the luminal dimension during the entire cardiac cycle.
Figure 2 summarizes the %FMD measurements derived from different phases of the cardiac cycle using longitudinal and transverse images. Each column in the graph represents the mean ± SD of the measurements obtained by three observers for the whole group. The %FMD for end-diastole, peak-systole and waveform mean for the longitudinal images were 14.87 ± 1.63, 14.20 ± 1.53, and 14.47 ± 1.61, respectively. There was no difference between the three groups (p = 0.88). The %FMD for end-diastole, peak-systole and waveform mean for the transverse images were 32.99 ± 1.17, 31.61 ± 1.08, and 32.17 ± 1.18, respectively. There was no difference between the three groups (p = 0.39). It is expected that %FMDarea should be twice that of %FMDdiameter based on the theory that changes in area integrate the changes in radius over a 360º angle (i.e. over the entire cross-section). The % dilation for transverse images was 2.22, 2.23, and 2.22 (± 0.004) times that of the longitudinal images for end-diastole, peak-systole and waveform mean measurements.
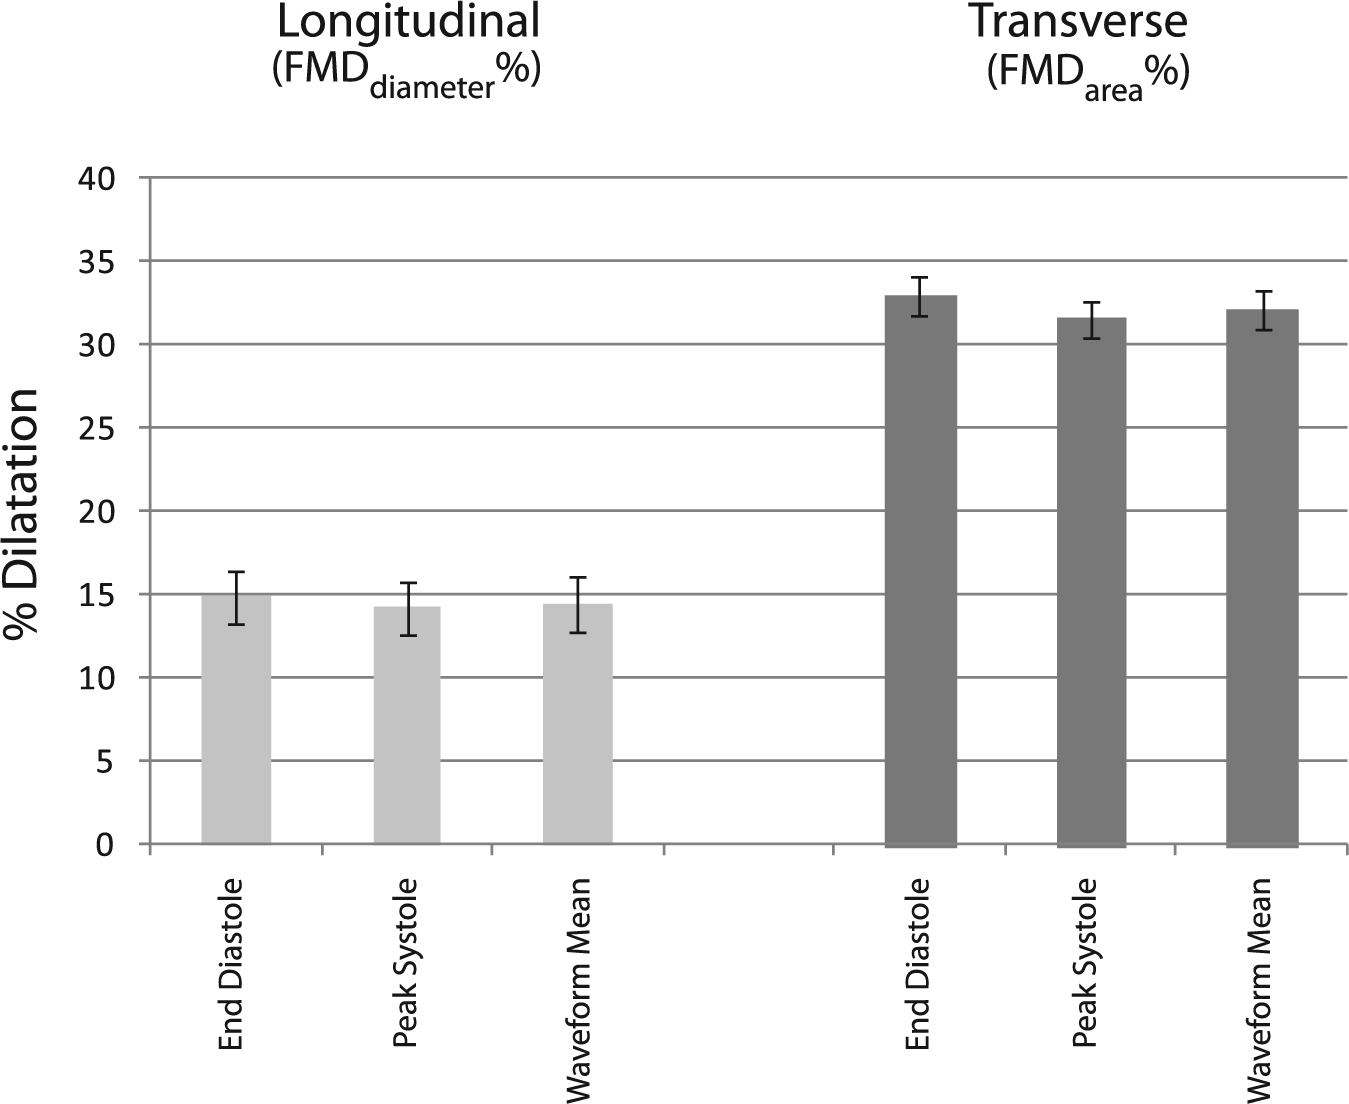
Mean percent flow-mediated dilation (FMD) throughout the cardiac cycle. The %FMD using diameter and area for longitudinal and transverse images, respectively, when measurements were made at end-diastole, peak-systole, and waveform mean. No significant difference in mean %FMD among observers was found when using measurements at these different points throughout the cardiac cycle.
Figure 3 shows the histogram for the time-to-peak dilation as measured by the three observers. The results show that time-to-peak was distributed. While some patients had maximum dilation at 1 minute others showed peak dilation at 2, 3, 4 and 5 minutes. Measurements made on transverse images yielded a more uniformly distributed time of maximal dilation than those made on longitudinal images, with better agreement amongst the observers (Figure 3).
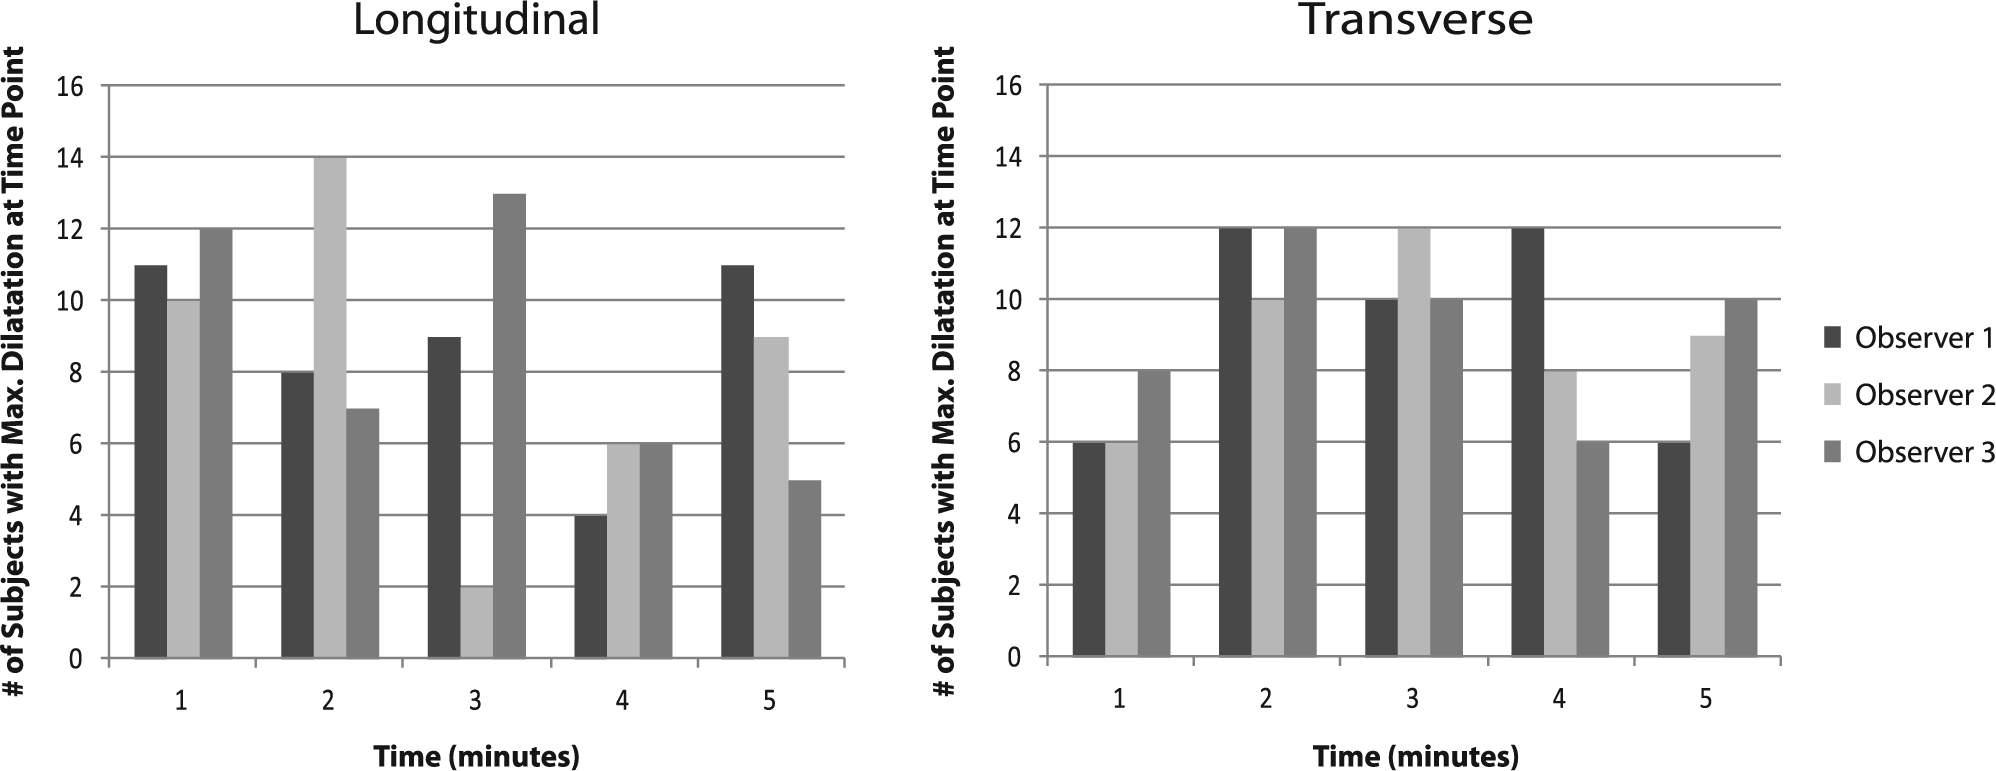
Histogram of time to peak dilation. The % flow-mediated dilation was calculated from the maximal area and diameter at peak dilation. Peak dilation was observed at different time points for each subject. This histogram shows the number of subjects for whom peak dilation occurred, at each given time point, at end-diastole.
Table 1 summarizes the average CV of FMD for longitudinal and transverse images using the FFAC method as well as the CV between observers using the conventional measurement technique. Subject-specific CVs were calculated for each subject between each observer as a measure of the variability in the analysis of images for each subject. Population-specific CVs were calculated for each observer for the group of all subjects. The average population-specific end-diastolic CV was 9.96% and the average subject-specific end-diastolic CV was 57.41% for longitudinal measurements using the FFAC algorithm. The average population-specific end-diastolic CV was 3.24% and the average subject-specific end-diastolic CV was 15.03% for transverse measurements using the FFAC algorithm. The average population-specific end-diastolic CV was 4.77% and the average subject-specific end-diastolic CV was 117.79% for conventional measurements made without the use of the FFAC algorithm. The statistical difference between transverse and longitudinal measurements was significant (p = 7.91 × 10⁻⁷), showing that transverse measurement has a lower coefficient of variation using the FFAC method. A separate analysis of the measurements excluding the poor-quality ultrasound images was also performed (Table 2). No significant change in CV was found when excluding the poor-quality images for analysis performed by the FFAC algorithm.
Population-specific and subject-specific coefficients of variation.
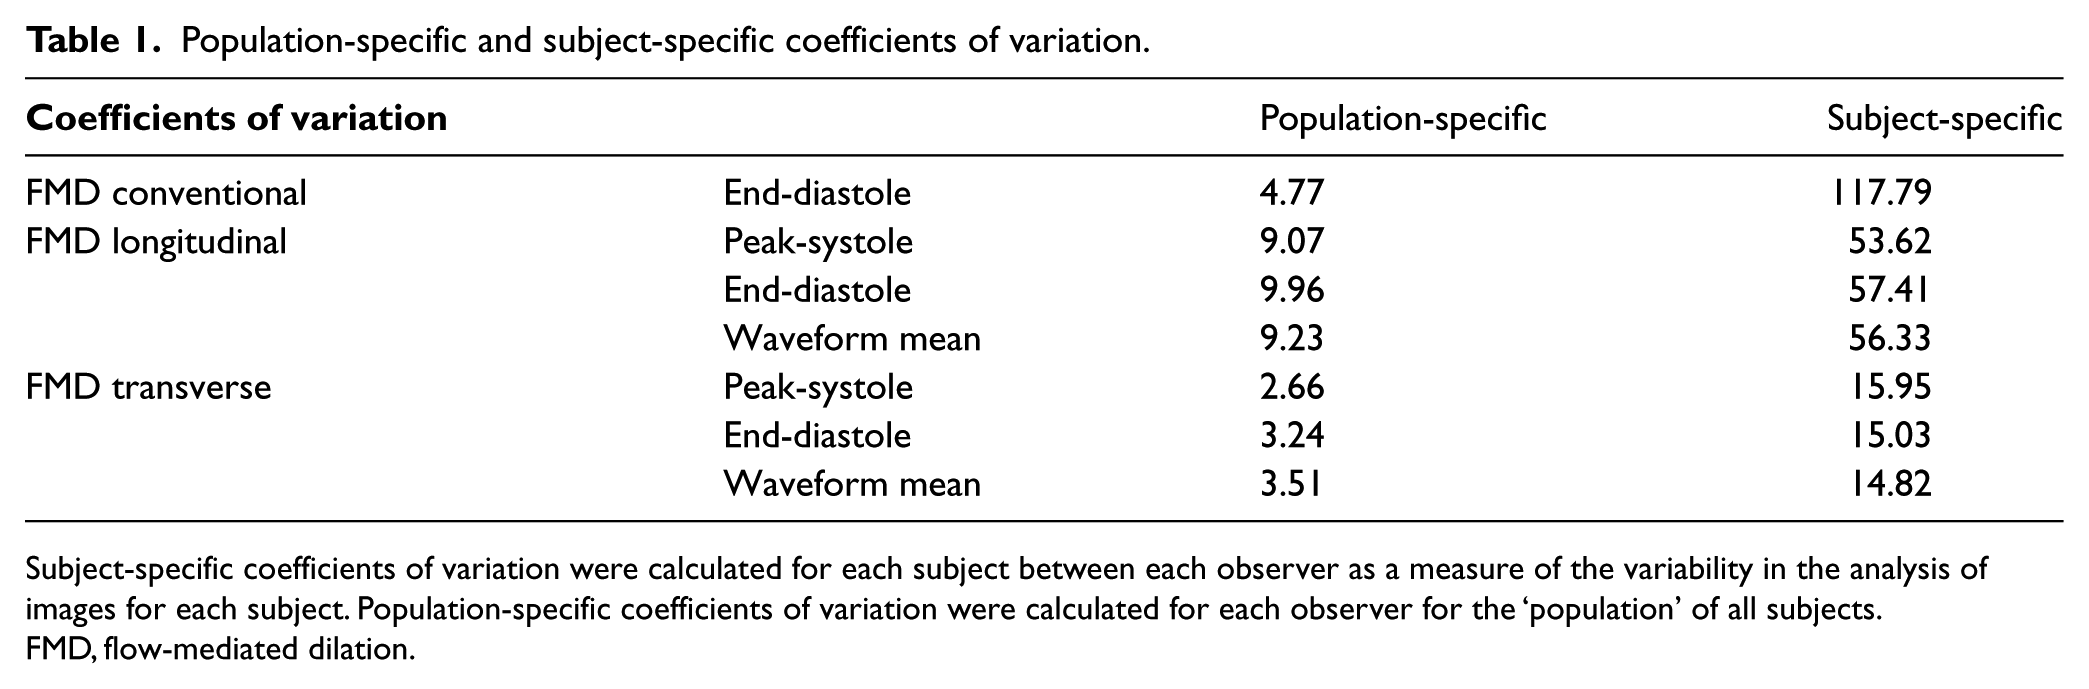
Subject-specific coefficients of variation were calculated for each subject between each observer as a measure of the variability in the analysis of images for each subject. Population-specific coefficients of variation were calculated for each observer for the ‘population’ of all subjects.
FMD, flow-mediated dilation.
Population-specific and subject-specific coefficients of variation excluding poor-quality images.
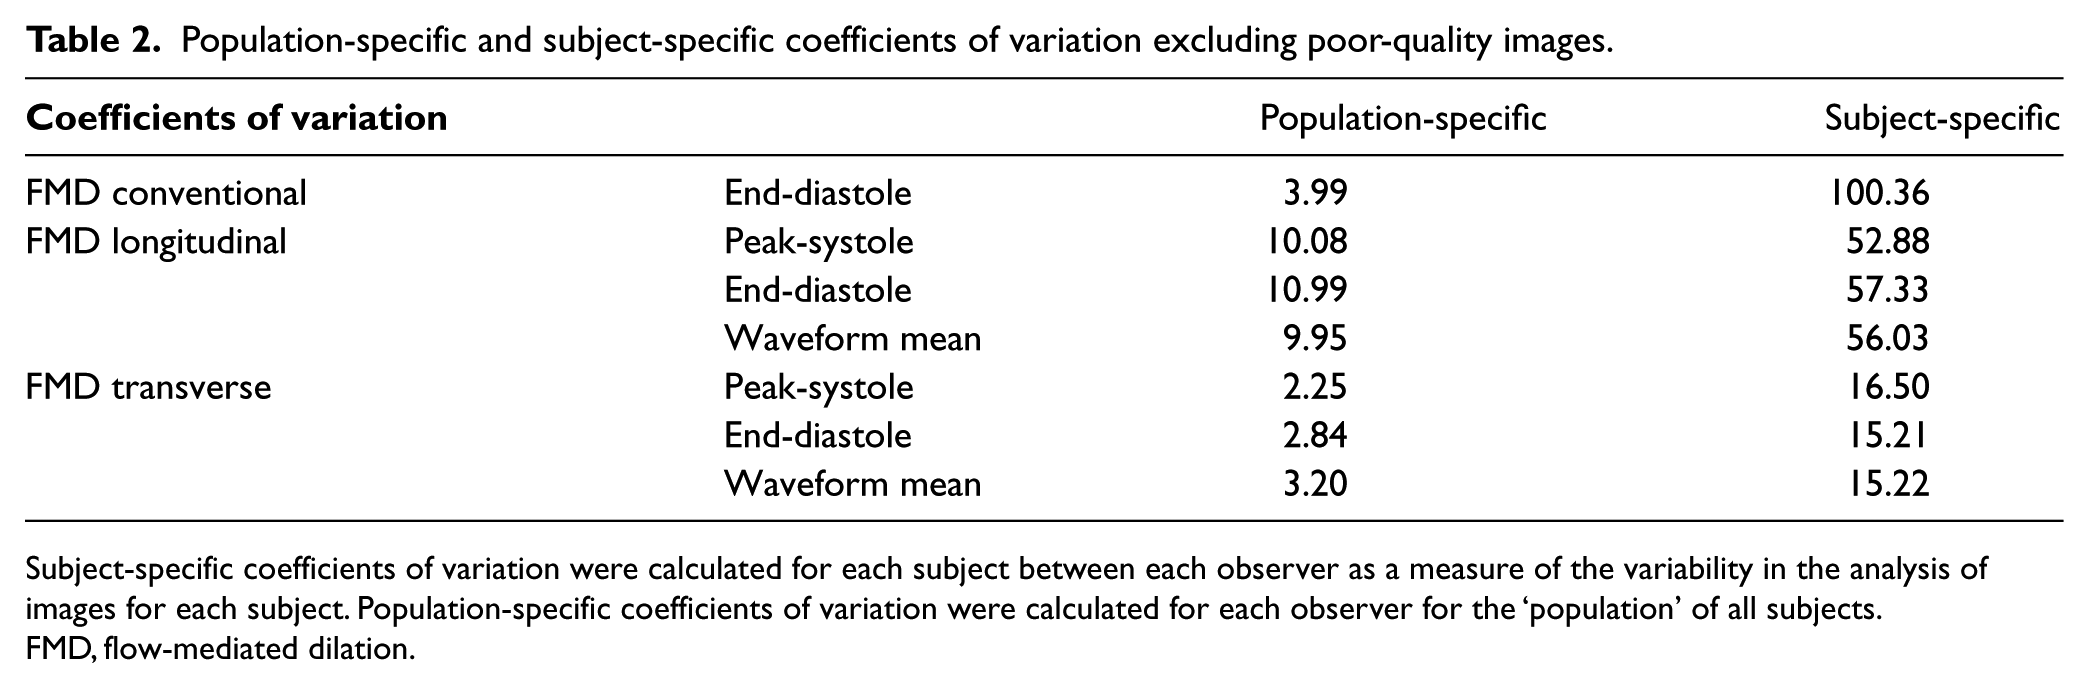
Subject-specific coefficients of variation were calculated for each subject between each observer as a measure of the variability in the analysis of images for each subject. Population-specific coefficients of variation were calculated for each observer for the ‘population’ of all subjects.
FMD, flow-mediated dilation.
Table 3 shows the intraclass correlation coefficients (ICC). The ICC provides an index for the reliability of different raters averaged together. A higher ICC is consistent with a more accurate test. End-diastolic ICCs were 0.90 and 0.97 for longitudinal and transverse measurements, respectively, using the FFAC algorithm. The ICC for measurements made conventionally was 0.72. In addition to a higher ICC, the 95% confidence interval for the ICC was narrower for transverse measurements. There was no significant change in ICC when the poor-quality images were removed from the analysis (Table 4).
Intraclass correlation coefficients.
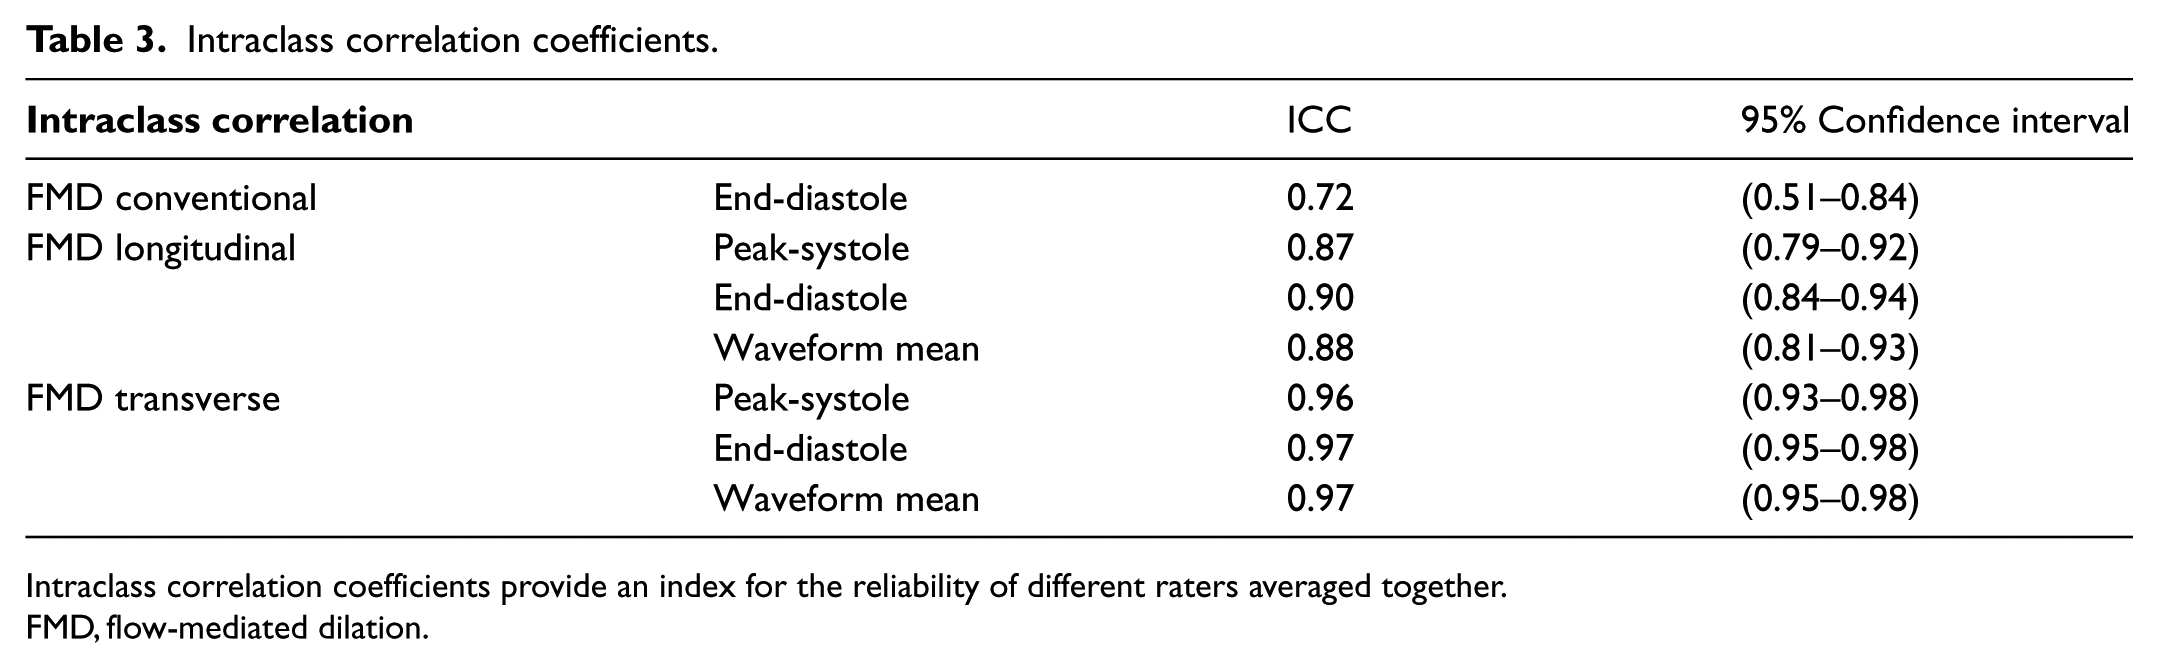
Intraclass correlation coefficients provide an index for the reliability of different raters averaged together.
FMD, flow-mediated dilation.
Intraclass correlation coefficients excluding poor-quality images.
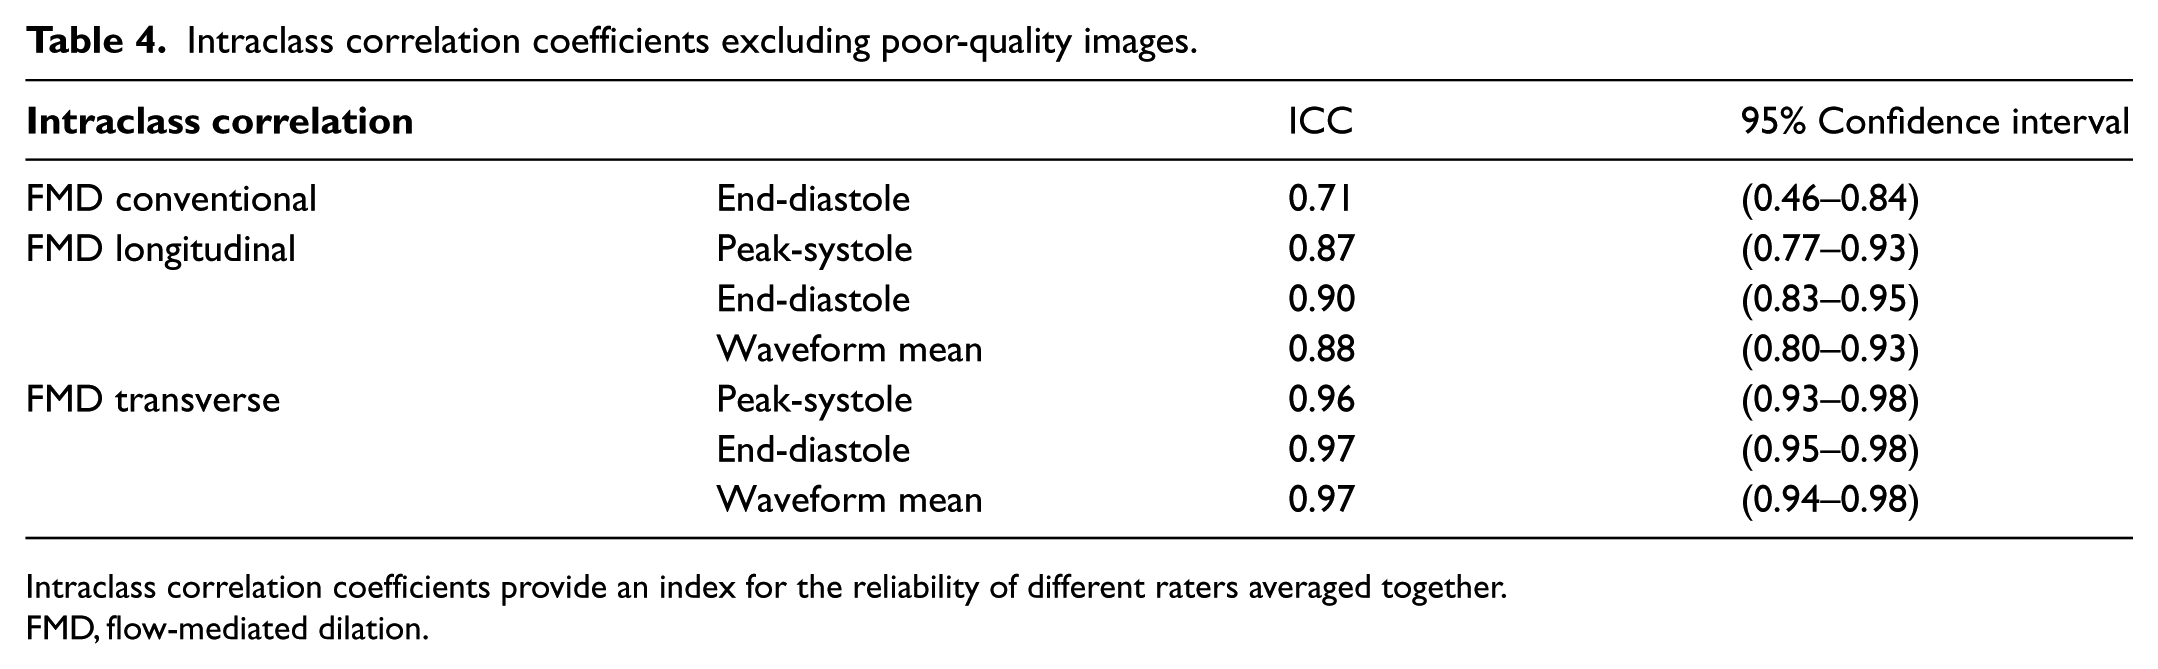
Intraclass correlation coefficients provide an index for the reliability of different raters averaged together.
FMD, flow-mediated dilation.
Discussion
Feed-forward active contour analysis vs conventional method
The results show that the FFAC algorithm is feasible for measuring the %FMD of brachial arteries in both the transverse and longitudinal planes. Imaging in the transverse plane reduces the variability between observers as measured by smaller values of both the subject-specific and the population-specific CVs. Subject-specific CV was reduced when the FFAC algorithm was applied to both transverse and longitudinal images compared to longitudinal images that were analyzed via conventional methods. The ICC was also lower for conventional measurement than for FFAC. The population-specific CV for conventional measurement was better when compared to longitudinal measurements made via the FFAC algorithm, but it did not perform as well as FFAC when compared to transverse measurements. These results indicate that the FFAC algorithm is more reliable than conventional measurements for determining %FMD.
As our group showed previously, the FFAC algorithm approach has a clear advantage in efficiency over the conventional method of measuring brachial artery reactivity. Compared to manual tracing, the FFAC algorithm and its automated contour tracking require, on average, 94 fewer minutes of manual intervention per case. 10 Given that one of the aims of this study was to try to develop an approach for evaluating %FMD that could be used in larger research and clinical populations, the time it takes to analyze each case will contribute significantly to its applicability.
Population vs subject-specific discrimination
Population-specific CV is used to determine how well the FFAC algorithm can be used by multiple observers to distinguish between two different populations or groups of individuals. Subject-specific CV is used to determine how well the FFAC algorithm can be used by multiple observers to make measurements on one individual. Both FFAC analysis and conventional measurements have a lower population-specific CV than the subject-specific CV, indicating that FMD analysis may be more useful at distinguishing populations, revealing important differences in endothelial function in healthy versus at-risk populations, or in treatment versus control groups. For example, these population-specific CVs indicate that the transverse imaging via FFAC analysis would be more reliable at detecting differences in a group of smokers (or any other study population) versus controls.
Conventionally, measurements for FMD are routinely obtained at end-diastole. In addition to making end-diastolic measurements, we also made measurements at peak-systole and for waveform means. The results of the study demonstrate how the FFAC algorithm is able to track endothelial boundaries throughout the cardiac cycle (Figure 1). In both longitudinal and transverse views, measurements for FMD were in agreement across all three time points (Figure 2). When poor-quality images were removed, there was no significant difference in CVs for measurements made using the FFAC algorithm but there was improvement for measurements made manually by the conventional method. This further highlights the robust ability of the FFAC algorithm for accurate boundary detection throughout the cardiac cycle.
Transverse vs longitudinal imaging
Ultrasonography continues to be a promising modality for non-invasive measurement of endothelial function, but there are limitations to the current protocol of gathering images in the longitudinal plane. In healthy subjects, one expects maximal change in brachial artery diameter to be 10–20%. For an artery that measures 5 mm in diameter, this would correspond to a change of 0.5–1.0 mm, which is equivalent to around 10 pixels on normal image magnification. In subjects with compromised endothelial function, maximal change in diameter is likely to be less than 10–20%, thus requiring an even higher sensitivity to detect the small changes in pixels. In transverse images, the dilation occurs in all directions across a 360º axis and would encompass many more pixels requiring less sensitivity to detect changes accurately. In a previous validation study, the number of pixel changes observed for area was amplified 150 times for cross-sectional imaging compared to longitudinal imaging. 12 Another study evaluating transverse plane imaging compared to longitudinal plane imaging also found less variability when using the transverse plane. 13
The results from this study validate the FFAC algorithm for measuring FMD in transverse view. The algorithm is versatile enough for tracking vessels consistently in different views and has the ability to be applied to heterogeneously obtained images that are encountered in the diverse conditions of clinical studies, even if the images are not of the highest quality. When the FFAC algorithm is applied to images of vessels segmented transversely, our data show that there is a statistically significant improvement in variability.
Figure 1 demonstrates that the FFAC algorithm can make uniform measurements throughout the cardiac cycle and accurately describe the small changes in the artery in both longitudinal and transverse views. While the lateral margins of the artery are not as clearly visualized in these images, the FFAC algorithm can still track changes in the vessel. When arteries are segmented in the longitudinal plane, the sonographer applies pressure that compresses the artery into an elliptical shape. In fact, when comparing measurements of the same brachial artery in both planes, the equivalent-circle area calculated from the longitudinal diameter measurements was 27% lower than the cross-sectional area measured from transverse images. 10 The %FMDarea should be twice that of %FMDdiameter, but across all observers %FMDdiameter underestimated the expected change in area by 10%. The observation that the %FMDarea/%FMDdiameter ratio is greater than the expected value of 2 indicates that the effect of compression by the transducer during longitudinal imaging could have played a role in the observed deviation. Since the longitudinal image only captures the short-axis of this ellipse, the deformation of the artery can lead to underestimation of the cross-sectional area. Moreover, measurements should be made through the center of the vessel; selection of off-center images can further decrease the calculated area. When different sonographers capture images, the degree to which compression and transducer positioning will affect the diameter measurement is unpredictable. Transverse segmentation is not subject to these factors, given that a circumference and vessel area is measured and an entire cross-section is obtained.
Our study also evaluated for peak dilation beyond the traditional 2-minute time period recommended by most protocols for FMD assessment.1,4,5 The measurements shown in Figure 3 demonstrate that the time of peak dilation following cuff deflation varies between subjects. The agreement between observers for peak dilation in transverse images again highlights the improved robustness of the transverse mode. This figure also raises questions about whether measurements should routinely be gathered beyond 2 minutes post-cuff deflation to capture patient-specific dilation of the artery, as has also been suggested in an earlier study.
Measurements made in transverse planes had improved reliability, as seen in both the subject-specific observer variation and the group-specific observer variation in Table 1. The FFAC algorithm performed quite well at distinguishing groups, but the variation is still too large for making subject-specific measurements. Our measured CVs for both longitudinal and transverse images are higher than those typically reported in the literature; this most likely represents the settings in which measurements for research are typically made. Many protocols call for mechanical support of the ultrasound probe to minimize movement – a set-up that may be a challenge to put into practice in a clinical vascular laboratory. Our protocol was meant to simulate a clinical environment in which a trained sonographer gathers the images by hand. In addition, our data were not filtered or pre-selected to remove poor-quality images prior to analysis. A subsequent analysis in which poor-quality images were removed did not show significant change in CV or ICC. At this time, the FFAC algorithm still requires initial user input to delineate the luminal margins of the first image. This is still a potential source of variation. Future development of the algorithm could allow this first step to become automated, which would significantly reduce observer variability.
Limitations
Our study had a few limitations that when viewed through the results create a need for future investigation into the uses of the FFAC algorithm. First, it was a fairly small study encompassing only 46 volunteers. In addition, these volunteers only underwent brachial artery reactivity testing once. A larger sample size and multiple time points would provide further information about both the population-specific and subject-specific CVs for the FFAC algorithm in transverse compared to longitudinal sectioning. Nonetheless, there was a clear advantage to using the FFAC algorithm despite the small sample size.
As mentioned previously, transverse images have not been used for ultrasound assessment of brachial artery reactivity because of concerns that the lateral margins of the vessel would not be visualized. Improvements in ultrasound image quality have allowed use of the FFAC algorithm to be possible. Cineloops must be captured at high frame rates, at least above 10 frames-per-second (fps), in order to allow the small deformations of the snake to accurately track the endothelial boundaries. Especially in transverse imaging, the vertical edges (i.e. lateral walls of the segmented artery) are not well delineated due to the oblique incidence of ultrasound at the edges of the blood vessels. Despite this inherent limitation of transverse plane imaging, the FFAC algorithm is able to track the overall contour of the artery and the changes in its dimensions throughout the cardiac cycle. Ultrasound technology is constantly improving in its resolution capability. Higher resolution images could potentially provide even better delineation of the lateral boundaries on transverse images, which would lead to even better margin detection of the FFAC algorithm. Given that the algorithm is quick and easy to use and ultrasound is without risk of radiation or contrast exposure, it is our hope that investigators will be able to adopt this technology and apply it to images gathered with any ultrasound machines.
Conclusions
A reliable FFAC algorithm that can rapidly generate FMD information is an important step toward the creation of larger databases that can be used to understand further the link between impairment in FMD and the development and progression of cardiovascular disease. Being able to monitor and evaluate endothelial function may help predict cardiovascular risk or response to therapy meant to reduce the risk of cardiovascular disease.2,3,7,8 Larger sets of data can help guide future clinical research in many areas of vascular biology and vascular medicine.
As described above, transverse imaging was hypothesized to have less variability than longitudinal measurements, and the results of our study confirm this. Further improvement in the reliability of brachial artery reactivity measurements by FFAC combined with transverse mode imaging, where a large number of images acquired over several seconds are analyzed by an automated method, could pave the way towards using the technique in clinical vascular laboratories.
Footnotes
Declaration of conflicting interests
The authors declared no potential conflicts of interest with respect to the research, authorship, and/or publication of this article.
Funding
The authors disclosed receipt of the following financial support for the research, authorship, and/or publication of this article: the National Institutes of Health under award number R21EB005326. There was no funding from commercial/private interests related to the proprietary algorithm.