
Abstract
The objective was to demonstrate the ability of ultrasound (US) with 3D properties to evaluate volumetry and biomechanical parameters of the aorta in patients with and without abdominal aortic aneurysm (AAA). Thirty-one patients with normal aortas (group 1), 46 patients with AAA measuring 3.0–5.5 cm (group 2) and 31 patients with AAA ⩾ 5.5 cm (group 3) underwent a 2D/3D-US examination of the infra-renal aorta, and the images were post-processed prior to being analyzed. In the maximum diameter, the global circumferential strain and the global maximum rotation assessed by 2D speckle-tracking algorithms were compared among the three groups. The volumetry data obtained using 3D-US from 40 AAA patients were compared with the volumetry data obtained by a contemporary computed tomography (CT) scan. The median global circumferential strain was 2.0% (interquartile range (IR): 1.0–3.0), 1.0% (IR: 1.0–2.0) and 1.0% (IR: 1.0–1.75) in groups 1, 2 and 3, respectively (p < 0.001). The median global maximum rotation decreased progressively from group 1 to group 3 (1.38º (IR: 0.77–2.13), 0.80º (IR: 0.57–1.0) and 0.50º (IR: 0.31–0.75), p < 0.001). AAA volume estimations by 3D-US correlated well with CT (R2 = 0.76). In conclusion, US with 3D properties is non-invasive and has the potential to evaluate volumetry and biomechanical characteristics of AAA.
Introduction
The risk of death from abdominal aortic aneurysm (AAA) rupture is 60–80% 1 and can reach 90% if the patients who die before reaching the hospital are included. 2 The maximum diameter (MD) is the most common measurement used to determine whether surgical intervention is indicated. Based on the annual rupture risk, endovascular or open surgical aneurysm repair is indicated for patients with an AAA ⩾ 5.5 cm in diameter. 3 However, AAA with the same MD do not necessarily have the same propensity for rupture and additional parameters need to be incorporated in clinical practice to evaluate individual risk. In addition, a considerable proportion of patients who undergo rupture repair have aneurysms < 5.5 cm. 4 Thus, although patients with an AAA ⩾ 5.5 cm have a higher risk of rupture, many of them will not experience a rupture during follow-up.3,5
The ability to reliably assess the rupture risk of an AAA can widely aid in deciding on the best time to repair it surgically. Biomechanical wall properties 6 in addition to volumetry 7 are tools used to estimate the rupture risk. The in vivo AAA wall properties, as well as the AAA volume, can be estimated using computed tomography (CT), followed by a geometric reconstruction and analysis, 8 a technique that involves exposure to radiation and is not cost-effective for the follow-up of a small AAA. On the other hand, ultrasound (US)-based aneurysm surveillance is a non-invasive, radiation-free, cheap and reproducible method. 9 However, there have been few US studies of the biomechanical wall properties of AAA reported in the literature,10,11 as well as few studies showing the use of three-dimensional ultrasound (3D-US) imaging to evaluate aneurysm volume quantification.12,13
The aim of this study was to assess the ability of the US coupled with two-dimensional (2D) speckle-tracking algorithms to evaluate biomechanical properties of the aorta in patients with and without AAA. The secondary objective was to measure the AAA partial volume by the 3D-US, and compare it with the volume estimated by CT.
Methods
This was a prospective study approved by the Ethics Committee of our institution (protocol number 23143114.2.000.0068) and all participants signed an informed consent. The patients were matched by age and gender and allocated in three groups for comparison: patients with a normal aorta as a control group (group 1); patients with AAA diameters ranging from 3.0 to 5.5 cm (group 2); and patients with AAA diameters ⩾ 5.5 cm (group 3). The patients with AAA were recruited during either the clinical follow-up or pre-operative work-up and the control group patients were healthy volunteers. Patients without AAA but with atherosclerotic aorta and patients with previous aorta-iliac intervention were not included in this study, nor were patients with arrhythmia because of the possible interference of these conditions with the biomechanical parameters. During a 4-month period, all patients underwent an US examination (Philips iU22 X-Matrix Ultrasound System; Philips Medical Systems, Bothell, WA, USA). The patients underwent a 6-hour fast before the examination.
The available CT scans of patients in the aneurysm groups (2 and 3) were used for comparison with the 3D-US volume assessment. Only the CT scans performed within 6 months from the US examination were included in the study. The CT aneurysm volume was calculated using a quantification software program (Vessel Analysis Version 6.5.5; Toshiba Medical Systems Corp., Vítrea Enterprise Suite, Minnetonka, MN, USA).
Clinical variables
Age, gender, body mass index and comorbidities were collected. At the time of the US examination, we measured the horizontal abdominal circumference at the umbilical level, blood pressure and heart rate (after a 10-minute rest) with the patient in the supine position. We also included the cardiac ejection fraction (EF) of patients who had recently undergone an echocardiographic study (a maximum of 6 months before the US examination). Patients who did not have these data were subjected to an EF measurement at the time of the AAA examination.
Part 1 of the US examination
The X6-1 matrix transducer was used, which is able to obtain a widened scan field compared to the previous V6-2 mechanical transducer and also makes the acquisition faster due to the electronic sweep technology. Cross-sectional B-mode images were captured along the length of the infra-renal aorta and the MD was measured antero-posteriorly and sideways at the axial plane. The maximum aneurysm cross-section in both the transverse and the longitudinal scan planes was also located to perform the entire 3D acquisition from this position. The 3D acquisition was taken during a breath hold, without moving the transducer (Figure 1). The electronic sweep was completed within approximately 2 seconds.
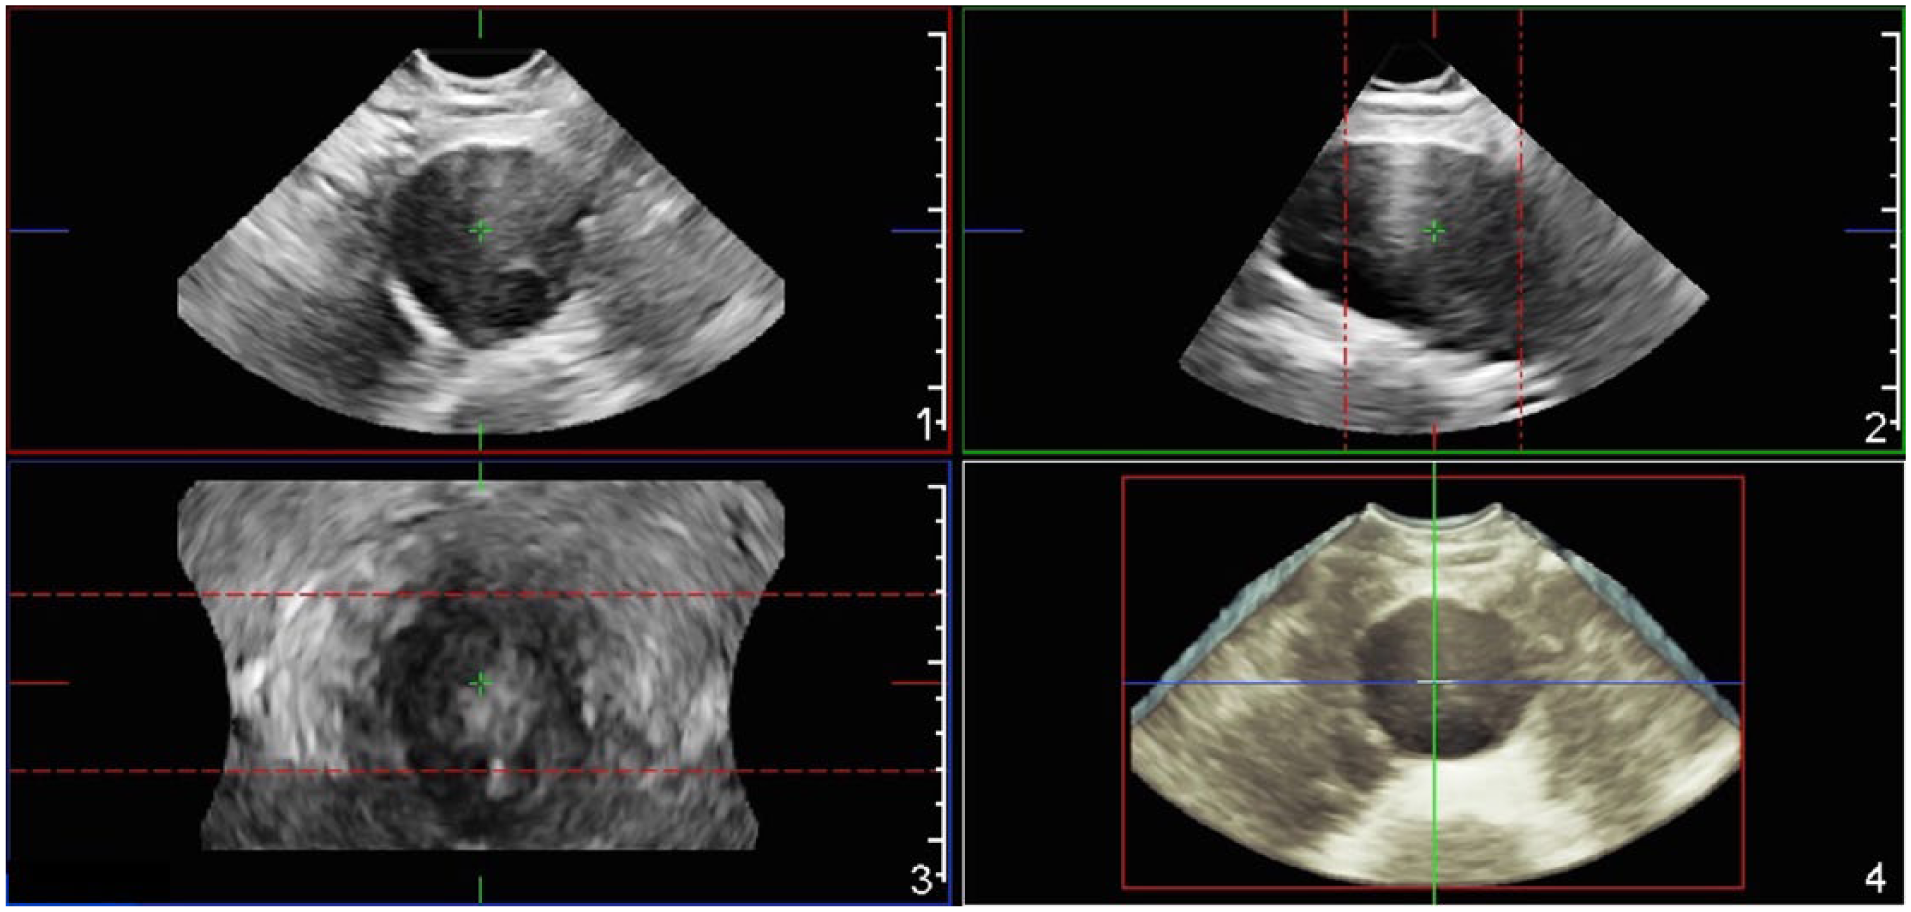
The abdominal aortic aneurysm 3D acquisition with an X-matrix transducer. The axial (1), sagittal (2) and coronal (3) planes are represented, as well as the 3D reconstruction (4).
Part 2 of the US examination
The echocardiographic transducer (S5-1) was used in association with the US electrocardiographic (ECG) triple-cable connected to the patient. During a breath hold, the MD in pulsatile movements was acquired during a few cardiac cycles. All US images from both parts were saved for post-processing.
Biomechanical variables
The acquisition with the echocardiographic transducer gated with ECG tracing was utilized in order to detect the biomechanical characteristics of the aorta wall. The calculation was performed using the Philips QLAB Version 9 CMQ software, and parameters were adapted from methodology applied for strain measurement in echocardiography, which involves 2D speckle-tracking algorithms. 14 The aorta circumference was semi-automatically traced. The variations in the following wall biomechanical parameters in the aorta MD were semi-automatically calculated (Figure 2):
Global circumferential strain (%): normalized circumferential length to original length. The average during one cardiac cycle was obtained.
Global rotation (o): rotation of tissue at a particular level of segmentation. The maximum value during one cardiac cycle was collected. The direction of the aorta rotation (counter-clockwise or clockwise) determines positive and negative values; however, the maximum absolute values were considered.
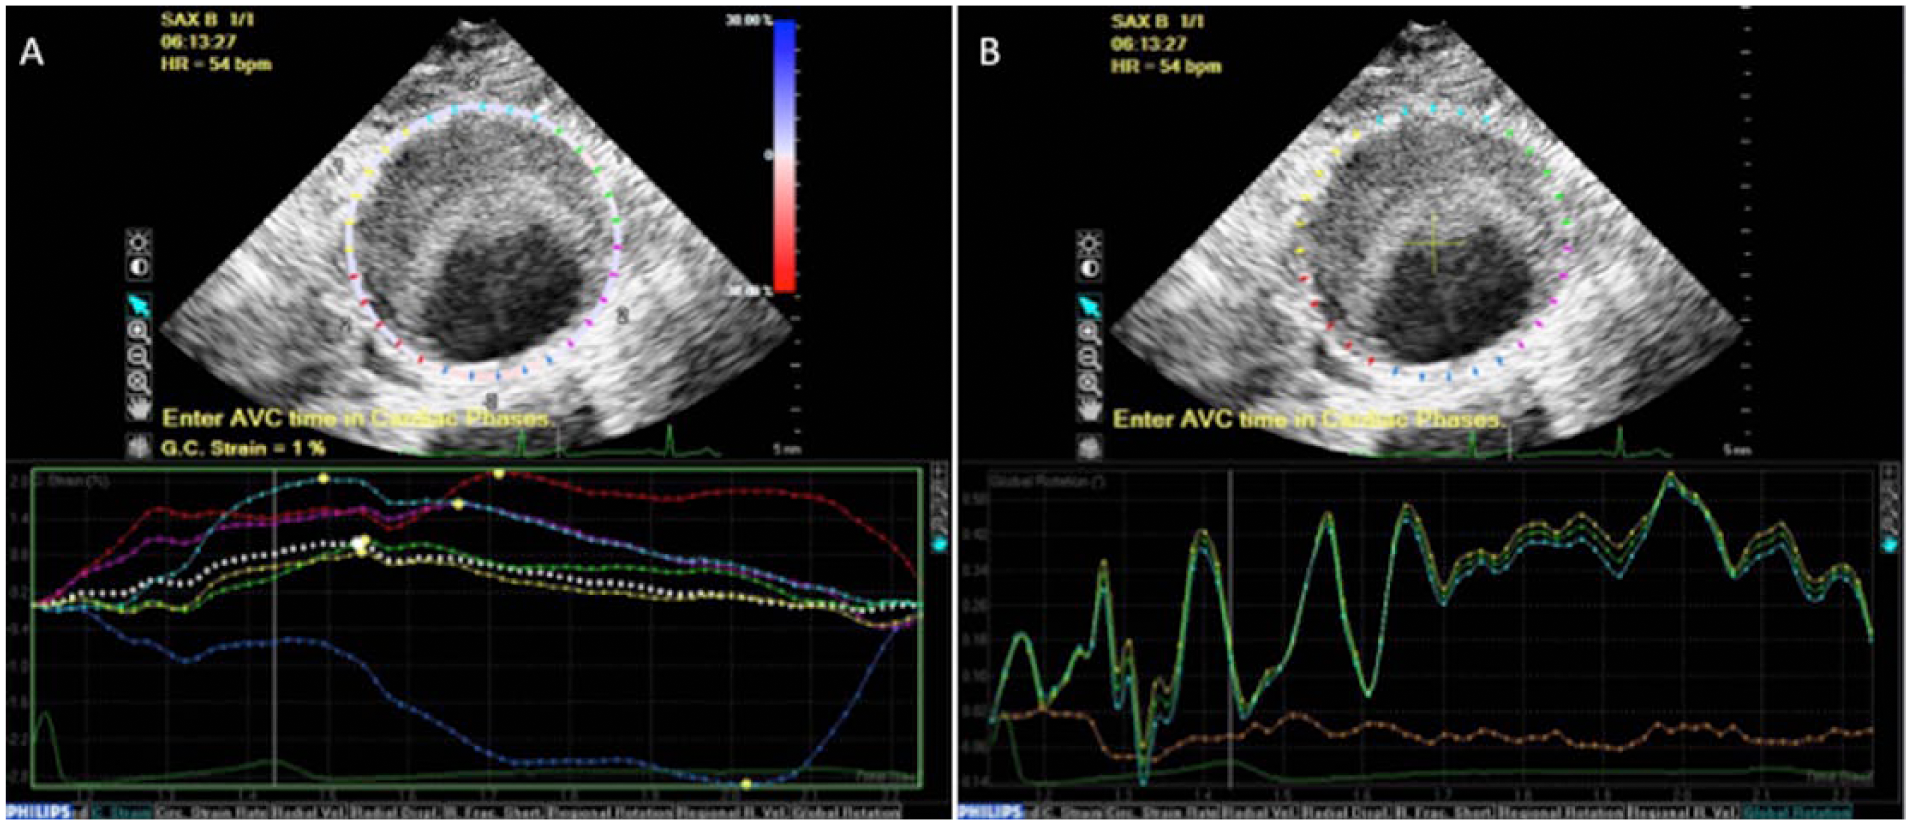
The aorta circumference was semi-automatically traced. The line colors in the graphs correspond to the colors of the wall: anterior (A) light blue; right antero-lateral (rAL) yellow; left antero-lateral (lAL) green; posterior (P) blue; right postero-lateral (rPL) red; and left postero-lateral (lPL) pink. (A) Circumferential strain: the y-axis represents the strain value and the x-axis represents the time (in seconds) during the cardiac cycle. The global circumferential strain (average) was automatically calculated. For region-specific analysis, the maximum value (peak of the curve) of the anterior and the posterior walls were collected. Negative and positive values represent, respectively, a decrease (segment contraction) and an increase (segment stretching) of the original circumferential length. (B) Global rotation: the y-axis represents the rotation value and the x-axis represents the time (in seconds) during the cardiac cycle. The direction of the rotation (counter-clockwise or clockwise) determines positive and negative values; however, the maximum absolute values were considered.
Thereafter, in order to analyze the circumferential strain in a region-specific way, the circumference of the midsection was automatically divided into six equal regions: anterior (A), right antero-lateral (rAL), left antero-lateral (lAL), posterior (P), right postero-lateral (rPL) and left postero-lateral (lPL). The maximum value (peak of the curve) of the circumferential strain was collected in each wall region for analysis. Negative and positive values represent, respectively, a decrease (segment contraction) and an increase (segment stretching) of the original circumferential length. To avoid over-analyzing the region-specific data, only the non-contiguous regions of the anterior wall (A) and the posterior wall (P) were compared in a paired fashion.
3D reconstruction and partial volume estimation
The AAA partial volume based on US was calculated using the Philips QLAB Version 9 3D Quantification (3DQ) software. The image of the aorta with maximum expansion was selected for analysis. A centerline was traced in the longitudinal aneurysm axis using two manually defined extremities at the most proximal and distal locations that the 3D acquisition was capable to include. The software defined 15 slices perpendicular to the centerline at regularly spaced positions. The outer vessel wall was used and, for each contour, the maximum area (cm2) was calculated. A volume from the first to last slice was automatically calculated. In the case of an aorto-iliac aneurysm, only the abdominal component was included in the estimated volume.
In all cases the MD was the center of the acquisition, but the centerline length was not always the same. This happened because there is decreased image quality in the extremities of the acquisition in some patients resulting in an inability to accurately capture these cross-sections in some aneurysms. In addition, there was an inability to include the entire span of elongated aneurysms. To bypass this issue and also in order to standardize the volume between different aneurysm extensions, the distance between the first and last slices was measured and the volume was normalized with this extension, resulting in a new metric: volume/extension (Figure 3A).
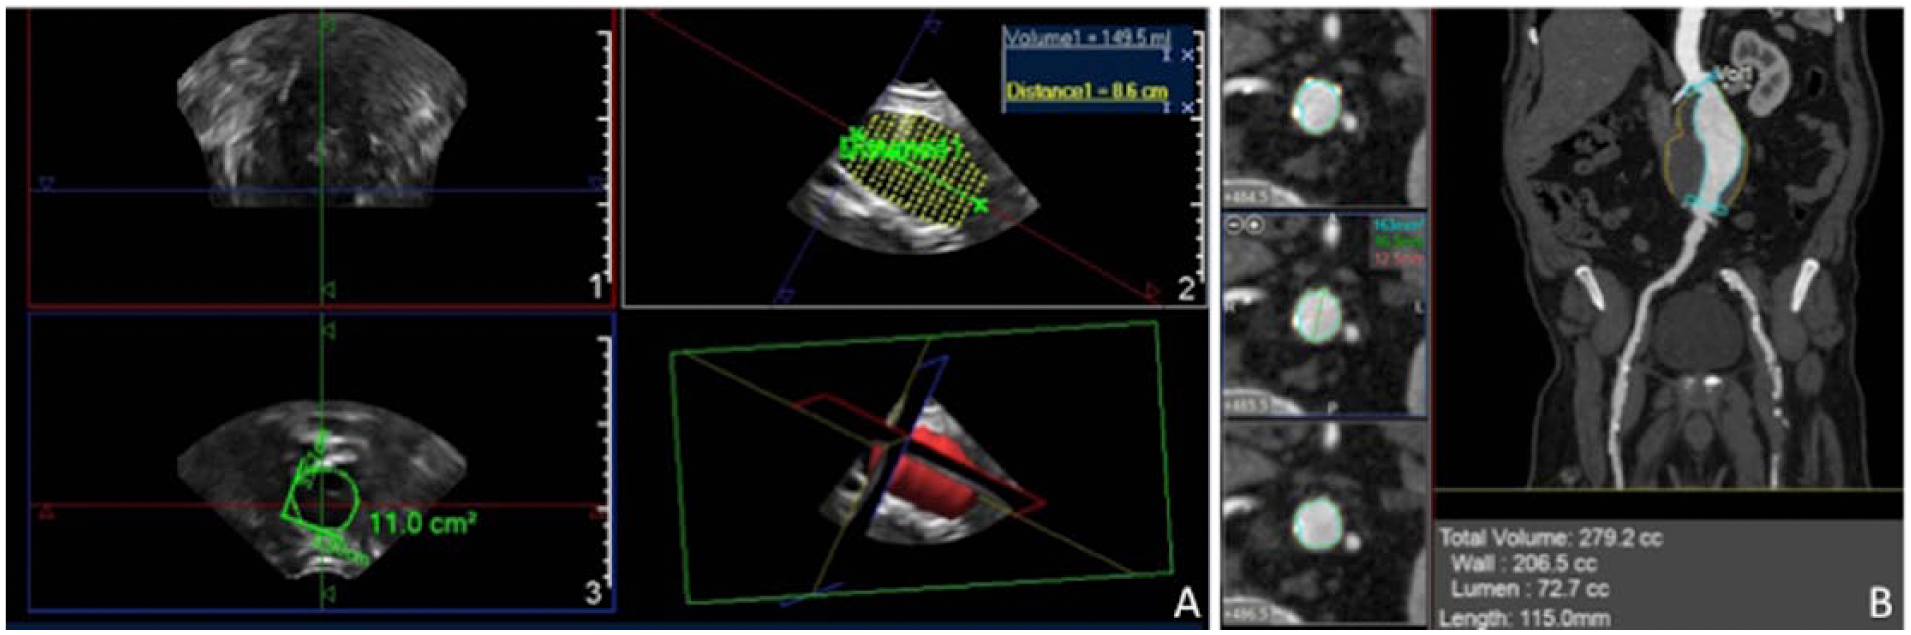
(A) The ultrasound (US) volume calculation. The coronal (1), sagittal (2) and axial (3) planes are represented, as well as the 3D reconstruction. For each of the 15 slices (image 2), the outer vessel wall was manually defined and the maximum area (cm2) was calculated (image 3). A partial volume from the first to last slice was then automatically calculated. The distance between the first and last slices was measured to calculate the volume/extension ratio. (B) The abdominal aortic aneurysm volume calculation with the computed tomography quantification software. The aneurysm outer wall was adjusted in order to include the thrombus in the volume measurement. The volume and the length between the beginning of the aneurysm and aorta bifurcation were considered for analysis. Similarly to the US, the volume/extension ratio was calculated.
Computed tomography (CT) volumetry
Biphasic acquisition (unenhanced and contrast-enhanced with bolus tracking) was performed using a 64-row multi-slice scanner (Discovery CT750 HD; GE Healthcare, Waukesha, WI, USA) with a detector configuration of 0.625 × 64, pitch of 1.375, 120 kV, and automatic exposure for mA. Non-ionic iodinated contrast (300 mg/mL, Ultravist; Bayer Leverkusen, Germany) was injected by a peripheral access in an ante-cubital vein at a rate of 3.5–4 mL/s (total volume of 100–120 mL). Image reconstruction was performed with a 1.3-mm slice thickness with a 1.0-mm increment in a 512 × 512-matrix image.
The anatomic boundaries used for measuring the aneurysm volume were from the beginning of the aneurysm to the aorta bifurcation. A centerline was traced between these two points. The aneurysm volume was calculated by a semi-automated method, in which the aneurysm outer wall was adjusted by a specialist who could recognize the thrombus when present and include it in the volume measurement (Figure 3B). Similar to US, the volume to extension ratio was calculated.
Statistical analysis
Categorical variables are presented in tables with absolute (n) and relative (%) frequencies. Differences were evaluated with the chi-squared test. For continuous variables with normal distribution, data are presented as the means (± the standard deviation (SD)); for variables with non-normal distribution, data are presented as median (interquartile range (IR)). The ANOVA test was used for comparing the means of normal data between the three groups, and the Bonferroni test was used to access independent differences. For variables with non-normal distribution, Kruskall–Wallis analysis was used for comparing the three groups and the Mann–Whitney test was used to access independent differences. The Wilcoxon test was used for paired comparisons. The correlations between the biomechanical parameters and vital signs and EF were calculated with the Spearman correlation coefficient. The R2 and the intraclass correlation coefficient (ICC) were used to compare the 3D-US and CT volume. The equation of the correlation line was also given. Significance was set at a p-value < 0.05. Analyses were performed using IBM SPSS Statistics Version 20 software (IBM Corp., Armonk, NY, USA).
Results
In total, 31 patients in group 1, 46 in group 2 and 31 in group 3 were recruited for US examination. Patient clinical characteristics are shown in Table 1. The median aorta diameter was 1.9 cm (IR 1.8–2.1), 4.2 cm (IR 3.8–4.8) and 6.0 cm (IR 5.6–6.5) in groups 1, 2 and 3, respectively. The median global circumferential strain was 2.0% (IR 1.0–3.0), 1.0% (IR 1.0–2.0) and 1.0% (IR 1.0–1.75) in groups 1, 2 and 3, respectively (p < 0.001). When analyzed independently, group 1 was statistically different from group 2 (p < 0.001) and group 3 (p < 0.001), but there was no significant difference between groups 2 and 3 (p = 0.39) (Figure 4A).
Clinical variables, cardiac ejection fraction and vital signs at the time of examination.
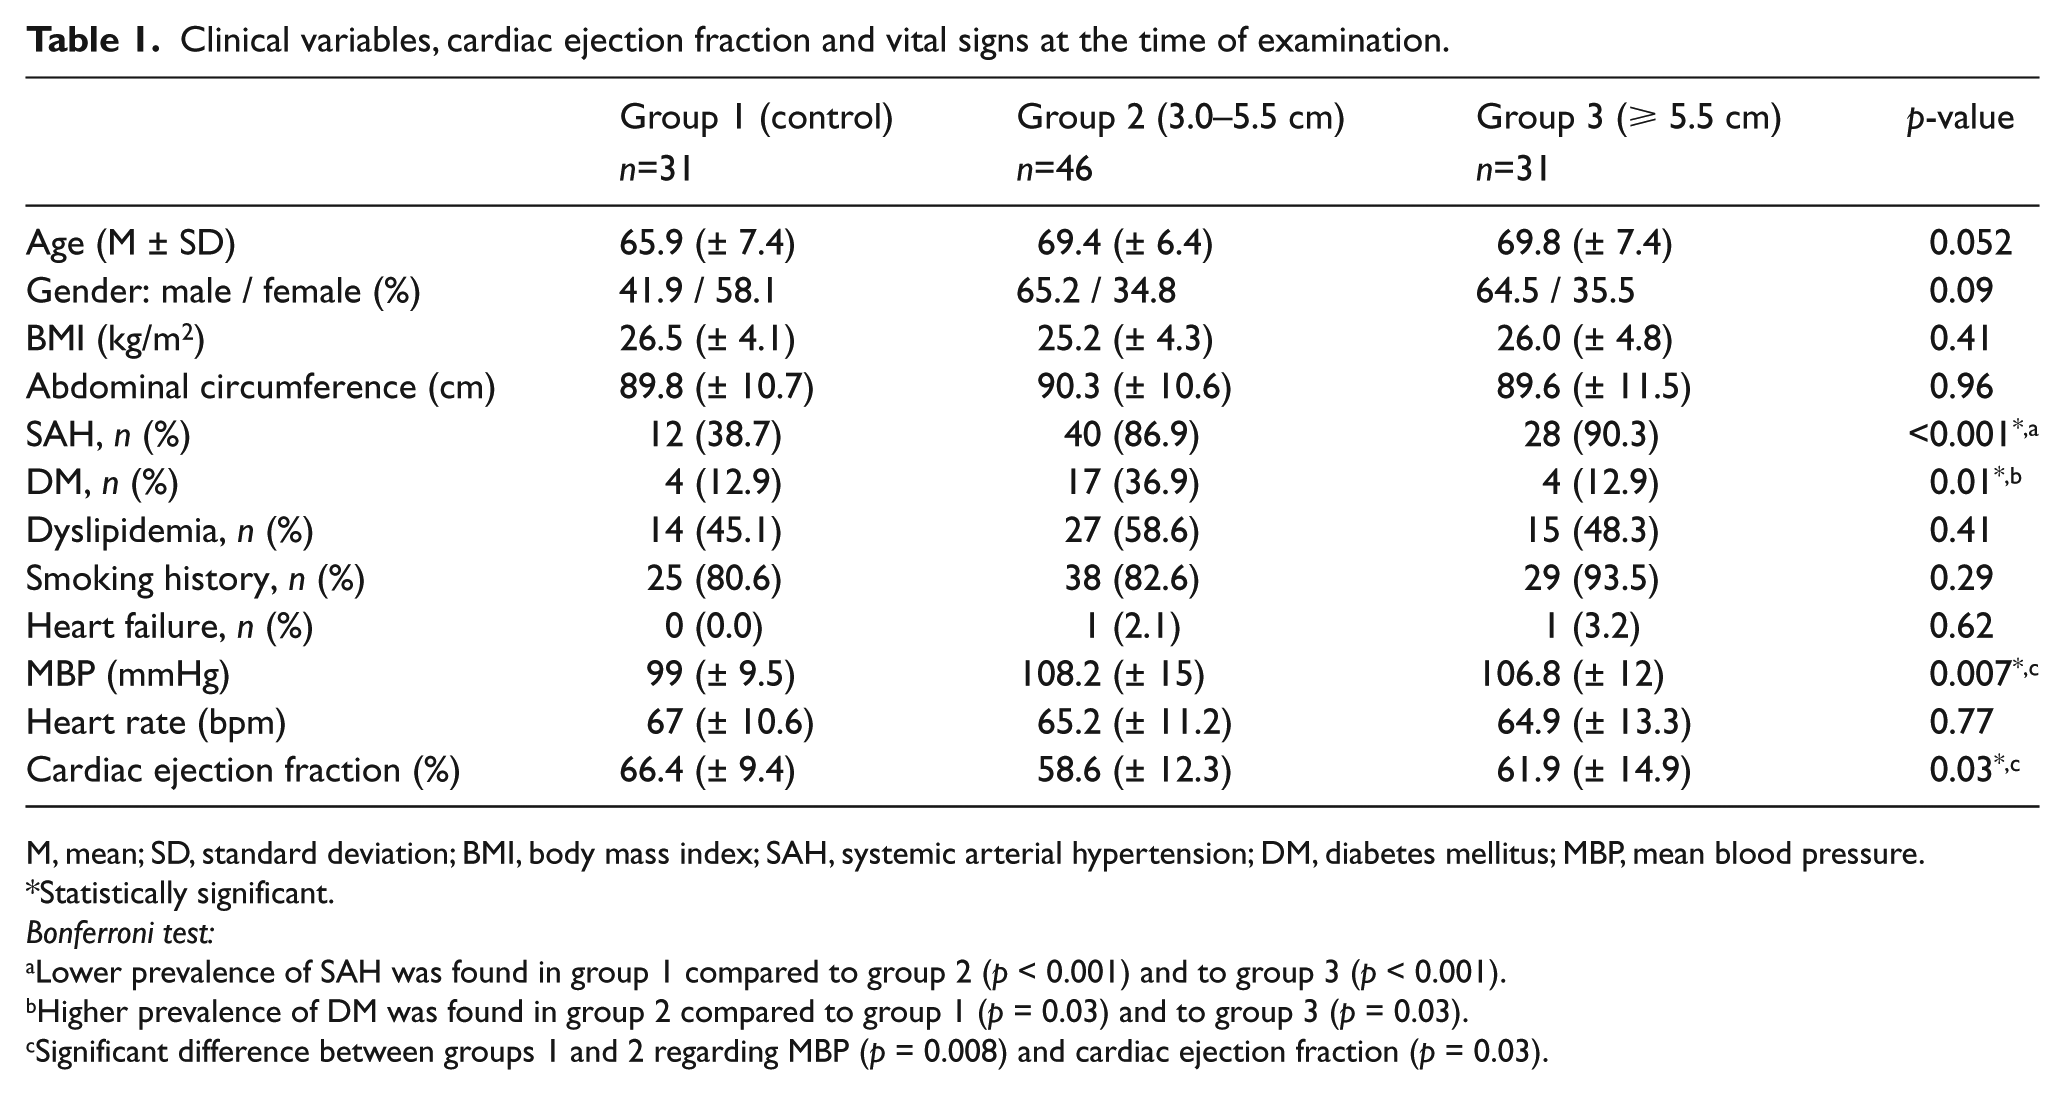
M, mean; SD, standard deviation; BMI, body mass index; SAH, systemic arterial hypertension; DM, diabetes mellitus; MBP, mean blood pressure.
Statistically significant.
Bonferroni test:
Lower prevalence of SAH was found in group 1 compared to group 2 (p < 0.001) and to group 3 (p < 0.001).
Higher prevalence of DM was found in group 2 compared to group 1 (p = 0.03) and to group 3 (p = 0.03).
Significant difference between groups 1 and 2 regarding MBP (p = 0.008) and cardiac ejection fraction (p = 0.03).
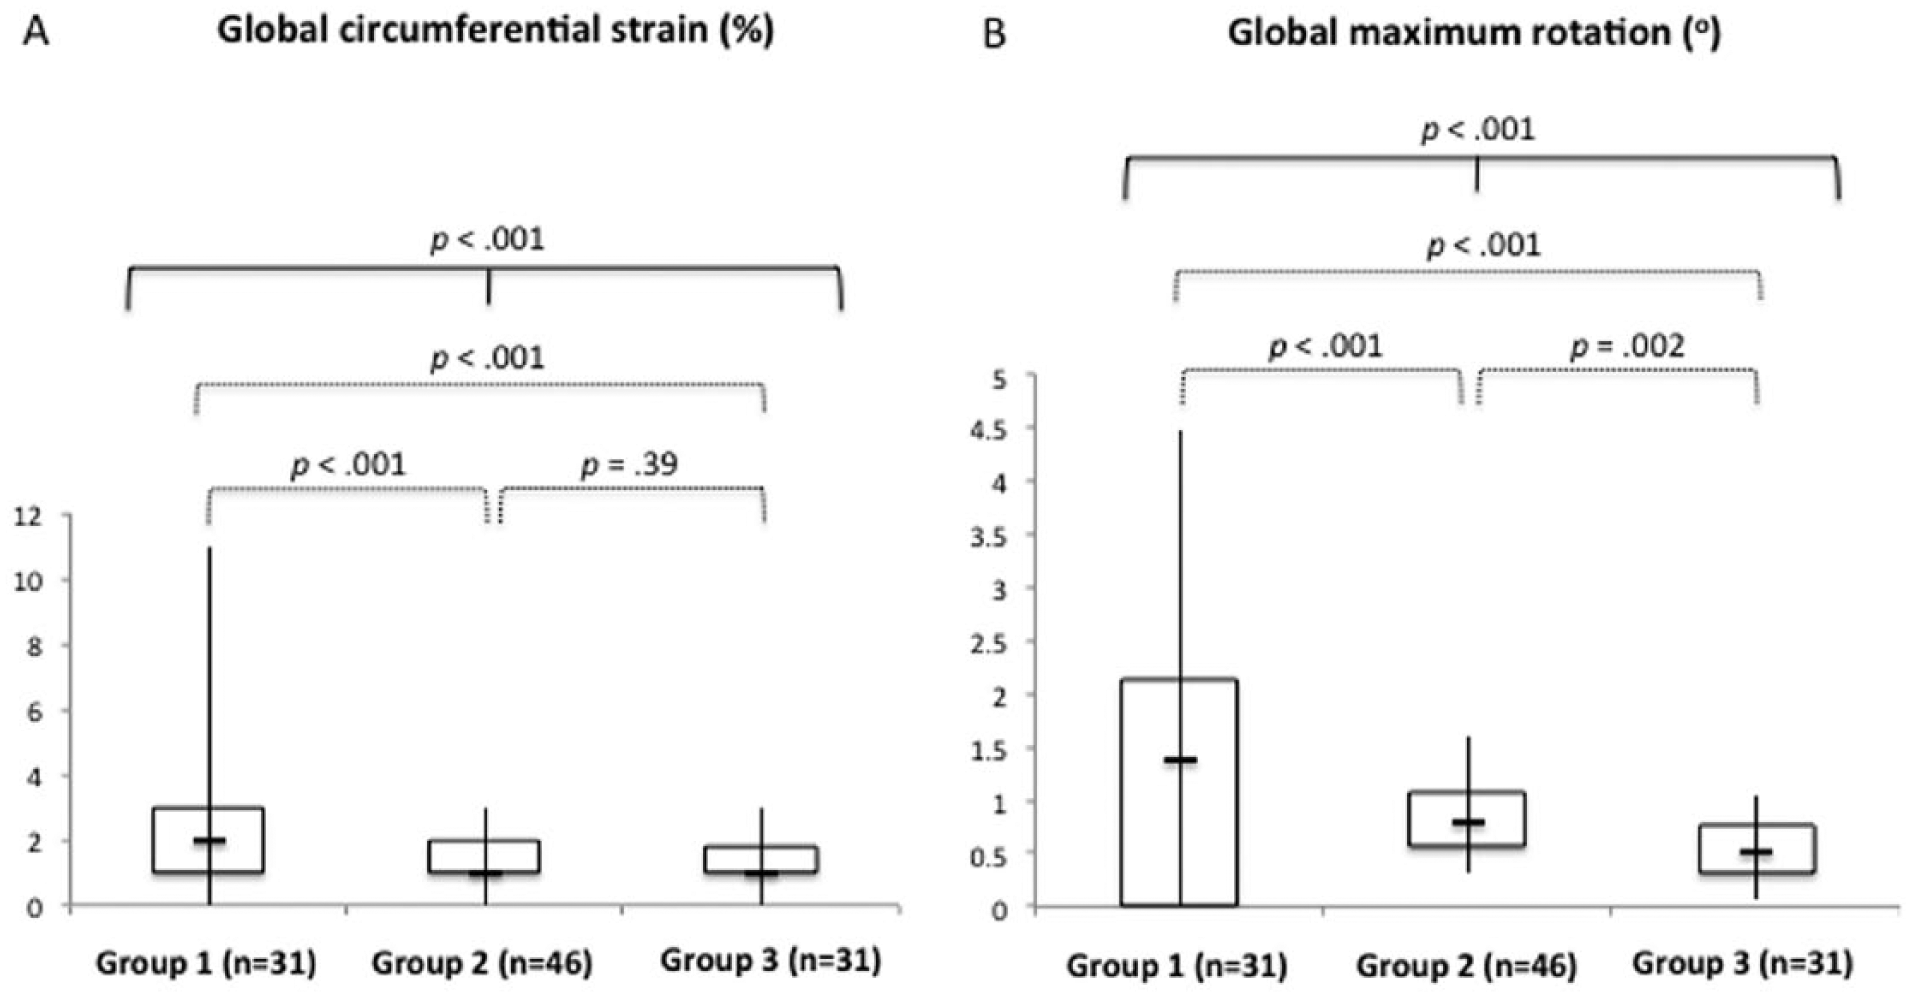
Comparison of the global circumferential strain (A) and global maximum rotation (B) between groups. The median, first and third quartiles, and minimum and maximum values are represented, as well as the p-values (continuous line, three-group analysis; dotted lines, independent analysis). There was a significant difference in strain between all groups and between groups 1 and 2 and 1 and 3. There was a progressive decrease of the rotation from group 1 to group 3.
There was a progressive decrease in the global maximum rotation between groups. The median was 1.38º (IR 0.77–2.13), 0.80º (IR 0.57–1.0) and 0.50º (IR 0.31–0.75) in groups 1, 2 and 3, respectively (p < 0.001). When analyzed independently, group 1 was statistically different from group 2 (p = 0.001) and group 3 (p < 0.001), as well as group 2 from group 3 (p = 0.002) (Figure 4B).
Neither the cardiac EF nor the mean blood pressure at the moment of the examination showed statistically significant correlations with the biomechanical parameters. The heart rate had negative correlation with the maximum global rotation in group 1 (p = 0.008) and group 3 (p = 0.02); although there was a negative correlation with group 2, it was not statistically significant (p = 0.32).
In the region-specific strain analysis, paired comparisons revealed that the regional strain in the posterior wall was not significantly different from the anterior wall in groups 1 (p = 0.06) and 2 (p = 0.81). However, strain in the posterior wall was significantly higher than the anterior wall in group 3 (p = 0.003) (Figure 5A). Since the comparisons were paired, the metric [posterior wall strain – anterior wall strain] is plotted in Figure 5B for all groups.
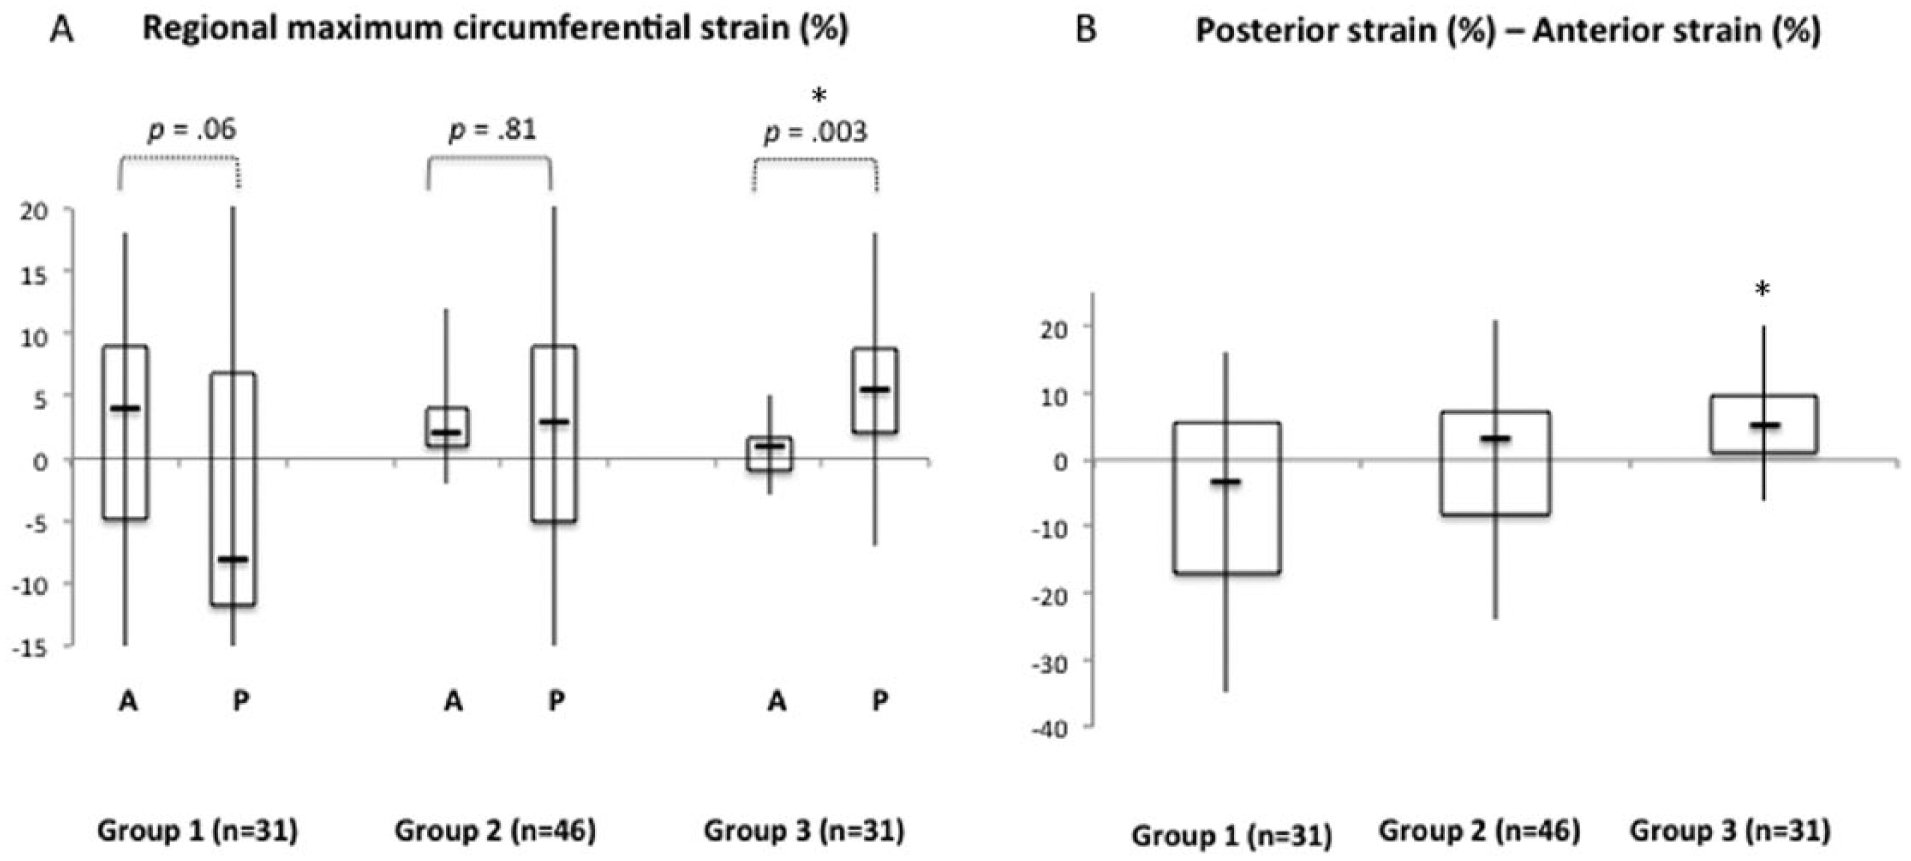
Region-specific paired comparison of the maximum circumferential strain between the posterior (P) and anterior (A) walls for each of the three groups. (A) Box plots for strains estimated in the anterior and posterior wall regions within each group. The regional strain in the posterior wall was not significantly different from the anterior wall in groups 1 and 2, but significantly higher than the anterior wall in group 3. (B) In order to better represent the paired nature of the differences, box plots of the difference between posterior and anterior strain are shown for each group. A negative value indicates that the anterior wall strain is more tensile than the posterior wall, while a positive value indicates that the posterior wall strain is more tensile than the anterior wall. Note that, unlike in groups 1 and 2, the posterior wall was more tensile than the anterior wall with statistical significance in group 3 (large abdominal aortic aneurysm) based on the Wilcoxon signed-rank test.
Forty patients with aneurysms had available CT scans that were performed within 6 months from the US examination. The volume/extension ratio detected by the 3D-US and CT had a good correlation (R2 = 0.76, y = 0.659x + 1.61) but were not identical. There is a tendency of overestimation of the CT measurements compared to the US measurements. The intraclass correlation coefficient was 0.70, with 95% CI (Figure 6).
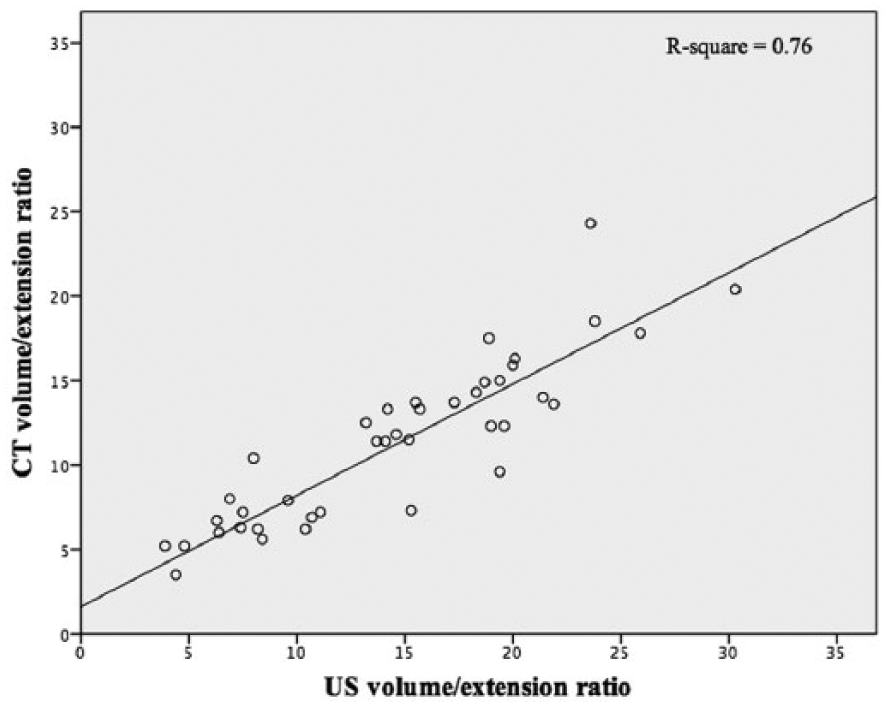
The correlation between the abdominal aortic aneurysm volume detected by 3D-ultrasound and computed tomography.
Discussion
The present study analyzed the infra-renal aorta volumetry and biomechanical parameters detected by 3D/2D US. To our knowledge, this is the first in vivo study to compare biomechanical parameters between normal aorta, small aneurysms and large aneurysms using US. One of the strengths of the present study is that it evaluated the feasibility of an in vivo analysis of the volumetry and biomechanical properties of AAA with a non-invasive and very low-risk method of examination. Another strength is the homogeneity of the analysis. All scans were performed with the same US equipment, and the same post-processing software programs were used for the analysis. In the same way, all CT scans were performed according to the same protocol and the volume was measured with the same software. Finally, a large number of patients with different MD were enrolled to ensure heterogeneity in terms of the aneurysm volume, biomechanical behavior and demographic variables.
Biomechanical parameters may be important to individualize the risk of rupture. 15 Because AAA rupture represents a mechanical failure of the aortic wall, understanding the essential features of the process could improve the clinical management of patients. The complexity of the disease can be represented by the heterogeneous distribution of aortic wall biomechanical properties.16,17 Biomechanical parameters, such as mechanical wall stress, have been suggested by many studies to be superior to the MD in rupture risk prediction.6,18
In vivo AAA wall properties can be estimated using CT followed by geometric reconstruction and analysis. 19 A recent study showed that it was possible to assess the aortic wall motion during the cardiac cycle through ECG-gated CT multi-detector imaging. 20 Although there have been advances in these studies with CT, it is an expensive method and involves radiation. In contrast, US is a non-invasive method, does not require the use of radiation or contrast agents, and can be repeated as often as needed for each AAA patient.
In our study, the biomechanical parameters were calculated using US coupled with 2D speckle-tracking algorithms, a technique that has the potential to assess the deformation of subsurface structures with high spatial resolution. ‘Strain’ was defined as the deformation of an object, normalized to its original shape; that is, the findings obtained by automatic measurement of the change in the distance between two points. 21 Strain estimation based on 2D-US measurements has been developed for cardiology 14 and has already been used to calculate the strain of AAA in preliminary studies.10,11 But the accuracy of such estimates remain unverified.
Our results showed that the maximum circumferential strain was higher in the control group compared with the aneurysm groups; however, no difference was found between the two aneurysm groups. The maximum global rotation suffered a progressive and significant decrease between group 1 and group 2, and group 2 and group 3. These findings are consistent with earlier echographic measurements showing significantly lower AAA compliance compared to non-aneurysmal aorta.22,23
In this study we also compared the regional circumferential strain in the posterior wall to the anterior wall. These walls are of particular interest because most aneurysms, owing to asymmetric anterior bulge, have significantly thicker intraluminal thrombus (ILT) attached to their anterior wall compared to their posterior. 24 Using computational models, Wang et al. reported that intraluminal thrombus reduces AAA wall stress and, consequently, wall strain. 25 Because the posterior wall has relatively less ILT protection, this could conceivably result in higher circumferential stress and circumferential strain on the posterior wall compared to the anterior wall, thus manifesting in differences in regional strains. If the speckle-tracking approach is indeed yielding reliable estimates, it will likely manifest in a consistently greater regional strain in the posterior wall compared to the anterior wall of the AAA. Interestingly, we found that posterior wall strain was not consistently higher for the normal aorta (group 1) and the small AAA (group 2), but was indeed greater for the large AAA (group 3) based on paired tests. Indeed, one would expect that the asymmetry in ILT distribution would be appreciable mainly in large AAA while being non-existent in normal aorta and minimal in small AAA. Speckle-tracking estimates are therefore consistent with logical reasoning.
This is important because regional differences can be found in the aneurysmal aorta, and elasticity may be preserved in some points of the aneurysm. Supporting this, an autopsy study of the biomechanical characteristics of the aorta has shown that ruptured AAA were not globally weaker than unruptured ones. 26 Even with the growth of an AAA, some walls can deform more than others; these relatively preserved walls might have a role to better absorb hemodynamic stress. Likely for this reason, an in vitro study with aorta wall segments from patients who underwent surgical repair showed that the AAA strength in large aneurysms is not related to the MD. 27 The ability to track regional strains may be a very valuable asset in evaluating the caliber of AAA. While our findings add credibility to the speckle-tracking approach, concerns include lack of clarity on the tracking and calculation strategies employed in the commercial algorithm used by the vendor and the fact that large differences in strains were estimated between regions for normal aorta. We recommend additional independent studies to verify our findings and then ascertain clinical significance.
The sole use of the MD for AAA evaluation has limitations since it is a biplane measurement that is affected by the morphology, angulation and shape changes of the aneurysm. In contrast, the volume measurement can take into account the gradual changes in aneurysm morphology that cannot be reflected in a single diameter cross-section. In addition, because a volume measurement reflects the aneurysm in a 3D way, it can overcome the issues associated with measuring the cross-sectional diameter in tortuous aortas. 28
The aneurysm volume is usually assessed by CT scanning and automatic segmentation software programs, 29 which is not cost-effective for the follow-up of aneurysms without surgical indication. The development of matrix probes with novel electronic arrays made 3D-US reliable for aneurysm volume calculation. 30 The sweep can be displayed in real time, so the target region can be easily and quickly included in the dataset. Recent studies using CT as the gold standard showed that 3D-US is an accurate and reproducible method for estimating the volume after endovascular aneurysm repair.31,32 In our study, the protocol for image acquisition was standardized, took approximately 5 minutes, and the pre-operative volume obtained also had good correlation with the CT.
Limitations
This study has some limitations. First, the aneurysm volume measured by CT and US had similar but not exactly the same boundaries. The inability to include the entire span of the AAA in some subjects for 3D-US imaging is a limitation that required the use of the volume/extension ratio. It is reasonable to wonder if this ratio can be an effective replacement for volume, especially when tracking AAA in patients over time. Second, due to technical issues, the intra and inter-sonographer variability was not demonstrated in this study. Finally, the aneurysm asymmetry and presence of thrombus in each wall were not analyzed and correlated with the biomechanical findings. Further investigations are planned to overcome those limitations.
Conclusion
Factors other than diameter could be considered to better discriminate the individual risk of AAA rupture and to help with decisions regarding indications for treatment. The use of US with 3D properties is a non-invasive and reproducible method that has the potential to detect the biomechanical and volumetric characteristics of AAA. Further prospective and long-term studies are necessary to correlate those parameters with rupture risk.
Footnotes
Declaration of conflicting interests
The authors declared no potential conflicts of interest with respect to the research, authorship, and/or publication of this article.
Funding
The authors received no financial support for the research, authorship, and/or publication of this article.