
Abstract
Sarcopenia, also known as a reduction of skeletal muscle mass, is a patient-specific risk factor for vascular and cancer patients. However, there are no data on abdominal aortic aneurysm (AAA) patients treated with endovascular aneurysm repair (EVAR) who have sarcopenia. To determine the impact of sarcopenia on mortality following EVAR, we retrospectively reviewed 200 patients treated with EVAR by estimating muscle mass on abdominal computed tomography (CT) scans. Mortality was analyzed according to its presence (n=25) or absence (n=175). Sarcopenia was more common in women than men (32.0% vs 9.7%; p=0.005). Patients with sarcopenia had an increased risk of mortality compared to those without (76% vs 48%; p=0.016). Of note, the overall mortality rate was 51% with a median follow up of 8.4 years (interquartile range, 5.3–11.7). In conclusion, the presence of sarcopenia on a CT scan is an important predictor of long-term mortality in patients treated for AAA with EVAR. Pending further study, these data suggest that sarcopenia may aid in pre-procedural long-term survival assessment of patients undergoing EVAR.
Introduction
Computed tomography (CT) scans are universally used for the preoperative evaluation of the abdominal aortic aneurysm (AAA) patient. Typically, aneurysm morphology is carefully assessed and other anecdotal findings, such as a pathologic mass, visceral organ abnormality, or prior surgical changes, are noted. The skeletal muscle area of the abdomen, however, is not measured, although the ability to do so is readily available.
Studies have shown reduced psoas muscle mass to be a strong predictor of mortality in patients following open aneurysm repair, as well as in those with critical limb ischemia (CLI).1,2 However, to date, there are no data available on patients treated with endovascular aneurysm repair (EVAR) who have sarcopenia. The purpose of this study was to provide an estimate of long-term mortality risk for EVAR patients with and without sarcopenia.
Methods
Patients and database
Following approval from the Greenville Health System’s Institutional Review Board, we retrospectively reviewed 200 patients, from a prospective database, who underwent elective EVAR repair between February 1999 and December 2007 by the vascular surgery service. This time interval enabled access to imaging, demographic, and long-term follow-up data. The study population represented approximately 50% of the AAA patients treated during that time interval. Patients who underwent open aneurysm repair, had no follow-up after treatment, or whose abdominal CT scan was not available were excluded from this study. This study only included Instructions for Use (IFU) patients; no snorkel, chimney, or fenestrated procedures were performed.
The CT scan used for muscle mass measurements was performed just prior to the EVAR or on the first postoperative visit (within 1 month). Measurements were made at the mid-body of the third lumbar vertebral body (L3). Selection of the proper axial slice was facilitated by cross-referencing the axial image with the CT scout image. The muscle area was determined by manually segmenting the muscle groups (abdominal wall, paraspinal, psoas) utilizing a freeform markup tool. Measurements were obtained on an AGFA© PACS workstation and were performed by a single observer (KT). The summation of these muscle groups represented the total skeletal muscle area (cm 2 ) used for establishing the presence or absence of sarcopenia. Sarcopenia was defined as having a skeletal muscle area <114.0 cm2 (men) or <89.8 cm2 (women); this definition was originally derived from data in donor liver transplantation patients and later used to assess sarcopenia in CLI patients.2,3 Sarcopenia is not yet a well-defined entity; as such, we performed a quartile analysis on the distribution of muscle mass in EVAR patients to evaluate the definition of sarcopenia used in the literature.
Data collection and statistical analysis
Data collection included patient demographics and comorbidities, including: age, sex, race, diabetes (DM), smoking status, coronary artery disease (CAD), hypertension (HTN), obesity, chronic obstructive pulmonary disease (COPD), and AAA diameter (cm). The presence of CAD was defined as having an abnormal electrocardiogram, prior myocardial infarction, prior coronary bypass, or prior percutaneous coronary intervention. Hypertension was defined as having a resting blood pressure greater than 140/90 mmHg or requiring antihypertensive medications. Obesity was defined as having a body mass index (BMI) greater than 30.0. COPD was defined as having a history of pulmonary obstructive disease or required use of home oxygen secondary to lung disease. Data were analyzed according to the last available follow-up visit. Social security death index data were helpful in determining the date of death, which was the primary endpoint. Follow up was defined as the date of the procedure to the last date of observation.
Baseline descriptive statistics were used to determine the study population, followed by bivariate analysis to determine the differences in patient demographics. The differences in continuous variables were analyzed using parametric t-tests and the differences in discrete variables were analyzed with chi-squared or, in the case of small sample sizes (n<5), Fisher’s exact tests. Differences in Kaplan–Meier survival curves were analyzed using a log-rank test. Statistically significant covariates in the bivariate analyses were incorporated into a multivariate logistic regression. Resulting odds ratios and 95% confidence intervals were calculated for each covariate in the multivariate analysis. Data analysis was performed using R statistical software (version 3.1.3; R Foundation for Statistical Computing, Vienna, Austria).
Results
Patient characteristics and analysis
The original abdominal CT scans on 200 patients with AAA who subsequently underwent EVAR by the vascular surgery service at Greenville Health System were analyzed. Overall demographic information is presented in Table 1. There were 175 men and 25 women in the study. Mean age at the time of treatment was 74 ± 7.5 years. The overall mortality rate was 51%, with a median follow up of 8.4 years (interquartile range, 5.3–11.7) and median time to death of 5.4 years (interquartile range, 3.0–8.4). Five major postoperative complications were noted: two ruptures, one graft migration, one graft infection, and one acute aneurysm expansion.
Patient characteristics.
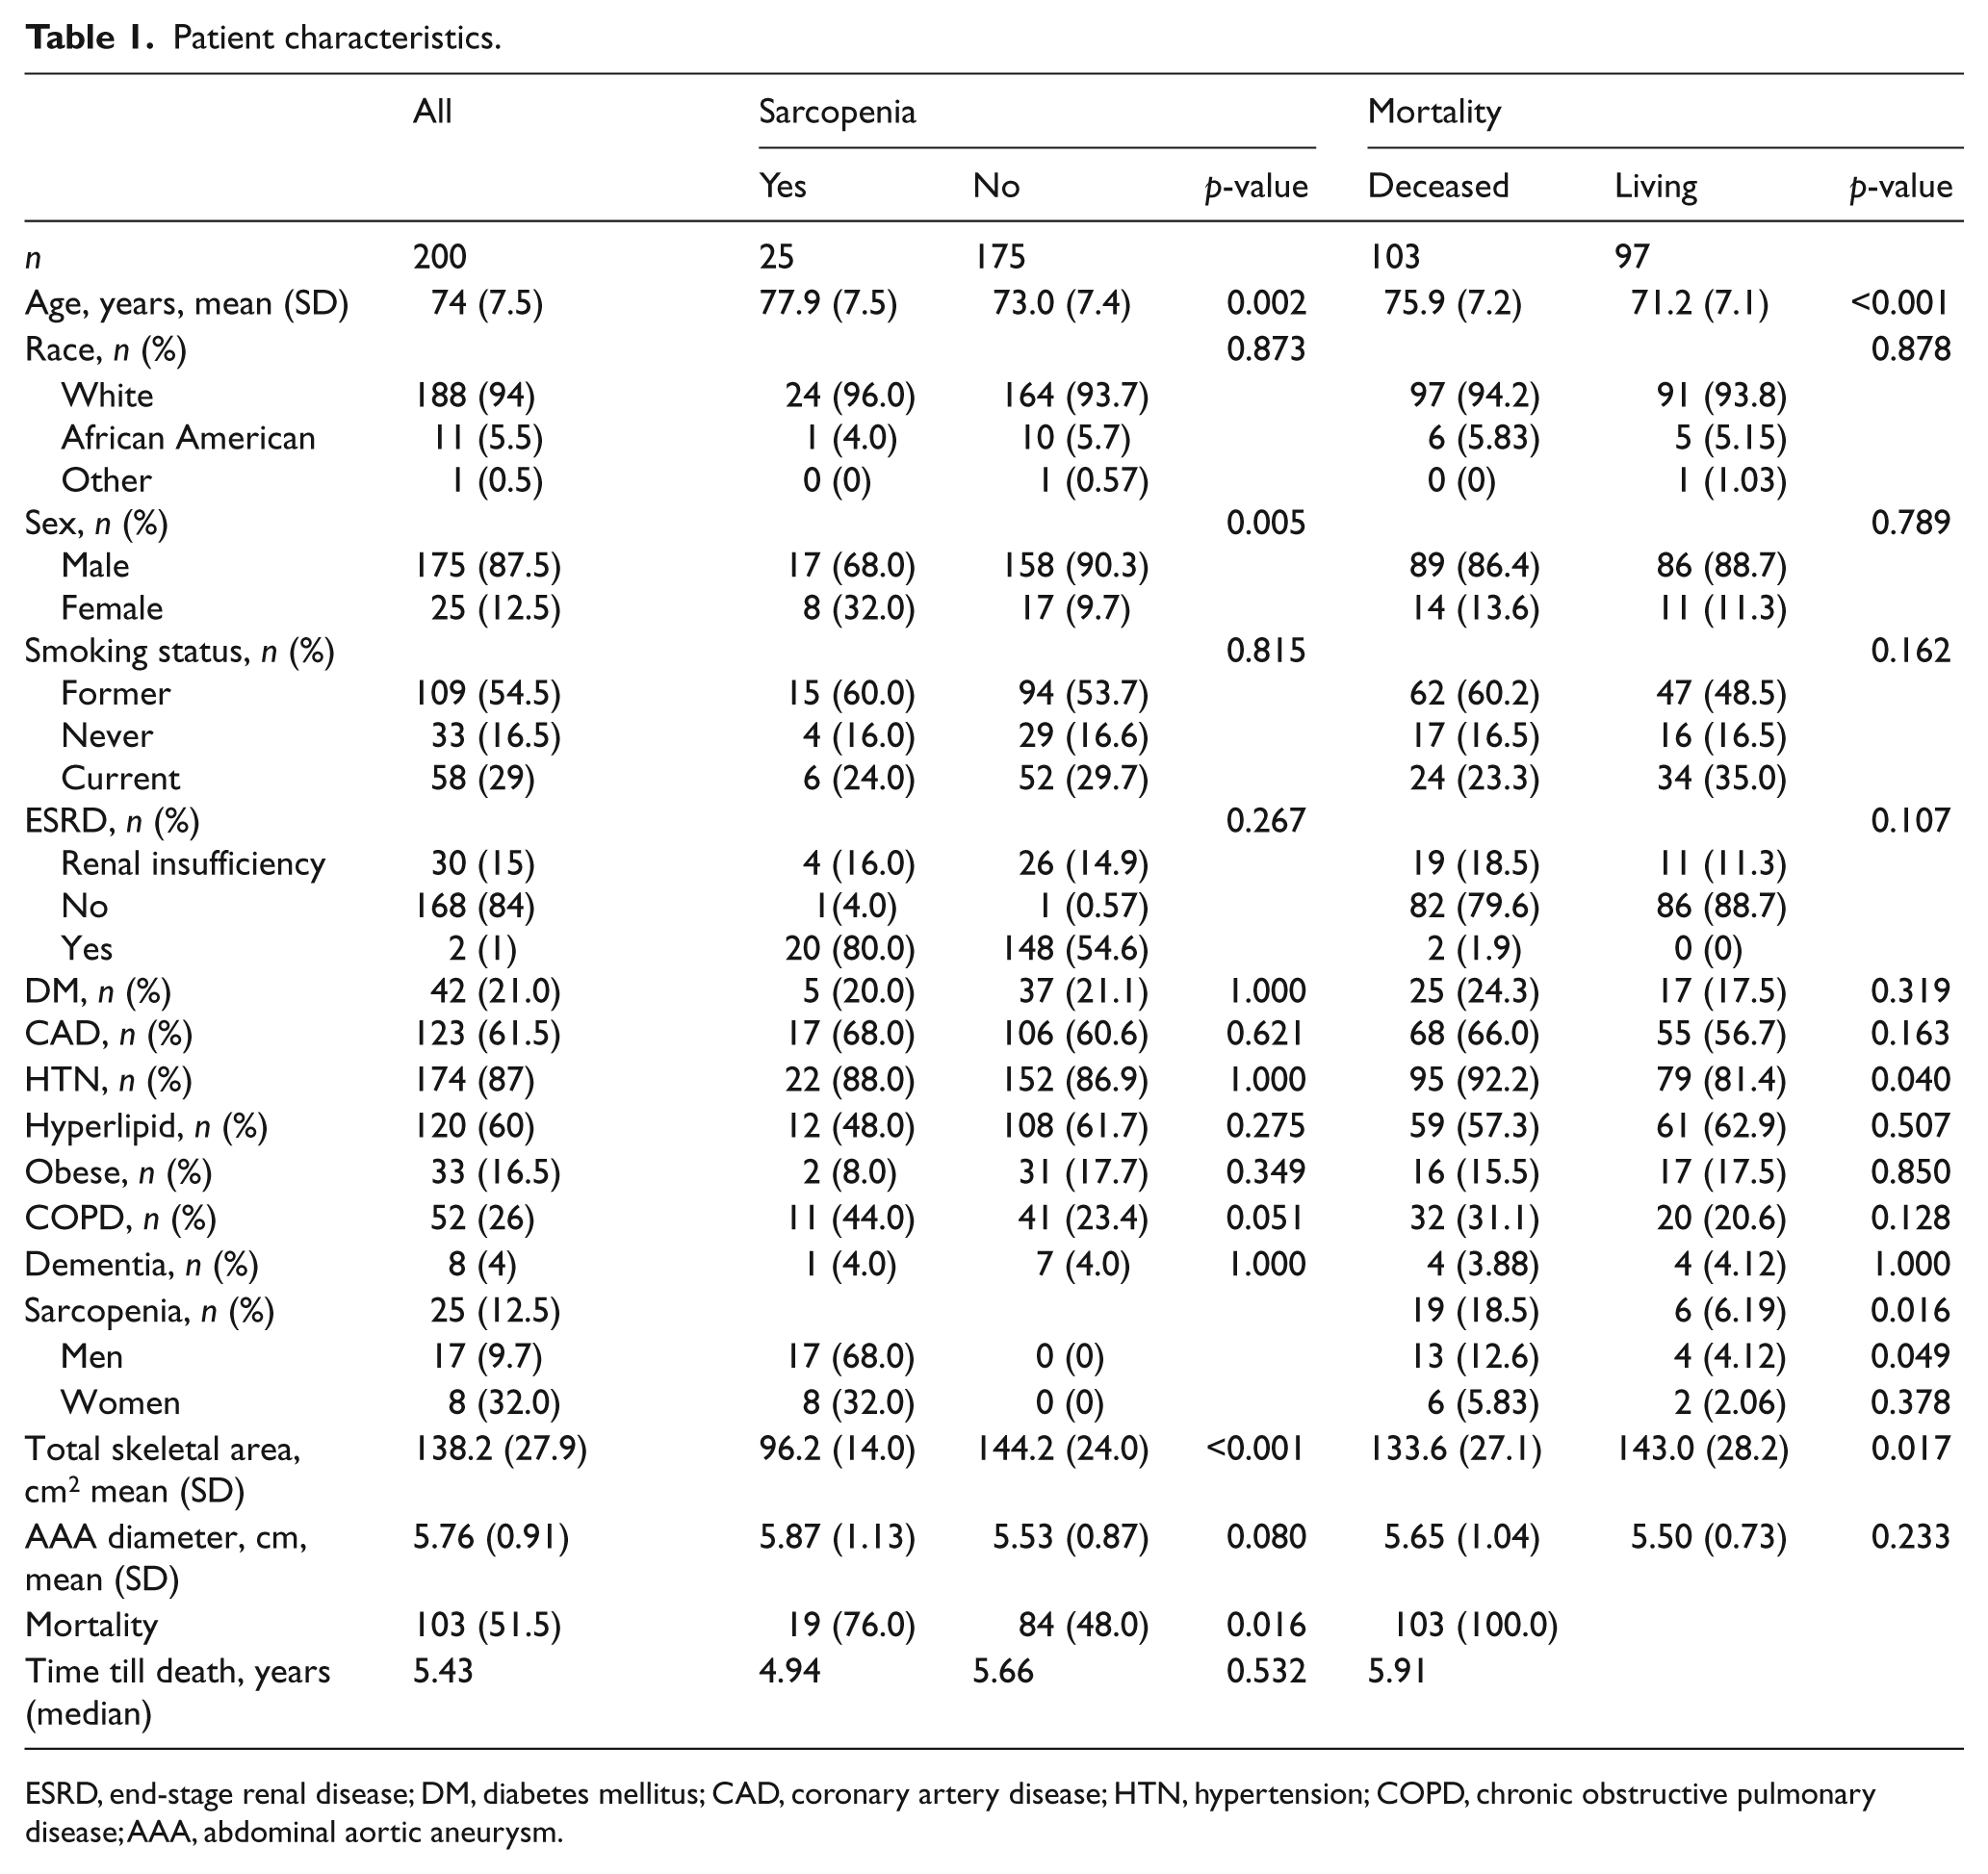
ESRD, end-stage renal disease; DM, diabetes mellitus; CAD, coronary artery disease; HTN, hypertension; COPD, chronic obstructive pulmonary disease; AAA, abdominal aortic aneurysm.
The mean skeletal muscle area for all patients was 138.2 ± 27.9 cm2. The majority of the EVAR sarcopenia patients were in the lowest quartile of total muscle mass. The breakdown of the quartile analysis on skeletal muscle mass is described in Table 2.
Total skeletal muscle area.
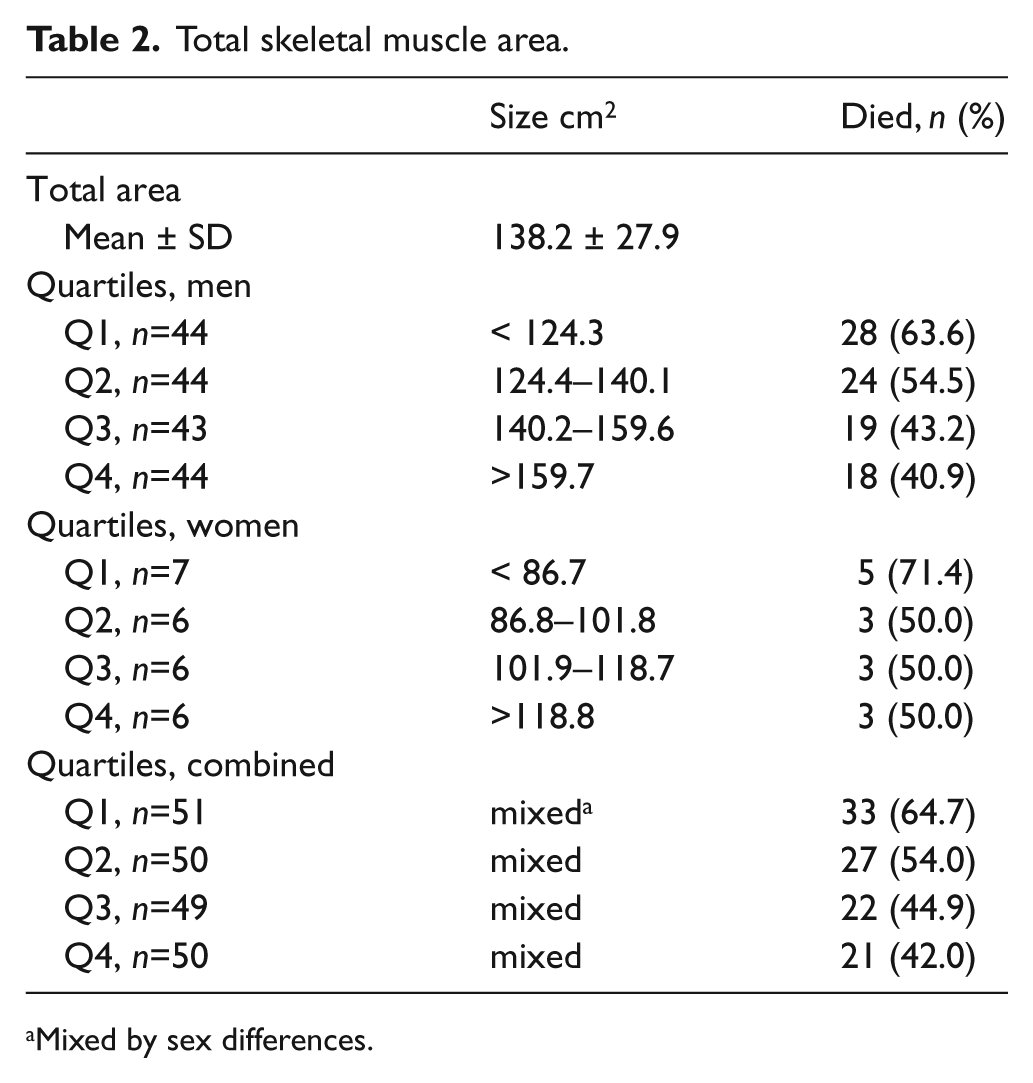
Mixed by sex differences.
From the 200 AAA patients, 25 had sarcopenia and 175 did not. Demographic differences between patients with sarcopenia and without are also described in Table 1. Patients with sarcopenia tended to be older (77.9 vs 73.0 years; p=0.002), female (32% vs 9.7%; p=0.005), and have a slightly larger aneurysm at the time of repair (5.87 cm vs 5.53 cm; p=0.080). Furthermore, patients with sarcopenia had a significantly higher mortality rate during follow-up than those without (76% vs 48%; p=0.016) (Figure 1). Figure 1 shows the Kaplan–Meier life table analysis survival probabilities. The survival curves start to separate between years 3 and 4, with a statistical difference that strengthens over time (log-rank test, p=0.016).
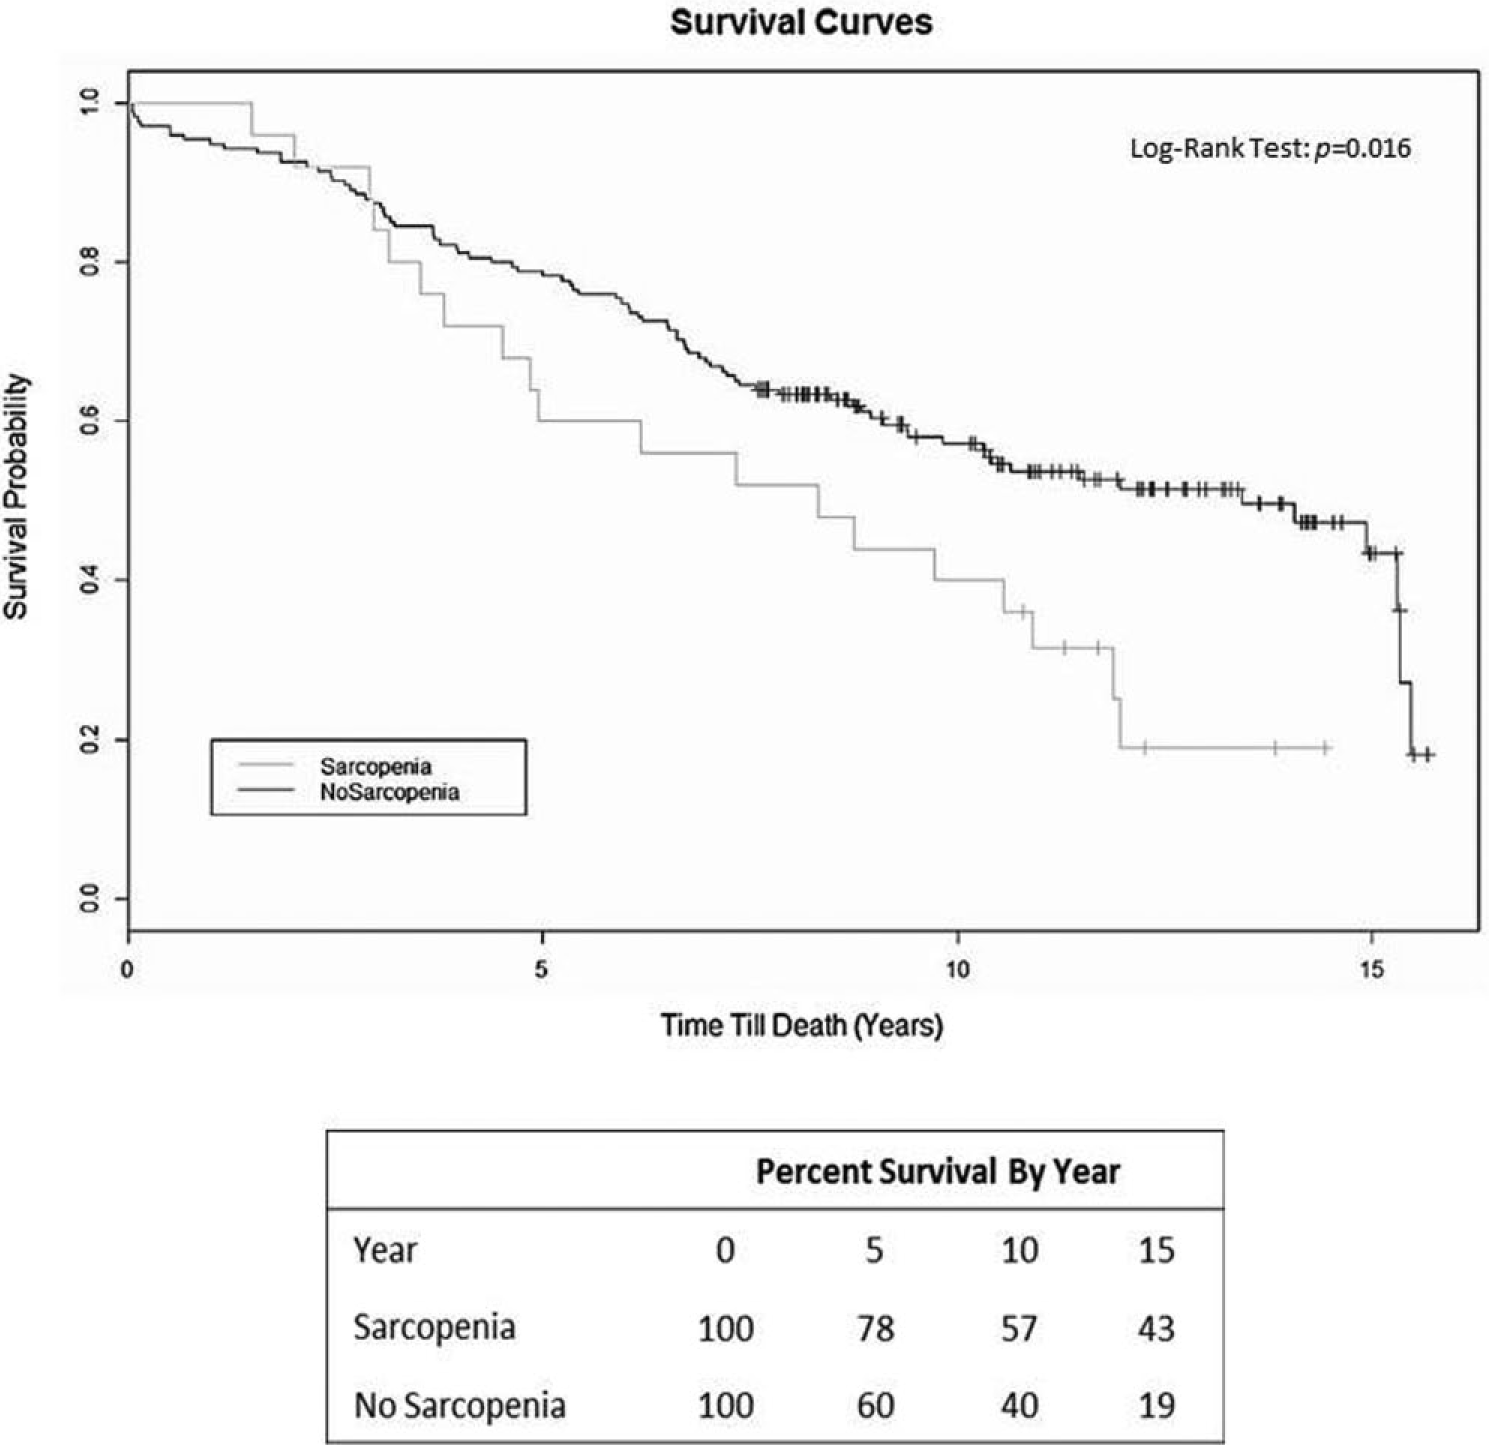
Survival curves of patients with and without sarcopenia who underwent EVAR.
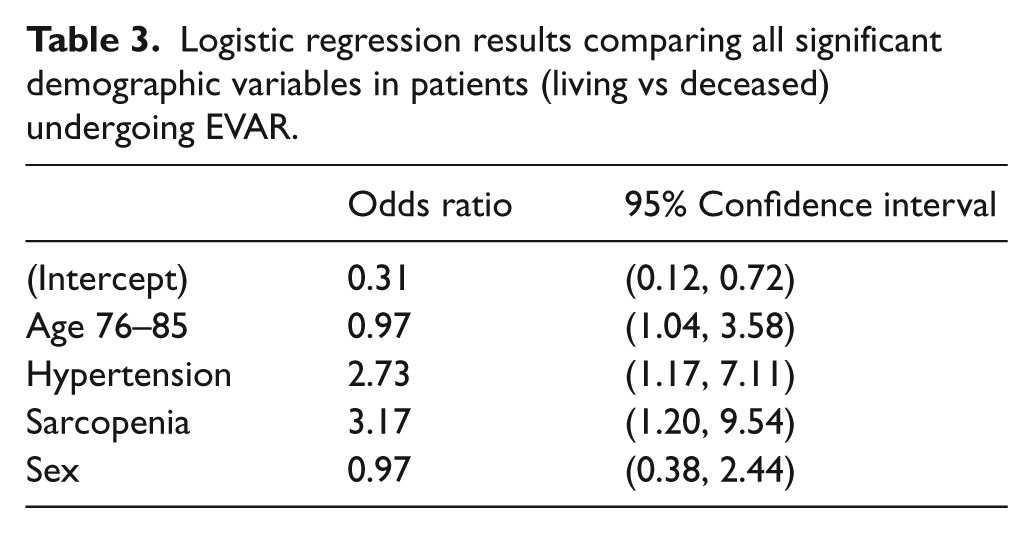
When comparing living with deceased patients, three important statistical demographic differences were seen in those who died: increased age at time of EVAR (75.9 vs 71.2 years; p<0.001), presence of hypertension (92.2% vs 81.4%; p=0.040), and presence of sarcopenia (18.5% vs 6.19%; p=0.016) (Table 1). Logistic regression analysis was used to compare these three significant variables; sex was also included in the analysis, as it was strongly associated with sarcopenia (Table 3). The odds ratios and 95% confidence intervals shown in Table 3 demonstrate the significance of sarcopenia (OR 3.17, 95% CI 1.20–9.54), hypertension (OR 2.73, 95% CI 1.17–7.11), and advanced age (76–85 years) (OR 0.97, 95% CI 1.04–3.58) on mortality following EVAR. Sex did not play a significant role in mortality, nor did it act as a confounding factor with the other three variables.
Logistic regression results comparing all significant demographic variables in patients (living vs deceased) undergoing EVAR.
Discussion
These data confirm sarcopenia as an independent predictor of long-term mortality in patients treated for AAA with EVAR. Although risk prediction models for elective aneurysm repair have been created, they primarily center on 30-day mortality, as opposed to long-term mortality (i.e. Glasgow aneurysm score, Leiden Score, Hardman Index).4–6 However, in 2013, the Vascular Surgical Group of New England (VSGNE) did identify four major and four minor risk factors for assessing long-term survival (5 years) following AAA repair. 7 Their major risk criteria included: unstable angina or recent myocardial infarction, age >80 years, oxygen-dependent COPD, and estimated glomerular filtration rate <30 ml/min/1.73 m2. The minor risk criteria included: age 75–79 years, prior myocardial infarction, stable angina, and not taking aspirin or statins. Based on these criteria, patients were evaluated and stratified as ‘low risk’ (no major risk factors, 1–2 minor risk factors), ‘medium risk’ (1 major, 1–3 minor), or ‘high risk’ (1–2 major, >3 minor). The VSGNE ‘high risk’ group showed a mortality rate of 43% at 5 years; this compares favorably to our group of EVAR patients with sarcopenia who had a 5-year mortality rate of 40%. These data suggest that preoperative risk assessment of long-term survival could potentially be simplified to measuring sarcopenia. Complex risk prediction models tend to lose calibration over time, so the simpler the model, the less recalibration is needed. 8
In our study, patients with sarcopenia had a significantly higher long-term mortality rate during follow up than those without (76% vs 48%; p=0.016). However, noticeable separation between the two survival curves in Figure 1 is not seen until year 4, with the gap continuing to increase over time. As future studies on other patient populations are conducted, longer follow-up (5+ years) may be necessary to accurately assess the long-term impact sarcopenia has on patient outcomes, specifically mortality. The measurement technique and cutoff values we used to determine and define sarcopenia were previously utilized in a study that evaluated mortality in patients with CLI. 2 The cutoff values for skeletal muscle mass (<114.0 cm2 for men and <89.8 cm2 for women) represent patients below the fifth percentile of the standard value in healthy adults. 3 We believe this is representative of our AAA population, as our 5-year survival rate in those without sarcopenia was 78.3%, compared to 77.5% in their CLI patients without sarcopenia (Figure 1). The sarcopenic CLI population had a lower 5-year survival rate (23.5%) than our AAA sarcopenic population (40%). Sarcopenia is a consistent marker of reduced survival, particularly in patients with CLI.
A similar measurement technique was used by Lee et al. in a study that evaluated 262 patients who underwent open AAA repair. 9 They measured psoas muscle area on CT at the L4 vertebra, as opposed to L3 in our study. At the 2.3-year mean follow-up, 55 (21%) of their patients had died. As psoas muscle area decreased, mortality increased; this relationship was logarithmic and non-linear. Lee et al. used the word ‘frailty’ to describe this patient-centered characteristic and suggested that the measurement of psoas muscle volume was an excellent predictor of mortality. Our study builds upon these data by measuring more muscle groups to define a threshold of low muscle mass. By defining sarcopenia to be a natural aspect of aging that involves the reduction of skeletal muscle tissue, mass, and function, we feel this is a more specific term than frailty.
A BMI greater than 30 has been shown to increase AAA mortality risk. Using the National Surgical Quality Improvement Program database (NSQIP), Giles et al. showed a twofold increase in mortality in the morbidly obese compared to the non-obese. 10 We analyzed total muscle area in quartiles and saw no relationship to mortality as long as patients were ‘above the threshold’ for sarcopenia (Table 2). With that said, the morbidly obese patient may also be sarcopenic, as BMI is not equivalent to muscle mass and should be measured and analyzed separately. 11
In our study, women with AAA were more likely than men to have sarcopenia (32.0% versus 9.7%; p=0.005). The literature suggests that sex does not play a significant role in long-term survival following aneurysm repair; however, sarcopenia was not assessed in these studies.12,13 Although, in our study, the number of women was low (n=25), sarcopenia may be helpful in assessing risk based on sex. Further investigation using a larger population of women would strengthen, or refute, the association.
Lim et al. provided a contemporary study to the EVAR 2 Trial by evaluating high-risk EVAR patients.14,15 Using a backward stepwise logistic regression analysis, they identified five prognostic indicators for post-EVAR death; these included: age, chronic kidney disease stages 4 and 5, congestive heart failure, home oxygen use, and current cancer therapy. Mortality at 4 years in their trial was 35%, in the EVAR 2 it was 36%, and in our sarcopenic patients it was 28% (Figure 1).
Elderly patients (>80 years) are more frequently being treated with EVAR than open repair since the perioperative risk is lower.16,17 Our data showed that patients >76 years of age were at an approximately twofold risk for mortality (Table 3). However, when we modeled multiple variations of age, no arrangement of age with sarcopenia was found to significantly impact mortality. This conclusion appears to confound logic, as both age and sarcopenia were determined to be independent risk factors (Table 3). However, this unexpected outcome is likely due to the combination of our small study population (only 12.5% of patients had sarcopenia) and the low age difference (4.9 years) between those with sarcopenia and without. A larger study would likely resolve this Type II error and provide an effect strong enough to reach statistical significance.
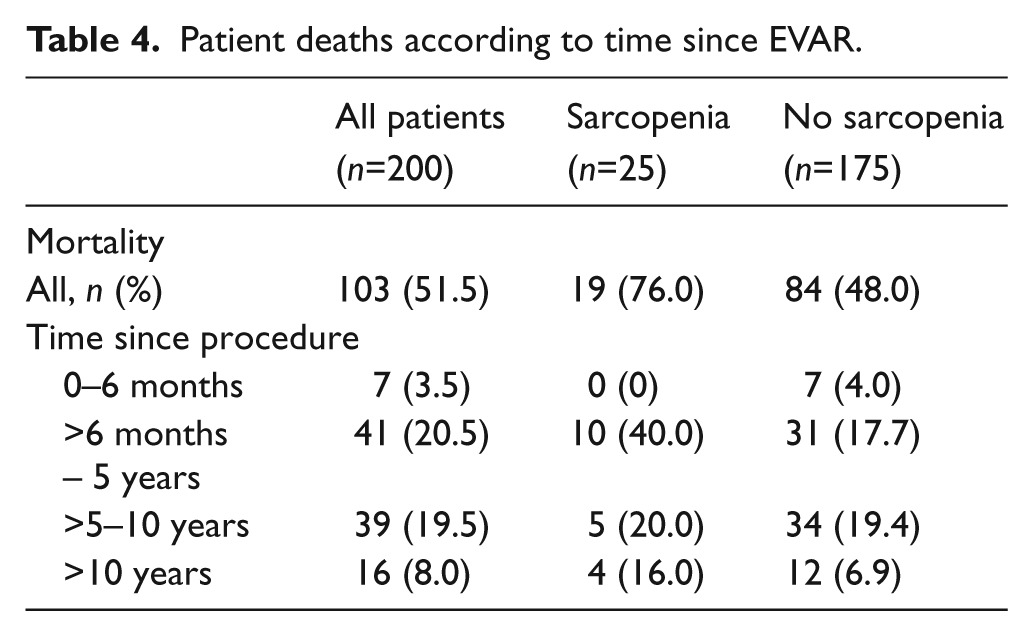
In this study, the median follow up until death or the end of the study was 8.4 years, with an interquartile range of 5.3–11.7 years. Our short-term mortality rate (3.5% at >6 months), as well as our 5-year mortality rate (20.5%), were comparable to the EVAR population reported in the EVAR 1 Trial (4.1% at 6 months, 20.8% at 4 years). 18 To our knowledge, this paper represents the longest follow up, in terms of mortality, on AAA patients undergoing EVAR in the literature (Table 4).
Patient deaths according to time since EVAR.
Limitations
This study has all the inherent limitations of a retrospective study performed from a prospective database. The entire AAA population was not studied as most open AAA patients fall out of follow-up and do not frequently require CT scans at follow-up. However, considering we were focusing on the long-term mortality and not perioperative events, those who returned for their annual office visits comprised the study population.
Lost to follow up can be a significant limitation in any retrospective study. We had previously reported on survival in EVAR patients who participated in a clinical trial (mandated follow up) as compared to those treated outside of a trial (real-world follow-up). The long-term mortality (5 years) was remarkably consistent between these two patient populations, with a mortality rate of 36–39%. 19 This compares quite favorably to our overall study population where we noted a 40% mortality rate at 5 years. This suggests that a sensitivity analysis on those lost to follow-up is unnecessary.
Women and minorities are underrepresented in this study population, which makes the data less generalizable. We did not measure the use of aspirin or statins in our patients, which may alter long-term outcomes. Lastly, acquiring archived CT scan images performed prior to 2004 was challenging; this represented a major limitation to evaluating all EVAR patients in this study.
Conclusion
The presence of sarcopenia on a CT scan is an important, patient-specific, risk factor for long-term mortality in AAA patients treated with EVAR. Pending further study, these data suggest that sarcopenia may aid in the pre-procedural long-term survival assessment of patients undergoing EVAR.
Footnotes
Declaration of conflicting interests
The authors declared no potential conflicts of interest with respect to the research, authorship, and/or publication of this article.
Funding
The authors received no financial support for the research, authorship, and/or publication of this article.