
Abstract
Whether circulating biomarker levels increase shortly before an ischemic heart disease (IHD) event is unknown. We studied whether levels of D-dimer, C-reactive protein (CRP), and serum amyloid A (SAA) are higher within 2 months of an IHD event compared to time periods more than 2 months before the IHD event. We assembled 595 participants with peripheral artery disease (PAD) and followed them for up to 3 years. Blood samples were obtained every 2 months. The primary outcome was IHD events: myocardial infarctions, unstable angina, or IHD death. We used a nested case–control design. Fifty participants (cases) had events and were each matched by age, sex, duration in the study, and number of blood draws to two controls without events. Among cases, the mean D-dimer value of 1.105 obtained within 2 months of the event was higher than values obtained 10 months (0.68 mg/L, p<0.001), 12 months (0.71 mg/L, p=0.001), 16 months (0.65 mg/L, p=0.008), 20 months (p=0.032), 22 months (p=0.033), 26 months (p=0.038), and 32 months (p=0.04) before the event. Compared to controls, median D-dimer levels in cases were higher 4 months (p=0.017), 6 months (p=0.005), and 8 months (p=0.028) before the event. Values of CRP and SAA obtained within two months of an IHD event not consistently higher than values obtained during the prior months. In PAD participants with an IHD event, D-dimer was higher within 2 months of the event, compared to most values obtained 10 to 32 months previously. D-dimer was also higher in cases as compared to controls during most visits within 8 months of the IHD event.
Keywords
Introduction
Lower-extremity peripheral artery disease (PAD) affects more than eight million people in the United States and more than 200 million people worldwide.1,2 Compared to those without PAD, people with PAD have a two to threefold increased rate of ischemic heart disease (IHD) events, even after adjusting for atherosclerotic disease risk factors.3–5 People with PAD have higher circulating levels of inflammatory and hemostatic biomarkers compared to those without PAD.6,7 Pre-clinical studies suggest that surges in circulating inflammatory and hemostatic biomarkers may trigger plaque rupture and coronary thrombosis, resulting in IHD events.8–10 However, these associations are not clearly established in humans.
We conducted the Biomarker Risk Assessment in Vulnerable Outpatients (BRAVO) Study to determine whether circulating levels of inflammatory and hemostatic biomarkers are higher within the 2-month period preceding an acute IHD event compared to time periods more than 2 months before an IHD event. We determined (a) whether among PAD participants who experience an IHD event during follow-up, biomarker levels measured within 2 months prior to an IHD event are higher than levels more than 2 months before an event and (b) whether participants who experience an IHD event (cases) have higher biomarker levels during the months leading up to the event than participants without an IHD event (controls). To our knowledge, the BRAVO Study is the only cohort to measure biomarker levels at frequent intervals (every 2 months) in a high-risk population during time periods leading up to an IHD event, to determine whether biomarker levels increase during the weeks and months prior to IHD events.
Methods
Overview
Methods of the BRAVO Study have been reported. 11 We recruited a cohort of people with PAD and followed them prospectively to identify new IHD events. We obtained blood samples at baseline and every 2 months during follow-up. The Institutional Review Board at Northwestern University and all participating sites approved the protocol. Participants provided written, informed consent. Enrollment occurred between September 2009 and September 2012. Participants were followed through January 2013. We used a case–control design to determine whether participants who experienced a new IHD event during follow-up (cases) had greater increases in biomarkers during the months leading up to the event, compared to matched controls.
Recruitment
Participants were identified from lists of consecutive men and women diagnosed with PAD in non-invasive vascular laboratories or vascular surgery practices from six medical centers in Chicago. Potential participants received up to four recruitment letters. Potential participants who did not respond to recruitment mailings were telephoned and invited to participate.
Inclusion and exclusion criteria
The inclusion criterion was an ankle–brachial index (ABI) < 0.90. Individuals with an ABI ⩾ 0.90 at their baseline visit with documentation of PAD from an accredited non-invasive vascular laboratory or prior lower-extremity revascularization were also eligible. Exclusion criteria have been reported 11 and are summarized briefly here. Potential participants who refused regular blood draws, had an IHD or cerebrovascular event within the prior 6 months, with a history of inflammatory arthritis, with a recent cancer diagnosis or recent unintentional weight loss were excluded. People unable to return for follow-up testing, with significant communication difficulty or cognitive impairment, and those living > 40 miles from the medical center who refused regular visits to the medical center were excluded. Potential participants with heart transplant surgery, recent major surgery, and those enrolled in clinical trials were excluded.
Baseline and follow-up data collection
Baseline measures included the ABI, medical history questionnaires, phlebotomy, a resting 12-lead electrocardiogram (ECG), and height and weight for calculation of body mass index (BMI). Participants were asked to return every 2 months. At each follow-up, participants underwent blood collection, an ECG, and questionnaire administration. Home visits were made to those unwilling or unable to attend a follow-up visit. If a home visit was refused, participants were telephoned to obtain information about hospitalizations.
Measures
Baseline comorbidities, smoking, and body mass index
Baseline comorbidities were ascertained and confirmed using patient-report, medical record review, medication use, and results of a primary care physician questionnaire. These data were entered into comorbidity algorithms, developed and validated by the Women’s Health and Aging Study, 12 to ascertain and confirm baseline comorbidities. Smoking history was obtained by standardized questionnaire administration. BMI was calculated based on measured height and weight at the baseline study visit. Participants brought all medication bottles to their baseline visit. Medications were recorded for all participants.
Questionnaire administration
At each follow-up, questionnaires were administered to identify hospitalizations since the last study visit. Medical records were ordered for new hospitalizations reported at each follow-up visit.
Ankle–brachial index
A hand-held Doppler probe (Nicolet Vascular Pocket Dop II; Golden, CO, USA) was used to measure systolic blood pressures after the participant rested supine for 5 minutes. Measured pressures were: right brachial, dorsalis pedis, and posterior tibial arteries; left dorsalis pedis, posterior tibial, and brachial arteries. Each pressure was measured twice. The ABI was calculated by dividing average systolic pressures in each leg by the average of the four brachial pressures.13,14
Phlebotomy
Blood samples were obtained between 07:00 and 12:00 whenever possible. Participants were instructed to fast before blood collection. Specimens were immediately iced and transported to the laboratory for processing and storage within 90 minutes of collection.
Electrocardiogram
We performed ECGs at baseline and each follow-up visit to identify new silent myocardial infarctions (MIs).15–17 We used methods and equipment (General Electric’s MAC1200 portable ECG units; Little Chalfont, Buckinghamshire, UK) from the Atherosclerotic Risk in Communities (ARIC) and Multi-Ethnic Study of Atherosclerosis (MESA) cohorts.15,18 Methods from the Cardiovascular Health Study were used to diagnose new silent MIs. 19
Biomarkers for study
Biomarker measurement
All biomarkers were measured simultaneously at the completion of clinical data collection. Serum amyloid A (SAA) and C-reactive protein (CRP) were measured using an immunotechnique on the Behring BN II analyzer (Dade Behring, Wilmington, DE, USA). The coefficients of variation percent from 20 paired samples for CRP and SAA were 4.22 and 3.49, respectively. The Asserachrom D-Di kit (STA-Liatest D-Di kit; Diagnostica Stago, Parsippany, NJ, USA) was used to measure D-dimer with an immune-turbidimetric assay. The coefficient of variation percent from 20 paired samples for D-dimer was 11.80.
Cholesterol Measurement
Low-density lipoprotein cholesterol (LDL-C) was measured by a homogenous direct method from Roche Diagnostics (Indianapolis, IN, USA). 20 High-density lipoprotein cholesterol (HDL-C) was measured using a direct enzymatic colorimetric assay. 21
Primary outcome
The primary outcome was combined fatal and non-fatal IHD events. Non-fatal IHD events were defined as acute MI, hospitalizations for unstable angina, and new ECG findings consistent with MI. Study adjudicators reviewed any medical records that mentioned angina or chest pain, reported elevated coronary enzymes, or had a discharge diagnosis consistent with angina or MI. When there was disagreement between two primary adjudicators, a third adjudicator reviewed the case and the outcome was determined by discussion and consensus.
Adjudication of acute coronary syndrome events
Criteria for MI were derived from the ARIC and MESA studies.15,18 An acute MI required two of the following three criteria: (i) chest pain, (ii) an abnormal ECG consistent with an MI (ST segment elevation, new left bundle branch block, new Q waves), and (iii) abnormal cardiac enzymes (troponin more than two times the upper limit of normal).
We used criteria from the MESA and LIFE studies18,22 to adjudicate unstable angina. Unstable angina was defined as non-elective admission to the hospital for acute angina that is not definite or probable MI. Clinical symptoms were required. Additional criteria were: (a) treatment with nitrates, heparin, or beta-blockers; (b) coronary artery bypass graft surgery or other coronary revascularization during the hospital stay; (c) ⩾ 70% obstruction of any coronary artery by angiography during the hospital stay; and (d) an ECG showing horizontal or down-sloping ST depression or abnormal ST elevation > 1 mm and these findings were present only during chest pain.
IHD death consisted of definite fatal MI, definite coronary heart disease death, and possible coronary heart disease death. 18 All three types of death required the absence of known non-ischemic or non-cardiac causes of death.
In addition, participants with new Q waves on their ECG during follow-up were classified as an IHD event. Two board-certified cardiologists reviewed each ECG to identify new Q waves. Discrepancies were resolved by discussion.
Definitions of cases and controls
Cases were participants who develop an acute IHD event during follow-up. Two control participants were randomly selected for each case from participants without an IHD event as of the date of the IHD event for the corresponding case. Compared to case participants, control participants met the following criteria: (a) they were within 5 years of age of the case; (b) they were the same sex as the case; (c) the availability of stored blood samples at each visit for the control participant matched the availability of stored blood samples for the case participant; and (d) they were enrolled in the study for at least as long as the case participant. We selected age and sex as criteria for control participants in order to minimize age and sex-related differences in biomarker levels when comparing cases and controls. Furthermore, age and sex are strong predictors of IHD events. We selected duration of study enrollment and number of blood draws leading up to the IHD event as matching criteria in order to ensure similar follow-up between cases and controls.
Power calculations
Based on the overall sample size of the BRAVO cohort, we anticipated that 53 IHD events would occur during follow-up. With a sample size of 53 cases, we had 80% power to detect differences ranging from 0.43 to 0.58 standard deviations (SD) for comparisons between the final biomarker measure prior to an IHD and previous biomarker measures during the year leading up to the IHD event. With the sample sizes of 53 cases and 106 controls, we had 80% power to detect a difference of 0.50 SD of the blood marker levels between the cases and controls at each time point leading up to an IHD event.
Statistical analyses
Baseline characteristics of participants who experienced IHD events during follow-up (cases) and matched controls were compared using t-tests for continuous measures and chi-squared tests for discrete measures. For participants experiencing more than one IHD event, only the first IHD events were included in analyses. Case participants were censored from analyses after their first IHD event.
Because of right skewness of distribution of the biomarker levels, we summarized the biomarker levels at each visit by median and interquartile, and applied log-transformation to the biomarker levels in subsequent analyses. For each biomarker, we determined whether among participants who experienced an IHD event, biomarker levels obtained at the final visit prior to the event were significantly higher than previous biomarker levels using paired t-tests to compare the log-transformed biomarker level at the final measurement prior to the event versus measures obtained 4 months prior to the event, 6 months prior to the event, and 8 months prior to the event, and so on, respectively. The a priori primary independent variable of interest was the difference in biomarker level 4 months prior to the event versus the biomarker level 2 months prior to the event. Next, we determined whether levels of the biomarkers at each time point leading up to the IHD event were higher in case participants, compared to controls, using generalized estimating equation (GEE) regression analyses with log-transformed biomarker levels for the case participants and the two matched controls as correlated responses within the same cluster and the binary (case versus control) indicator as the independent variable of interest to compare the biomarker levels between cases and controls. Analyses were repeated adjusting for potential confounders. Because of the limited number of participants in some comparisons, we could adjust for only six variables. Because the independent variable of interest was biomarker change, we adjusted for baseline biomarkers. Remaining covariates were selected for inclusion in the adjusted analyses if the p-value for the comparison between the cases and controls was < 0.15. We performed exploratory analyses for each biomarker in the subset of participants who had complete data for levels of D-dimer, CRP, and SAA obtained at each visit leading up to an IHD event. SAS® version 9.4 (SAS Institute Inc., Cary, NC, USA) was used for analyses.
Results
Of 950 participants with a scheduled baseline visit, 131 met the exclusion criteria and 224 did not arrive for their appointments or refused participation after scheduling their baseline visit. A total of 595 participants were enrolled. Mean follow-up was 18.7±9.8 months (range: 0 to 40).
Of the 595 participants enrolled, 50 (8.4%) had 75 IHD events during follow-up. The first IHD events experienced by these participants were eight cardiac deaths, 24 hospitalizations for acute MI, 15 hospitalizations for unstable angina, one hospitalization for a resuscitated cardiac arrest and two silent MIs, based on new Q waves on the ECG during follow-up. There were no missing data for adjudicated events.
One hundred control participants were matched by age, sex, length of follow-up, and number of blood specimens to the 50 case participants. These cases and matched controls corresponded to 930 total potential visits (including 310 study visits for cases and 620 study visits for controls). Of the 150 case and control participants, 10 (6.7%) dropped out before completing follow-up. A total of 36 participants (17 case participants and 19 control participants) missed one or more D-dimer blood draws for a total of 65 missing values for D-dimer (40 missed values for cases and 25 missed values for controls). A total of 30 participants (16 cases and 14 controls) missed one or more CRP and SAA blood draws for a total of 56 missing values for CRP and SAA, respectively (38 missing values for cases and 18 missing values for controls).
Characteristics of case participants, control participants, and remaining participants are shown in Table 1. Case participants had a higher prevalence of angina, MI, and hypertension compared to controls.
Characteristics of the BRAVO Study peripheral artery disease participants at the baseline visit.
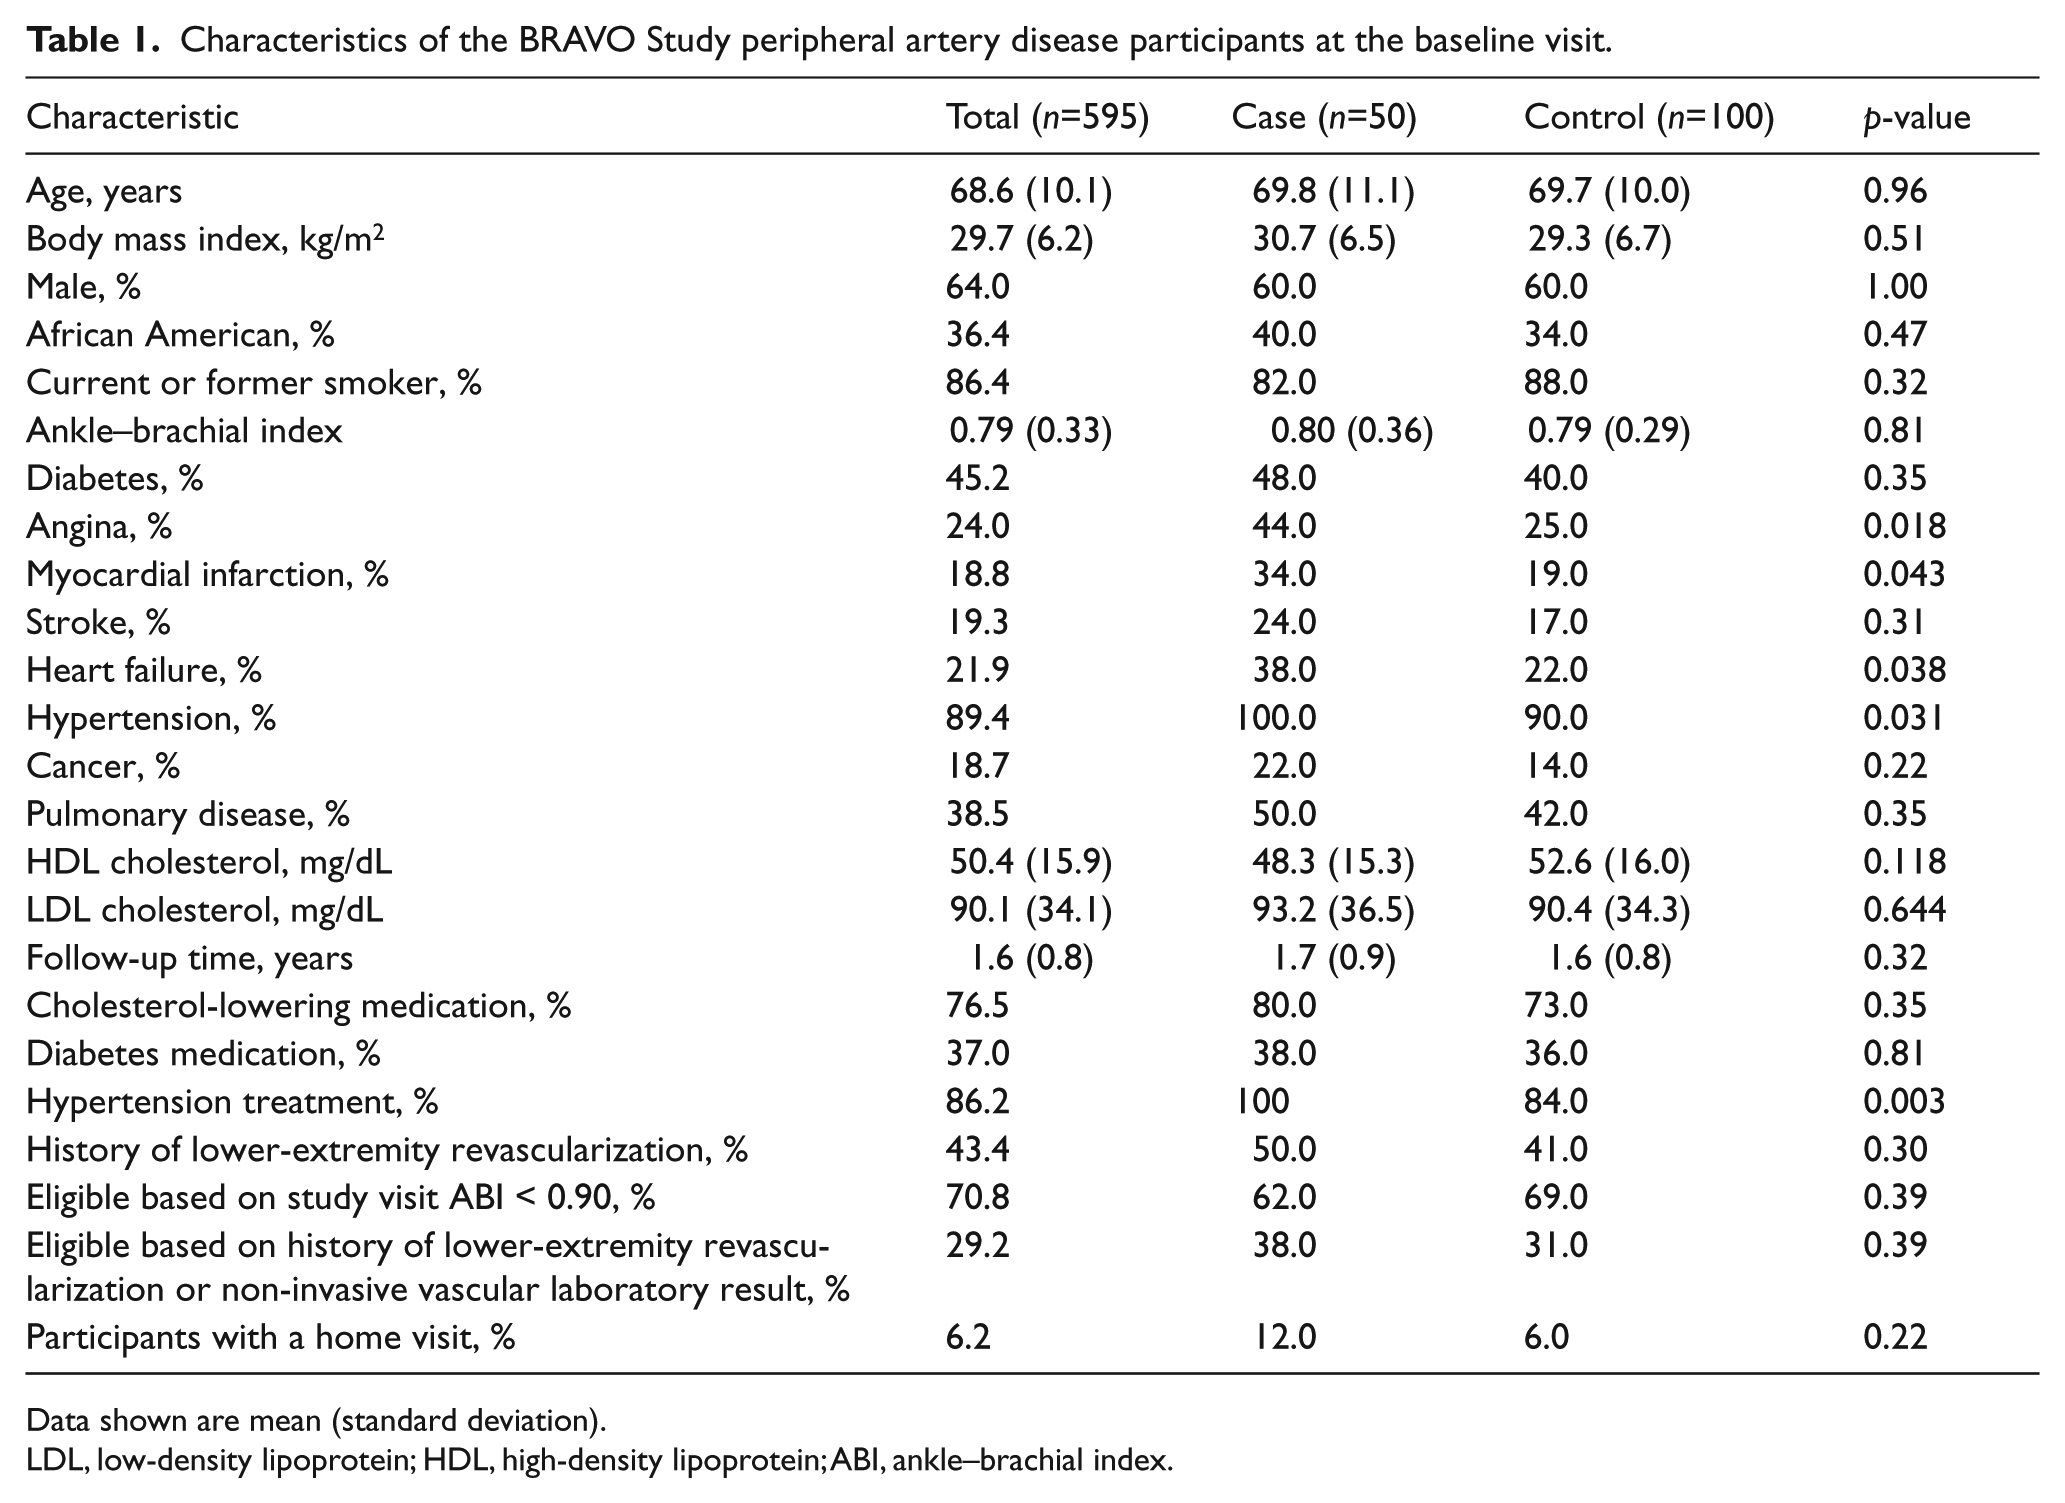
Data shown are mean (standard deviation).
LDL, low-density lipoprotein; HDL, high-density lipoprotein; ABI, ankle–brachial index.
Figure 1 shows the median values of each biomarker obtained at visits leading up to an IHD event in the 36 PAD participants who had at least two biomarker measures prior to their IHD event. The following pairwise comparisons are limited to participants with biomarker values within 2 months of the IHD event. The D-dimer value obtained within 2 months of the IHD event was higher than D-dimer values obtained 10 months (p<0.001), 12 months (p=0.001), 16 months (p=0.008), 20 months (p=0.032), 22 months (p=0.033), 26 months (p=0.038), and 32 months (p=0.04) before the IHD event. The CRP and SAA values obtained within 2 months of the IHD event were significantly higher than CRP and SAA values obtained 10 months prior to the IHD event (p=0.01 and p=0.009, respectively) (Figure 1). Results were not substantially changed when analyses were repeated with imputation for missing data (data not shown).
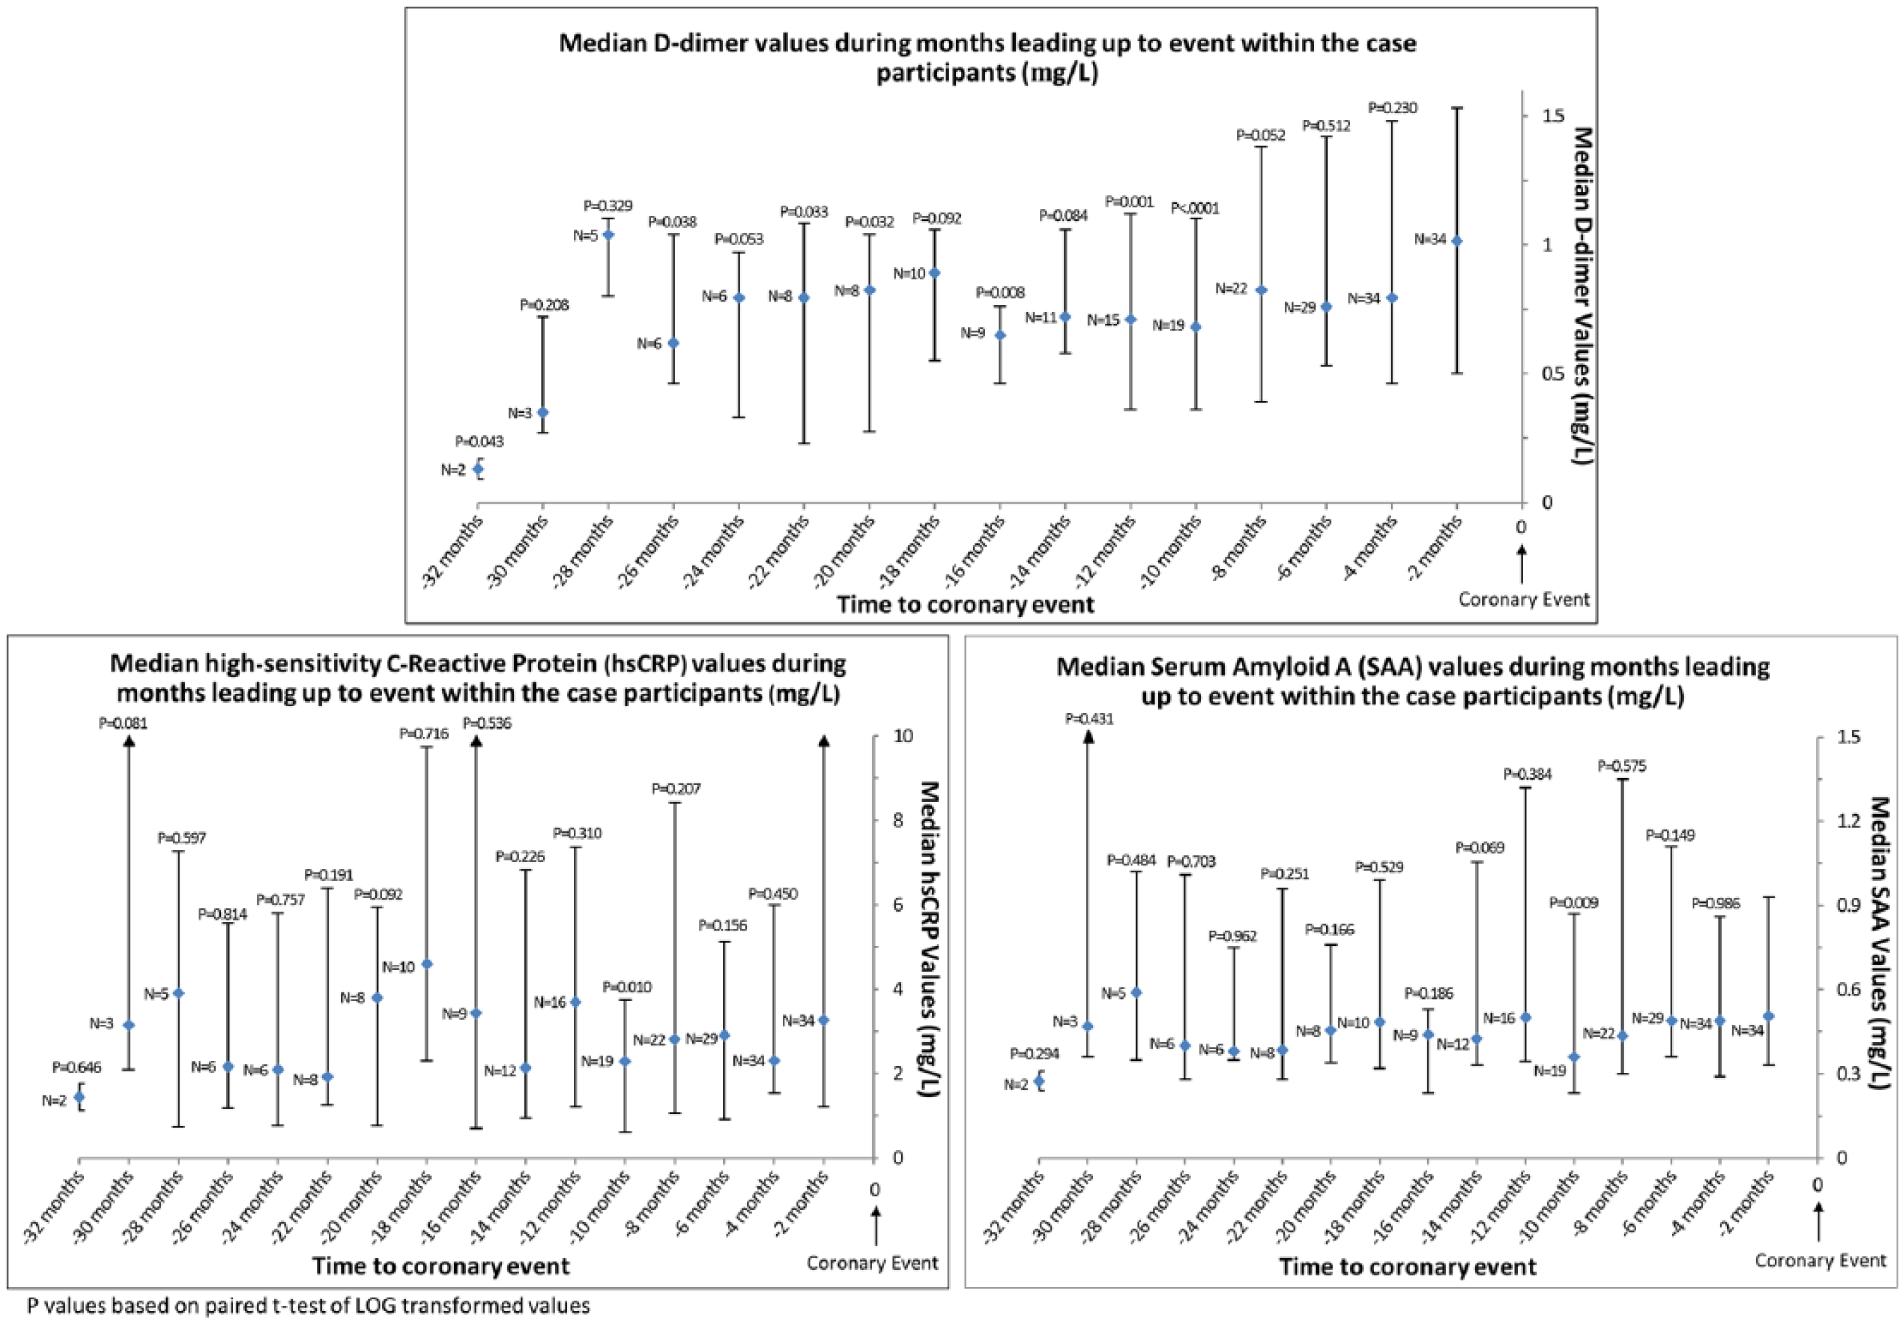
Median biomarker values among all cases during months leading up to an ischemic heart disease event. The sample size is limited to participants who had at least two blood draws before death.
Table 1S compares median D-dimer values between all 50 cases and the 100 matched controls at specific time points during the months leading up to an IHD event. As compared to controls, median D-dimer levels among cases were higher at visits occurring 4 months (p=0.017), 6 months (p=0.005), and 8 months (p=0.028) prior to the IHD event. After adjustment for HDL cholesterol, baseline biomarker value, and history of MI, heart failure, angina, and hypertension, these associations were not substantially changed. However, in these adjusted analyses, biomarker values were no longer significantly different between case and control participants at the 8-month follow-up and the case versus control difference became statistically significant at the 16 and 18-month follow-up visits.
As compared to controls, median CRP values among cases were higher at the visit that occurred 6 months (p=0.040), 8 months (p=0.046), and 18 months (p=0.003) before the IHD event (Table 2S). As compared to controls, median SAA values among cases were higher at the visit that occurred 2 months (p=0.049), 4 months (p=0.041), 6 months (p=0.009), 8 months (p=0.003), 12 months (p<0.001), and 18 months (p<0.001) before the IHD event (Table 3S). Results for both CRP and SAA were attenuated and remained statistically significant only for the 18-month time point after adjustment for HDL cholesterol, baseline biomarker value, and history of MI, heart failure, angina, and hypertension. Results were not substantially changed when analyses were repeated with imputation for missing data (data not shown).
In exploratory analyses, we restricted analyses to participants who had D-dimer levels measured at every visit during the 10 months prior to an IHD event. This method allowed comparison of changes in D-dimer levels over time within the same cohort of participants for each time point. In analyses of case participants alone, the D-dimer value obtained within 2 months of the IHD event (i.e. the final D-dimer measurement) was higher than the value obtained at each visit leading up to the final D-dimer measurement before the IHD event (Figure 2). In comparisons of cases versus controls, D-dimer values were significantly higher in case than in control participants at each visit prior to the IHD event (Figure 2). When these analyses were repeated for CRP, among case participants, levels of CRP right before the IHD were higher than the CRP value obtained 6 months before the IHD event (p=0.032) and 10 months before the IHD event (p=0.023) (Figure 3A). Among case and control participants, CRP values were not different at any time point prior to the IHD event (Figure 3A). When these analyses were repeated for SAA, among case participants, levels of SAA within 2 months before the IHD event were higher than the SAA value measured 10 months before the IHD event (p=0.020) (Figure 3B). Among case and control participants, SAA values were higher among cases versus controls only at the time point 2 months prior to the IHD event (Figure 3B).
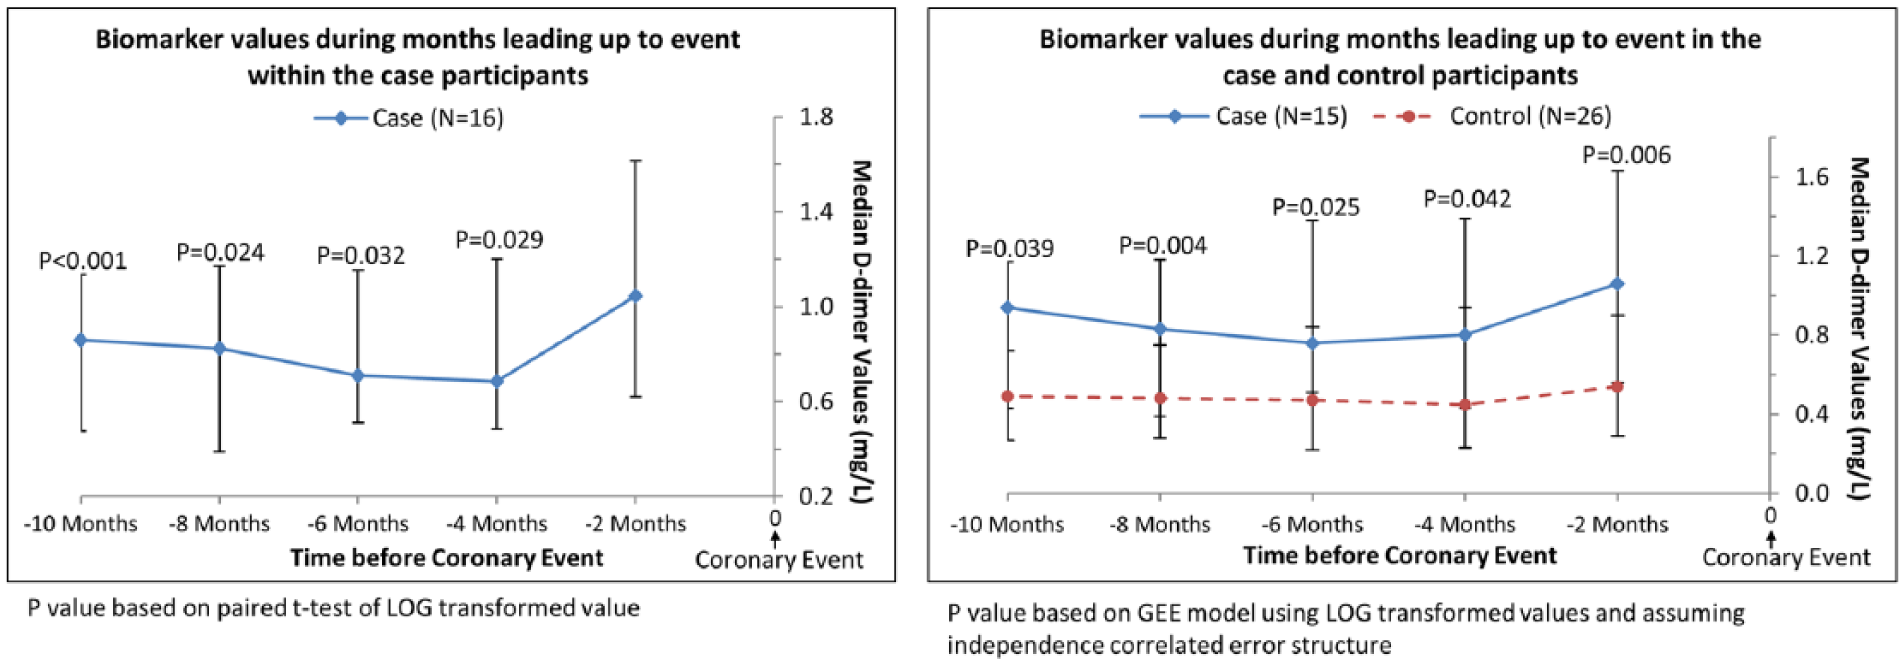
Median D-dimer values in the subset of cases with complete biomarker data prior to experiencing an ischemic heart disease event.
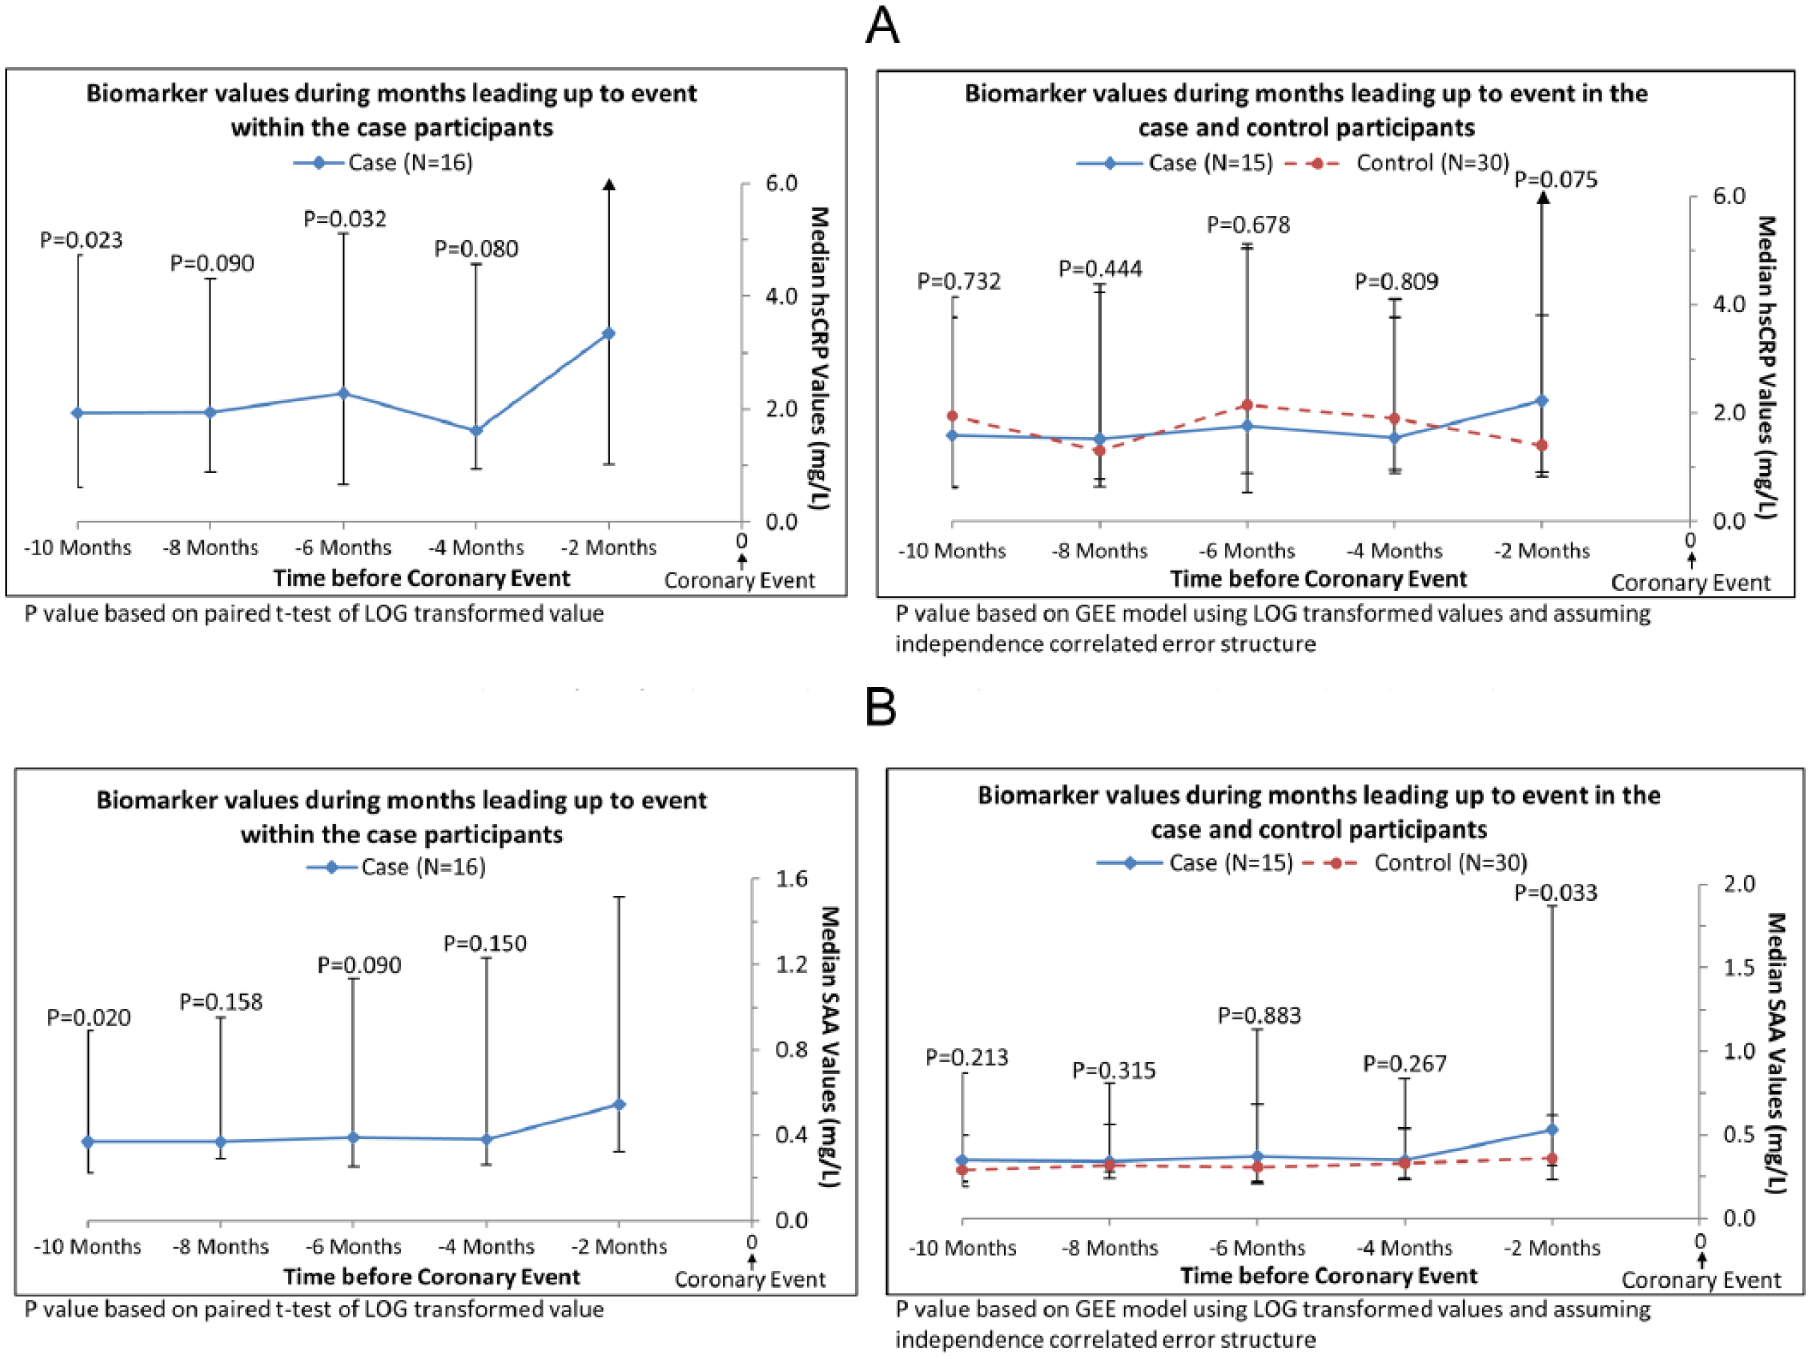
Median hsCRP (A) and SAA (B) values in the subset of cases with complete biomarker data prior to experiencing an ischemic heart disease event. (hsCRP, high-sensitivity-C-reactive protein; SAA, serum amyloid A.)
Discussion
Results of BRAVO show that PAD participants who experience an IHD event have higher levels of D-dimer within the 2-month period right before their IHD event, compared to most of the values obtained between 10 and 26 months previously. During the months leading up to an IHD event, D-dimer levels were significantly higher in case as compared to control participants at most visits within 8 months of the IHD event. There were no consistent increases in CRP or SAA during the months leading up to an IHD event, after adjusting for confounders. To our knowledge, the BRAVO cohort is the only cohort of individuals at high risk for an IHD event who have been followed prospectively with frequent blood draws to determine short-term temporal changes in biomarkers in the months leading up to an IHD event.
Extensive literature supports a key role of inflammation and hemostatic processes in the initiation and progression of atherosclerosis. Ross, Fuster, and Libby have proposed models of atherosclerotic disease progression that underscore the role of inflammation and thrombosis in triggering acute coronary events.9,10,22–25 A combination of cellular, local, and humoral processes can destabilize the atherosclerotic plaque, resulting in intra-plaque hemorrhage and fibrous cap erosion or rupture.23–26 Studies incorporating pathologic, angiographic, and intra-vascular ultrasound evidence indicate that IHD events often result from plaque rupture on areas of relatively insignificant coronary atherosclerosis.25–32 Studies from community dwelling men and women completed prior to the BRAVO Study demonstrated that elevated baseline biomarker levels are better predictors of near-term than later-term IHD events.33–36 These conclusions, however, were based on a single, baseline biomarker measurement. The BRAVO cohort is unique in part because it is the only large cohort of high-risk individuals who have been followed prospectively with measurement of biomarkers every 2 months in order to relate biomarker level changes to near-term risk of IHD events.
Although levels of D-dimer were higher during the 2 months before an IHD event, compared to values obtained 10 to 32 months previously, we did not observe a steady increase in D-dimer levels during the months leading up to an IHD event. There are several potential explanations for the absence of a steady progressive surge in D-dimer levels immediately prior to an IHD event. First, we measured biomarker levels every 2 months. If true biomarker surges occur hours or days prior to an IHD event, our sampling frequency would have missed this acute surge. Second, it is possible that biomarker surges occur in only a subset of participants with PAD who experience an IHD event. The BRAVO Study was not designed to identify the PAD participants who may be most likely to experience a biomarker surge prior to an IHD event. Third, it is possible that biomarker surges occur in only a subset of IHD events. Fourth, not all BRAVO participants had biomarkers measured at all study time points. Comparing biomarker levels between different groups of participants at each time point lessens the ability to detect a biomarker surge right before an event. When we limited analyses to participants who had blood obtained at each visit during the 10 months leading up to an event, we found that D-dimer levels measured immediately prior to the IHD event were significantly higher than levels obtained at each visit during the 10 months leading up to the event. Fifth, recent evidence suggests that vulnerable plaque may be a less common initiator of IHD events than previously thought. 37 Surges in biomarkers may require vulnerable plaques to instigate an IHD event.
We found stronger evidence for a surge in D-dimer immediately prior to an IHD event than for surges in CRP or SAA. This difference may be related to the pathophysiology of D-dimer increases compared to CRP and SAA increases. Elevated levels of D-dimer reflect activation of the coagulation system, fibrin formation, and the lysis of fibrin by plasmin. Short-term increases in D-dimer may indicate destabilization of atherosclerotic plaques and onset of thrombogenesis. In contrast, CRP and SAA are both acute-phase reactant proteins that are rapidly synthesized and secreted by the liver in response to inflammatory stimuli.
Limitations
Our study has limitations. First, we studied PAD participants because they are a high-risk population with high rates of IHD events. However, people with PAD have chronically higher levels of inflammatory and thrombotic markers compared to people without PAD. Chronically high levels of inflammatory and thrombotic biomarkers may preclude the ability to detect or generate an acute surge in biomarker levels prior to an event. Second, we did not have complete biomarker data for a subset of our PAD participants. PAD participants who were most ill were more likely to be unable to participate in a study visit, thereby reducing the number of biomarker levels available to test our hypotheses. Third, this observational study cannot determine whether increases in D-dimer levels may have contributed to the IHD event or whether they were a consequence of an impending IHD event. Fourth, our findings may not be generalizable to individuals without PAD. Fifth, we did not adjust for multiple comparisons. Sixth, missing data limited statistical power for some comparisons. However, some missing data occurred among participants who experienced an IHD event soon after study enrollment and, consistent with our study design, did not contribute biomarker data after their IHD event.
Conclusion
In summary, among people with PAD who experienced an IHD event, D-dimer was higher within 2 months of the event, compared to most values obtained 10 to 32 months previously. D-dimer was higher among case participants compared to controls at most visits within 8 months of an IHD event. CRP and SAA were not consistently higher in cases than in controls during months leading up to an IHD event. Further study is needed to determine whether serial monitoring of D-dimer levels has clinical utility in PAD.
Footnotes
Acknowledgements
The authors thank Loyda Vida for the D-dimer analyses for the study.
Declaration of conflicting interests
The author(s) declared no potential conflicts of interest with respect to the research, authorship, and/or publication of this article.
Funding
The author(s) disclosed receipt of the following financial support for the research, authorship, and/or publication of this article: This study was funded by the National Heart, Lung, and Blood Institute (NHLBI), R01-HL089619. The funding agency played no role in carrying out the study, data analyses, data interpretation, or manuscript writing.
References
Supplementary Material
Please find the following supplemental material available below.
For Open Access articles published under a Creative Commons License, all supplemental material carries the same license as the article it is associated with.
For non-Open Access articles published, all supplemental material carries a non-exclusive license, and permission requests for re-use of supplemental material or any part of supplemental material shall be sent directly to the copyright owner as specified in the copyright notice associated with the article.