
Abstract
Previous studies in rodent models and patients suggest that visceral adipose could play a direct role in the development and progression of abdominal aortic aneurysm (AAA). This study aimed to assess the association of visceral adiposity with AAA presence and growth. This study was a case–control investigation of patients that did (n=196) and did not (n=181) have an AAA who presented to The Townsville Hospital vascular clinic between 2003 and 2012. Cases were patients with AAA (infra-renal aortic diameter >30 mm) and controls were patients with intermittent claudication but no AAA (infra-renal aortic diameter <30 mm). All patients underwent computed tomography angiography (CTA). The visceral to total abdominal adipose volume ratio was estimated from CTAs by assessing total and visceral adipose deposits using an imaging software program. Measurements were assessed for reproducibility by repeat assessments on 15 patients. AAA risk factors were recorded at entry. Forty-five cases underwent two CTAs more than 6 months apart to assess AAA expansion. The association of visceral adiposity with AAA presence and growth was examined using logistic regression. Visceral adipose assessment by CTA was highly reproducible (mean coefficient of variation 1.0%). AAA was positively associated with older age and negatively associated with diabetes. The visceral to total abdominal adipose volume ratio was not significantly associated with AAA after adjustment for other risk factors. Patients with a visceral to total abdominal adipose volume ratio in quartile four had a 1.63-fold increased risk of AAA but with wide confidence intervals (95% CI 0.71–3.70; p=0.248). Visceral adiposity was not associated with AAA growth. In conclusion, this study suggests that visceral adiposity is not specifically associated with AAA presence or growth although larger studies are required to confirm these findings.
Introduction
Abdominal aortic aneurysm (AAA) is a common cause of mortality in older adults.1,2 Currently the only definitive management for AAA is surgical repair. 3 Previous trials have demonstrated that early elective surgical repair of small AAAs (<55 mm) does not reduce mortality.4–7 The identification of medical management approaches, including risk factor modification, which can effectively reduce the development and/or progression of AAA would be of substantial benefit to patients.3,8
Obesity has been independently associated with occlusive artery disease.9,10 AAA has many risk factors in common with occlusive vascular disease. Patients with AAAs often have atherosclerosis; however, it is unclear whether this association is causal or simply due to common risk factors. 11 Obesity is not generally regarded as a risk factor for AAA and relatively few studies have explored this relationship. 12 A recent systematic review suggested a positive association between anthropometric measures of body habitus (body mass index (BMI); waist circumference (WC)) and AAA presence. 13 Findings were not completely consistent, however, with three of the eight studies finding no significant association between body habitus and AAA.14–16 A previous large study identified that waist circumference was more powerfully associated with AAA than BMI, suggesting the potential importance of visceral adiposity in AAA. 12 A recent study in an animal model suggested that visceral adipose tissue plays a direct role in promoting the development and progression of AAA through release of pro-inflammatory cytokines. 17 In support of the findings of this rodent model investigation, the pro-inflammatory adipokine resistin has been associated with AAA presence in men. 12 These studies suggest that visceral adiposity may directly contribute to the development of AAA distinct from the previously identified effect of obesity in cardiovascular disease in general. 12 There are no studies to our knowledge that have shown an association between anthropometric measures and AAA growth. 13
Previous investigations have suggested that visceral adiposity can be targeted by exercise regimens and thus is a potential modifiable risk factor.18,19 The association of visceral adiposity (when measured directly by imaging) with AAA has not, however, been previously examined in patients. Our hypotheses were that: (1) patients with an AAA would have a higher ratio of visceral to total adiposity; and (2) patients with more rapid AAA growth would have a higher ratio of visceral to total adiposity. The aim of this study was to assess the association of abdominal adiposity, measured by computed tomography, with AAA presence and growth.
Methodology
Study participants and definitions
This research was approved by the Townsville Health Service District Human Research Ethics Committee. Written informed consent was obtained from patients. This was a prospective case–control investigation. Patients were recruited from The Townsville Hospital vascular clinic between May 2003 and February 2012. Cases were patients with AAA (infra-renal aortic diameter >30 mm) and controls were patients with intermittent claudication (caused by atherothrombosis, confirmed by computed tomography angiography (CTA)) but no AAA (infra-renal aortic diameter <30 mm). All patients underwent CTA as part of their clinical care. Inclusion criteria were as follows: (1) verbal and written consent; and (2) clinical requirement for CTA to investigate AAA or lower limb atherothrombosis. Exclusion criteria included: (1) previous history of AAA repair where a CTA pre-repair was not performed; and (2) a contra-indication to CTA.
To assess the association of visceral adiposity with AAA growth a sub-set of the cases were further examined. This sub-set included cases who had undergone an additional CTA at least 6 months after the initial imaging as part of their clinical care, and where no surgical interventions on the AAA had been undertaken.
CTA analysis
All CTAs were performed at The Townsville Hospital using a multi-scanner (Philips, North Ryde, NSW, Australia) under a set protocol. Images were recorded at 3-mm intervals with a slice thickness of 3 mm, enabling the construction of 3-mm adjoining axial images for analysis. A total of 100 ml of Ultravist 300 contrast agent was administered intravenously by an automatic CTA injection driver system (MEDRAD). The CTA imaging commenced once the Hounsfield unit (HU) at the centre of the aorta reached 130. CTA imaging was transferred to Philips MxView Visualisation Workstation software for analysis. Analysis of the abdominal aorta spanned from the origin of the most inferior renal artery excluding any accessory vessels to the aortic bifurcation.
The two researchers performing measurements underwent a comprehensive training program provided by a clinician experienced in use of the workstation. During training any inter-observer discrepancy in measurements was discussed and re-measured with both researchers present in addition to the clinician who provided the workstation training until consensus was reached. After training the two researchers independently assessed a common set of 15 CTAs and reproducibility analyses for the assessment of inter-observer error were completed by a third independent researcher. After reproducibility analyses confirmed inter-observer reproducibility, researchers 1 and 2 measured 304 and 73 CTAs, respectively. Researcher 1 measured a second set of 45 CTAs to assess AAA growth.
Workstation protocols
Assessment of maximum infra-renal aortic diameter
The maximum infra-renal aortic diameter was assessed by orthogonal measurement from CTA imaging adhering to an established protocol which measured from adventitia to adventitia. 20 Orthogonal measurements used Philips’ ‘Advanced Vessel Analysis’. The region of interest was methodically assessed for the site of maximal diameter. Measurements were recorded with electronic callipers to the nearest 0.1 mm. Parr and colleagues have previously reported that the intra- and inter-observer mean coefficient of variation for orthogonal diameter measurements were 2.5% and 3.5%, respectively. 20
Assessment of abdominal aortic volume
The protocol for analysis of the infra-renal aortic volume has been previously reported.20,21 In brief, radiographic thresholding was set (centre Hounsfield unit (CH) 1048, width Hounsfield unit (WH) 4095) to isolate the total infra-renal aortic volume. 20 Using the ‘region of interest’ tool in Philips’ ‘CT viewer’ software, the infra-renal aorta was manually isolated, which included the vessel adventitia. Volume was measured to the nearest cubic centimetre. The intra- and inter-observer mean coefficients of variation for this protocol were previously reported as 2.8% and 2.7%, respectively. 20
Assessment of abdominal adipose volume
A protocol for CTA adipose volume measurement was designed 22 and incorporated techniques described in published literature with approaches learnt whilst performing aortic volumetric analysis.23–27 Briefly, the radiographic threshold was set to the pre-defined threshold for adiposity (CH 120 HU, WH 75 HU), as illustrated in Figure 1. The axial slice at which the superior aspect of the first sacral body appeared was identified. The ‘volume of interest’ tool was used to manually circumscribe the entire torso at this slice. The axial slice 125 mm cephalad to the first slice was identified and circumscribed with the ‘volume of interest’ tool. In a semi-automated system, the axial slices between these points were methodically joined to form a region of adipose tissue, an example of which has been illustrated in Figure 1, Part 1. ‘Tissue volume’ was selected to provide the total adipose tissue volume (Figure 1, Part 2).
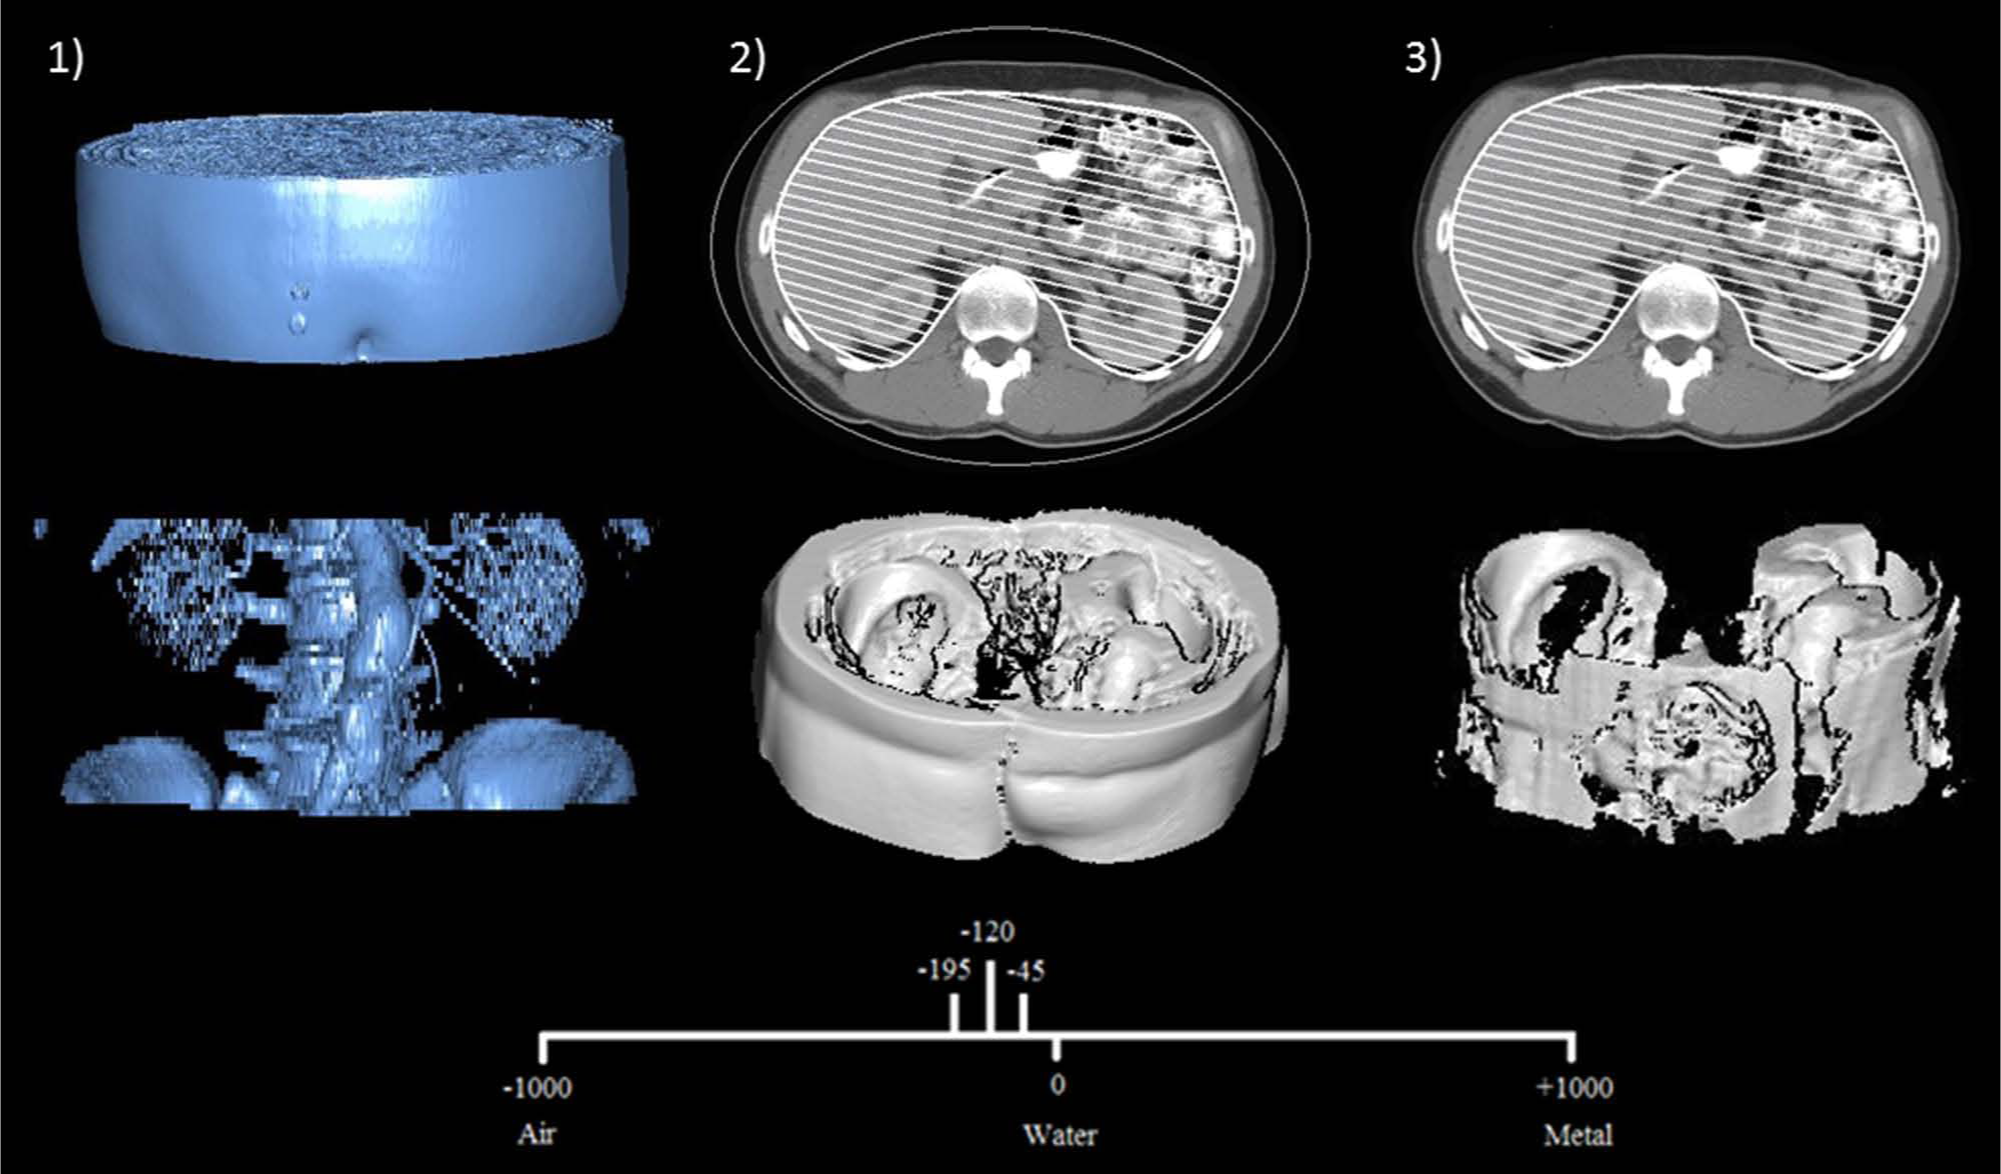
Illustration of the calculation of visceral and total adipose volumes: (1) region of interest; (2) total abdominal adiposity; (3) visceral adiposity.
In a similar process, the visceral adipose volume was calculated from axial CTA images. First, the visceral compartment at the most superior aspect of the first sacral body was manually traced using the ‘volume of interest’ tool. Second, the visceral compartment on the axial slice 125 mm cephalad was circumscribed. The axial slices between these points were joined in a semi-automated fashion to create an estimation of the visceral adipose volume (Figure 1, Part 3). The subcutaneous adipose volume was calculated from the difference between total and visceral adipose volumes. Measurements were displayed to the nearest 0.01 cm3.
Reproducibility analysis for adipose volume
A reproducibility analysis of the first 15 participants recruited into the study was completed by two observers. 22 Intra-observer reproducibility measurements were completed three times with at least 1 week between measurement sets. Inter-observer reproducibility was completed at least 1 week after the intra-observer measurements were complete. Data were analysed by a third independent observer. The intra- and inter-observer concordance correlation coefficients (CCC) for total adipose volume measurements were 1.0 (95% CI, 1.0 to 1.0) and 1.0 (95% CI, 1.0 to 1.0), respectively. The intra- and inter-observer mean coefficients of variation (MCV) for total adipose volume were 0.8% and 1.2%, respectively. The CCCs for intra- and inter-observer visceral adipose volume were 1.0 (1.0 to 1.0) and 1.0 (1.0 to 1.0), respectively. The MCV for intra- and inter-observer visceral adipose volume were 1.9% and 3.4%, respectively.
Calculation of AAA growth
AAA growth was defined as a change in infra-renal aortic volume (cm3) and weighted to growth per year to adjust for variations in scan intervals. Total aneurysm volume change has been reported as a more sensitive measure of AAA growth than orthogonal diameter change. 20
Clinical data
Baseline characteristics collected for each patient at entry to the study included: sex, age, hypertension, diabetes, coronary heart disease and medication prescription. Diabetes and hypertension were defined by history of diagnosis or treatment of these conditions. History of smoking was defined as ever or never smoked. Coronary heart disease was defined by a history of angina, myocardial infarction or coronary revascularisation. Current medication history was recorded with respect to prescription of aspirin, angiotensin-converting enzyme inhibitors, angiotensin receptor blockers, calcium channel blockers, furosemide, hypoglycaemic agents, other anti-platelet medication, statins or warfarin.
Statistical analysis
The study was powered to identify if there was a minimum 15% difference between groups as this was judged to be a clinically meaningful difference. We planned to perform logistic regression to assess the association of visceral adiposity and AAA presence adjusted for the following risk factors: age, coronary heart disease, diabetes mellitus, smoking history, sex and hypertension. G*Power version 3.1.7, a statistical power analysis software, was used to calculate sample size. Briefly, preliminary data from the reproducibility analysis of 15 patients (mean and standard deviation of visceral to total abdominal adipose volume ratio) were used to calculate the effect size for a 15% difference between groups. The a priori sample size calculation indicated 370 participants were required, based on an analysis of covariance (ANCOVA) model, entering effect size f(0.182), alpha (0.05), power (90%), and six covariates. Data were prospectively recorded in an Access database and subsequently transferred to a Microsoft Excel spreadsheet and then to SPSS version 20.0 (IBM SPSS Inc., Chicago, IL, USA) for statistical analysis. Baseline characteristics were compared between AAA and control groups using univariate tests. Categorical variables were presented as numbers (%) and compared by chi-squared test. Histograms and Kolmogorov–Smirnov tests demonstrated that numerical data were not normally distributed. Numerical data were presented as median and inter-quartile ranges, and compared between cases and controls using the Mann–Whitney U-test. To assess the association of abdominal adipose distribution with AAA, the visceral to total abdominal adipose volume ratio was calculated for all cases. A ratio was used in preference to total abdominal adiposity as it provided a measure of visceral adiposity relative to overall body size. Participants were stratified into quartiles (quartiles (Q) 1 to 4) determined by their visceral to total abdominal adipose volume ratio in ascending order for analysis. The association of visceral to total abdominal adipose volume ratio with AAA presence and growth was examined using logistic regression adjusting for: age, coronary heart disease, diabetes, ever smoked, sex and hypertension. Results of the logistic regression are presented as odds ratios (ORs) and 95% confidence intervals (95% CIs).
Results
Characteristics of study participants
A total of 377 patients were recruited, including 196 cases with AAA and 181 controls with intermittent claudication but no AAA. All study participants resided in north Queensland, mostly from Townsville and surrounding communities. AAA cases were older, more likely to be male, more likely to have coronary heart disease and be prescribed beta-blockers. AAA cases were less likely to have diabetes and be prescribed hypoglycaemic medications (Table 1). The median infra-renal aortic diameters were 50.0 mm and 21.0 mm in cases and controls, respectively (Table 1). The median infra-renal aortic volume was approximately fourfold greater in cases (Table 1). The visceral to total abdominal adipose volume ratio was greater in the cases (p=0.007) and the subcutaneous adipose volume was greater in the controls (p=0.001).
Comparison of cases and controls at entry.
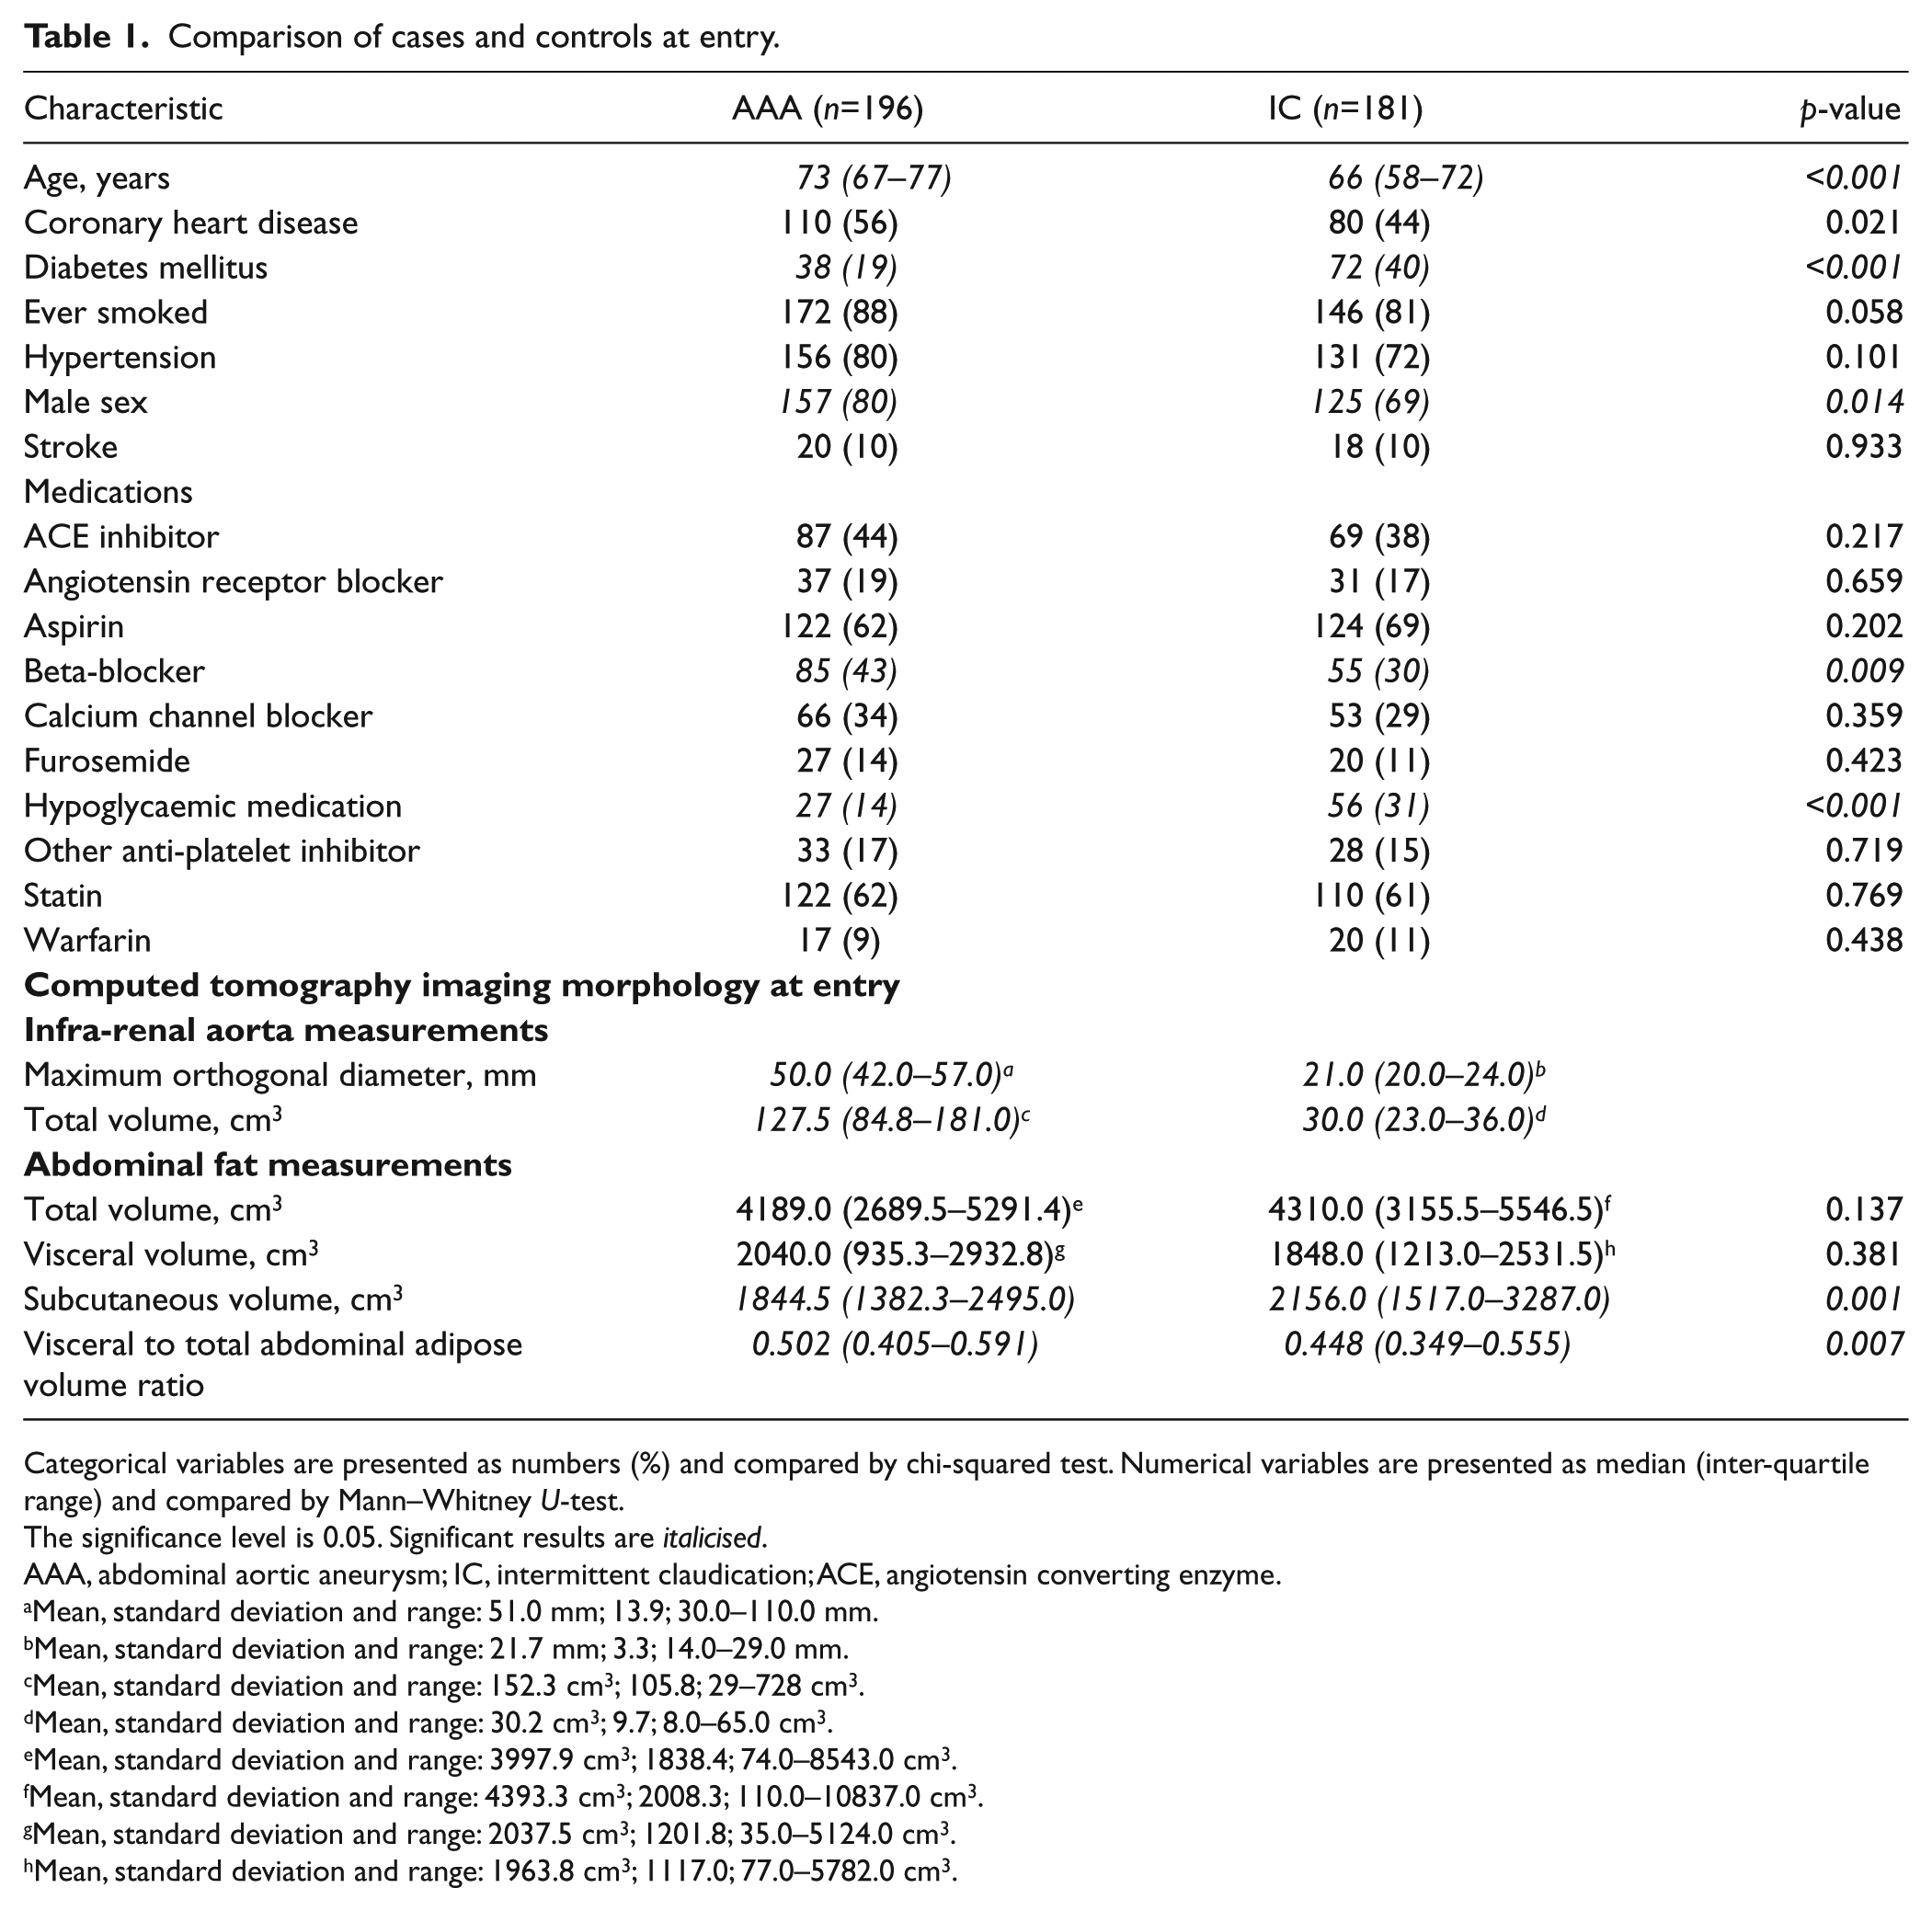
Categorical variables are presented as numbers (%) and compared by chi-squared test. Numerical variables are presented as median (inter-quartile range) and compared by Mann–Whitney U-test.
The significance level is 0.05. Significant results are italicised.
AAA, abdominal aortic aneurysm; IC, intermittent claudication; ACE, angiotensin converting enzyme.
Mean, standard deviation and range: 51.0 mm; 13.9; 30.0–110.0 mm.
Mean, standard deviation and range: 21.7 mm; 3.3; 14.0–29.0 mm.
Mean, standard deviation and range: 152.3 cm3; 105.8; 29–728 cm3.
Mean, standard deviation and range: 30.2 cm3; 9.7; 8.0–65.0 cm3.
Mean, standard deviation and range: 3997.9 cm3; 1838.4; 74.0–8543.0 cm3.
Mean, standard deviation and range: 4393.3 cm3; 2008.3; 110.0–10837.0 cm3.
Mean, standard deviation and range: 2037.5 cm3; 1201.8; 35.0–5124.0 cm3.
Mean, standard deviation and range: 1963.8 cm3; 1117.0; 77.0–5782.0 cm3.
The association of visceral to total abdominal adipose volume ratio with AAA presence
The association of visceral to total adipose volume ratio quartiles with AAA was examined using logistic regression to adjust for other risk factors. There was no significant association between visceral to total adipose volume ratio quartiles and AAA (Table 2). Age above median was positively associated with AAA, while diabetes was negatively associated with AAA (Table 2). In a separate logistic regression model using visceral to total adipose volume ratio as a continuous variable adjusted for the same risk factors, visceral to total adipose volume ratio was not associated with AAA. The relationship between subcutaneous adipose volume quartiles and AAA presence was also analysed and there was no significant association (results not shown).
Independent predictors of AAA presence in 377 participants.
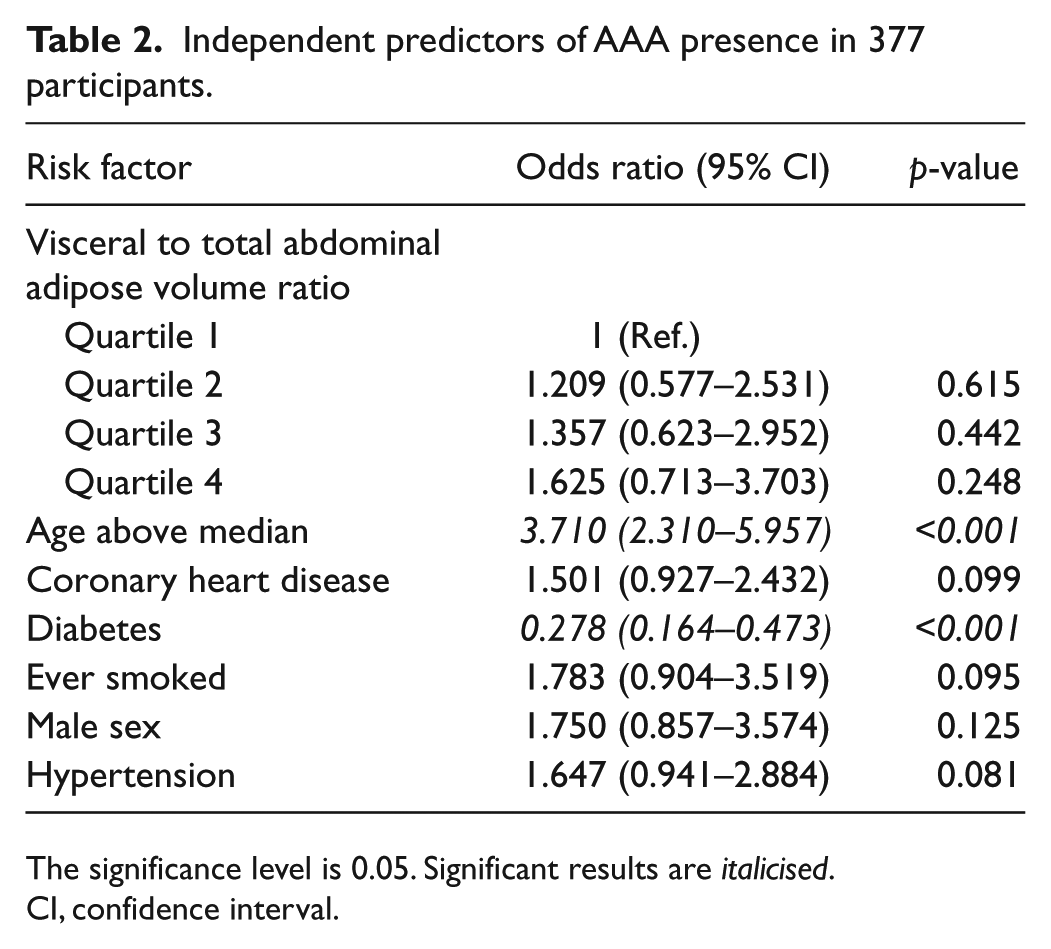
The significance level is 0.05. Significant results are italicised.
CI, confidence interval.
The association of visceral adiposity with AAA growth
Forty-five cases underwent two CTAs more than 6 months apart to assess AAA expansion (median time between CTA was 2.0 years, inter-quartile range (IQR) 1.0 to 4.0). Overall the median AAA volume increase was 8.9 (IQR 5.4–14.0) cm3/year, which equated to an annual percentage growth of 11.0 (IQR 5.2–19.2) %/year. The median increase in AAA diameter was 1.2 (IQR 0.2–2.0) mm/year, which was equivalent to an annual percentage growth of 2.5 (IQR 0.6–4.8) %/year. Cases were stratified into those with annual weighted AAA growth above median and below/including median (Table 3). Initial AAA diameter was greater in patients with more rapid AAA growth and associated with AAA growth after adjustment for other risk factors (Tables 3 and 4). The visceral to total abdominal adipose volume ratio was slightly lower in patients with more rapid AAA growth, although the association was not significant (Table 3). After adjusting for other risk factors, the visceral to total abdominal adipose volume ratio was not associated with more rapid AAA growth (Table 4). The relationship between subcutaneous adipose volume and AAA growth was also analysed and there was no significant association (results not shown).
Comparison of subjects with rapid and slow AAA growth.
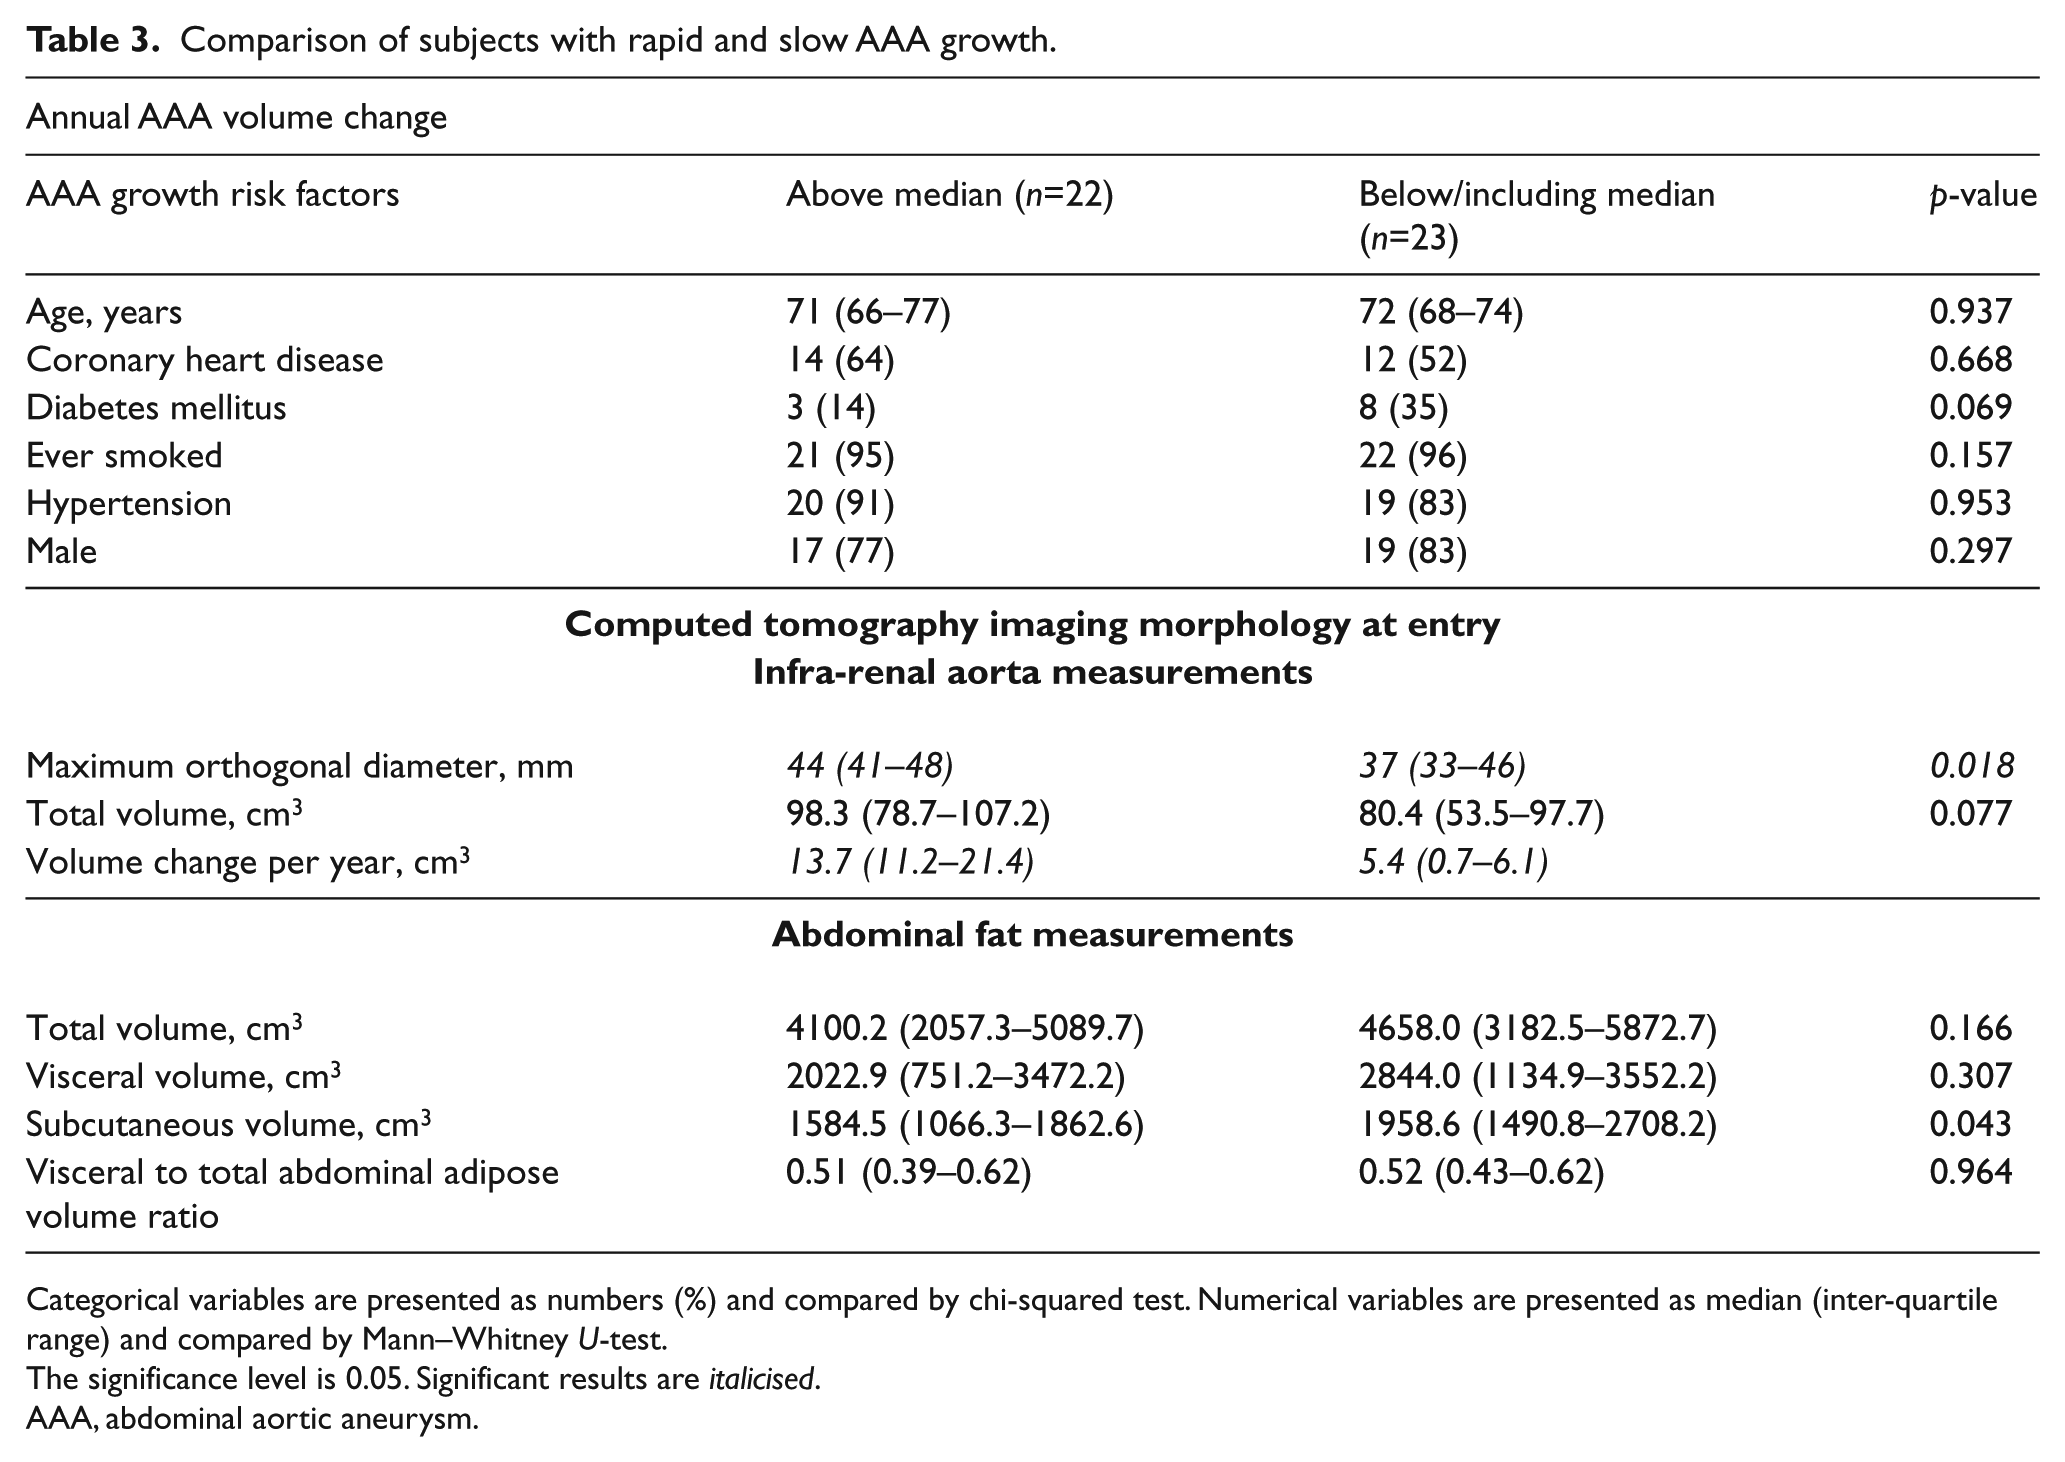
Categorical variables are presented as numbers (%) and compared by chi-squared test. Numerical variables are presented as median (inter-quartile range) and compared by Mann–Whitney U-test.
The significance level is 0.05. Significant results are italicised.
AAA, abdominal aortic aneurysm.
Independent risk factors of rapid AAA growth.
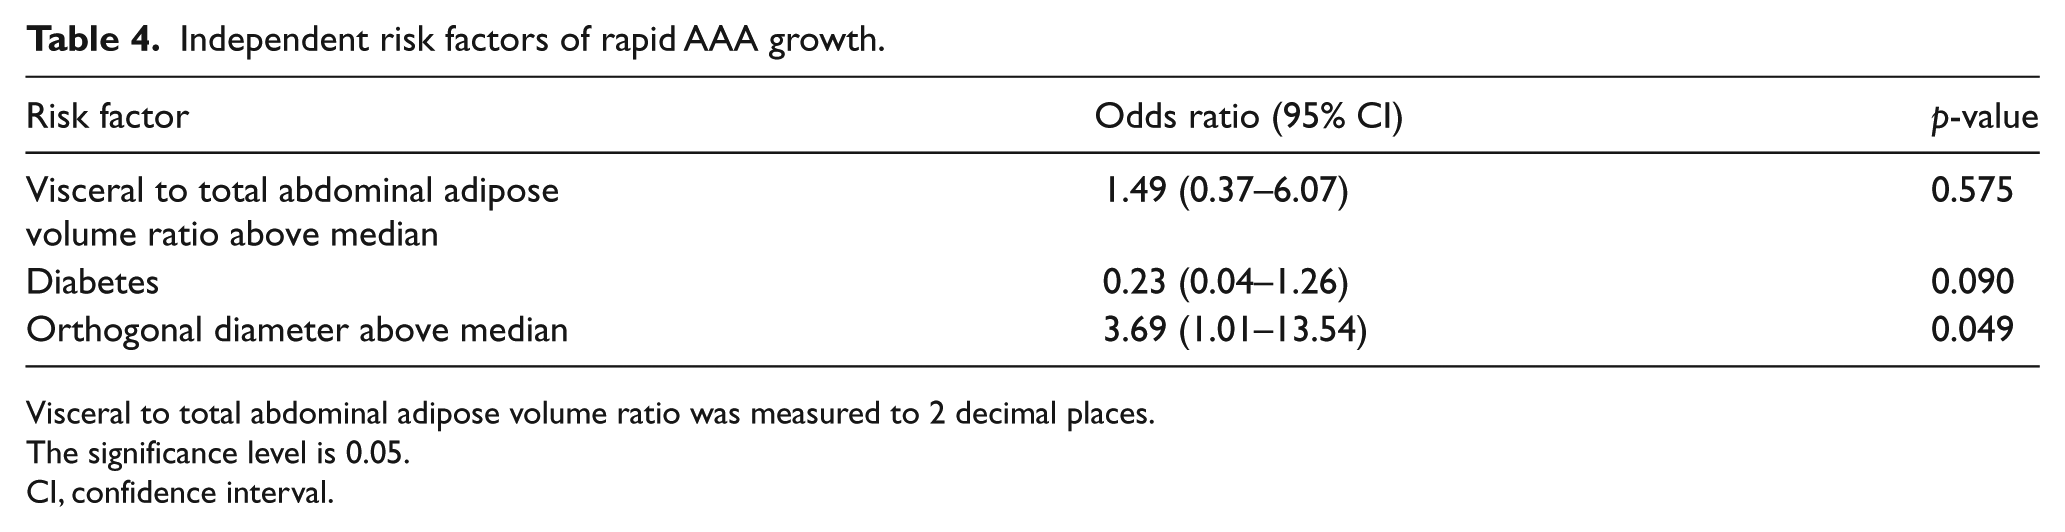
Visceral to total abdominal adipose volume ratio was measured to 2 decimal places.
The significance level is 0.05.
CI, confidence interval.
Discussion
The main findings from this study were that the relative visceral adiposity volume assessed from thresholded CTAs was not associated with AAA presence or growth. The generalisation of these findings needs to take into account the limited sample size in this study, particularly for the AAA growth analysis. While the assessment of the association of visceral adiposity with AAA presence had a sample size to achieve >90% power, the assessment of visceral adiposity with AAA growth was underpowered. The findings of this study therefore suggest that visceral adiposity volume is not specifically associated with AAA presence, but larger studies are needed to confirm our finding with respect to AAA growth.
Eight previous studies have examined the association of anthropometric measures with AAA presence or abdominal aortic diameter.12,14-16,28-31 Five studies measured BMI and three studies assessed WC (Table 5). Overall these studies suggest that BMI and WC are associated with AAA presence. 13 Results from past studies differ from the current study possibly due to the different method for the assessment of adiposity. BMI and WC are common surrogate measures of visceral adiposity, although they do not directly measure fat. 32 CT-derived adipose measurements can potentially provide more direct assessment of visceral fat deposition by thresholding and isolating adiposity from other tissue. There are no previous studies that have assessed the association of visceral adipose volume measured from thresholded CTAs with either AAA or lower limb atherothrombosis.
Summary of studies assessing the association of obesity with AAA presence. 13
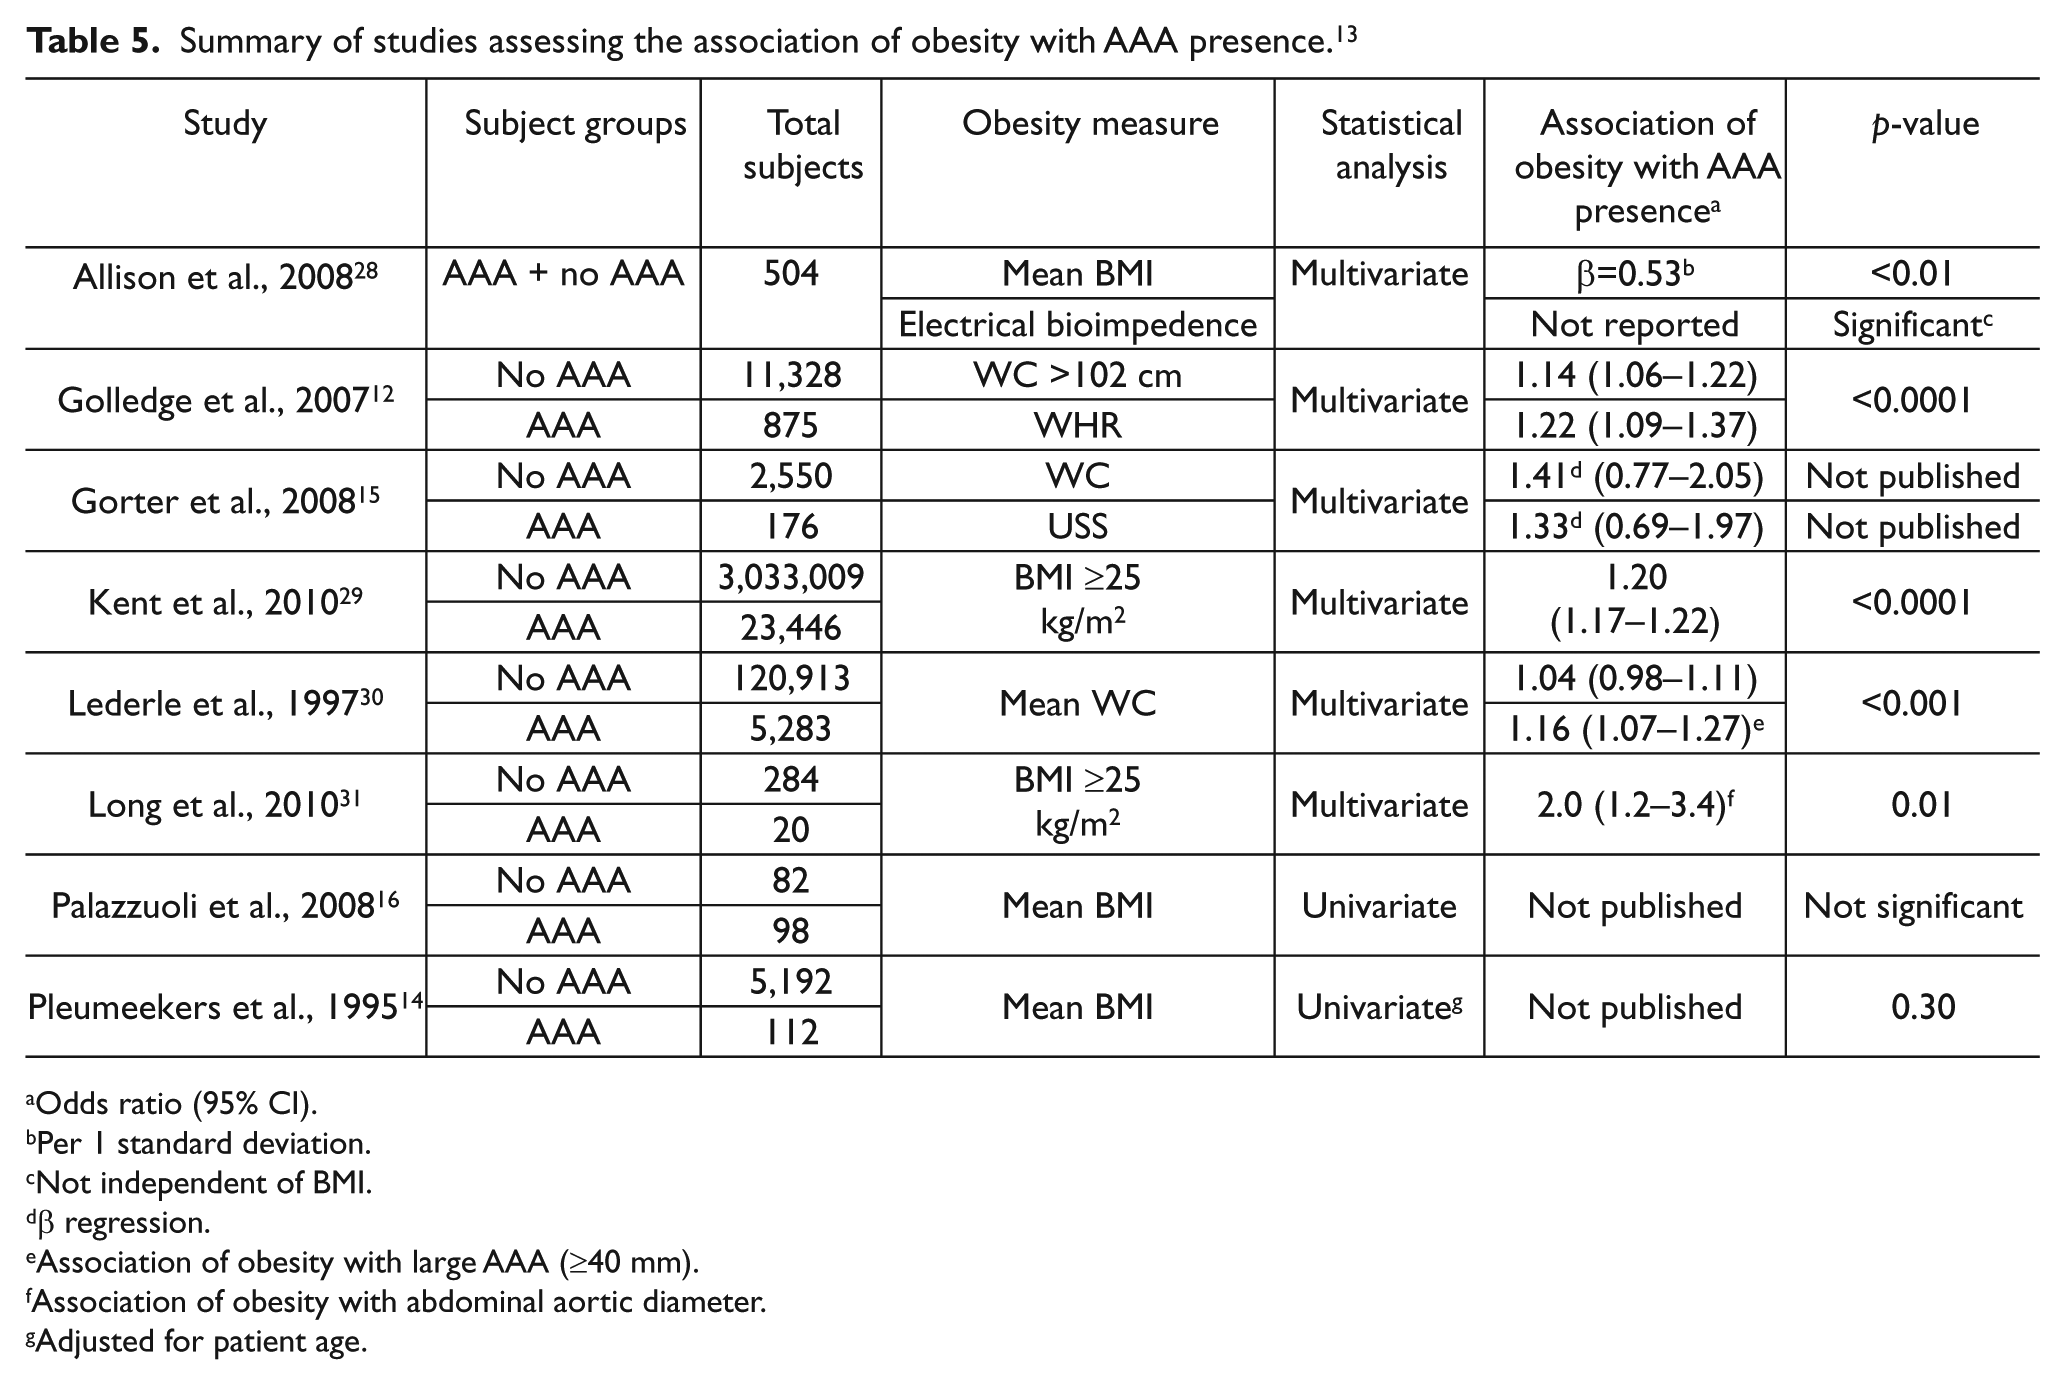
Odds ratio (95% CI).
Per 1 standard deviation.
Not independent of BMI.
β regression.
Association of obesity with large AAA (≥40 mm).
Association of obesity with abdominal aortic diameter.
Adjusted for patient age.
We postulated that visceral adiposity could be an important contributor to the pathogenesis of AAA based on findings in an animal study. 17 Aortic inflammation is believed to play a critical role in AAA pathogenesis.33–35 The majority of arteries, including the abdominal aorta, are surrounded by peri-vascular adipose tissue. 36 It has been postulated that visceral adipose tissue may promote peri-aortic inflammation.12,17 White adipose tissue in particular has been implicated in the secretion of pro-inflammatory chemokines. 36 The localised nature of adipose secretions from visceral deposits suggests that peri-vascular adipose tissue is able to secrete chemokines in high concentrations which could promote aortic inflammation. 36 It has been reported that a reduction in visceral adiposity limits AAA progression within a mouse model of AAA. 37
Our findings of similar visceral to total abdominal adipose volume ratio in patients with AAA and lower limb atherothrombosis suggest that visceral adipose does not play a specific role in promoting AAA when compared to other forms of vascular disease, such as lower extremity occlusive arterial disease.
Two previous studies were identified which assessed the association of adiposity and AAA growth.38,39 Both studies reported no association between BMI and AAA progression. These findings support the result of the current study in which we found no association of visceral adipose volume and AAA growth. Recently a number of studies have reported a decline in mortality from AAA.1,40,41 The decline in AAA mortality has been accredited to a reduction in smoking prevalence resulting in a reduced incidence of AAA42–46 and increases in elective AAA repair in older patients. 1 The prevalence of obesity has increased over the same period. 47 One could speculate that if there were a significant role of visceral adiposity in AAA pathogenesis, such a decline in AAA incidence would be less likely. Modification of other risk factors, such as encouraging a further reduction in smoking, may prove more fruitful in the management of AAA.
This study has a number of limitations. First, the sample size was quite small, particularly in the sub-group in which we examined AAA growth. Second, there are other methods to assess body fat which were not tested. BMI and WC data were not available for all participants of this study. While the CTA protocol was shown to be reproducible, other measures of body adiposity could have been used to validate results. Third, the confidence intervals for the association of relative visceral adiposity with both AAA presence and growth were large and thus our findings do not completely exclude a role for visceral adiposity in AAA. Larger studies are needed to confirm our findings.
AAA patients were compared with patients with lower limb atherothrombosis rather than healthy controls. AAA patients frequently have concurrent atherosclerosis. The presence of atherosclerosis in both groups may have limited our ability to identify an association. Adiposity may be associated with both AAA and PAD, complicating the analyses in this study. A healthy set of controls would be advantageous but not ethically appropriate given the risks attached to CTA. Our approach also had a number of advantages. Both cases and controls had undergone imaging by CTA, allowing accurate assessment of visceral fat which would not have been straightforward in healthy controls. Also, the comparison of patients with AAA and atherothrombosis, rather than healthy controls, is particularly relevant to clinical practice. The AAA cases were recruited from hospital-referred patients and thus patients referred for assessment of vascular disease who did not have AAA after undergoing similar imaging were appropriate controls. No previous studies have assessed visceral adipose volume in patients with intermittent claudication compared to healthy controls so it is unknown what impact this study design had. Nonetheless, this comparison allowed the assessment of whether there was a specific association of visceral adiposity with AAA as opposed to vascular disease in general. Finally, the powerful negative association between diabetes and AAA may have masked any small association between adipose distribution and AAA, although we adjusted for this in our analyses.12,14,48
In conclusion, this study suggests that visceral adiposity is not directly associated with AAA as compared to vascular disease in general. These findings do not support interventions specifically targeting visceral adiposity as primary or secondary preventative measures for AAA.
Footnotes
Declaration of conflicting interest
The authors report no conflicts.
Funding
This work was funded by grants from the BUPA Foundation, NHMRC (0540404; 1003707; 1000967) and Queensland Government. Professor Golledge holds a practitioner fellowship from the National Health and Medical Research Council, Australia (ID 1019921) and a Senior Clinical Research Fellowship from the Office of Health and Medical Research. The funding bodies had no role or responsibility in the data presented.