
Abstract
The percentage flow-mediated dilation index (FMD%) scales the increase in arterial diameter (Ddiff) as a constant proportion of baseline artery diameter (Dbase). We have demonstrated, albeit with small samples, that the scaling properties of FMD% can lead to biased inferences on endothelial dysfunction. Therefore, we aimed to investigate the underlying rationale and potential bias of FMD% using a selection of new examples from the large (n = 3499) and diverse Multi-Ethnic Study of Atherosclerosis (MESA). In this dataset, we found that smaller values of Ddiff are associated with larger values of Dbase, which contradicts the scaling properties of FMD%. Consequently, FMD% ‘over-scales’ and naturally generates an even stronger negative correlation between itself and Dbase. Using a data simulation, we show that this FMD%–Dbase correlation can be a statistical artefact due to inappropriate scaling. The new examples we present from MESA indicate that FMD% biases the differences in flow-mediated response between men and women, Framingham risk score categories, and diseased and healthy people. We demonstrate how FMD%, as an exposure for predicting cardiovascular disease, is confounded by its dependency on Dbase, which itself could be clinically important. This critical review, incorporating an allometric analysis of a large dataset, suggests that the FMD% index has a less-than-clear rationale, can itself generate the Dbase-dependency problem, provides biased estimates of differences in the flow-mediated response, complicates the interpretation of the flow-mediated protocol and clouds the causal pathway to vascular disease. These interpretative problems can be resolved by applying accepted allometric principles to the flow-mediated response.
Introduction
Percentage flow-mediated dilation (FMD%) has been said to: ‘measure the ability of the arteries to respond with endothelial nitric oxide release during reactive hyperemia (flow mediated) after a 5-minute occlusion of the brachial artery with a blood pressure cuff’. 1
The FMD% index is calculated by dividing the ‘response’ or change in arterial diameter (Ddiff) by the initial baseline diameter of the artery (Dbase) and multiplying by 100. The FMD% index is just one of many percentage change indices used in the field of vascular medicine, others being the nitroglycerin-mediated percentage diameter change (NMD%) and, most recently, percentage flow-mediated constriction (FMC%).
2
Researchers have also calculated ratios of FMD%, NMD% and FMC% (which are already ratios), resulting in other measures of vascular function.
2
It is interesting to contrast the liberal use of these ratio indices in research on endothelial function with the established approaches of physiologists working in other fields. For example, Packard and Boardman
3
maintained that:
all authors discontinue using percentages and size-specific indices in an attempt to scale data for variation in body size within and among groups [and] not to take seriously the conclusions from any report that relies on percentages or size-specific indices to control for effects of body size on the variable of interest.
Since its inception, 4 FMD% has been the primary index in thousands of studies. Researchers are motivated by reports that clinical populations have a lower FMD% than healthy controls, and that a relatively low FMD% is predictive of an increased incidence of cardiovascular disease.5,6 Importantly, a relatively high Dbase is also associated with an increased incidence of cardiovascular disease and a faster progression of carotid artery intima–media thickness. 7 The baseline artery diameter is often systematically higher in diseased versus healthy people5,6 and can change in response to many interventions, including red wine consumption and exercise.8,9
Recently, we examined the potential for FMD% to bias estimates of differences in flow-mediated response between children and adults.10,11 Here, and throughout this review, we refer to ‘bias’ in an inferential statistics context, whereby the magnitude of a population estimate is biased high or low by a certain confounder. Our previous studies were met with published concerns that we analysed relatively small sample sizes and had a rather narrow focus.12 –14 These editorials called for the appropriateness of FMD% to be investigated with larger samples drawn from different populations. Therefore, we now aim to investigate, in a more comprehensive manner than before, the dependency of FMD% on Dbase, and the associated implications of this phenomenon. The investigations in this review are supported by evidence and new examples from the Multi-Ethnic Study of Atherosclerosis (MESA). This very large and diverse sample of open-access data offers the opportunity for excellent precision and generalisability to explore the potential for FMD% to bias inferences.
Our specific objectives were to:
describe the fundamental size-scaling relationship between flow-mediated response and Dbase in the large sample dataset from MESA
investigate whether an allometric approach changes inferences on the relationship between the flow-mediated response and sex, age, Framingham risk scores (FRS), left ventricular mass and cardiovascular disease in MESA
examine how measurement error in the components of FMD% (Dbase and Dpeak) propagates to the measurement error in FMD%
explore how the dependency of FMD% on Dbase influences the causal nexus between the flow-mediated response, as the ‘exposure’, and cardiovascular disease outcomes.
FMD% is an isometric ratio scaling index
As a ‘change in size’ problem, the increase in arterial diameter measured in the FMD% protocol is a classic candidate for the application of allometric principles rather than the ubiquitous acceptance of a percentage change index, which is the current status quo. Allometry is the study of relationships between biological processes and size. 15 The FMD% index is an example of an ‘isometric index’ in allometry, whereby FMD% is reliant on the assumption that the change in arterial diameter is a direct and constant proportion of initial artery diameter. Allometric scaling is used when any size–change relationship is suspected to deviate from this isometry. Therefore, the precise description of the relationship between initial size and final size is a fundamental part of allometric scaling.
The FMD% index is mathematically equivalent to the ratio of peak diameter (Dpeak) and Dbase. For example, an FMD% of 5% equates to a Dpeak/Dbase ratio of 1.05. An FMD% of 10% equates to a Dpeak/Dbase ratio of 1.10, and so on. This ratio is isometric in that it always scales the differences in Dpeak (or Ddiff) as a constant proportion of differences in Dbase (e.g. for a small brachial Dbase of 3.0 mm, an FMD% of 5% translates to a Ddiff of 0.15 mm). For a large Dbase of 6.0 mm, the same FMD% of 5% (and presumably the same endothelial function) translates to a Ddiff of 0.30 mm. Clearly, the validity of FMD% depends on this assumption that differences in Ddiff are directly and consistently proportional to Dbase in all circumstances.
Allometric ‘red flags’ for FMD%
It has been reported that, ‘Absolute change in FMD (millimetre) is unrelated to resting vessel size’. 16 This claim, supported by the observations of Herrington et al., 17 seems incompatible with a proportional size-adjustment index such as FMD%. Although we could not locate any rationale in the literature for the original choice of the FMD% index, it is likely that it was selected to ‘normalise’ for variability in Dbase, and, presumably, it must have been assumed that larger values of Dbase are associated with larger changes in diameter during the FMD% protocol.
Paradoxically, it was clear, even in the very first studies on this topic, that FMD% is still sometimes strongly inversely related to Dbase. 4 Therefore, if the initial intention was to ‘normalise’ Ddiff for variability in Dbase, FMD% has been apparently unsuccessful at this task. Nevertheless, researchers have persevered with FMD%, while forwarding mainly physiological-based explanations for its dependence on Dbase 18 and somewhat convoluted solutions for interpreting differences in FMD% in light of the Dbase-dependency problem (see below).
Statistics are the fundamental outcomes in quantitative research and are, therefore, the bases of all inferences in physiology. These statistical inferences from physiological research can inform clinical importance and practice. If a sample statistic is biased high or low, then study conclusions could be compromised, leading to imprecise information about the clinical importance of a physiological measurement. Statistical bias is ideally resolved by applying the correct statistical solutions at the level of the sample statistic itself.
Are the underlying assumptions of FMD% upheld?
As part of the present review, we can extract new examples from a subsample (n = 3499) of the whole MESA study population (n = 6814) which, together with the FMD% protocol, is detailed in full by Yeboah et al. 6 There have also been over 700 MESA-related publications in which the sample and protocols are detailed. Our particular subsample involved all participants who were measured for FMD% in MESA, except for two extremely high outliers, which were removed prior to our analyses according to recognised procedures. 19
In this MESA subsample, the correlation between Ddiff and Dbase is actually negative in sign (95% confidence interval (CI): −0.12 to −0.19; Figure 1). This correlation was found to be stable across sexes, age groups and categories of FRS. The use of FMD% hinges on the assumption that Ddiff is directly and consistently proportional to Dbase. Therefore, one would expect at least a moderate positive correlation between Ddiff and Dbase. Because this assumption is violated in the MESA dataset, FMD% is likely to be a biased index across the measurement range. The dashed line in Figure 1 represents how the sample mean FMD% of 4.4% (standard deviation (SD) = 2.9) would translate to respective values of Ddiff for each participant across the measurement range in MESA. It can be seen that FMD% is misrepresenting the true negative relationship between Dbase and Ddiff in MESA participants. The 95% CI of the estimate of mean FMD% is a precise 4.3–4.5% in MESA, indicating that sampling error cannot explain this discrepancy.
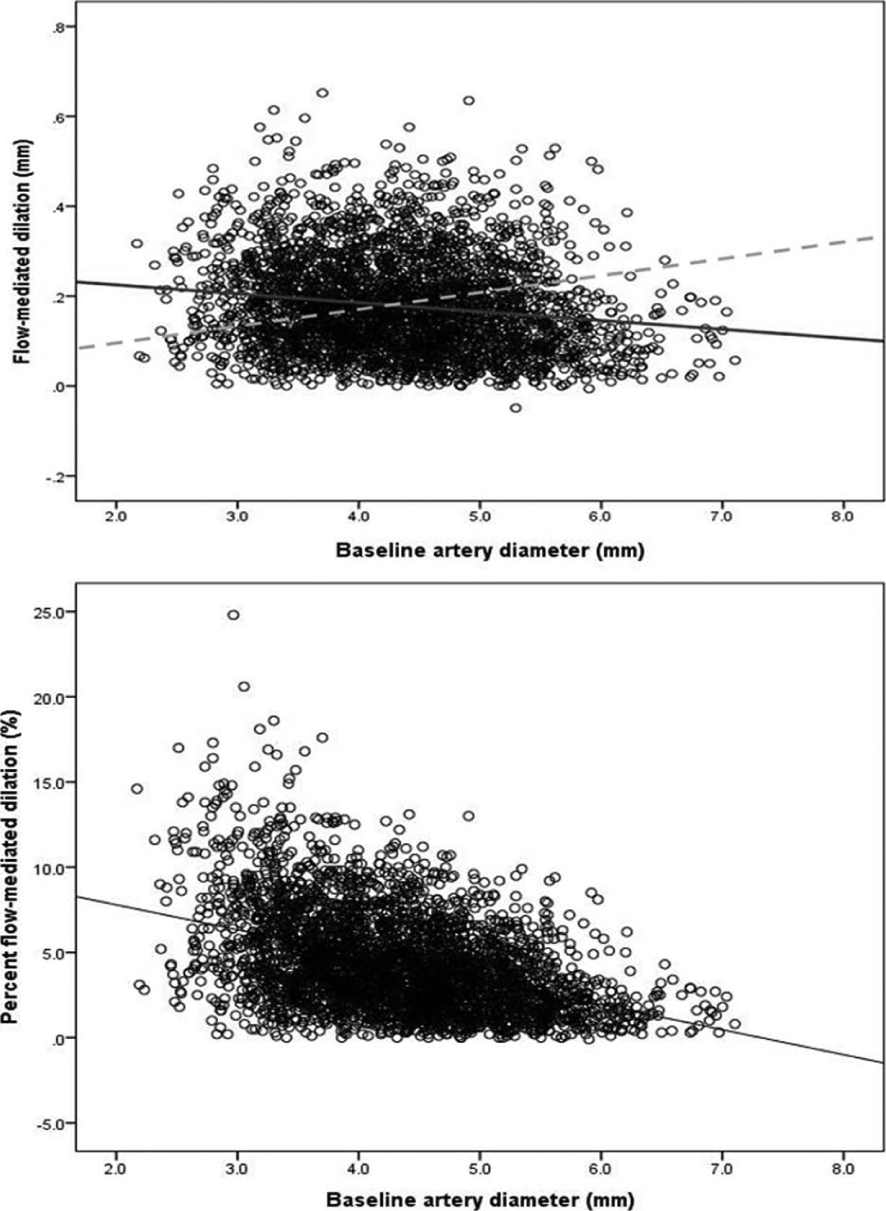
(Top) The negative regression slope (solid line) between Dbase and Ddiff in the MESA subsample (n = 3499). This negative correlation was found to be similar between sexes, age groups and Framingham risk categories. The dashed line represents the clearly erroneous proportionality between Dbase and Ddiff that is assumed when using FMD% (the sample mean FMD% in the MESA being 4.4%). (Bottom) The negative correlation between Dbase and FMD% caused by the erroneous application of a size-proportion ratio (FMD%) where no proportionality actually exists.
Why is FMD% so dependent on Dbase?
Since FMD% is based on the apparently false premise that Ddiff varies in direct proportion to Dbase, FMD% actually causes an even stronger negative correlation between itself and Dbase in MESA. The 95% CI for this correlation between FMD% and Dbase is −0.45 to −0.40, which can be described as ‘moderate’ in terms of effect size thresholds 19 (Figure 1). Again, this Dbase–FMD% correlation is of similar magnitude between sexes, age groups and Framingham risk categories in MESA.
There are reports of even stronger negative correlations (r < −0.8) between Dbase and FMD%, stretching back to early studies. 4 FMD% also tends to be skewed in distribution, even if Dbase and Dpeak are normally distributed variables, and this is the case in MESA. Substantial skewness is confirmed in the MESA sample because the mean FMD% of 4.4% is smaller than two times the sample SD (2 × 2.9%). 20 Skewness is common with most ratio indices and can also bias parametric analyses.19,20 These statistical and size-scaling ‘red flags’ increase the concern that FMD% is an unreliable metric for population estimates of endothelial function.
A relevant question is whether the dependency of FMD% on Dbase is explained fully by physiology or is, at least in part, a statistical artefact. This question can be answered with a simple data simulation, where data realistic to the sample estimates from MESA are produced by a random number generator (e.g. within the Microsoft Excel program). Therefore, we generated 2000 realistic (to the sample characteristics of MESA), and normally distributed, values of Dbase (mean = 4.31 mm, SD = 0.82 mm). Similarly, realistic and normally distributed values of Ddiff were generated (mean = 0.18 mm, SD = 0.11 mm). This allowed calculation of FMD% in the normal way. One can see in Figure 2 that a negative correlation is obtained between calculated FMD% and Dbase (95% CI of r: −0.22 to −0.32). As expected, the FMD% index is not a normally distributed outcome in this data simulation even though Dbase and Dpeak are normally distributed. These findings agree with the similar simulations presented by Vickers 21 in the context of randomised controlled trials. The fact that a negative correlation between FMD% and Dbase can be derived from simulated data with no physiological link at all between Dbase and Ddiff indicates that the correlation is, at least in part, a statistical artefact resulting from the inappropriate use of a ratio index.
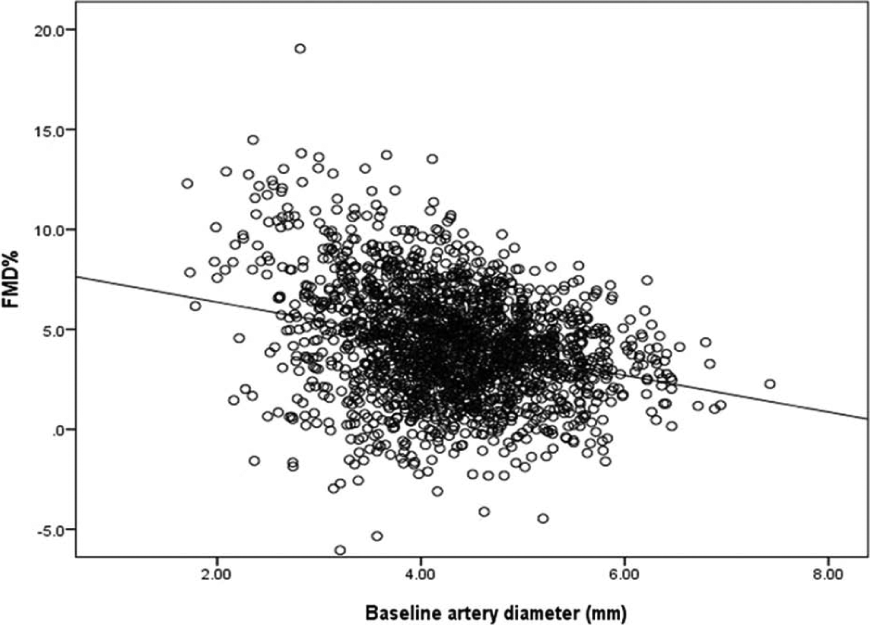
The negative correlation between randomly generated values of Dbase and calculated FMD%. This correlation is present with no physiological relationship at all between the values of Dbase and Ddiff, proving that the dependency of FMD% on Dbase is, at least in part, an allometric problem, and not wholly a physiological phenomenon.
Application of allometric principles to the flow-mediated response
An important part of allometry is quantification of the exponent which describes the relationship between initial and final artery size. From the regression slope between logarithmically transformed values of both Dbase and Dpeak, one can derive the correct scaling exponent for any dataset, and this approach is fully detailed in our previous studies.10,11 In a supplementary file, we also present the SPSS steps for comparing independent samples in terms of Dbase-adjusted flow-mediated dilation (Appendix). This log-log slope (b exponent in the simple allometric model of Dpeak = a × Dbase b ) should ideally be verified using an appropriate form of nonlinear regression working in the raw arithmetic space. 22 The regression slope for logarithmically transformed Dbase and Dpeak is 0.942 in MESA (95% CI: 0.937 to 0.946), rather than the value of 1 necessary for the appropriate use of FMD%.10,11 Again, this allometric slope exponent was found to be similar between sexes, age groups and Framingham risk categories in MESA. The slope is also similar to those reported previously for smaller datasets.10,11 Nevertheless, we do not necessarily suggest at present that this allometric exponent is universally applied to all data from the flow-mediated dilation protocol. Rather, the analysis of covariance approach we detail in previous studies,10,11 and in the supplementary SPSS steps, is based on an allometric exponent that is unique to each dataset. This more ‘tailored’ approach is preferable to the ubiquitous selection of FMD% as the statistical outcome in all studies. The FMD% index is based on the allometric exponent being assumed to be a value of 1 in all studies and all samples.10,11
When two or more samples are being compared in terms of Dbase-adjusted flow-mediated response, it is important to derive the exponent from the statistical model itself rather than from the separate samples. The allometric exponent can be derived from this model when log-transformed Dpeak is selected as the outcome. However, we prefer Ddiff (on the logged scale) to be the outcome of interest because sample estimates from the model can then be back-transformed to represent ‘adjusted’ mean values of flow-mediated response. When logDdiff is the outcome, its parameter estimate derived from the statistical model does not represent the exponent as such. But if this parameter estimate is subtracted from 1, then this will represent the allometric exponent for the fundamental relationship between Dbase and Dpeak. For example, if the parameter estimate for the influence of logDbase on logDdiff is 0.06, then the allometric exponent would be 1 − 0.06 = 0.94. One can check whether this exponent is substantially and significantly different between samples by adding a logDbase × group interaction to the statistical model. In MESA and in our previous analyses, we have not found a substantial difference between samples in this respect. Moreover, Senn 23 has argued, in the context of randomised controlled trials, that analysis of covariance (ANCOVA) is still preferred over percentage change analyses, even if this assumption called ‘parallelism’ is violated.
The interpretation of FMD% data
Researchers have been well aware of the negative correlation between Dbase and FMD%, but awareness itself might not necessarily eradicate the problems it creates without the proper application of allometric principles. Instead of the Dbase–FMD% correlation being recognised as a fundamental scaling problem, various interpretative constraints seem to have been placed on FMD%, and/or it has been deemed necessary to consider differences in other variables in order to interpret FMD% reliably.1,16 For example, Corretti et al.
24
provided the following suggestions for coping with the Dbase-dependency problem:
Reporting absolute change in diameter will minimize this [the Dbase-dependency] problem … For studies in which comparisons are made before and after an intervention in the same individuals, percent change might be the easiest method to use if baseline diameter remains stable over time. However, the best policy may be to measure and report baseline diameter, absolute change and percent change in diameter.
It is unclear how the three variables mentioned in this coping strategy (Ddiff, Dbase and FMD%) should be weighted and combined to arrive at a reliable interpretation of FMD%. These complications and a ‘report everything’ tactic could be redundant if Ddiff is scaled correctly to Dbase using the most appropriate index in the first place.
Significance testing for Dbase stability
Corretti et al. 24 maintained that FMD% could be the most amenable index if ‘baseline diameter remains stable over time’. And it is a common practice amongst researchers on FMD% to test whether there are statistically significant differences between groups or repeated measures in Dbase. 25 First, even in placebo-controlled and randomised studies, checking whether baseline measurements differ significantly between samples is known to be an unsound and illogical approach to the analysis of change because a lack of significant difference cannot be treated as a proof of equivalence.10,11,23 Indeed, in a randomised trial one should not test for pre-intervention differences statistically, as any observed baseline imbalance must be due to chance, by definition. There will always be some degree of baseline imbalance because randomisation procedures do not guarantee exact equivalence, especially in small samples. Moreover, the ‘Dbase should not differ’ constraint is particularly unhelpful because Dbase is often substantially different between the very samples and interventions that researchers are interested in (e.g. clinical versus healthy cohorts).5,6
The problems of making the appropriateness of FMD% conditional on the stability of mean Dbase between samples or repeated measures can be demonstrated from the standpoint of statistical power. Let us assume that a mean difference in Dbase between the samples of interest is 0.2 mm. Only a sample size of 363 participants (in each sample) would have sufficient statistical power (90%) for this difference in Dbase to be deemed statistically significant (p < 0.05), assuming that the common standard deviation is 0.83 mm, as it is in MESA. Similarly, only a sample size of 75 would have 90% power to detect a mean pre–post change in Dbase of 0.2 mm, assuming that the correlation between pre–post measures is 0.8. Put another way, the 95% confidence limits for an observed mean pre–post change in Dbase of 0.2 mm would be an unreasonably wide −0.05 to 0.45 to arrive at a reliable inference, if there are typically 20 participants in an experiment. Using Dbase stability as a condition for judging the appropriateness of FMD% is clearly philosophically unsound. The ‘stability’ of Dbase would be almost guaranteed in many studies with relatively small sample sizes.
The influence of shear rate on the flow-mediated response
‘Normalisation’ of FMD% for variability in shear rate has also been considered as a general approach to interpreting differences in the flow-mediated response.1,26 Nevertheless, this practice seems academic if FMD% is not ‘normalising’ the flow-mediated response for variability in Dbase correctly in the first place. It is interesting that shear rate tends to be negatively correlated with Dbase, 16 which increases the chance that any correlation between FMD% and shear rate is spuriously influenced by Dbase as the ‘third variable’. The fact that Dbase is correlated to both shear and FMD%, and that all these variables are essentially measured at the same time, leads to an unclear causal pathway between shear rate and the flow-mediated response per se when FMD% is selected as the outcome in cross-sectional studies. Nevertheless, shear rate can be added as a covariate, together with Dbase (or indeed any other appropriate covariates), to an ANCOVA-based allometric model. As long as the influence of Dbase is adjusted for, using the allometric approach we detail,10,11 other covariates such as shear rate can be added to the same statistical model in order to explore whether there is significant contribution to explained variability in flow-mediated dilation. In this way, researchers would be exploring the true relationship between shear rate and the flow-mediated response per se. It seems logical that a Dbase-adjusted index of flow-mediated response is the primary unit of analysis, which can then also be adjusted for the influence of any other potential covariates. Unfortunately, shear rate was not measured in the MESA.
Covariate-adjusting FMD% itself for Dbase
Another suggestion in the literature for coping with the Dbase–FMD% correlation is adjusting FMD% itself for Dbase (or 1/Dbase) using ANCOVA. However, Dbase is already the denominator in the FMD% calculation.10,11 It is highly unusual to covariate-control a study outcome for another variable when that variable is already an inherent component of the study outcome. For example, it would be unusual for a researcher to covariate-adjust body mass index for its denominator, height-squared, or for maximal oxygen consumption (ml/kg/min) to be covariate-adjusted for the denominator, body mass. This practice might exacerbate the distributional problems of FMD%. It is the choice of FMD% as the outcome which could be the fundamental problem and not the proposed use of ANCOVA to adjust for covariates that influence flow-mediated dilation.
One relevant question is whether the use of Ddiff itself is preferable as the outcome of interest. Vickers 21 compared statistical bias and power between simple change scores, percentage changes and the use of ANCOVA, and found the latter approach to be superior in all circumstances. Vickers 21 confirmed that only the ANCOVA approach can provide generally consistent and unbiased estimates of change, especially when baseline measurements differ between samples.
Why is FMD% less repeatable than Dbase and Dpeak?
It has been reported that the test-retest repeatability of FMD%, as measured by the coefficient of variation (CV) statistic, can be markedly worse than that of Dbase and Dpeak. 17 There is a mathematical explanation for this observation. Specifically, measurement errors (or variances) can naturally propagate to increase markedly through the equation for FMD%. For example, using the statistical tool presented by John Pezulo (statpages.org/erpropgt.html), one can observe how typical measurement errors associated with the measurements of Dbase and Dpeak can mathematically propagate to a much larger measurement error for FMD%.
Measurements of Dbase and Dpeak are typically highly correlated (r = 0.992 in the MESA). Both these variables have a relatively low repeatability CV of 4–5%. 17 Nevertheless, these errors can propagate, first, through the calculation of Ddiff, then through the division of Ddiff by Dbase, and finally through the ×100 step to form the FMD% ratio. This error propagation can result in a CV of 25% for FMD%, which is similar to the CVs that are reported in the literature. 17 Again, it is important to consider mathematics alongside any physiological or protocol explanations for the relatively poor repeatability of FMD% compared with Dbase and Dpeak.
New examples of FMD% bias from the MESA
A Dbase-independent estimate of Ddiff is obviously the outcome of interest for endothelial function. What is clearly needed is a metric which accurately and specifically quantifies the ‘response’ that is fundamental to the flow-mediated dilation protocol. But FMD% overestimates endothelial function when Dbase is small and vice versa, thereby compromising study conclusions. Although an allometric exponent of 0.94 does not appear to be substantially different from 1.00, this exponent is part of a power function so that small differences between the true (0.94) and perceived (1.00) could lead to clinically important differences in estimates of differences in the flow-mediated response. Some new relevant examples to illustrate these differences are now presented from MESA. Full details of the proper Dbase-adjustment approach can be found in references 7 and 8. This approach has also been adopted to analyse the data in two other recent studies.8,27 The suggested steps in SPSS for comparing samples in terms of the Dbase-adjusted flow-mediated response are provided in a supplementary file.
Sex and age differences in the flow-mediated response
In MESA, the mean (SD) FMD% is 4.5% (3.1) in women and 3.8% (2.5) in men. However, the mean Dbase is approximately 1 mm lower in women versus men. When differences in Dbase are properly adjusted for, the ‘corrected’ FMD% is 3.5% (4.2) in women and 4.4% (4.2) in men, completely contrary to the FMD% results. In contrast to recent suggestions, 25 women in the MESA do not have better endothelial function than men across most age categories (Figure 3). Researchers may adjust FMD% for various potential covariates but this approach might be in vain if FMD% is the inappropriate outcome to select in the first place.
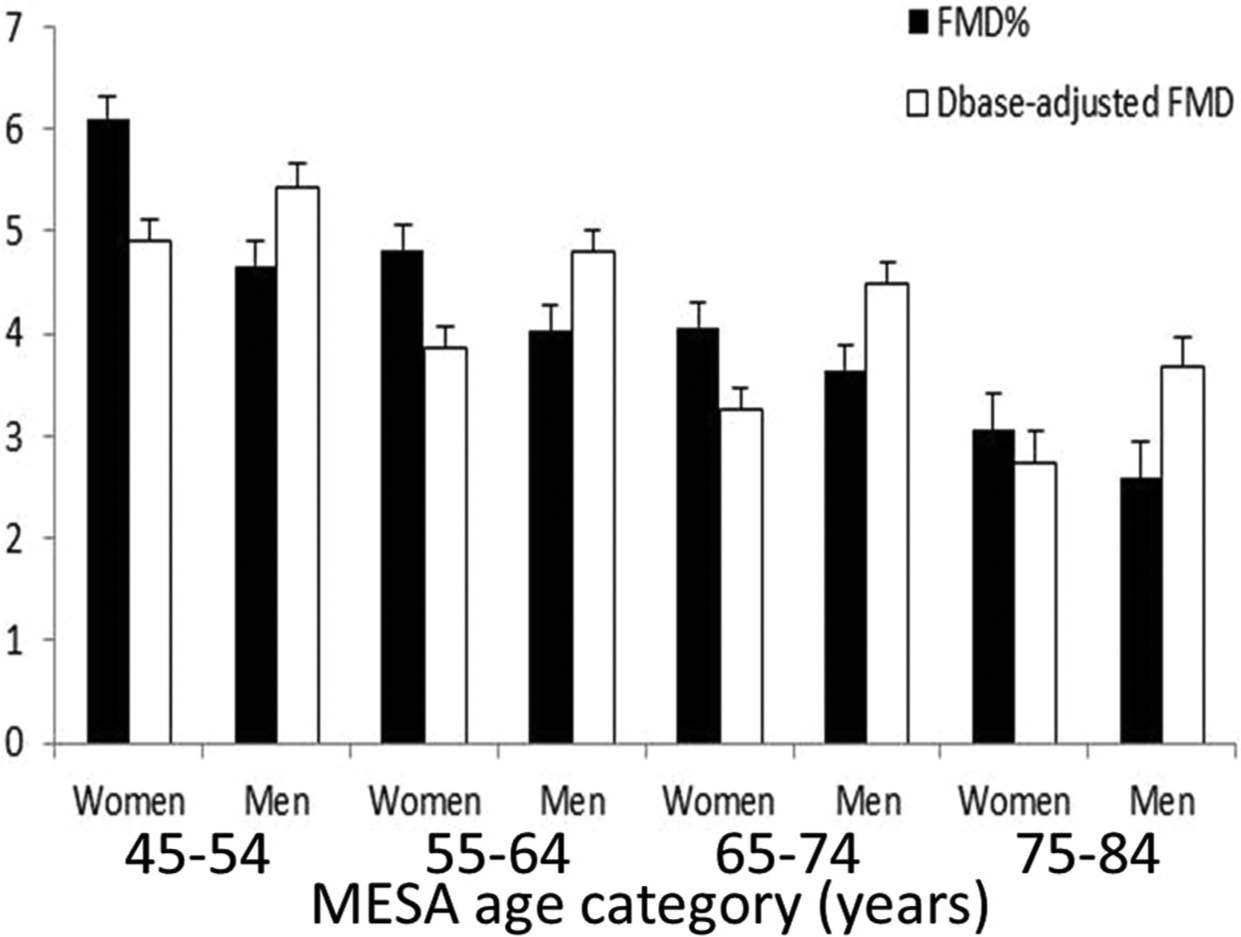
Mean (+95% CI) FMD% and allometric Dbase-adjusted FMD in the male and female age categories in MESA. Women do not necessarily have a higher flow-mediated response than men when the influence of Dbase is properly adjusted for.
The association between flow-mediated response and Framingham risk scores
Between the lowest and highest quartiles of FRS in the MESA subsample, the mean (SD) FMD% decreases from 5.6% (3.3) to 3.3% (2.2). Importantly, Dbase is 1 mm higher in the highest FRS quartile compared with the lowest quartile. Dbase-adjusted estimates of FMD% can be derived using the approach detailed in references 10 and 11, and these adjusted estimates of FMD% are 4.7% (3.0) and 3.7% (2.8) in the 1st and 4th quartiles, respectively, a difference of only 1 percentage point between the upper and lower quartiles. Here, the negative association between FRS and FMD% seems inflated because FMD% is dependent on Dbase, which is also positively associated with FRS.
The association between flow-mediated response and left ventricular mass index (LVMI)
In MESA, FMD% is negatively correlated with LVMI, 28 but the positive correlation between LVMI and Dbase is substantially stronger (Figure 4). Baseline artery diameter is also positively correlated to body surface area (even when adjusted for age and sex), and this is the denominator in the LVMI ratio (Figure 4). The dependency of FMD% on Dbase and the dependency of Dbase on body size clearly enters FMD% into the murky world of spurious correlations. A spurious correlation is one where an apparent correlation between x and y is actually explained by a third variable z, which is related to both x and y. There have also been other criticisms levelled at the scaling properties of LVMI. 29
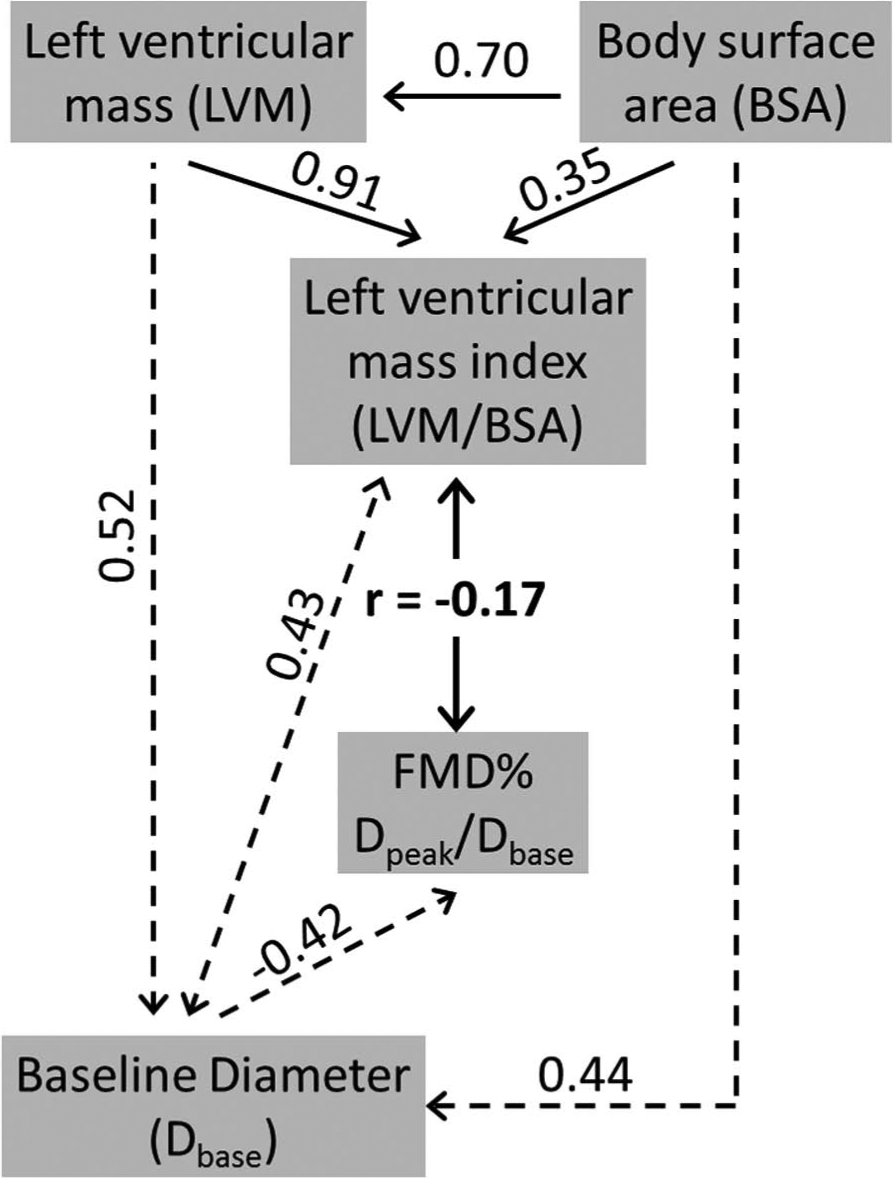
An example of a possibly spurious correlation between FMD% and another variable (left ventricular mass index) that is also correlated to Dbase. 28 A spurious correlation exists when a correlation between two variables is actually explained by both variables being correlated to a ‘third variable’, which in this case is Dbase. A greater left ventricular mass index (LVMI) is associated with a higher Dbase, which is the denominator of FMD%. Therefore, potential spuriousness could exist in the LVMI-FMD% correlation. LVMI is normalised (as a ratio) to BSA. If Dbase was also normalised in this way, spuriousness could be even worse due to another common covariate (BSA) being present in the x–y variables that are correlated.
The flow-mediated response and cardiovascular disease
Many studies have involved a comparison of FMD% between healthy people and people with cardiovascular disease. In prognostic studies, FMD% may be measured at baseline and then people are followed up to see if they develop a cardiovascular event.5,6 Typically, Dbase is also found to be higher in cases versus controls in these studies, and the MESA is no exception 6 (Table 1). The sample of people that did eventually develop ‘all-cause’ cardiovascular disease at the fourth follow-up in MESA had a mean FMD% at baseline that was almost 1% lower than those people who remained healthy (controls). Nevertheless, cases had a mean Dbase which was more than 0.3 mm higher than controls. As well as rendering the ‘Dbase should not be significantly different’ mantra redundant when interpreting FMD%, this higher Dbase biases the FMD% index. When proper allometric analyses are applied to these data,10,11 the difference in Dbase-adjusted flow-mediated response is less than half than that when FMD% is selected as the outcome (Table 1). This reduction in the difference in flow-mediated response between cases and controls obviously influences the general quantification of response that is deemed clinically significant. The FMD% index clouds the interpretation of the minimal clinically important difference in flow-mediated response.
Variables measured during the flow-mediated dilation protocol for people in MESA who did, and did not, develop all-cause cardiovascular disease.
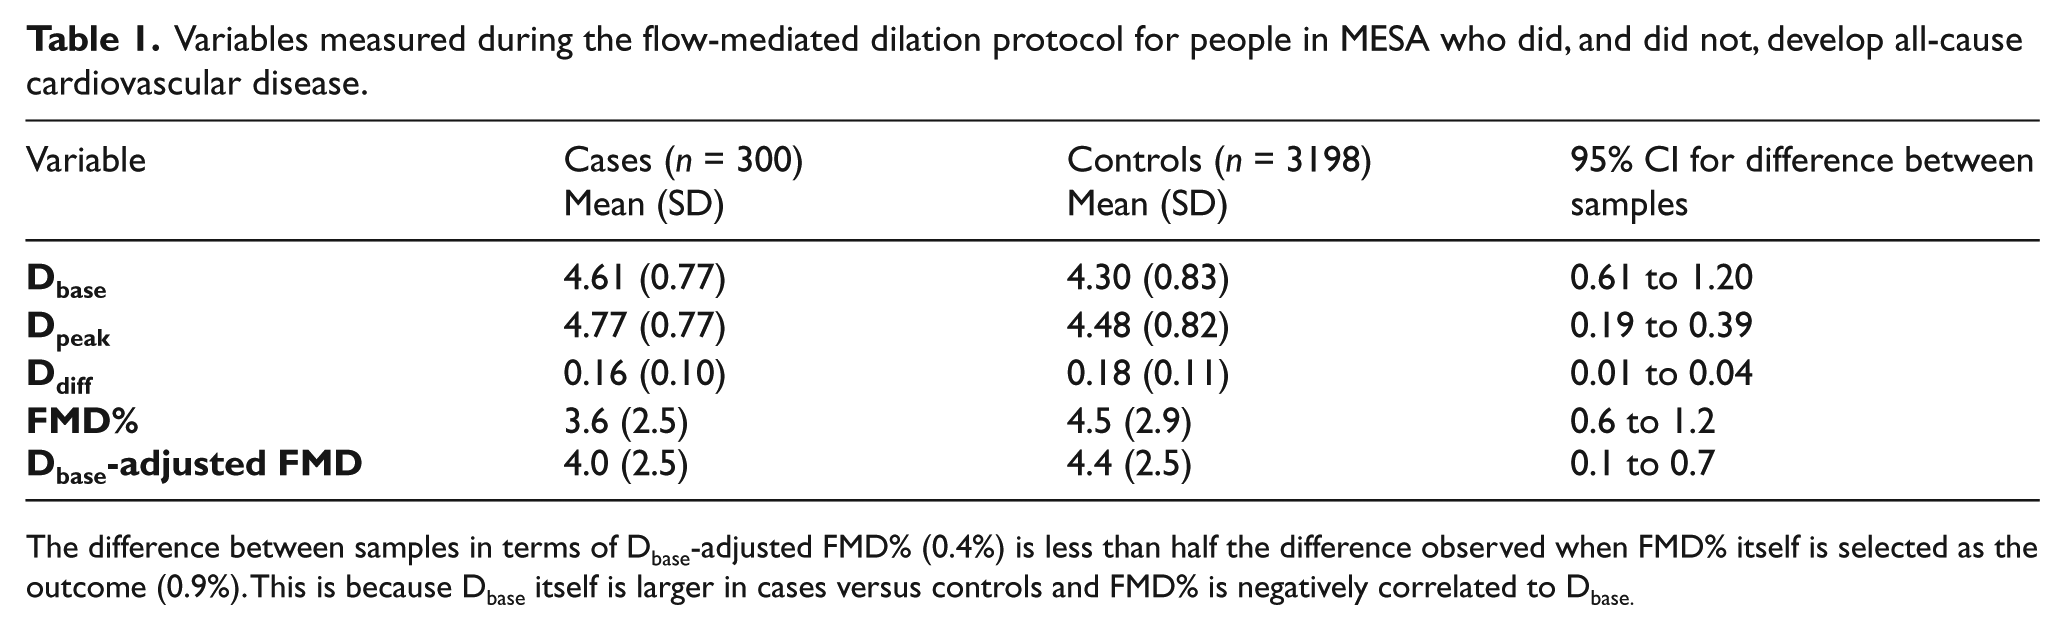
The difference between samples in terms of Dbase-adjusted FMD% (0.4%) is less than half the difference observed when FMD% itself is selected as the outcome (0.9%). This is because Dbase itself is larger in cases versus controls and FMD% is negatively correlated to Dbase.
Such differences in study conclusions between FMD% and properly scaled Ddiff might not occur all the time due to sampling error, especially in small studies. Nevertheless, these large-sample examples should encourage researchers to revisit study conclusions. Worryingly, many of the interventions suggested for improving endothelial function, including exercise and red wine for example, also mediate changes in Dbase.8,9
The causal pathway between FMD% and arterial morphological changes
An association has been reported between FMD% and the progression of structural arterial changes, especially those in carotid intima–media thickness (cIMT). 7 Such observations are used to support the notion that changes in FMD% precede changes in arterial morphological changes. However, it could be considered that a structural measure of the brachial artery (Dbase) is already inherent in the FMD% index, and this structural measure might be correlated to other structural measures in the carotid and/or coronary arteries.
In the MESA, four subsamples of participants can be formed on the basis of low-high values of cIMT. Between the lowest cIMT sample and the highest cIMT sample in the MESA, FMD% reduces from a mean of 5.2% to a mean of 3.5% as one would expect (p < 0.0005). Nevertheless, the mean Dbase is 4.1 mm in the lowest cIMT sample and 4.6 mm in the highest cIMT sample (p < 0.0005). Therefore, the Dbase-adjusted estimates of flow-mediated response become 4.9% and 3.8% for these samples, respectively, a much smaller difference of 1.1%. The Pearson’s correlation coefficient between cIMT and Dbase of 0.17 is larger than the correlations between cIMT and body mass, height and body mass index, and the same as the correlation between cIMT and waist circumference. Here, the door is opened to let spurious correlations cloud the interpretation of the relationship between cIMT and FMD%.
Halcox et al. 7 reported that Dbase is also related to the progression in cIMT, but data were not presented and this finding was not discussed nor is it often cited in the literature. Unfortunately, cIMT was only measured in the MESA at baseline, and not at the follow-up times, but these relationships between cIMT, FMD%, Dbase and measures of body size demonstrate the importance of accounting for scaling influences when FMD% is correlated to structural arterial variables.
The prognostic value of FMD%
If FMD% predicts cardiovascular disease, then this might provide good reason to measure it in clinical practice and undertake research on it. The FMD% index and Ddiff seem to be the most common exposure variables investigated for predictive value, although a greater focus towards Dbase is emerging.5,6 The influence of Dbase is not necessarily a simple issue of normalisation because Dbase is, itself, predictive of progression of atherosclerosis and future cardiovascular disease.5 –7 Therefore, a question of interest, which is important to answer in the context of translational physiology, 30 is whether Dbase supplies at least the same clinical usefulness as FMD%. Factors influencing the translation of a physiological exposure to public health include cost of equipment and technical training, level of expertise required, amount of discomfort associated with measurement and the error associated with these measurements. All these factors are ‘worse’ for the measurement of FMD% compared with Dbase.
In Table 2, we present a summary of all the prognostic-type studies that were recently meta-analysed by Inaba et al. 31 It can be seen that the consideration of Dbase, and how it is built into any analyses, varies greatly between studies. More than half of the studies do not report any details about how the influence of Dbase was accounted for. Four of the studies seem not to report any information about Dbase at all. In the study by Yeboah et al., 5 the prognostic value of Dbase was examined after expressing it relative to the height of the participant. Nevertheless, this same body size adjustment approach was not applied to FMD%. If a lack of adjustment for the influence of Dbase generally leads to inflated estimates of sample differences in endothelial function, then the minimal clinically important difference in flow-mediated response becomes less clear. In one recent study, the mean difference in Dbase-adjusted flow-mediated response between ‘binge drinkers’ and controls can be estimated to be only a third as large as the mean difference in FMD% between samples (0.75% vs 2.6%). 32
Information relevant to Dbase and its influence in the studies meta-analysed by Inaba et al. 31
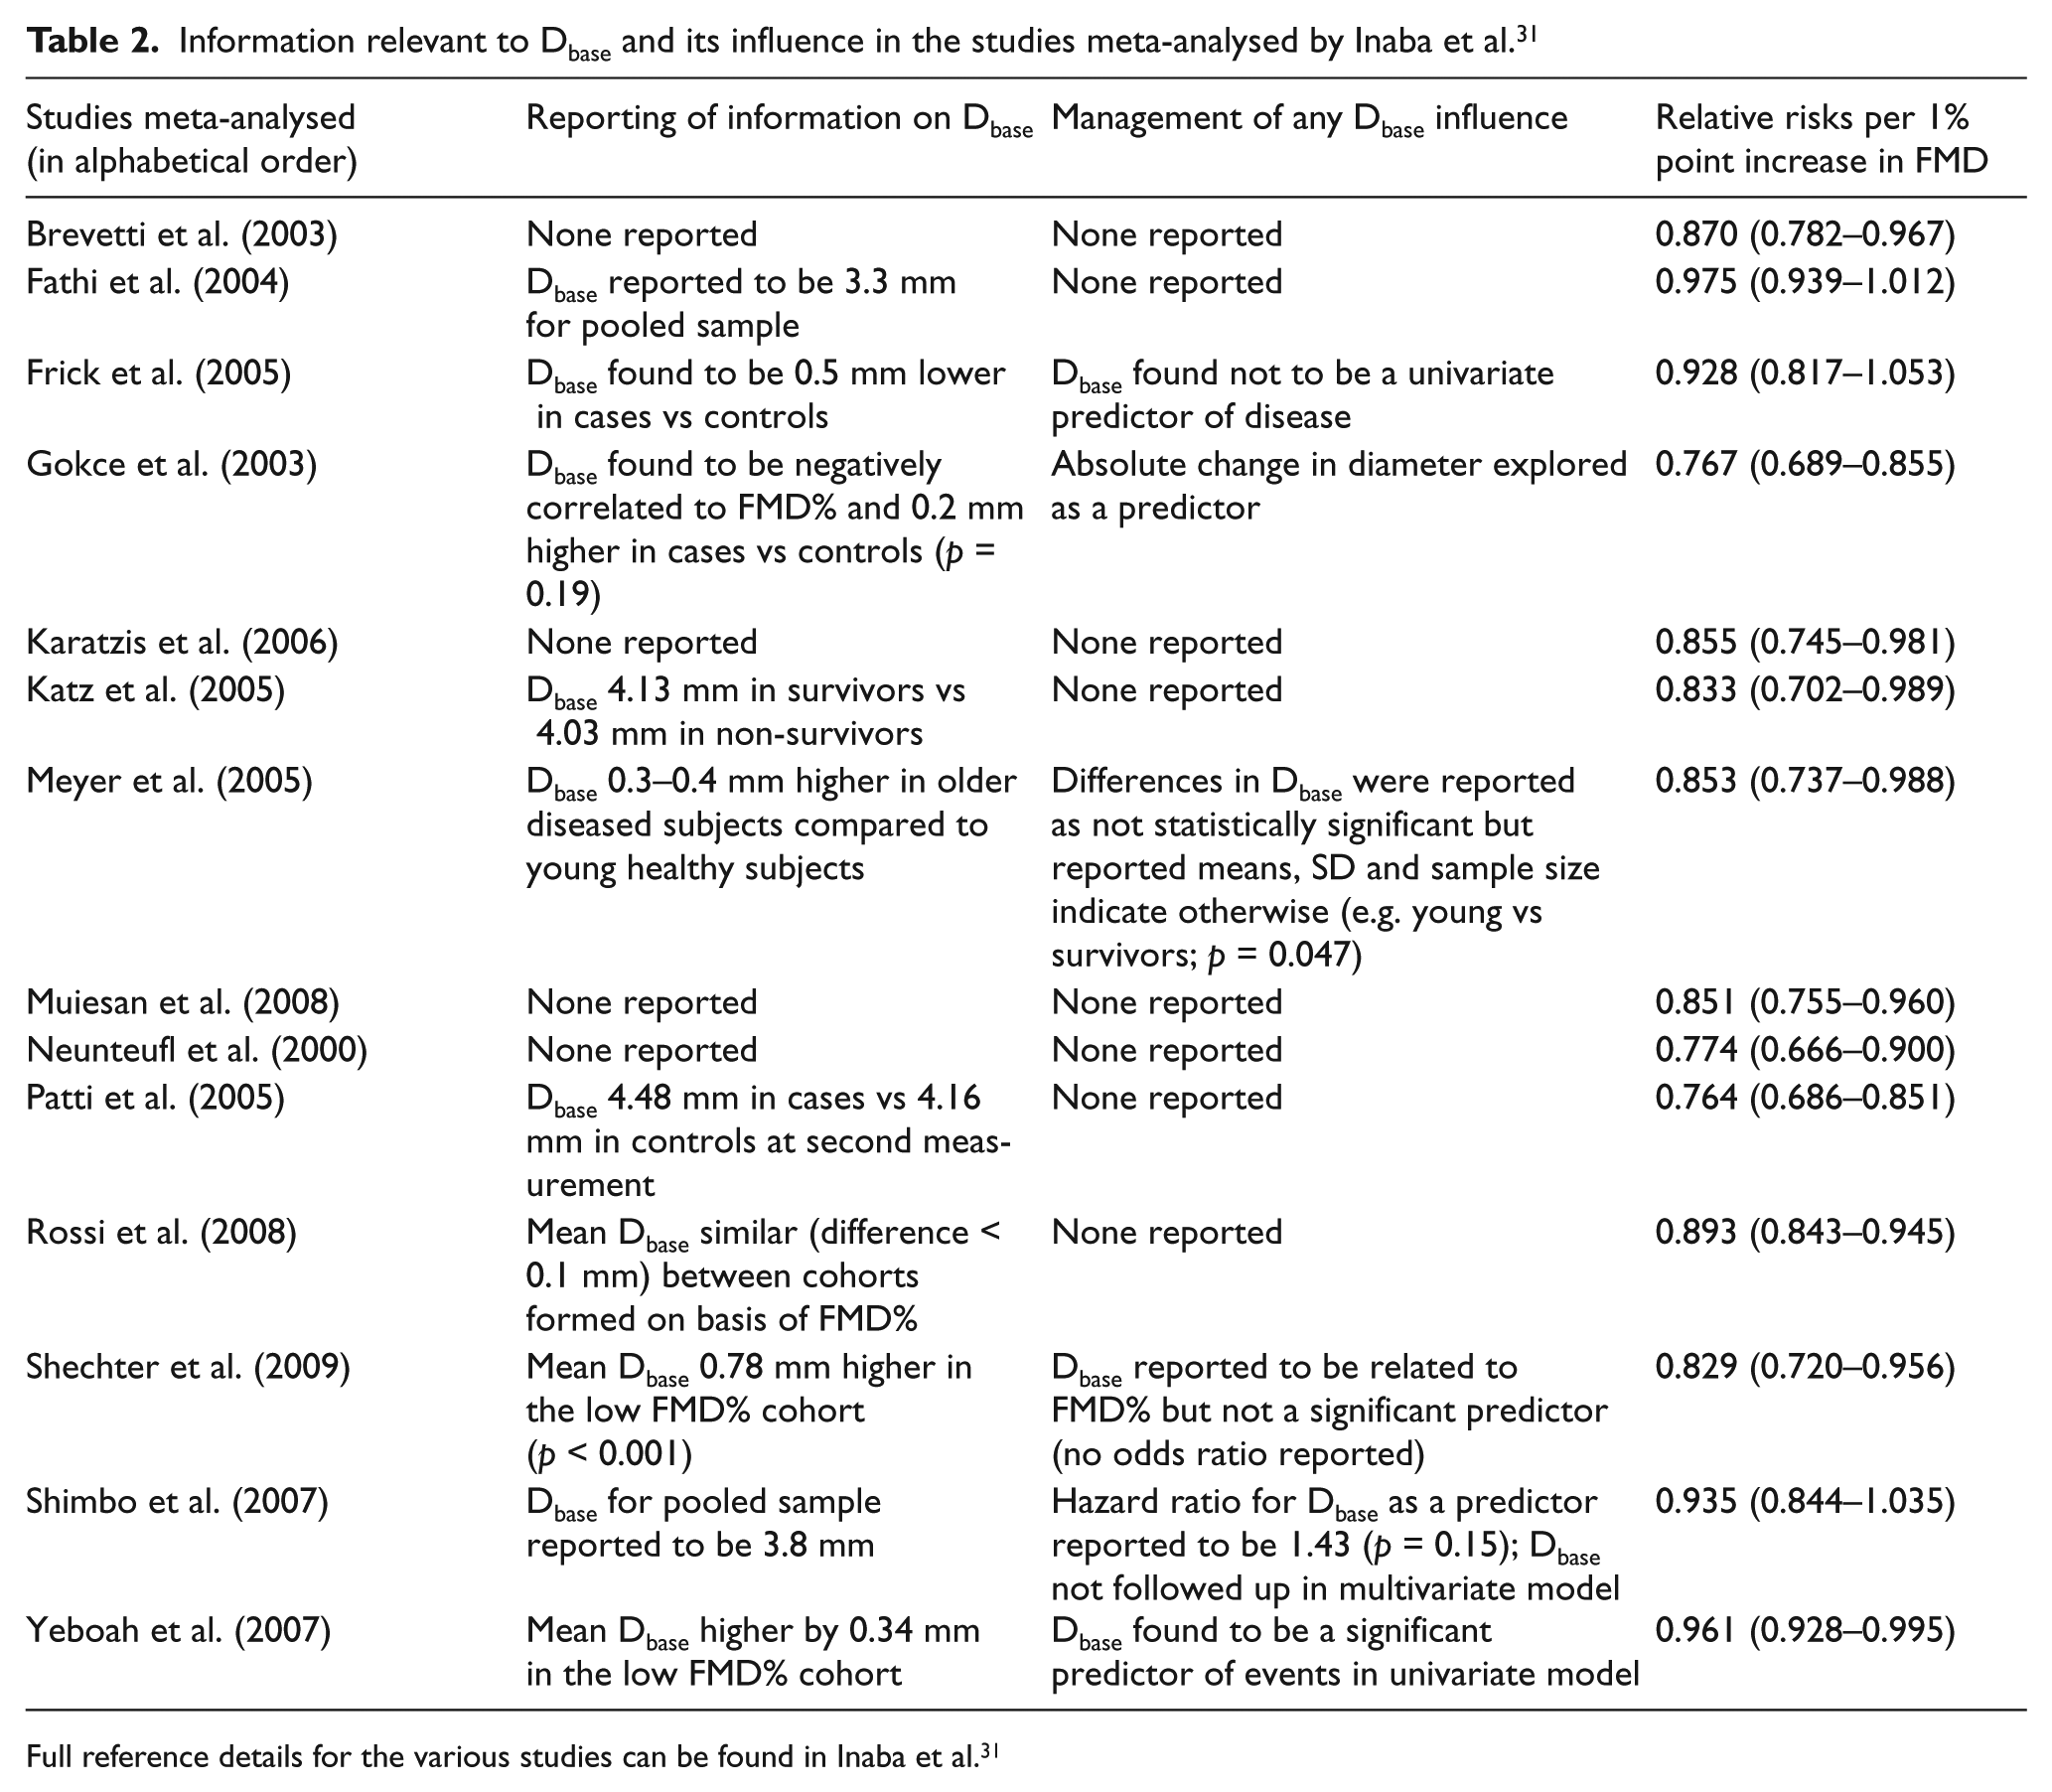
Full reference details for the various studies can be found in Inaba et al. 31
It is clear that the scaling problems of FMD% are, again, pivotal for unravelling the causal pathway and prognostic value of the flow-mediated response. Even if FMD% predicts cardiovascular disease, one does not know whether the important prognostic component of FMD% is properly scaled Ddiff per se (i.e. endothelial function) or the Dbase that explains much of the variability in FMD%. It is also possible that Dbase and Ddiff (adjusted for the influence of Dbase) combine to render FMD% a ‘hybrid’ index that is predictive of cardiovascular disease. These three possible causal pathways involving the exposure of FMD% are presented in Figure 5. It is of overriding importance to know whether it is Dbase and/or Dbase-adjusted Ddiff that explains the predictive value of FMD%. Given that Dbase is easier to measure with better reproducibility than FMD%, and is known to be predictive of cardiovascular events already (without being mathematically coupled to any other variable in its calculation), the predictive component of the Dbase-adjusted flow-mediated response should be isolated and quantified.5,6
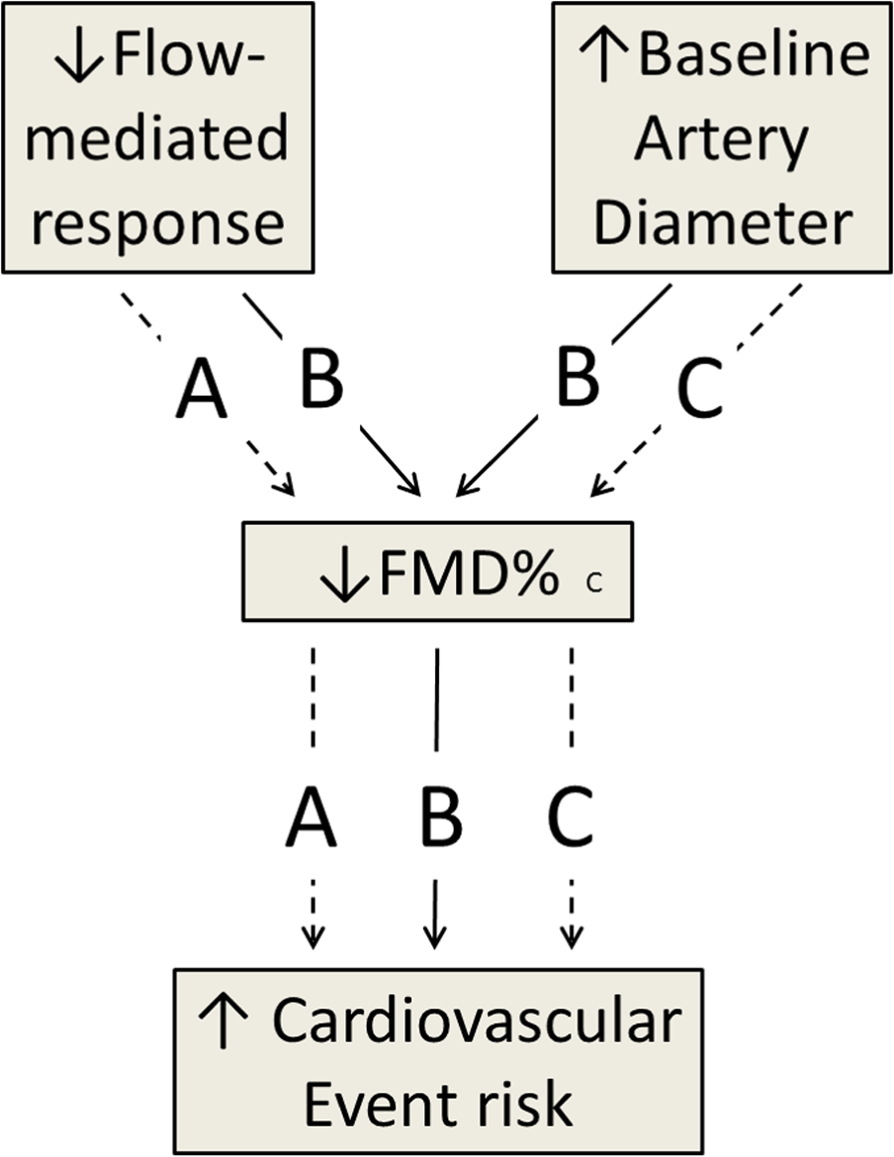
A causal pathway showing the ambiguity in how FMD% might be predictive of a cardiovascular event.
We hope that the information presented in this review can inform a future study on the prognostic value of a measure of the flow-mediated response that is free from the influence of Dbase. It is proposed that Dbase-adjusted Ddiff derived from an ANCOVA model provides a more representative and statistically parsimonious indicator of endothelial function.7,8 For the analysis of the prognostic value of the flow-mediated response, Ddiff (on a logarithmic scale) could first be modelled properly to logarithmically transformed Dbase. The residuals from this model would then correspond to properly scaled Dbase-adjusted diameter change, 15 which could then be entered as a predictor in a Cox regression analysis of a large dataset with a relatively long follow-up duration. Other covariates, selected using directed acyclic graphs (DAG), 33 could also be included in the statistical model. This important process of selection of covariates would need careful consideration prior to any prognostic-type study. We note that a DAG has not yet been formulated for the flow-mediated response or Dbase. Such important considerations in a future prognostic-type study would help to elucidate whether the flow-mediated response per se has sufficient predictive value and clinical significance.
Conclusions and recommendations
Percentage flow-mediated dilation is the ubiquitously selected index for quantifying the flow-mediated arterial response. In all the relevant studies, researchers use sample estimates of FMD% in order to arrive at population inferences, ultimately to inform clinical significance and practice. The present review is relevant to all such studies.
The FMD% index relies on the assumption that the flow-mediated response increases as a constant proportion of Dbase. The FMD% index is mathematically equivalent to the ratio of Dpeak/Dbase 1 , where 1 is the allometric size-scaling exponent that is ubiquitous across all samples. The presence of Dbase as the denominator in the FMD% ratio is clearly an attempt to normalise the flow-mediated response to initial artery size.
For the first time, we have analysed a very large sample of FMD% data (n = 3499) from an allometric perspective. We have found that the increase in flow-mediated response is neither constantly nor directly proportional to Dbase, irrespective of age, sex, race/ethnicity and disease status in the MESA.
Because of the incongruity between the true scaling properties of the flow-mediated response and how FMD% describes that response, FMD% actually mediates a moderate-to-large dependency on Dbase. A negative correlation between FMD% and Dbase can be obtained with randomly generated data where there is no physiological link at all between Dbase and Ddiff.
An allometric model involving the flow-mediated response (on a log scale) as the outcome and Dbase (log-transformed) as a covariate can completely eradicate the problem of Dbase dependency. This is analysis of covariance, which is a common approach in medical research and available in most statistical software packages.
The complete eradication of Dbase-dependency with the allometric-based approach is achieved without the need for shear rate normalisation, although the the need for shear rate normalisation, although the important influence of shear rate on the flow-mediated response can still be quantified with the allometric model.
The complete eradication of Dbase-dependency means that secondary scrutiny of sample differences in Dbase and/or absolute flow-mediated change is not necessary. There would be no need for researchers to discount the influence of Dbase on the basis of a non-significant hypothesis test; a practice which has been much criticised by statisticians.
Retaining FMD% as the study outcome and covariate-adjusting statistical models by Dbase is illogical in allometric terms, since Dbase is already the denominator of FMD%. This approach would be unacceptable in other similar contexts (e.g. a researcher adjusting statistical models for height or height 2 when body mass index (kg/m2) is the outcome of interest).
We have presented new examples from MESA to show how the incongruous scaling properties of FMD%, and the associated dependency on Dbase, bias conclusions regarding the influence of age, sex, left ventricular mass, Framingham risk score and disease status on the flow-mediated response. FMD% typically overestimates differences in endothelial function between samples, thus clouding the minimal clinically important difference in flow-mediated response.
We posit that use of the FMD% index, and associated dependency on Dbase, clouds knowledge about the causal pathway between the flow-mediated responses and disease outcome. This is because Dbase itself predicts future cardiovascular disease and intermediary outcomes such as the yearly progression in cIMT. While it may appear appealing that the prognostic value of Dbase and the flow-mediated response ‘come together’ into an integrated exposure variable, it is imperative to establish whether Dbase has at least the same clinical significance as the flow-mediated response, especially since Dbase is inherently more repeatable than FMD% (due to mathematical error propagation) and easier to measure than the flow-mediated response.
Footnotes
Appendix
Acknowledgements
Declaration of conflicting interest
The authors declare that there are no conflicts of interest.
Funding
This manuscript was prepared using the Multi-Ethnic Study of Atherosclerosis (MESA) research materials obtained from the NHLBI Biologic Specimen and Data Repository Information Coordinating Center and does not necessarily reflect the opinions or views of the MESA or the NHLBI. MESA was supported by contracts N01-HC-95159 through N01-HC-95169 from the National Heart, Lung, and Blood Institute and by grants UL1-RR-024156 and UL1-RR-025005 from the National Center for Research Resources (NCRR).