
Abstract
Current guidelines recommend obtaining an ankle–brachial index (ABI) to screen for peripheral artery disease (PAD) in subjects at risk. Previous work demonstrated that a combination of β2-microglobulin, cystatin C, high-sensitivity C-reactive protein and glucose was associated with PAD. This study evaluated the ability of these biomarkers combined with clinical parameters to predict PAD in at-risk subjects. This study enrolled 1025 subjects from 99 primary care clinics who were smokers and/or diabetics ≥ 50 years or any individual ≥ 70 years. Consented subjects underwent a clinical assessment, fasting blood draw, and an ABI measurement with PAD defined as an ABI < 0.90 in either leg. The biomarkers and their interactions were evaluated using logistic regression and performance was evaluated at a cut point of the biomarker panel selected to maximize sensitivity while minimizing the false positive rate of the test. Of the 1025 subjects enrolled, 46 did not meet the ABI or other criteria for inclusion in the analysis. Among the evaluable subjects (n = 979), PAD was detected in 83 (8.5%). The model had a C-statistic of 0.73 (95% CI 0.67–0.79). There were 20 patients with PAD who were judged to be at low to moderate risk for cardiovascular events by clinical assessment; the model correctly identified 17 of these 20 patients. The model also performed well in subjects with no prior history of PAD. Thus, a biomarker panel may have a role for identifying PAD.
Keywords
Introduction
Peripheral artery disease (PAD) accounts for a large segment of the population of patients with cardiovascular disease, present in 28% of the patients with cardiovascular disease in an international survey from primary care clinics. 1 Patients with PAD have a systemic atherosclerotic burden that is associated with a high risk of cardiovascular events including myocardial infarction, ischemic stroke, and death. 2 Components that drive this risk include the individual’s clinical risk factor profile, as well as the hemodynamic severity of the disease in the limb. 3 Thus, clinical cardiovascular risk stratification is enhanced when information about PAD is included in the Framingham Risk Score (FRS) calculation. 3 In addition, all patients with PAD have lower extremity physical limitations and functional impairments that greatly reduce overall physical capacity, daily quality of life and ambulatory activities. 4 The hemodynamic severity of the limb is also correlated with these functional limitations. 5
The clinical detection of PAD has limited accuracy. A claudication questionnaire or pulse exam has very low sensitivity (but high specificity) for PAD.6,7 Thus, the preferred non-invasive diagnostic test is the ankle–brachial index (ABI), which is the ratio of systolic pressure in the ankle to the arm. The ABI is inversely correlated with cardiovascular risk and all-cause mortality. This risk is independent and additive to that determined by clinical risk factors alone. Thus, an abnormal ABI can be used to identify a population of patients at high risk for cardiovascular events. In addition, the ABI is correlated with functional decline over time defined by the 6-minute walk distance. 8 Lower ABI values are also associated with greater physical impairments no matter what the symptomatic stage of the disease.9,10
Based on numerous observations on the utility of the ABI, the ACC/AHA guidelines give a Class 1B recommendation for its use in the screening and evaluation of patients for PAD. 11 Individuals currently considered for ABI screening would include those over the age of 65 years; those ≥ 50 years with a history of diabetes or smoking; or those who have limb symptoms. These recommendations are based on the clinical utility of this information for patient management decisions including use of intensive risk factor modification therapies, antiplatelet drugs, and treatment strategies to improve exercise performance and physical functioning. These issues often go unattended in this population and therefore ABI screening also raises awareness of the importance of PAD and its consequences. 12 Despite the utility of the ABI measurement, the ABI is rarely performed in clinical practice because it can be burdensome and requires technical expertise in order to obtain proper pressure measurements. 13
A number of biomarkers have been found to be elevated in patients with PAD, including markers of inflammation and renal function.14 –18 This information has led to investigations evaluating whether a biomarker panel could be an effective screen for PAD; a concept that has been supported in several publications. Biomarkers of particular interest include β2-microglobulin, cystatin C, and high-sensitivity C-reactive protein (hsCRP), as these markers have been associated with PAD. 19 However, the utility of a biomarker profile has not been formally tested in a broad, at-risk population.
The current study tested the hypothesis that a biomarker panel could be developed and validated for use in identifying patients with PAD who are predisposed based on well-defined risk factors of diabetes, smoking and age. For such a biomarker panel to be useful, it would have to provide additional diagnostic accuracy over and above clinical information alone and in subjects with no prior history of PAD. In this context, the FRS was used to identify subsets of the enrolled subjects at low, moderate and high risk for cardiovascular events. Since subjects at high FRS risk would warrant maximal medical therapy, ABI screening to detect PAD as a further risk stratification may not be necessary. Thus, the utility of the biomarker panel to identify subjects in need of ABI screening was further evaluated in the FRS low and moderate populations. The following study reports the results of an initial clinic population-based study to evaluate a biomarker panel to detect PAD.
Methods
Design
This multi-center, non-interventional trial recruited men and women from 99 family practice or internal medicine clinics throughout the United States. Patients were referred to one of 11 regional clinical research centers for evaluation, consent, and other study procedures. The protocol was approved by all applicable Institutional Review Boards, and all subjects provided informed consent before completion of any study procedures. The trial was registered at ClinicalTrials.gov (NCT01336426).
Patients were eligible for the study if they were ≥ 50 years of age and were current or former smokers and/or had a history of type 2 diabetes (meeting American Diabetes Association criteria), or if they were ≥ 70 years of age, regardless of diabetes or smoking status. Major exclusion criteria (assessed by available medical history and subject self-report) included a documented history of significant hepatic or renal insufficiency, severe liver disease or chronic hepatitis within the past 6 months, active viral or bacterial infection, active inflammatory conditions requiring treatment with systemic steroids or immune modulating therapy, and active malignancy requiring active anti-neoplastic therapy. Enrolled subjects underwent an initial visit for assessment of inclusion/exclusion criteria, history and recording of vital signs, a fasting blood draw, and an ABI measurement.
Ankle–brachial index measurement
Site staff were trained and approved to perform the ABI procedure using standardized techniques before the start of enrollment. ABI measurements were performed after at least 10 minutes of rest in a supine position. A 5–10 MHz Doppler and appropriately sized arm and ankle cuffs were used to measure systolic pressures in the dorsalis pedis and posterior tibial arteries in each ankle, as well as the brachial arteries in each arm. Two measurements were taken at each vessel and the mean value for that vessel was used to calculate the ABI. The ABI for each leg was calculated by dividing the higher of the two ankle readings in each leg by the higher of the two brachial readings. This resulted in an ABI calculation for each leg, with PAD defined by the leg with the lower ABI that was < 0.90. A subject with an ABI > 1.40 was excluded from the analysis population because further testing would be necessary to determine PAD status. A subset of 43 patients (20 with PAD; 23 without PAD) returned for a follow-up visit to determine the reproducibility of the ABI measurement. This visit was completed within 5–8 days after the initial procedures were completed. The reproducibility of the measurement demonstrated an absolute median difference of 0.040 in the ABI value in all subjects (0.030 in PAD and 0.045 in controls). The baseline ABI value was used to determine PAD status, regardless of ABI value on follow-up visits.
Framingham Risk Score and prior history of PAD
The FRS, which has been validated as a predictor of cardiovascular morbidity and mortality, includes the clinical variables of age, sex, cholesterol levels, blood pressure, diabetes and family history. 20 The FRS assessment was calculated based on available data obtained from all subjects at baseline. The FRS was utilized to risk-stratify the study population for the purposes of determining how the biomarker panel would perform among the low and medium FRS risk groups. The rationale was that when the ABI is used as a means to detect subclinical atherosclerosis, it would have the greatest utility in low to moderate risk individuals for whom more invasive or expensive screening may not routinely be considered. A formal claudication questionnaire was not performed.
Analytic techniques
Blood samples were processed, aliquotted, stored in a biorepository at −65°C to −85°C and shipped to a central lab (Quest Diagnostics, Chantilly, VA, USA) for batch processing for analysis of hsCRP, β2-microglobulin, cystatin C, and fasting glucose using automated clinical chemistry systems (Olympus 5400 and 640, Roche Integra, and Siemens BNII).
Sample size
The study was powered to estimate the parameters necessary to construct the PAD test risk equation in the training sample using two-thirds of the population and to validate this equation in the remaining one-third. Simulation studies have shown that 10 events (cases of PAD defined as ABI < 0.90) per variable are sufficient to control the Type I error rate and bias in a logistic regression used for prediction. With multiple biomarkers, six interactions among the biomarkers were possible for a total of 10 parameters to be estimated and tested in the logistic model. The models controlled for the study entry criteria and their interactions. These study design variables remained in some of the models regardless of statistical significance and are therefore not considered as additional parameters that would have required additional cases of PAD. Note that only interactions with a biological basis were tested. To test all 10 parameters, at least 100 cases of PAD would be required.
Statistical analyses
Multiple biomarkers and their interactions were evaluated using logistic regression to predict the probability of PAD. The univariate analyses included hsCRP, β2-microglobulin, cystatin C, and fasting glucose level. Next, multivariate models were developed in a randomly selected two-thirds of the evaluable population. The final equation from each of these four models was then independently validated in the remaining one-third of the evaluable population. Only the final most robust models, built on the training set, were compared by their area under the curves (AUCs) on the validation set. The model results are shown for the entire evaluable population. Some of the variables were replaced with new, iteratively derived optimal transformation variables that fit a particular model better than the original variable. Receiver operator curves (ROCs) were constructed and the results were used to generate a numeric score to assess the ability of the model to predict the probability of PAD. All training and validation analyses were pre-specified and only one model was produced for each combination of biomarkers and clinical variables. Step-wise logistic regression models were then prospectively developed that included the primary factors and their interaction terms for: (1) biomarkers alone, (2) FRS alone, (3) biomarkers + age, (4) biomarkers + age + smoking (dichotomous), (5) biomarkers + age + smoking (dichotomous) + glucose, and (6) a simplified model of hsCRP, β2-microglobulin, cystatin C, age and smoking (dichotomous).
The utility of a biomarker test would be greatest in subjects not suspected as having an underlying cardiovascular condition or risk. Therefore, additional analyses were performed (similar to above) in subjects with low to moderate FRS, given that PAD is often unrecognized in these subjects. 21 Additionally, an analysis was performed by excluding subjects with a prior history of PAD defined as a history of PAD or taking a claudication medication (cilostazol or pentoxifylline).
Results
Assuming a PAD prevalence of 20%, a study size of 600 subjects divided into 400 subjects in the training set and 200 in the validation set would yield > 100 PAD subjects required to train and validate a model based on 10 potential input parameters. However, during the study, the prevalence of PAD was determined to be less than predicted. Therefore, enrollment was extended beyond the originally proposed sample size of 600 to increase the number of evaluable PAD cases. Thus, a total of 1036 subjects were screened with 1025 signing informed consent. Forty-six subjects were subsequently excluded from the analysis population leaving a total of 979 evaluable subjects that included those who had complete data for ABI and biomarkers. The reasons for exclusion after consent included 36 subjects who did not meet ABI criteria (32 had an ABI > 1.40 in one or both legs) and four who did not have a recorded ABI value. An additional four subjects did not meet the inclusion/exclusion criteria, four did not have biomarker results, and two subjects had data recorded outside of the study window. One subject in the PAD group was included as a protocol deviation regarding their smoking history. Among the 979 evaluable subjects, PAD was detected in 83 (8.5%).
Tables 1a and 1b (PAD subjects and control subjects, respectively) show the baseline demographics and clinical characteristics of the evaluable population. PAD subjects had a mean ABI of 0.75 ± 0.11while controls had a mean value of 1.10 ± 0.10. PAD subjects were older and had a higher proportion of current and former smokers (and a correspondingly lower proportion of never smokers) than controls. The prevalence of diabetes was 63.6% in PAD and 63.9% in controls (p = 0.97). Levels of cystatin C and β2-microglobulin were significantly elevated in the PAD subjects while hsCRP and glucose levels were similar between groups. The univariate association for each biomarker with PAD is shown in Table 2. The strongest associations with PAD were for β2-microglobulin and cystatin C, with a more moderate association for hsCRP, while glucose did not associate with PAD.
Summary of demographics, vital signs and biomarkers: PAD group
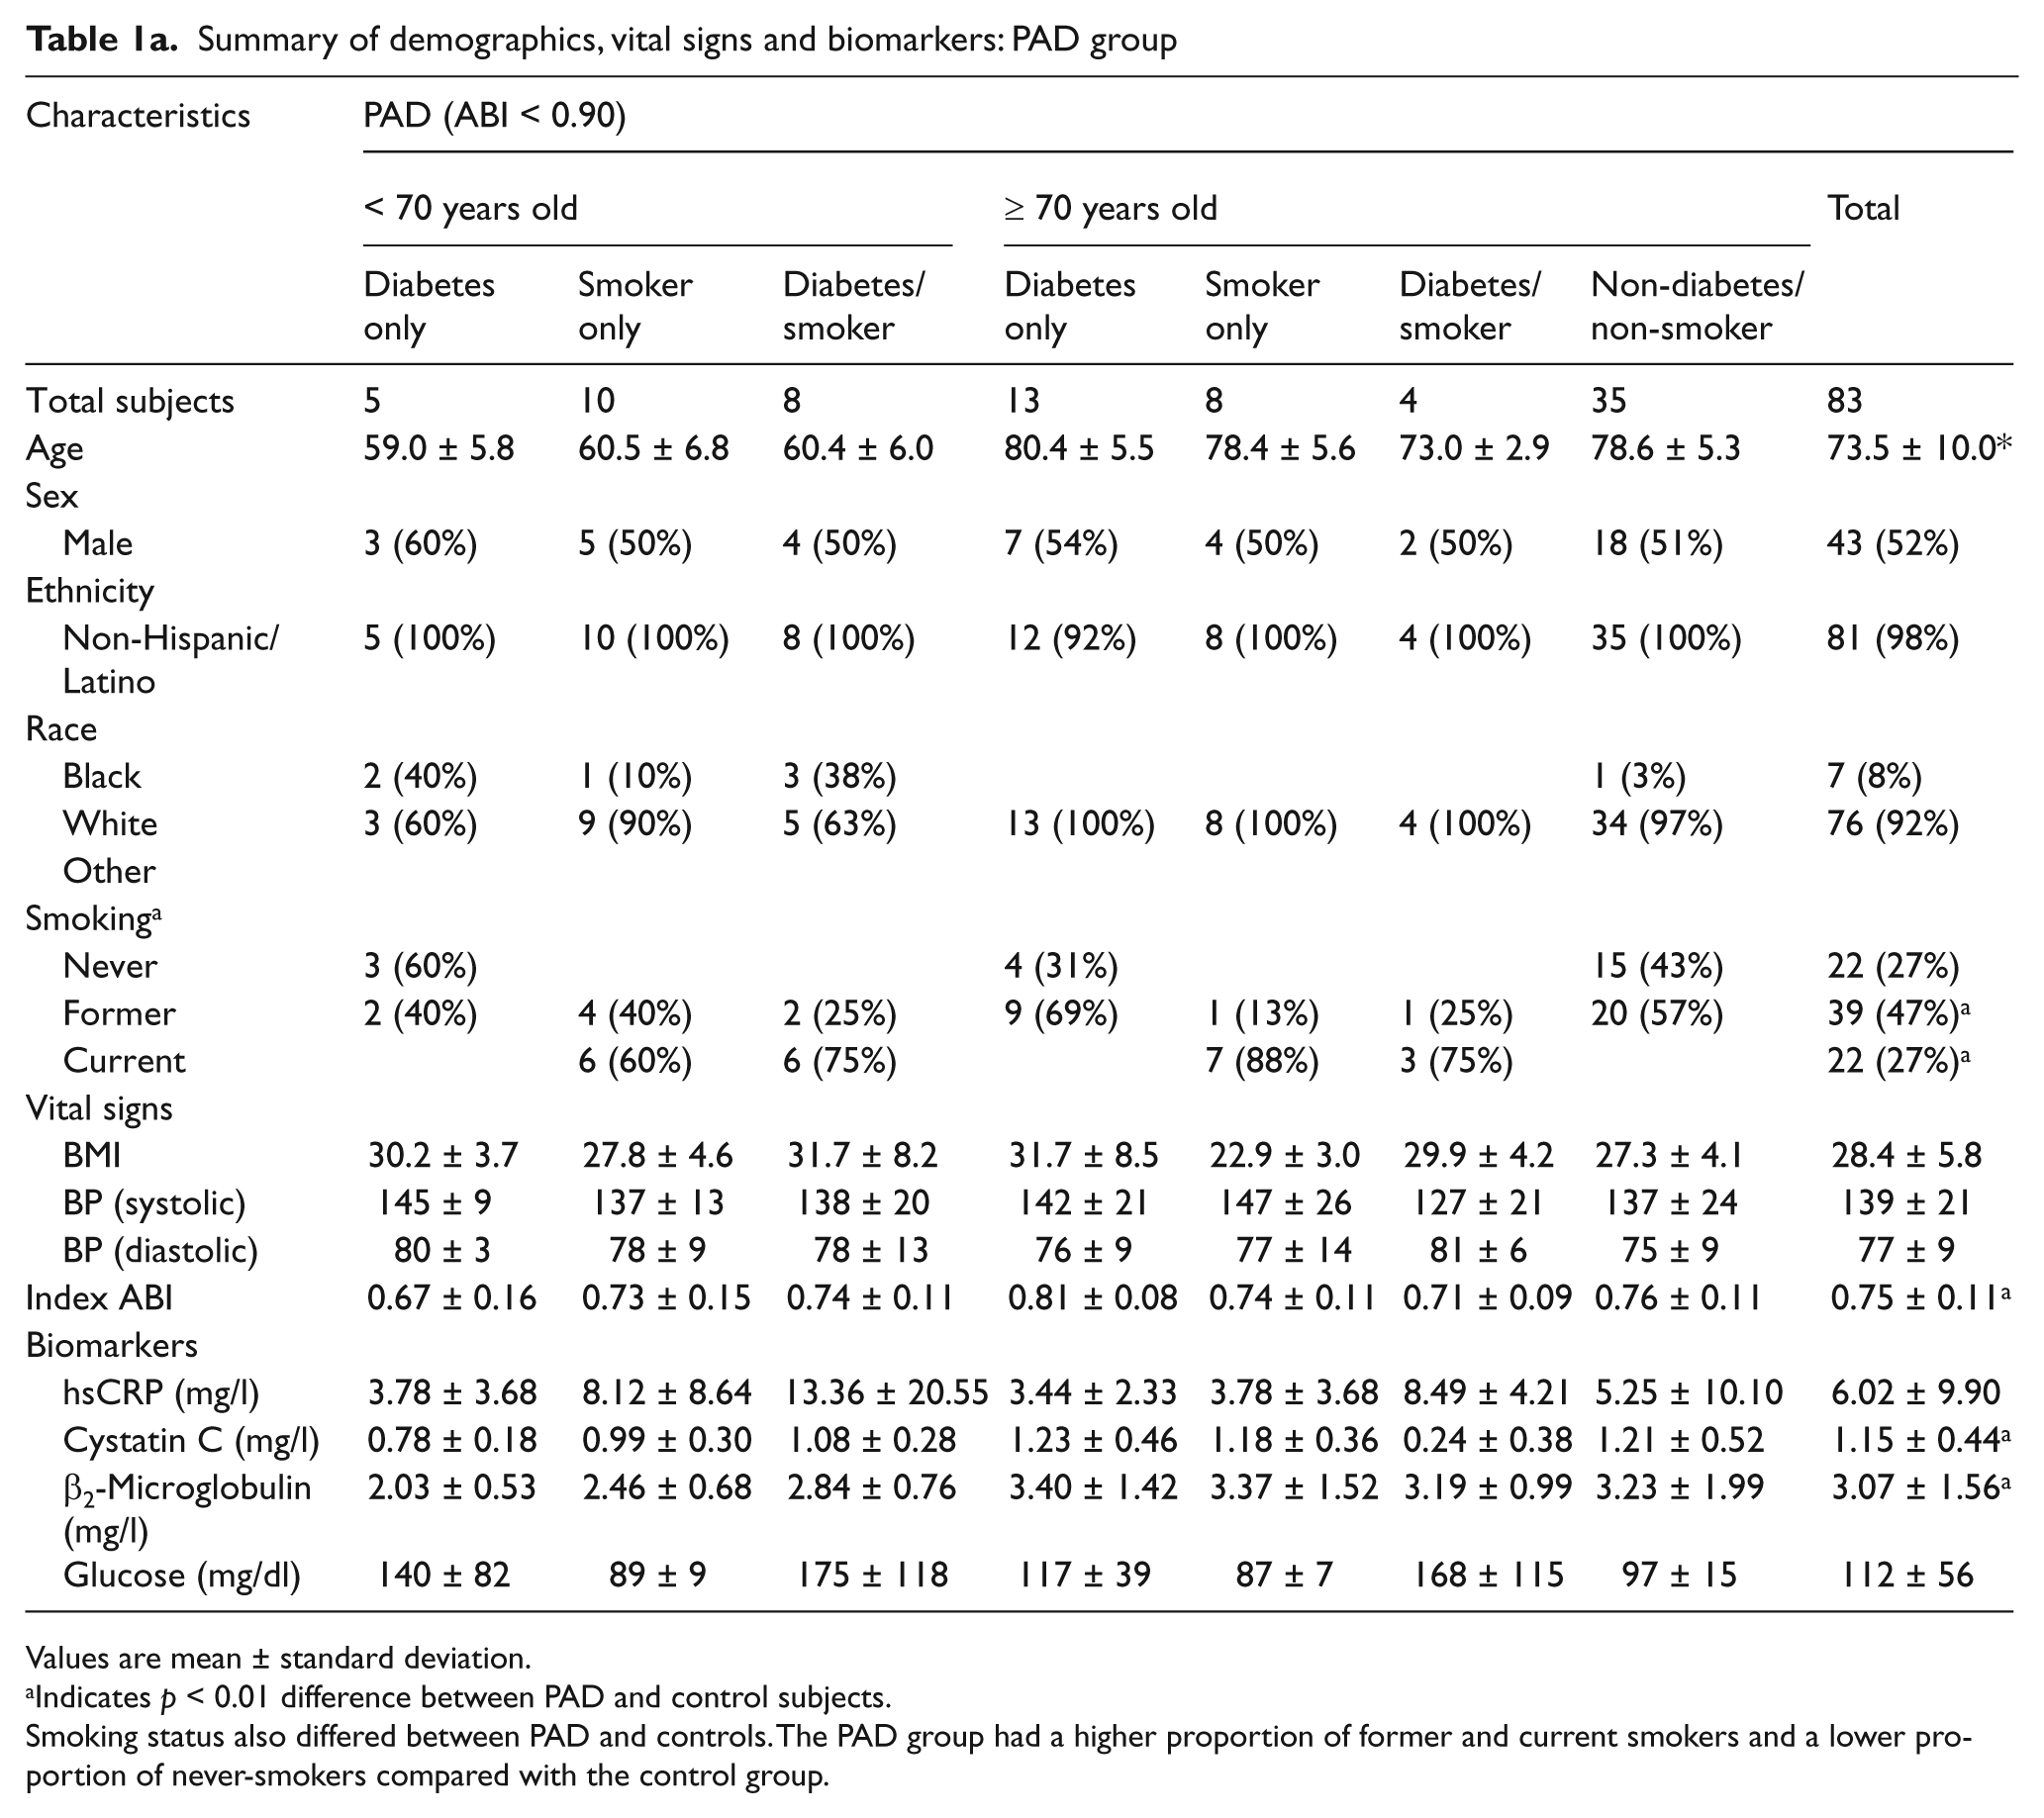
Values are mean ± standard deviation.
Indicates p < 0.01 difference between PAD and control subjects.
Smoking status also differed between PAD and controls. The PAD group had a higher proportion of former and current smokers and a lower proportion of never-smokers compared with the control group.
Summary of demographics, vital signs and biomarkers: control group

Values are mean ± standard deviation.
Smoking status also differed between PAD and controls. The PAD group had a higher proportion of former and current smokers and a lower proportion of never-smokers compared with the control group.
Univariate associations of biomarkers with PAD
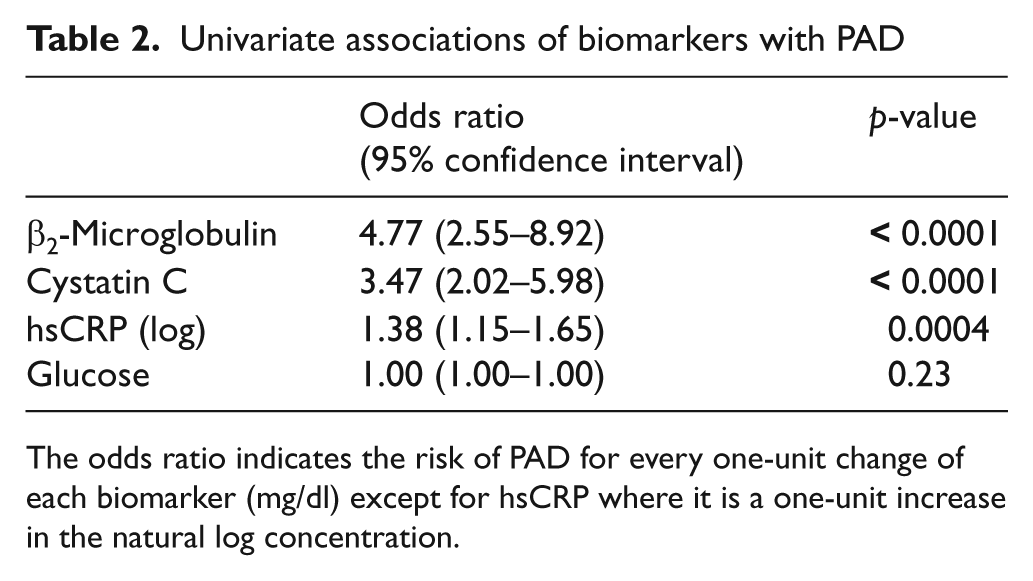
The odds ratio indicates the risk of PAD for every one-unit change of each biomarker (mg/dl) except for hsCRP where it is a one-unit increase in the natural log concentration.
The training set consisted of 653 subjects and the validation set consisted of the remaining 326 evaluable subjects. Based on the analysis plan, the training set was used to create the models and their stability was tested in the validation sample. The validation of the final models demonstrated excellent consistency between the training and validation subpopulations (Table 3). The full model of biomarkers plus interactions plus age, smoking and diabetes had a C-statistic of 0.73 in the training set and 0.73 in the validation set. Thus, for the final data presentation the populations were combined.
Performance of biomarker models
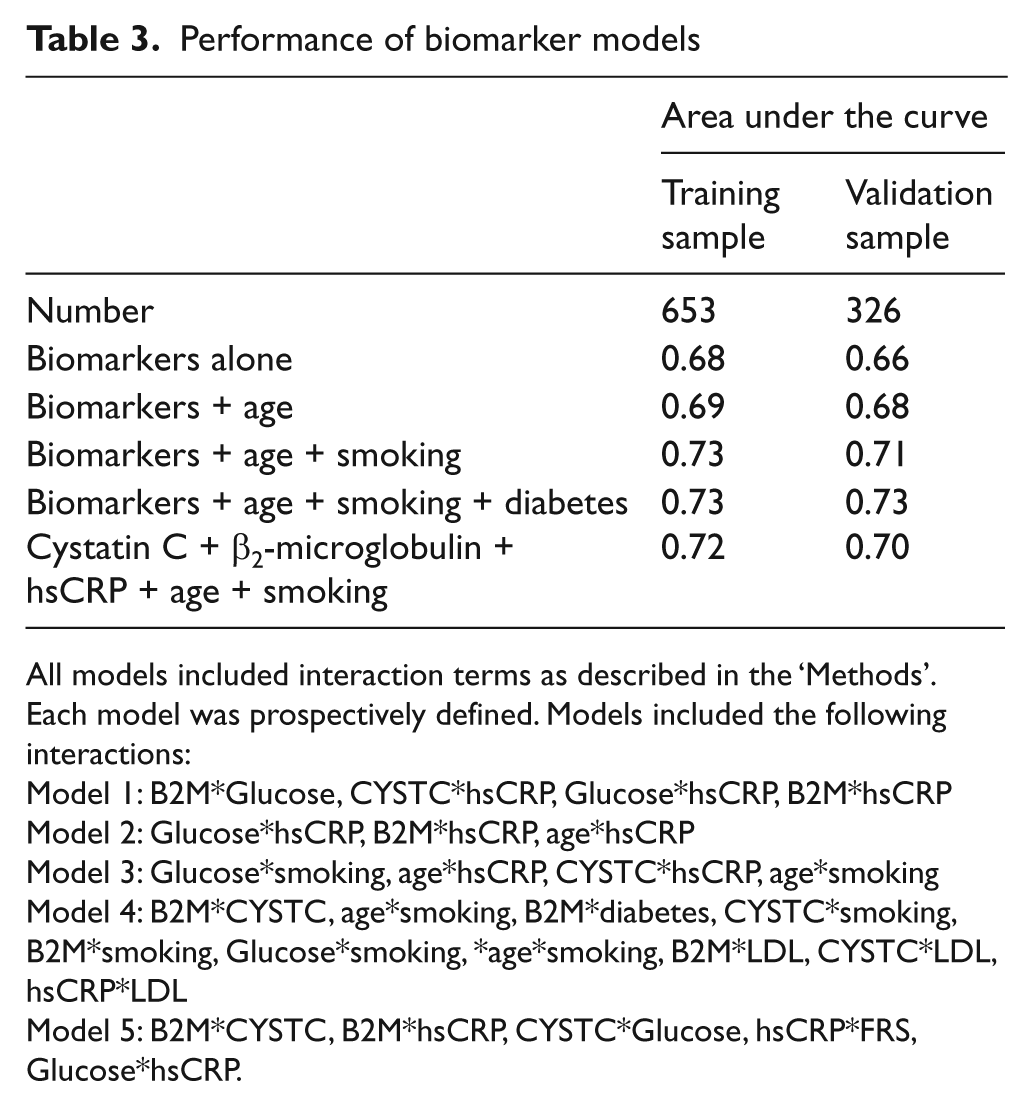
All models included interaction terms as described in the ‘Methods’. Each model was prospectively defined. Models included the following interactions:
Model 1: B2M*Glucose, CYSTC*hsCRP, Glucose*hsCRP, B2M*hsCRP
Model 2: Glucose*hsCRP, B2M*hsCRP, age*hsCRP
Model 3: Glucose*smoking, age*hsCRP, CYSTC*hsCRP, age*smoking
Model 4: B2M*CYSTC, age*smoking, B2M*diabetes, CYSTC*smoking, B2M*smoking, Glucose*smoking, *age*smoking, B2M*LDL, CYSTC*LDL, hsCRP*LDL
Model 5: B2M*CYSTC, B2M*hsCRP, CYSTC*Glucose, hsCRP*FRS, Glucose*hsCRP.
A series of analyses were performed between the biomarkers (and interactions), the clinical factors used for inclusion (age, smoking, diabetes) and the association with PAD. The biomarkers alone had a C-statistic of 0.68 (95% confidence interval (CI) of 0.61–0.75). The final full model that included all biomarkers and the clinical features of age, smoking and diabetes had a C-statistic of 0.73 (95% CI 0.67–0.79). In contrast, if the FRS were used to identify a PAD as a further means to risk-stratify the population, it had a C-statistic of 0.64 (95% CI 0.58–0.70), which was significantly worse than the biomarker panel (p < 0.0001). The ROCs for the full model and the FRS are shown in Figure 1.
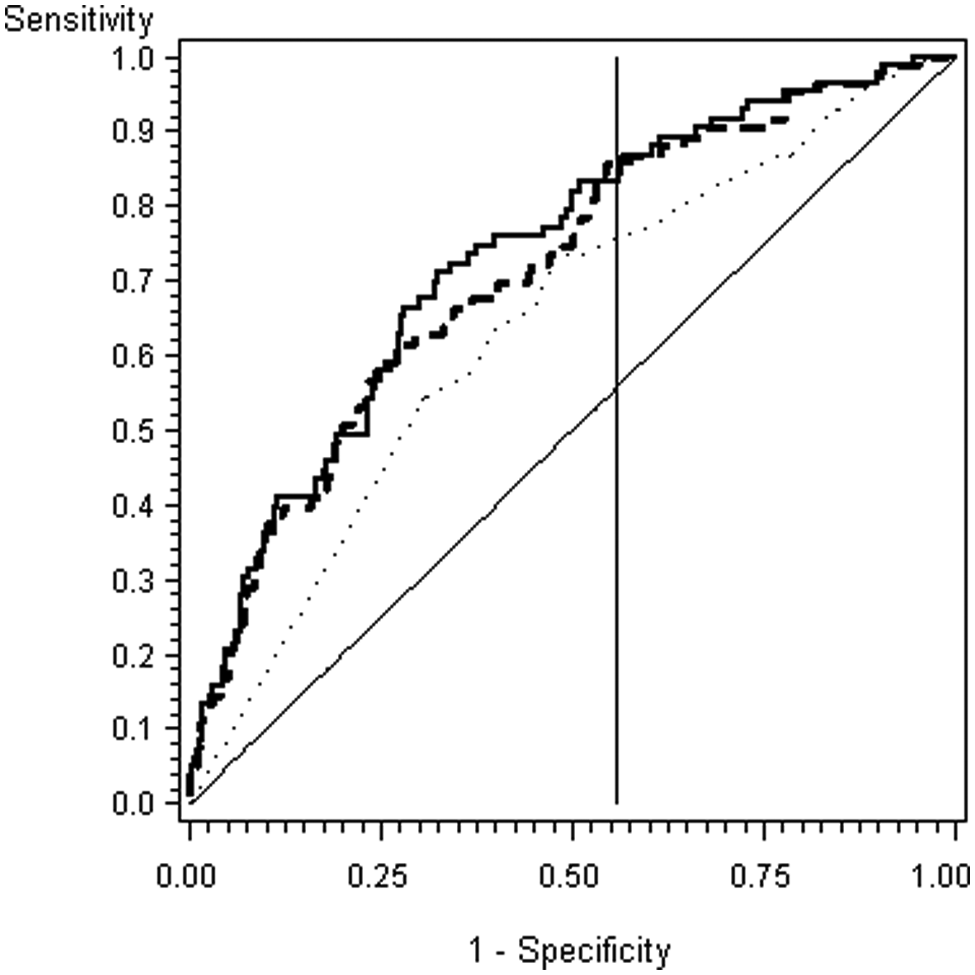
Receiver operator curve of the full, simplified and Framingham Risk Score models.
Sensitivity and specificity in detecting PAD were calculated at several cut points of the biomarker model. The goal was to determine a parsimonious approach to identifying the subset of patients in whom performing an ABI would yield the greatest number of previously unidentified PAD subjects. The first consideration was to fix the specificity of the biomarker model at 44%, which corresponded to the specificity for the FRS ≥ 20%. This resulted in a biomarker model cut point of 0.0569, at which the model sensitivity was 83%, positive predictive value 12%, and negative predictive value 97%. If the decision to obtain an ABI test was based on a model score > 0.0569, then 58% of the population would be referred for an ABI and 69 cases of PAD would be detected with 14 missed. In contrast, if the clinician referred all patients determined to have a > 20% 10-year risk of a cardiovascular event based on FRS, 76% of PAD cases would be identified; this strategy would detect 63 cases and miss 20 cases of PAD.
A different strategy would be to fix the sensitivity of the biomarker score at 76%, which corresponds to the sensitivity of the FRS ≥ 20%. This would result in a biomarker model cut point of 0.0681, at which the specificity of 60% was greater than the 44% specificity for FRS. Using the approach to send all subjects with a model score > 0.0681 for an ABI would result in screening 25% fewer subjects for PAD than if that decision were based on the FRS. Thus, when evaluated at a comparable sensitivity or comparable specificity, the model outperformed the FRS.
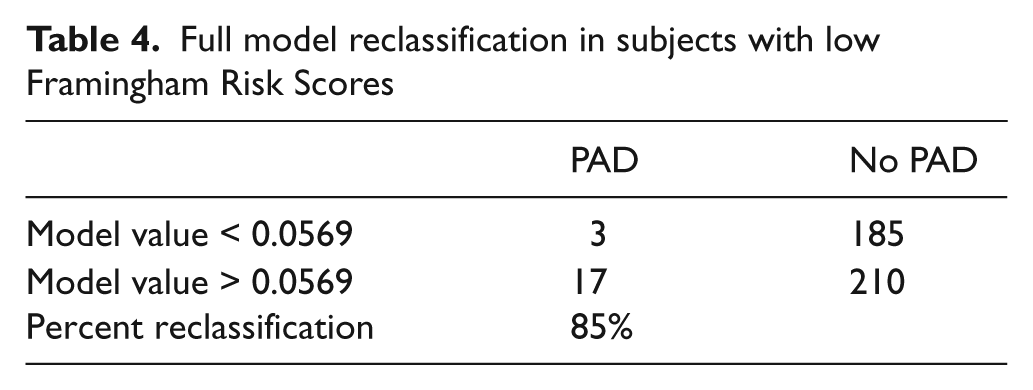
A major goal of the model is to identify subjects in need of an ABI compared with making that decision based on clinical risk assessment only. Since FRS values ≥ 20% indicate a person at high risk for any cardiovascular disease and cardiovascular event, subjects with a FRS scores less than 20% would benefit the most from a blood test that identifies the need to obtain an ABI to identify PAD since their cardiovascular risk would be underestimated by FRS alone (Table 4). In the study population, 42% had a FRS < 20%, and in these low to moderate risk subjects there were 20 with PAD and 395 controls without PAD (24% and 44% of the PAD and control populations, respectively). The model identified 17 of the 20 subjects with PAD who would have been missed by FRS alone (sensitivity = 85%).
Full model reclassification in subjects with low Framingham Risk Scores
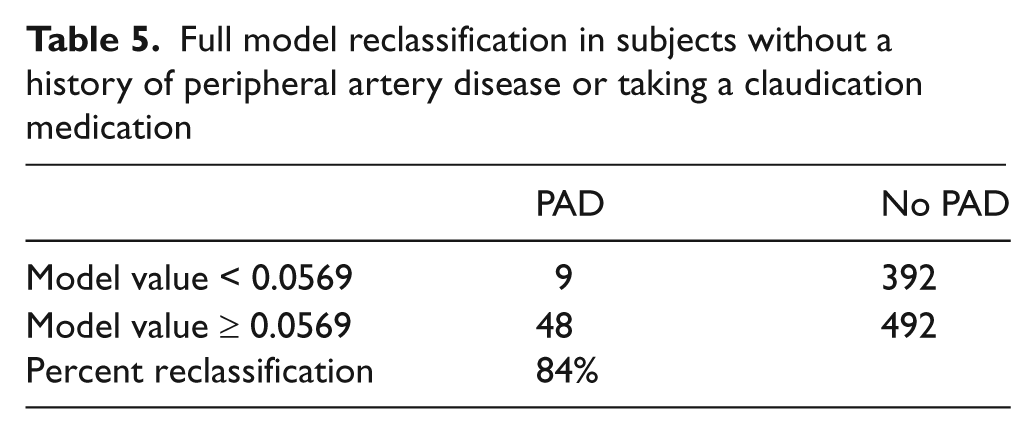
The utility of the model was also evaluated in subjects without a clinical history of PAD (n = 941) by removing those subjects identified with a prior history of PAD or taking claudication medications. In subjects without a prior history of PAD, the model had a C-statistic of 0.70 and characteristics similar for the performance of the model in subjects with a low to moderate FRS (Table 5).
Full model reclassification in subjects without a history of peripheral artery disease or taking a claudication medication
The best model would be one that provides the highest C-statistic with the fewest variables. Since the glucose level and prevalence of diabetes were not different between PAD and controls, and glucose did not have a univariate association with PAD, these two factors were dropped from the model. This simpler version had a C-statistic of 0.72 (95% CI 0.64–0.80) and thus retained a similar diagnostic accuracy as did the full model (Figure 1). In the subset of subjects with FRS < 20%, a cut point of 0.05464 resulted in a model sensitivity of 86%, specificity of 44%, positive predictive value of 12% and negative predictive value of 97%. The model score identified 18 of the 20 subjects with PAD who would have been missed by FRS alone.
Discussion
This study demonstrated that a model comprising a panel of biomarkers plus the clinical information used to identify a population at risk for PAD (age > 70 years, positive smoking status or positive diabetes status) could accurately predict the presence of PAD in a primary care practice setting. The biomarker model was compared to an alternate strategy using the FRS to refer a subject for an ABI. The FRS, which includes the clinical variables of age, smoking, diabetes and model biomarkers was also associated with PAD, but was less accurate than the biomarker model. This would be expected since the PAD is one of the major manifestations of systemic atherothrombosis with a marked increased risk of cardiovascular events. However, the addition of the biomarkers in this study (particularly β2-microglobulin, cystatin C and hsCRP), along with the clinical variables, identified an additional population of PAD missed by the FRS alone. In addition, the biomarker model performed well in the majority of subjects who had no clinical history of PAD. In clinical practice, information from this biomarker model would identify subjects most likely to warrant ABI testing to diagnose PAD.
At both fixed sensitivity and at fixed specificity, the biomarker model outperformed the FRS cut-off set at 20%. At this FRS cut-off, FRS had a sensitivity of 76% and a specificity of 44%. At a fixed sensitivity of 76%, the biomarker model had a specificity of 60%; at a fixed specificity of 44%, the biomarker model had a sensitivity of 83%. In this setting, using the biomarker cut point that achieves the same sensitivity would be preferred, since this would increase the number of cases detected. Further, the cost and risk of a false positive biomarker test is relatively low since the next step would be to perform an ABI, which is a non-invasive test with a strong recommendation from the ACC/AHA guidelines. The utility of a diagnostic test can also be described by the number of subjects reclassified by the test as compared to conventional metrics. In subjects found to be low risk by FRS, the biomarker model identified 17 of the 20 cases of PAD. Thus, use of the biomarker score in these low-risk patients would identify subjects worthy of additional ABI screening for PAD. The analysis also identified a simpler model that deleted fasting glucose level and history of diabetes but still retained a diagnostic accuracy similar to that of the full model. The lack of association of diabetes or glucose level with PAD may reflect the identical prevalence of diabetes in the PAD and control samples (noting that diabetes was a component of the inclusion criteria). Simpler models should be tested prospectively since fewer biomarker measurements could be less expensive.
Screening for PAD
The prevalence of PAD ranges from 3% in the Atherosclerosis Risk in Communities study to 5.9% in the National Health and Nutrition Examination Survey, to 12% in epidemiologic studies of a population enriched with diabetes, to the highest value of 29% in the PARTNERS study.12,22 –25 Thus, the PAD prevalence of 8.1% in the current study is consistent with prior epidemiologic studies that included subjects with cardiovascular risk factors, but much less than the prevalence of PAD described in the PARTNERS study of a decade ago. One difference is that PARTNERS enrolled subjects who had known PAD (prevalence of 16%) and newly diagnosed PAD (prevalence of 13%). Since the current study was designed to detect new PAD, the prevalence of 8% is more similar to the PARTNERS 13% of newly diagnosed PAD and is likely to reflect the current epidemiology of an at-risk primary care population. In this context, the use of a biomarker score to identify the subset of subjects most likely to have PAD would result in a more efficient and cost-effective screening program to utilize the ABI than a clinical assessment alone.
Current ACC/AHA guidelines give a class 1B recommendation to perform an ABI test to identify PAD in persons who have one or more of the following: exertional leg symptoms, non-healing wounds, age 65 years and older, or 50 years and older with a history of smoking or diabetes. 11 The reason for this strong recommendation is primarily to identify a population of subjects at increased risk for heart disease and ischemic events. However the use of ABI for screening purposes is under-utilized in clinical practice.13,26 While clinical models to predict risk, such as FRS, are readily available and can be efficiently utilized in the clinical setting, the addition of an ABI measurement adds significant predictive value to that of the FRS. 3 With the FRS and ABI value, the annual all-cause mortality and risk of non-fatal cardiovascular events can be determined. This information would then be used to target specific risk reduction interventions and also guide the intensity of such interventions. Thus, the primary goal of PAD screening in a population at risk is to raise awareness of the risk of PAD with the hope to reduce morbidity and mortality in this population. At the time of the PARTNERS study, subjects with a new diagnosis of PAD had a substandard intensity of risk factor modification. For example, only 53% had been given a recommendation to stop smoking, 44% had their lipids treated, 84% had their hypertension treated, and only 33% were taking an antiplatelet drug. 12 More recent studies have documented continued under-treatment of PAD and associated poor outcomes. 27 Thus, continued efforts and strategies need to be made available to facilitate the diagnosis of PAD.
Limitations and future directions
There are several limitations to the current study. The total number of PAD cases identified was relatively small and therefore the results need to be confirmed in a larger population. In addition, diabetes is a major risk factor for PAD but did not provide additional discrimination for detecting PAD in the current study. This could perhaps reflect the fact that the prevalence of diabetes was nearly identical in the PAD and control groups. The diagnostic utility of diabetes, glucose or glycohemoglobin level should be further investigated. The prognostic value of this biomarker panel should also be assessed. Notably, β2-microglobulin and cystatin C have recently been reported to have prognostic value in a study of ambulatory elderly individuals in Japan. 28 After adjustment for the traditional cardiovascular risk factors and renal function, β2-microglobulin and cystatin C were each independent predictors of cardiovascular morbidity, overall mortality, and were of greater predictive value for major adverse cardiovascular events than C-reactive protein. Also of interest in this study, β2-microglobulin was inversely correlated with walking velocity (which is known to be reduced in PAD).
To conclude, the results from the current study indicate that this biomarker model is a useful adjunctive tool that adds independent value over and above a clinical risk score in the target population of low to moderate Framingham risk. The results from this study will inform additional definitive studies to support clinical implementation of the model.
Footnotes
Acknowledgements
The authors wish to thank Dr Donald Munroe for his careful review of the manuscript.
Funding
William R Hiatt, Armen Zakharyan and Chriss Stanford report receiving research grant support to CPC Clinical Research from Vermillion to perform this study.
Conflict of interest
Eric T Fung and Gillian Crutcher have both received compensation from Vermillion, Inc. and both own stock in the company; Alan Smith is a consultant to Vermillion; and John Cooke receives consulting fees from Vermillion. Stanford University is the assignee, and Dr Cooke the inventor, on patents related to this technology. Vermillion has been granted an exclusive license on this technology.