
Abstract
Smoothelin is a specific type of cytoskeletal protein found in smooth muscle cells (SMCs). Several previous research studies have examined the relationship between smoothelin and atherosclerotic plaque. The aim of the present study was to further assess the association between the human SMTN gene and cerebral infarction (CI) using a haplotype-based case–control study. A total of 168 CI patients and 259 supercontrols were genotyped for the five single-nucleotide polymorphisms (SNPs) used as genetic markers for the human SMTN gene (rs2074738, rs5997872, rs56095120, rs9621187 and rs10304). Data were analyzed for three separate groups that included total subjects, men and women. The genotypic distribution of rs10304 for men showed a significant difference between the control and CI groups. In addition, the frequency of the C-T-T-A haplotype (established by rs5997872, rs56095120, rs9621187 and rs10304) was significantly higher in the CI versus the control group (p = 0.013), while the frequency of the C-A-T-G haplotype (established by rs5997872, rs56095120, rs9621187 and rs10304) in the CI group was significantly lower than that seen in the controls (p = 0.021). In conclusion, we confirmed that the haplotype constructed using rs5997872, rs56095120, rs9621187 and rs10304 was a useful genetic marker of CI in Japanese men.
Introduction
Cerebral infarction (CI), which is the most common form of stroke and a major cause of long-term disabilities, can lead to very serious public health issues. 1 CI has been shown to be a multifactorial disease. Besides the conventional risk factors for CI, such as hypertension, smoking and diabetes mellitus, it has also been demonstrated that genetic factors can contribute to CI susceptibility. Thus, CI results from interactions between both genetic and environmental factors.2,3 The underlying CI pathology involves the formation of a thrombus over an unstable atherosclerotic plaque. 4 Smooth muscle cells (SMCs) are well-accepted players in the evolution of atherosclerotic plaque in addition to participating in the establishment of conditions that facilitate plaque rupture and/or thrombus formation via several activities, including vasospasm and synthesis of extracellular matrix components or proteolytic enzymes. Remodeling and deformation of the intima through tensile force generation by SMCs might also be instrumental in this plaque rupture process.5–7
Smoothelin is a specific kind of cytoskeletal protein that is found in the SMCs. In adult humans, this protein has two known major isoforms: smoothelin-A (approximately 59 kDa) and smoothelin-B (approximately 110 kDa).8,9 Smoothelin-A is abundant in visceral smooth muscle and has been shown to be essential for functional contractility of the intestinal smooth muscle. 10 In contrast, while smoothelin-B has been shown to be specifically expressed in the vascular smooth muscle cells, its expression level differs according to the type of adult blood vessel it is found in. While smoothelin-B expression is particularly high in muscular arteries, its expression in elastic arteries is modest, at best, and is totally absent in the capillaries, pericytic venules and small veins. 11 The human SMTN gene that encodes smoothelin-A and smoothelin-B is located on chromosome 22q12.2. The gene consists of 21 exons, with smoothelin-B encoded by 21 exons, while smoothelin-A transcription starts in the middle of exon 10. 12
Previous research has demonstrated that expression of smoothelin is observed in atherosclerosis. Tharp et al. examined medial cells of early atherosclerosis in coronary arteries from swine and reported that the smoothelin-B expression was significantly reduced. 13 During the formation of the atherosclerotic plaque, the expression of smoothelin-B in plaque caps has been shown to be down-regulated. 14 However, once the plaque becomes quiescent and is no longer expanding, smoothelin expression can be detected in the SMCs of the plaque cap. 11 All of the previous research studies have shown that there is a relationship between smoothelin-B and atherosclerosis. However, at the present time, the association between the SMTN gene and CI in humans has yet to be studied.
The aim of the present study was to investigate the relationship between CI and the human SMTN gene by using single-nucleotide polymorphisms (SNPs) and a haplotype-based case–control study.
Subjects and methods
Subjects
Participants diagnosed with CI were recruited at Nihon University Itabashi Hospital in Tokyo, Japan and other neighboring hospitals over a period of one decade (1993 to 2003). We selected Japanese patients diagnosed with CI (n = 168 (98 men, 70 women), age 66.0 ± 13.1 years (men 64.3 ± 11.9 years, women 68.4 ± 14.3 years)) who previously underwent neurological examinations that included computed tomography (CT) or magnetic resonance imaging (MRI) or both, and who had neurologic deficit ratings greater than grade 3 on the modified Rankin scale. Patients were excluded if their CT, MRI or both examinations indicated a hemorrhagic stroke diagnosis. A total of 259 Japanese control subjects (126 men, 133 women; age 77.8 ± 4.3 years (men 78.0 ± 4.7 years, women 77.6 ± 3.8 years)) were also enrolled. These control subjects were recruited from members of the Japan New Elder Citizenship project, 15 a project that is aimed at promoting both the activity and the productivity of healthy elderly individuals (≥ 75 years). At the end of July 2003, membership numbers in this group exceeded 3000. The present study was conducted in healthy members of this group. The participants mainly lived in the Tokyo metropolitan area, and after appropriate explanation of the purposes of the examinations, they voluntarily agreed to take part in the study and provided written informed consent. While all subjects had vascular risk factors such as hypertension, hypercholesterolemia or diabetes mellitus, none had any history of CI. Additionally, all participants were confirmed to be grade 0 on the modified Rankin scale. Control subjects were excluded if they had cancer or any autoimmune disease, including antiphospholipid antibody syndrome. The study also excluded all patients with cerebral embolism caused by atrial fibrillation, as diagnosed by history or by the findings of electrocardiography, echocardiography, CT or MRI. However, patients diagnosed as previously having cerebral thrombosis were included in the study. None of the participants had any history of peripheral artery disease. All of the data collected came from a homogeneous group of Japanese subjects. Informed consent was obtained from each potential participant in accordance with a protocol previously approved by the Human Studies Committee of Nihon University. 16 It has been reported that sexual differences exist in the frequency of CI, with a higher frequency seen in males versus females. Thus, since males also have stronger risk factors for CI, such as hypertension, smoking and drinking,17,18 we decided to conduct a case–control study for each sex in the present study. The sample size for the present study was in line with the sample size numbers that have been proposed as being appropriate in these types of case–control studies. 19
Genotyping
There are 301 SNPs for the human SMTN gene listed in the National Center for Biotechnology Information (NCBI) SNP database Build 129 (www.ncbi.nlm.nih.gov/SNP). In this study, we also screened the data for the Tag SNPs that were listed on the International HapMap Project website (www.hapmap.nc). Based on this information, we selected five SNPs (rs2074738, rs5997872, rs56095120, rs9621187 and rs10304) that had a minor allele frequency (MAF) of more than 0.15 when used as markers in a genetic association experiment (Figure 1). The selection was also based on the SNP allelic frequency information that has been previously registered with the NCBI, Celera Discovery System™ (Applied Biosystems, Foster City, CA, USA) and the International HapMap Project. Among all of the SNPs, rs5997872 was located in the exon region, rs10304 was located in the 3’ UTR and the other three SNPs were located in the intron regions. Because only three out of the five SNPs (rs2074738, rs5997872 and rs10304) were shown on the International HapMap Project website, we were unaware of the |D′| and r 2 between the five SNPs prior to starting the present study. The design of the five SNPs was as follows: SNP1 (rs2074738, C_16164833_10), SNP2 (rs5997872, C_2628872_10), SNP3 (rs56095120, AHT95ID), SNP4 (rs9621187, AHVI3OL) and SNP5 (rs10304, AHS07PD). Genotyping for these SNPs was done using a kit from Applied Biosystems.
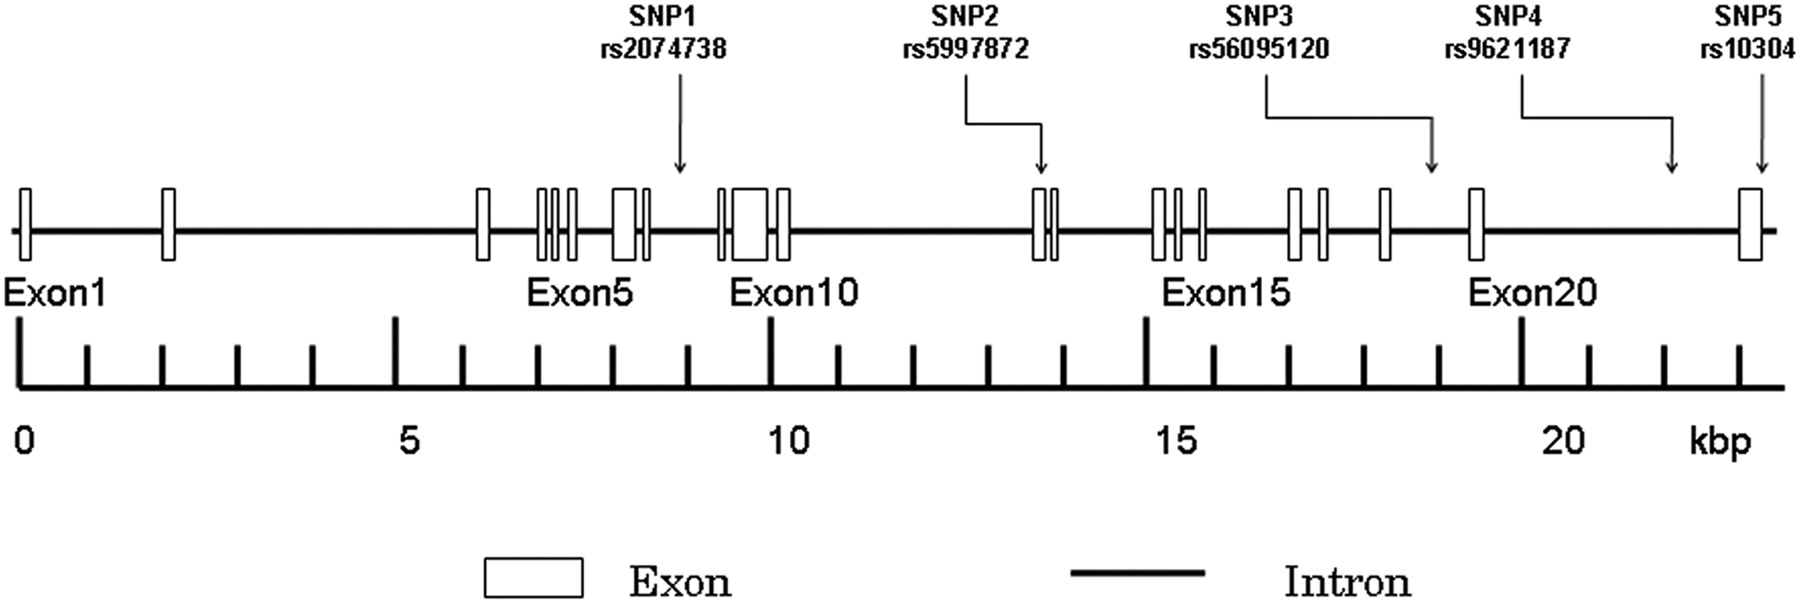
Structure of the human SMTN gene. The gene consists of 21 exons (boxes) separated by 20 introns (lines; intergenic regions). Boxes indicate the exons, while arrows indicate the locations of single nucleotide polymorphisms (SNPs). (kbp, kilo-base pairs.)
After blood samples were collected from all participants, the genomic DNA was extracted from the peripheral blood leukocytes by using a phenol and chloroform extraction method. 20 Subsequently, genotyping was then performed via the TaqMan® SNP Genotyping Assay (Applied Biosystems), which used the Taq amplification method. 21
PCR amplification was performed using 2.5 µl of TaqMan Universal Master Mix, No AmpErase® UNG (2×) (Applied Biosystems) in a 5 µl final reaction volume, along with 2 ng DNA, 2.375 µl ultrapure water, 0.079 µl Tris-EDTA (TE) buffer (1×), 0.046 µl TaqMan SNP Genotyping Assay Mix (40×) containing a 331.2 nmol/L final concentration of primers, along with a 73.6 nmol/L final concentration of the probes. The thermal cycling conditions were as follows: 50°C for 2 min; 95°C for 10 min; 50 cycles of 95°C for 15 s; and 60°C for 1 min. Thermal cycling was performed using the GeneAmp 9700™ system.
Each 96-well plate contained 80 DNA samples of an unknown genotype and four reaction mixtures containing reagents but no DNA (control). The control samples without DNA are a necessary part of the Sequence Detection System (SDS) 7700™ signal processing, as outlined in the TaqMan Allelic Discrimination Guide (Applied Biosystems). The plates were read on the SDS 7700 instrument with the end-point analysis mode of the SDS version 1.6.3 software package (Applied Biosystems). The genotypes were visually determined based on the dye-component fluorescent emission data depicted in the X-Y scatter-plot of the SDS software. The genotypes were also determined automatically by the signal processing algorithms of the software. The results of each scoring method were saved in two separate output files for later comparison. 22
Biochemical analysis
We measured the plasma concentration of total cholesterol and the serum concentration of creatinine using standard methods employed by the Clinical Laboratory Department of Nihon University Hospital.
Statistical analysis
All continuous variables were expressed as mean ± SD. Differences in continuous variables between the CI patients and control subjects were analyzed using the Mann–Whitney U-test. Differences in the categorical variables were analyzed using Fisher’s exact test. Differences in the distributions of the genotypes and alleles between the CI patients and control subjects were also analyzed using Fisher’s exact test. Based on the genotype data of the genetic variations, we performed linkage disequilibrium (LD) and haplotype-based case–control analyses using the expectation maximization algorithm, 23 and the software SNPAlyze version 3.2 (Dynacom Co., Ltd, Yokohama, Japan). The pairwise LD analysis was performed using three SNP pairs. We used |D′| values of > 0.5 to assign SNP locations to one haplotype block. SNPs with an r 2 value of < 0.5 were selected as tagged. In the haplotype-based case–control analysis, haplotypes with a frequency of < 0.02 were excluded. The frequency distribution of the haplotypes was calculated by performing a permutation test using the bootstrap method. Statistical significance was established at p < 0.05. Statistical analyses were performed using SPSS software for Windows, version 12 (SPSS Inc., Chicago, IL, USA). Rather than using a stepwise method in the logistic regression analysis, we used the full model that included all the confounding risk factors that exhibited significant differences. To assess the differences in the clinical data between the CI and control groups, we used an analysis of variance followed by Fisher’s protected least significant difference test. 24 With regard to age in the present study, the control group was significantly older than the case group. However, since this control group was a supercontrol that was comprised of older people who did not have any diseases, this was not considered to have caused any bias in our analyses.25–27
Results
Table 1 shows the clinical features of the CI patients and control subjects. Significant differences in the systolic blood pressure (SBP), diastolic blood pressure (DBP), pulse, creatinine, total cholesterol, hyperlipidemia, diabetes and smoking were observed between the CI and control groups. The age of the subjects in the control group was significantly higher than that seen in the CI group overall (77.8 ± 4.3 years vs 66.0 ± 13.1 years, p < 0.0001), as well as for the men (78.0 ± 4.7 years vs 64.3 ± 11.9 years, p < 0.0001) and the women (77.6 ± 3.8 years vs 68.4 ± 14.3 years, p < 0.0001). Since the mean age of the control group was higher than that of the CI group, the control group was regarded as a supercontrol. Although these supercontrol groups have higher ages than the case groups being studied, it has been shown that these groups are acceptable for use in case–control studies of late-onset diseases. 26
Characteristics of study participants
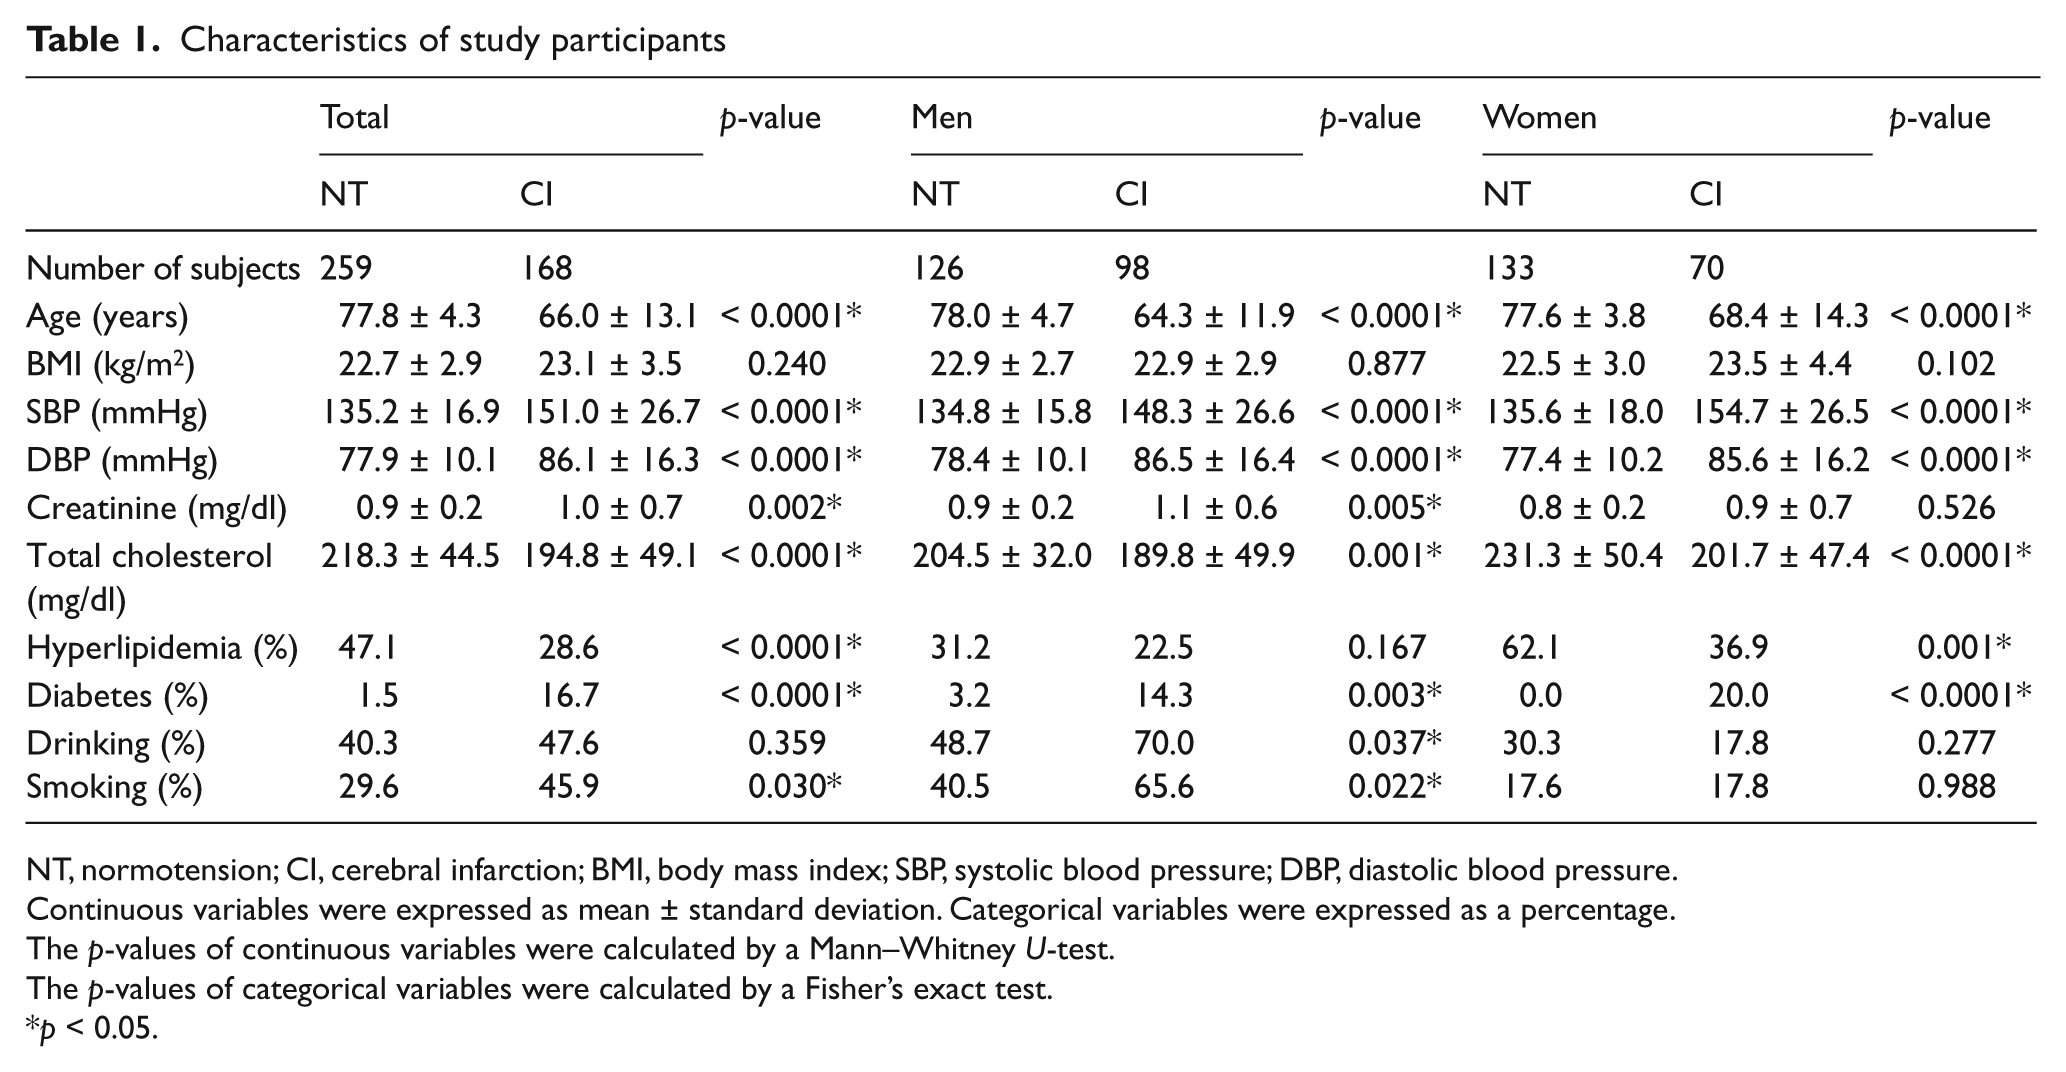
NT, normotension; CI, cerebral infarction; BMI, body mass index; SBP, systolic blood pressure; DBP, diastolic blood pressure.
Continuous variables were expressed as mean ± standard deviation. Categorical variables were expressed as a percentage.
The p-values of continuous variables were calculated by a Mann–Whitney U-test.
The p-values of categorical variables were calculated by a Fisher’s exact test.
p < 0.05.
Table 2 shows the distribution of the genotypes and alleles of the five SNPs. The genotyping success rate in all SNPs was 100%. The genotype distribution of SNP1 was not in good agreement with the Hardy–Weinberg equilibrium (data not shown). The designations of dominant and recessive models were based on the concept originally proposed by Lewis in 2002. 28 For men, there were significant differences between the control and the CI groups for the overall genotype distributions and the recessive model distributions for rs10304 (p = 0.045, p = 0.038). Dominance and recessiveness of these models were defined by their frequency among the total subjects.
Genotype and allele distributions in normotensives and patients with CI
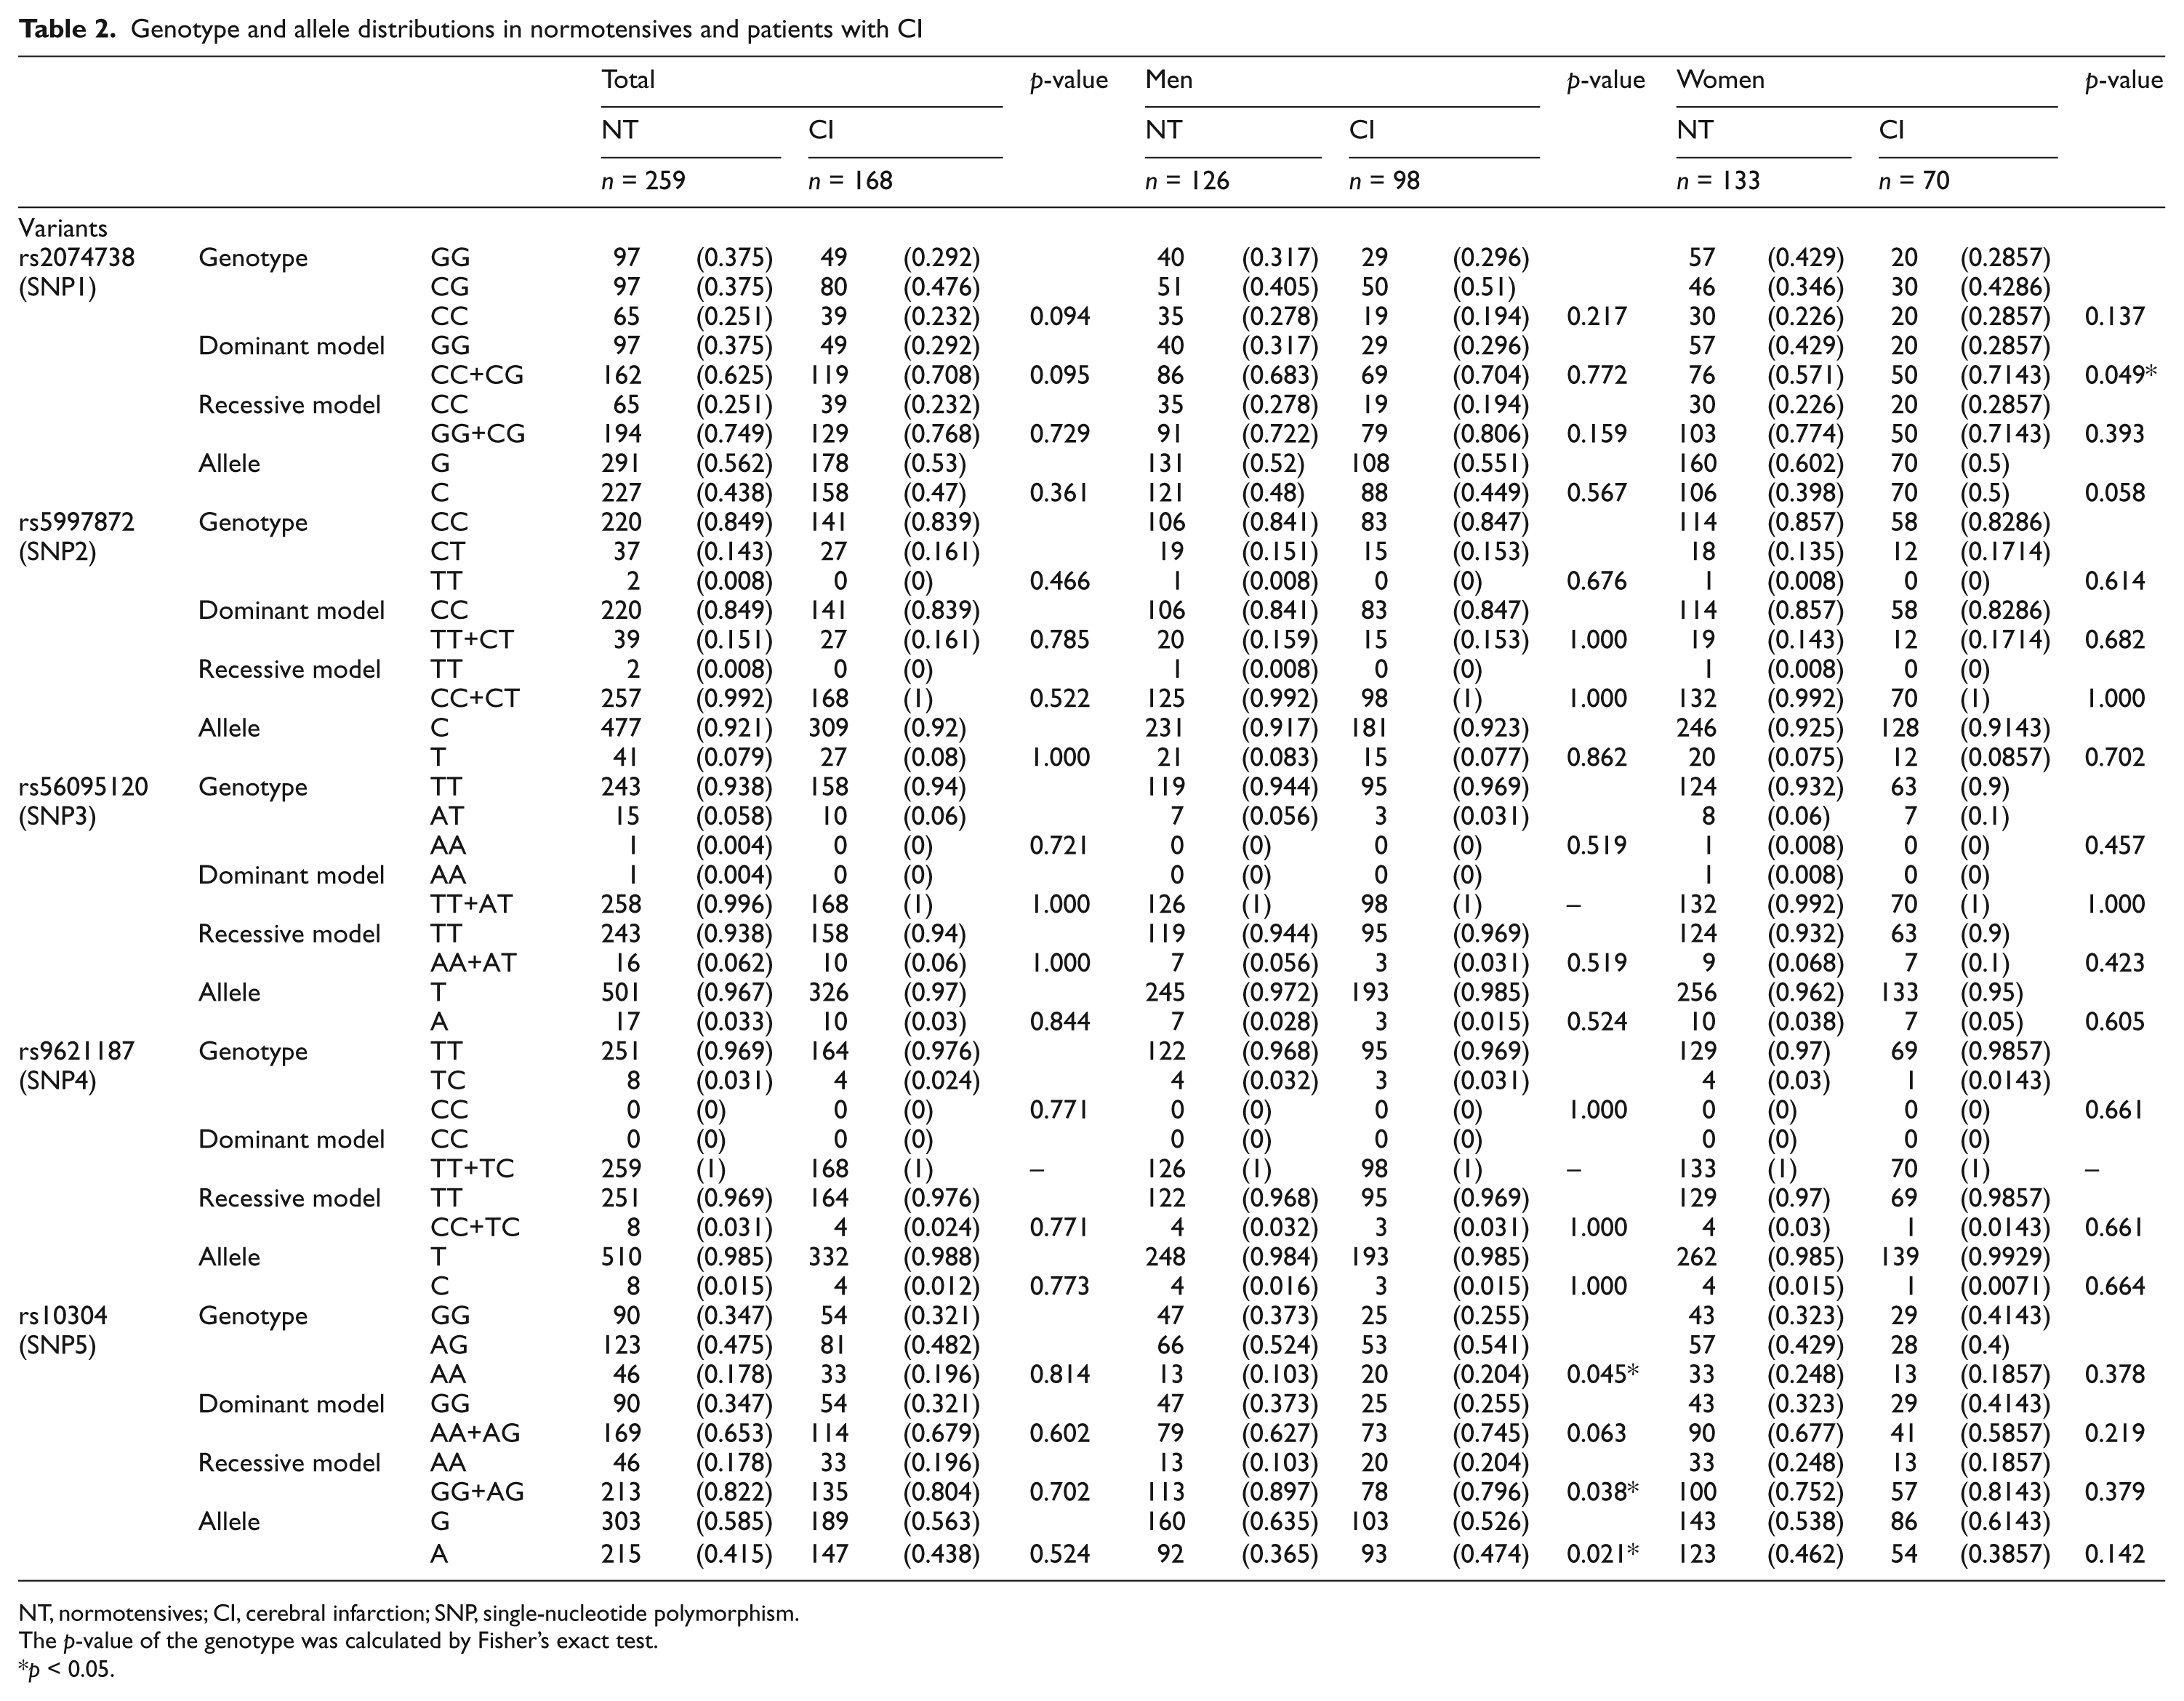
NT, normotensives; CI, cerebral infarction; SNP, single-nucleotide polymorphism.
The p-value of the genotype was calculated by Fisher’s exact test.
p < 0.05.
Table 3 presents the results of the logistic regression analysis. Logistic regression was performed using the following variables: SBP, creatinine, diabetes mellitus, smoking, drinking, and hyperlipidemia. As shown in Table 3, there were significant differences noted between the male CI patients and the control subjects for the GG+AG genotype of rs10304 (p = 0.036). In contrast, there were no differences noted for either the total or the female groups for the GG+AG genotype of rs10304.
Logistic regression analysis with adjustment for confounding factors in the AA genotypes of rs10304 associated with cerebral infarction
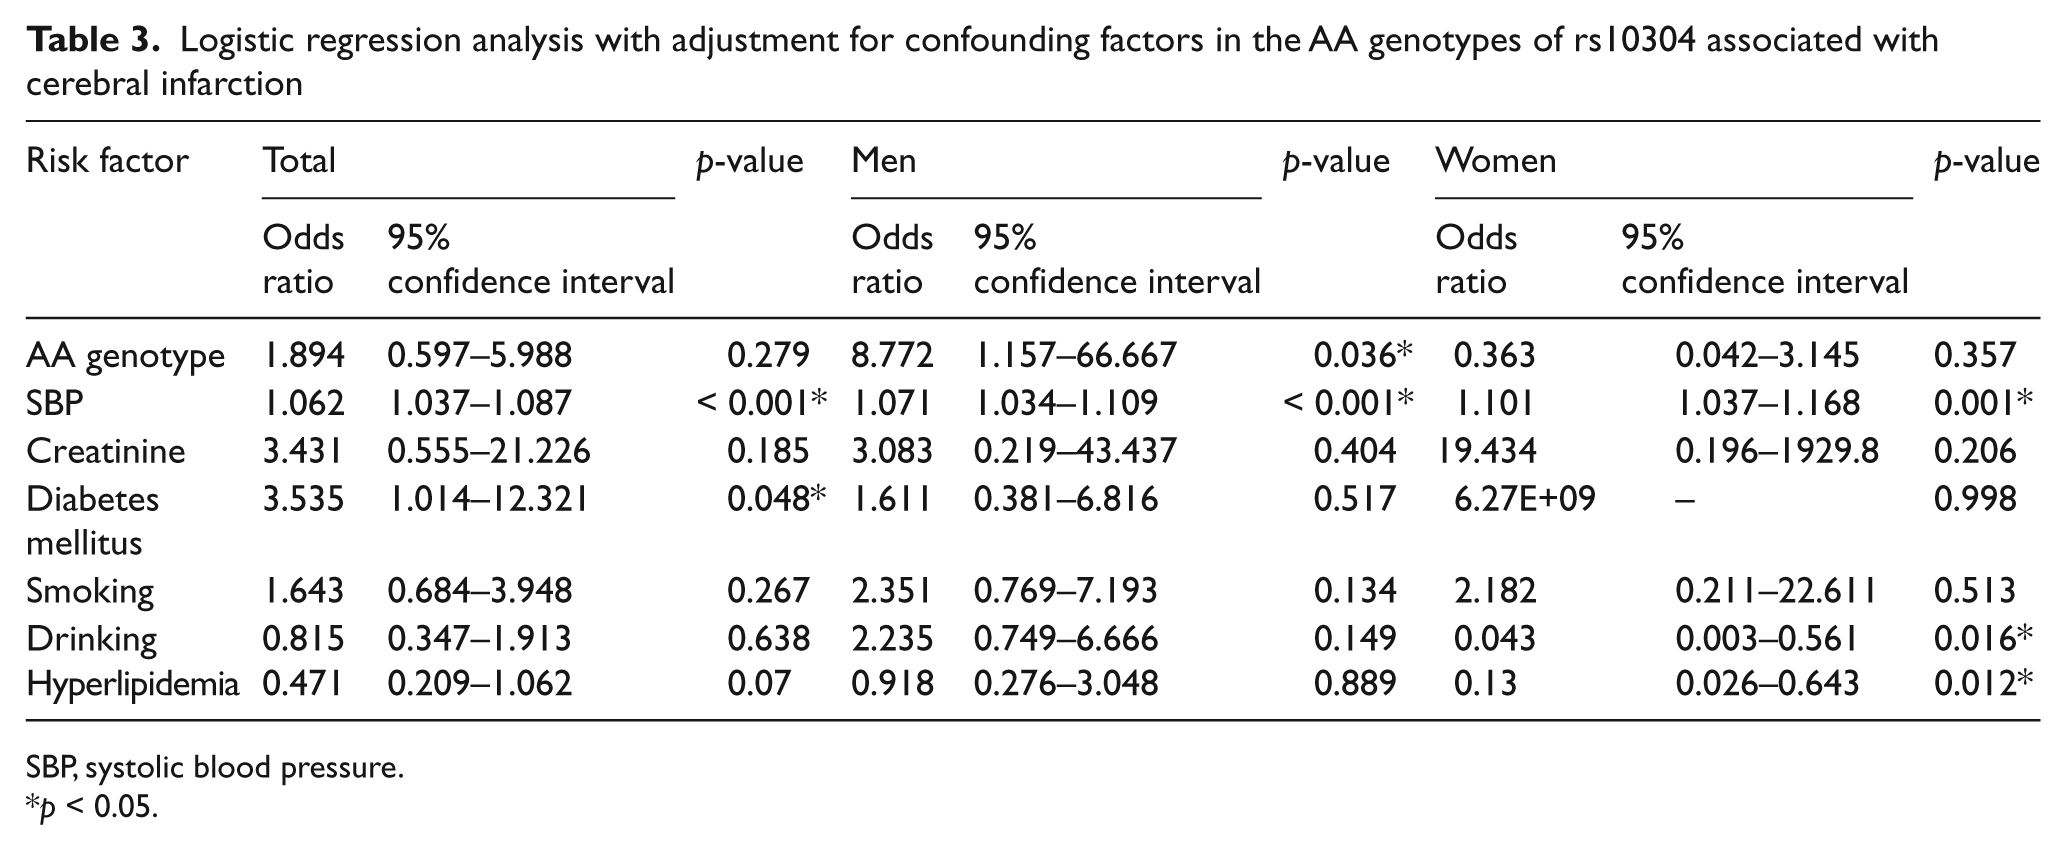
SBP, systolic blood pressure.
p < 0.05.
Table 4 shows the patterns of linkage disequilibrium in the SMTN along with their |D′| and r 2 values. As the genotype distribution of SNP1 was not in good agreement with the Hardy–Weinberg equilibrium, only SNPs 2, 3, 4 and 5 were selected for the present study.
Pairwise linkage disequilibrium for the five SNPs
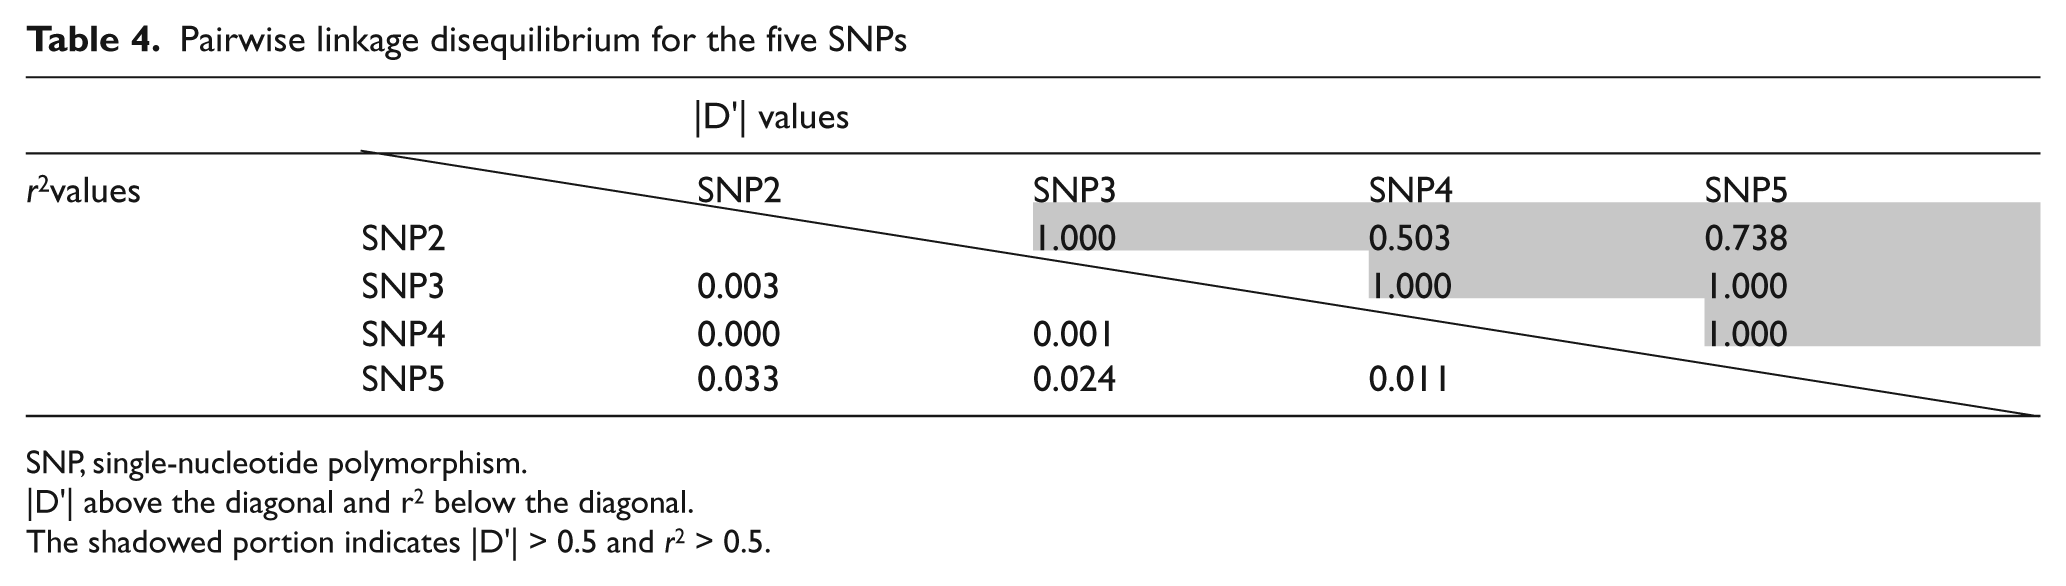
SNP, single-nucleotide polymorphism.
|D′| above the diagonal and r 2 below the diagonal.
The shadowed portion indicates |D′| > 0.5 and r 2 > 0.5.
Since most of the values for |D′| between each of the SNP pairs were beyond 0.5, all four of the SNPs were considered to be contained within a single haplotype block. Therefore, the haplotype-based case–control study was performed using four SNPs (rs5997872, rs56095120, rs9621187 and rs10304).
When men and women were compared, the overall distribution of the haplotypes was significantly different between the CI and the control groups (men: p = 0.014, women: p = 0.601) (Table 5). The frequency of the C-T-T-A haplotype constructed with rs5997872-rs56095120-rs9621187-rs10304 in the CI group was significantly higher than that seen for the controls (men: p = 0.013, women: p = 0.601) (Table 5 (continued)), while the frequency of the C-A-T-G haplotype was significantly lower in the CI group as compared to the controls (men: p = 0.021, women: p = 0.598) (Table 5 (continued)).
Haplotype analysis in CI patients and control subjects

CI, cerebral infarction; SNP, single-nucleotide polymorphism.
Haplotypes with frequencies > 0.02 were estimated using SNPAlyze software.
The p-value was calculated by a permutation test using the bootstrap method.
p < 0.05.
Discussion
In the present study, after genotyping five SNPs of the SMTN gene in Japanese subjects, we then assessed the association between the SMTN gene and CI. In this association study, the overall distribution of the genotypic and allelic frequencies for rs10304 was significantly different between the male subjects in the CI and control groups. While the frequency of the C-T-T-A haplotype constructed by rs5997872-rs56095120-rs9621187-rs10304 was significantly higher in the CI versus the control group (men: p = 0.013, women: p = 0.601), the frequency of the C-A-T-G haplotype was significantly lower in the CI group as compared to the controls (men: p = 0.021, women: p = 0.598). Thus, only men exhibited significant differences for the overall distribution of the C-T-T-A and C-A-T-G haplotypes.
Previous studies have reported that sexual differences exist for the frequency of CI. Since the reported incidence of stroke is lower in women than in men for decades after menopause, this suggests that there are factors beyond exposure to ovarian hormones that contribute to these epidemiological sex differences.29,30 In addition, other researchers have also demonstrated that there are striking sex differences in the triggering of the cell death pathways.31–33 Some studies have proposed that these sexual differences could result from men having stronger risk factors for CI, such as hypertension, smoking and drinking.17,18 Thus, we believe that the SMTN gene could be sensitive to environmental factors, which would explain the sexual differences we noted in our present study.
In the present study, we used a supercontrol group that contained subjects who had backgrounds that were similar to those seen for aged and unaffected individuals. It has been previously shown that healthy elderly subjects are more suitable than young or middle-aged subjects when attempting to determine phenotypes of cardiovascular disease related to aging, as many of these diseases primarily occur late in life. 25 In the present study, levels of total cholesterol were significantly higher in our control group, even though all individuals in the control group were known to have healthy lifestyles. Unfortunately, it was not possible to collect data on the total cholesterol levels that were present in the CI group at the onset of their CI. Thus, it could be possible that the total cholesterol levels in the control group might have actually been higher than those in the case group. It should be noted, however, that many of the enrolled control subjects had been previously diagnosed with hypercholesterolemia and were undergoing diet therapy without antihyperlipidemic drugs at the time of the present study.
Although it has been more than 10 years since smoothelin was first discovered in the chicken stomach, there has been little knowledge reported about its functional role as a SMC protein. 34 In contrast, there have been many studies that have demonstrated a correlation between smoothelin and atherosclerotic plaque formation,13,14,35 and there are also other studies that have even suggested that there is a connection between smoothelin and atherosclerotic plaque rupture. 11 Moreover, a previous study showed that there was expression of the smoothelin gene in human middle cerebral artery after cerebral ischemia. When profiled with microarray, this study showed that the smoothelin-B expression was specifically down-regulated. However, the reason for these contradictory findings is still unclear. 36 Our present findings suggest that the C-T-T-A haplotype may be a susceptibility marker, while the C-A-T-G haplotype might be a protective marker for CI in Japanese men. In addition, it is possible that there may be mutation(s) linked to these two haplotypes, with the mutation(s) having the potential to change the proliferation of SMCs and affect the formation and/or the rupture of atherosclerotic plaques, thereby ultimately leading to CI.
There were some limitations associated with the present study. Case–control studies can sometimes exhibit pseudo-positive results due to the sample scales. In the present study, our results indicated that there was a weak association between the SMTN gene and CI in Japanese individuals. However, in order to definitively confirm the reliability of the present data, additional experiments and further studies in a larger population will need to be conducted.
Footnotes
Acknowledgements
We would like to thank Ms K Sugama for her excellent technical assistance.
Funding
This work was supported by a grant from the Toray Co., Ltd and by the Ministry of Education, Culture, Sports, Science and Technology of Japan (MEXT)-Supported Program for the Strategic Research Foundation at Private Universities, 2008–2012.
Conflict of interest
None declared.