
Abstract
Detection of peripheral artery disease (PAD) typically entails collection of medical history, physical examination, and noninvasive imaging, but whether a risk factor-based model has clinical utility in population screening is unclear. Our objective was to derive and validate a new score for estimating PAD probability in individuals or populations. PAD presence was determined by a history of previous or current intermittent claudication associated with an ankle–brachial index (ABI) of < 0.9 or previous lower extremity arterial intervention. Multivariable stepwise logistic regression identified cross-sectional correlates of PAD from demographic, clinical, and laboratory variables. Analyses were derived from 18,049 US REACH (REduction of Atherothrombosis for Continued Health) Registry outpatients with a complete baseline risk factor profile (enrolled from December 2003 to June 2004). Model performance was assessed internally using 10-fold cross validation, and effect estimates were used to generate the score. The model was externally validated using the Framingham Offspring Study. Age, sex, smoking, diabetes mellitus, body mass index, hypertension stage, and history of heart failure, coronary artery disease, and cerebrovascular disease were predictive of PAD prevalence. The model had reasonable discrimination on derivation and internal validation (c-statistic = 0.61 and 0.60, respectively) and external validation (c-statistic = 0.63 [ABI < 0.9] or 0.64 [clinical PAD]). The model-estimated PAD prevalence varied more than threefold from lowest to highest decile (range, 4.5–16.7) and corresponded closely with actual PAD prevalence in each population. In conclusion, this new tool uses clinical variables to estimate PAD prevalence. While predictive power may be limited, it may improve PAD detection in vulnerable, at-risk populations.
Introduction
It is estimated that as many as 8–12 million people in the United States have peripheral artery disease (PAD), and a high fraction are not diagnosed before a first major cardiovascular ischemic event, which limits early use of proven risk-reduction therapies.1–4 An ideal PAD diagnostic strategy would be performed in a well-defined population enriched with individuals in whom the target disease is likely present.
Nevertheless, no evidence-based tool now exists to efficiently define a population at high risk for PAD. We hypothesized that cross-sectional atherosclerosis registries would permit creation of a new ‘PAD risk score’ to define the individual probability of prevalent PAD. Such a score would have potential value in both office practice and larger cardiovascular population screening programs.
The large US cohort of the international, contemporary REACH (REduction of Atherothrombosis for Continued Health) Registry provided a unique opportunity to create a risk factor-based model for improving PAD detection in an outpatient, ‘real-world’ setting. To assure clinical utility, the model would require validation in another relevant population-derived sample, such as the Framingham Offspring Study (FOS).
The two pre-hoc requirements considered for creation of the model PAD risk score were that: (1) such a model would use only routinely available demographic and clinical variables known to be relevant to PAD etiology; and (2) such candidate variables would cumulatively provide the best prediction of clinical PAD within the context of current national and international care guidelines (i.e. not requiring a new definition of ‘high risk’).
Methods
Study populations
Development dataset
We studied patients from the United States enrolled in the REACH Registry, a prospective database of patients aged ≥ 45 years, with established cerebrovascular disease (CVD), coronary artery disease (CAD), PAD, or with three or more atherosclerosis risk factors. 3 The design of the REACH Registry has been described previously.3,4 REACH is an observational registry designed to provide clinical follow-up of 68,236 outpatients from 44 countries in North America, Latin America, Western Europe, Eastern Europe, the Middle East, Asia, and Australia. Patients were enrolled over an initial 7-month recruitment period (December 2003 – June 2004). Patients were excluded from participation if they were already part of a clinical trial, might have difficulty returning for follow-up visits, or were hospitalized.
Data regarding demographic characteristics, risk factors, medical history, and medical management were collected at baseline. The REACH protocol was submitted to institutional review boards according to local requirements, and written informed consent was required for all patients. For this study, we only used the subset of data obtained from the US REACH participants at baseline.
Validation dataset
The FOS was initiated in 1971 when a sample of 5124 men and women, consisting of the offspring of the original Framingham Heart Study cohort and their spouses, was recruited. For this study, we used the FOS Examination 8, which began in March 2005 and concluded in January 2008.
Definitions of PAD
Using responses recorded at baseline, US REACH PAD participants included individuals with previous or current intermittent claudication associated with an ankle–brachial index (ABI) of < 0.9 or previous lower extremity arterial intervention (e.g. leg angioplasty, stenting, atherectomy, peripheral arterial bypass graft, or amputation).
In the FOS, PAD was defined in two ways: (1) an ABI of ≤ 0.9; or (2) the presence of clinical PAD (intermittent claudication or lower extremity arterial revascularization). At each routine FOS research examination, a standardized physician-administered medical history was conducted that included queries about symptoms of intermittent claudication and revascularization procedures. 5 A Framingham Heart Study endpoint review panel comprised of three senior investigators made the final determination of the presence of intermittent claudication and reviewed medical records to verify self-reports of revascularization procedures.
Statistical analyses
Derivation of multivariable model
Of the 25,686 patients enrolled in the US cohort of the REACH Registry, 18,049 had complete baseline risk factor data available. These patients were used to develop the regression models.
Risk factors that are known to be associated with PAD, as well as available in the REACH database, were selected for evaluation. Baseline characteristics that were candidates for entry into the stepwise logistic regression model included sex, race/ethnicity (five levels: Caucasian, Hispanic, black, other ethnic origin, and Asian), current smoking status, body mass index (BMI), treated hypertension, hypertension stage (normal, high–normal, stage I, stage II), history of chronic heart failure (CHF), history of atrial fibrillation or flutter (AF), history of CAD, history of CVD, diabetes mellitus, fasting blood glucose, fasting triglycerides, and chronic, current treatment with acetylsalicylic acid.
A multivariable stepwise logistic regression procedure was used to determine the most influential candidates. A significance level of 0.10 was used for model entry and retention. To obtain more precise estimates, the final model was run on patients with complete data on the variables selected for the final model (N = 23,169).
Using the full model parameter estimates, an integer-based PAD score was developed 6 and a nomogram created to allow simple evaluation of PAD probability. Because the score was designed to have positive values only, Asians were designated the reference group for the race/ethnicity variable.
Model performance was assessed internally using 10-fold cross validation. 7 External validation was performed by applying the final model estimates to participants in the FOS who had ≥ 1 atherothrombotic risk factor or ≥ 1 of CAD, CVD, or PAD (N = 3065).
We assessed model discrimination, the ability of risk factors to differentiate between individuals who do and do not have PAD, by calculating the c-statistic. We also assessed calibration, which measures how closely the predicted probabilities of PAD reflect the observed data. Specifically, we calculated the Hosmer–Lemeshow (HL) goodness-of-fit χ2 statistic (with 8 degrees of freedom). A p-value < 0.05 represents a significant difference between the expected probabilities and observed data and suggests that the model is not well calibrated. All analyses were performed using SAS software, version 9.1.3 (SAS Institute, Cary, NC, USA).
Results
Of the 23,169 patients enrolled in the REACH Registry in the United States who had complete data on the variables selected for the final model, 2113 (9.1%) had PAD. In the FOS population (N = 3065), 245 patients (8.0%) had PAD as defined by an ABI of ≤ 0.9 and 166 patients (5.4%) had PAD as defined by the presence of clinical PAD. There were 86 participants that had both clinical PAD and an ABI of ≤ 0.9. Demographics of the REACH derivation and FOS validation populations are given in Table 1. There was no evidence that the data were not missing completely at random in the derivation sample compared to the larger US REACH sample and the sample used to create the final model (data not shown). In addition, PAD prevalence was similar across the derivation sample, the larger US REACH sample, and the sample used to create the final model (8.9%, 9.3%, and 9.1%, respectively). The FOS population includes only Caucasians and appears somewhat healthier than the REACH population, as documented by the difference in comorbidity profiles.
Characteristics of the derivation (US REACH Registry) and validation (FOS) populations

Systolic blood pressure (BP) of 130–139 mmHg or diastolic BP of 85–89 mmHg.
Systolic BP of 140–159 mmHg or diastolic BP of 90–99 mmHg.
Systolic BP ≥ 160 mmHg or diastolic BP ≥ 100 mmHg.
Defined using REduction of Atherosclerosis for Continued Health (REACH) criteria.
Defined as ankle–brachial index of ≤ 0.9.
Defined using adjudicated Framingham definition.
ASA, acetylsalicylic acid; BMI, body mass index; BP, blood pressure; CAD, coronary artery disease; CVD, cerebrovascular disease; FOS, Framingham Offspring Study; PAD, peripheral artery disease; SD, standard deviation.
The REACH PAD group was primarily male and Caucasian and, compared with the non-PAD group, had a similar prevalence of hypertension and dyslipidemia, but a lower BMI and higher prevalence of CHF, AF, CAD, and CVD (Table 2). Unlike other PAD populations that have been studied,8,9 there was no difference in diabetes status between the two groups.
Baseline characteristics by PAD status, US REACH population
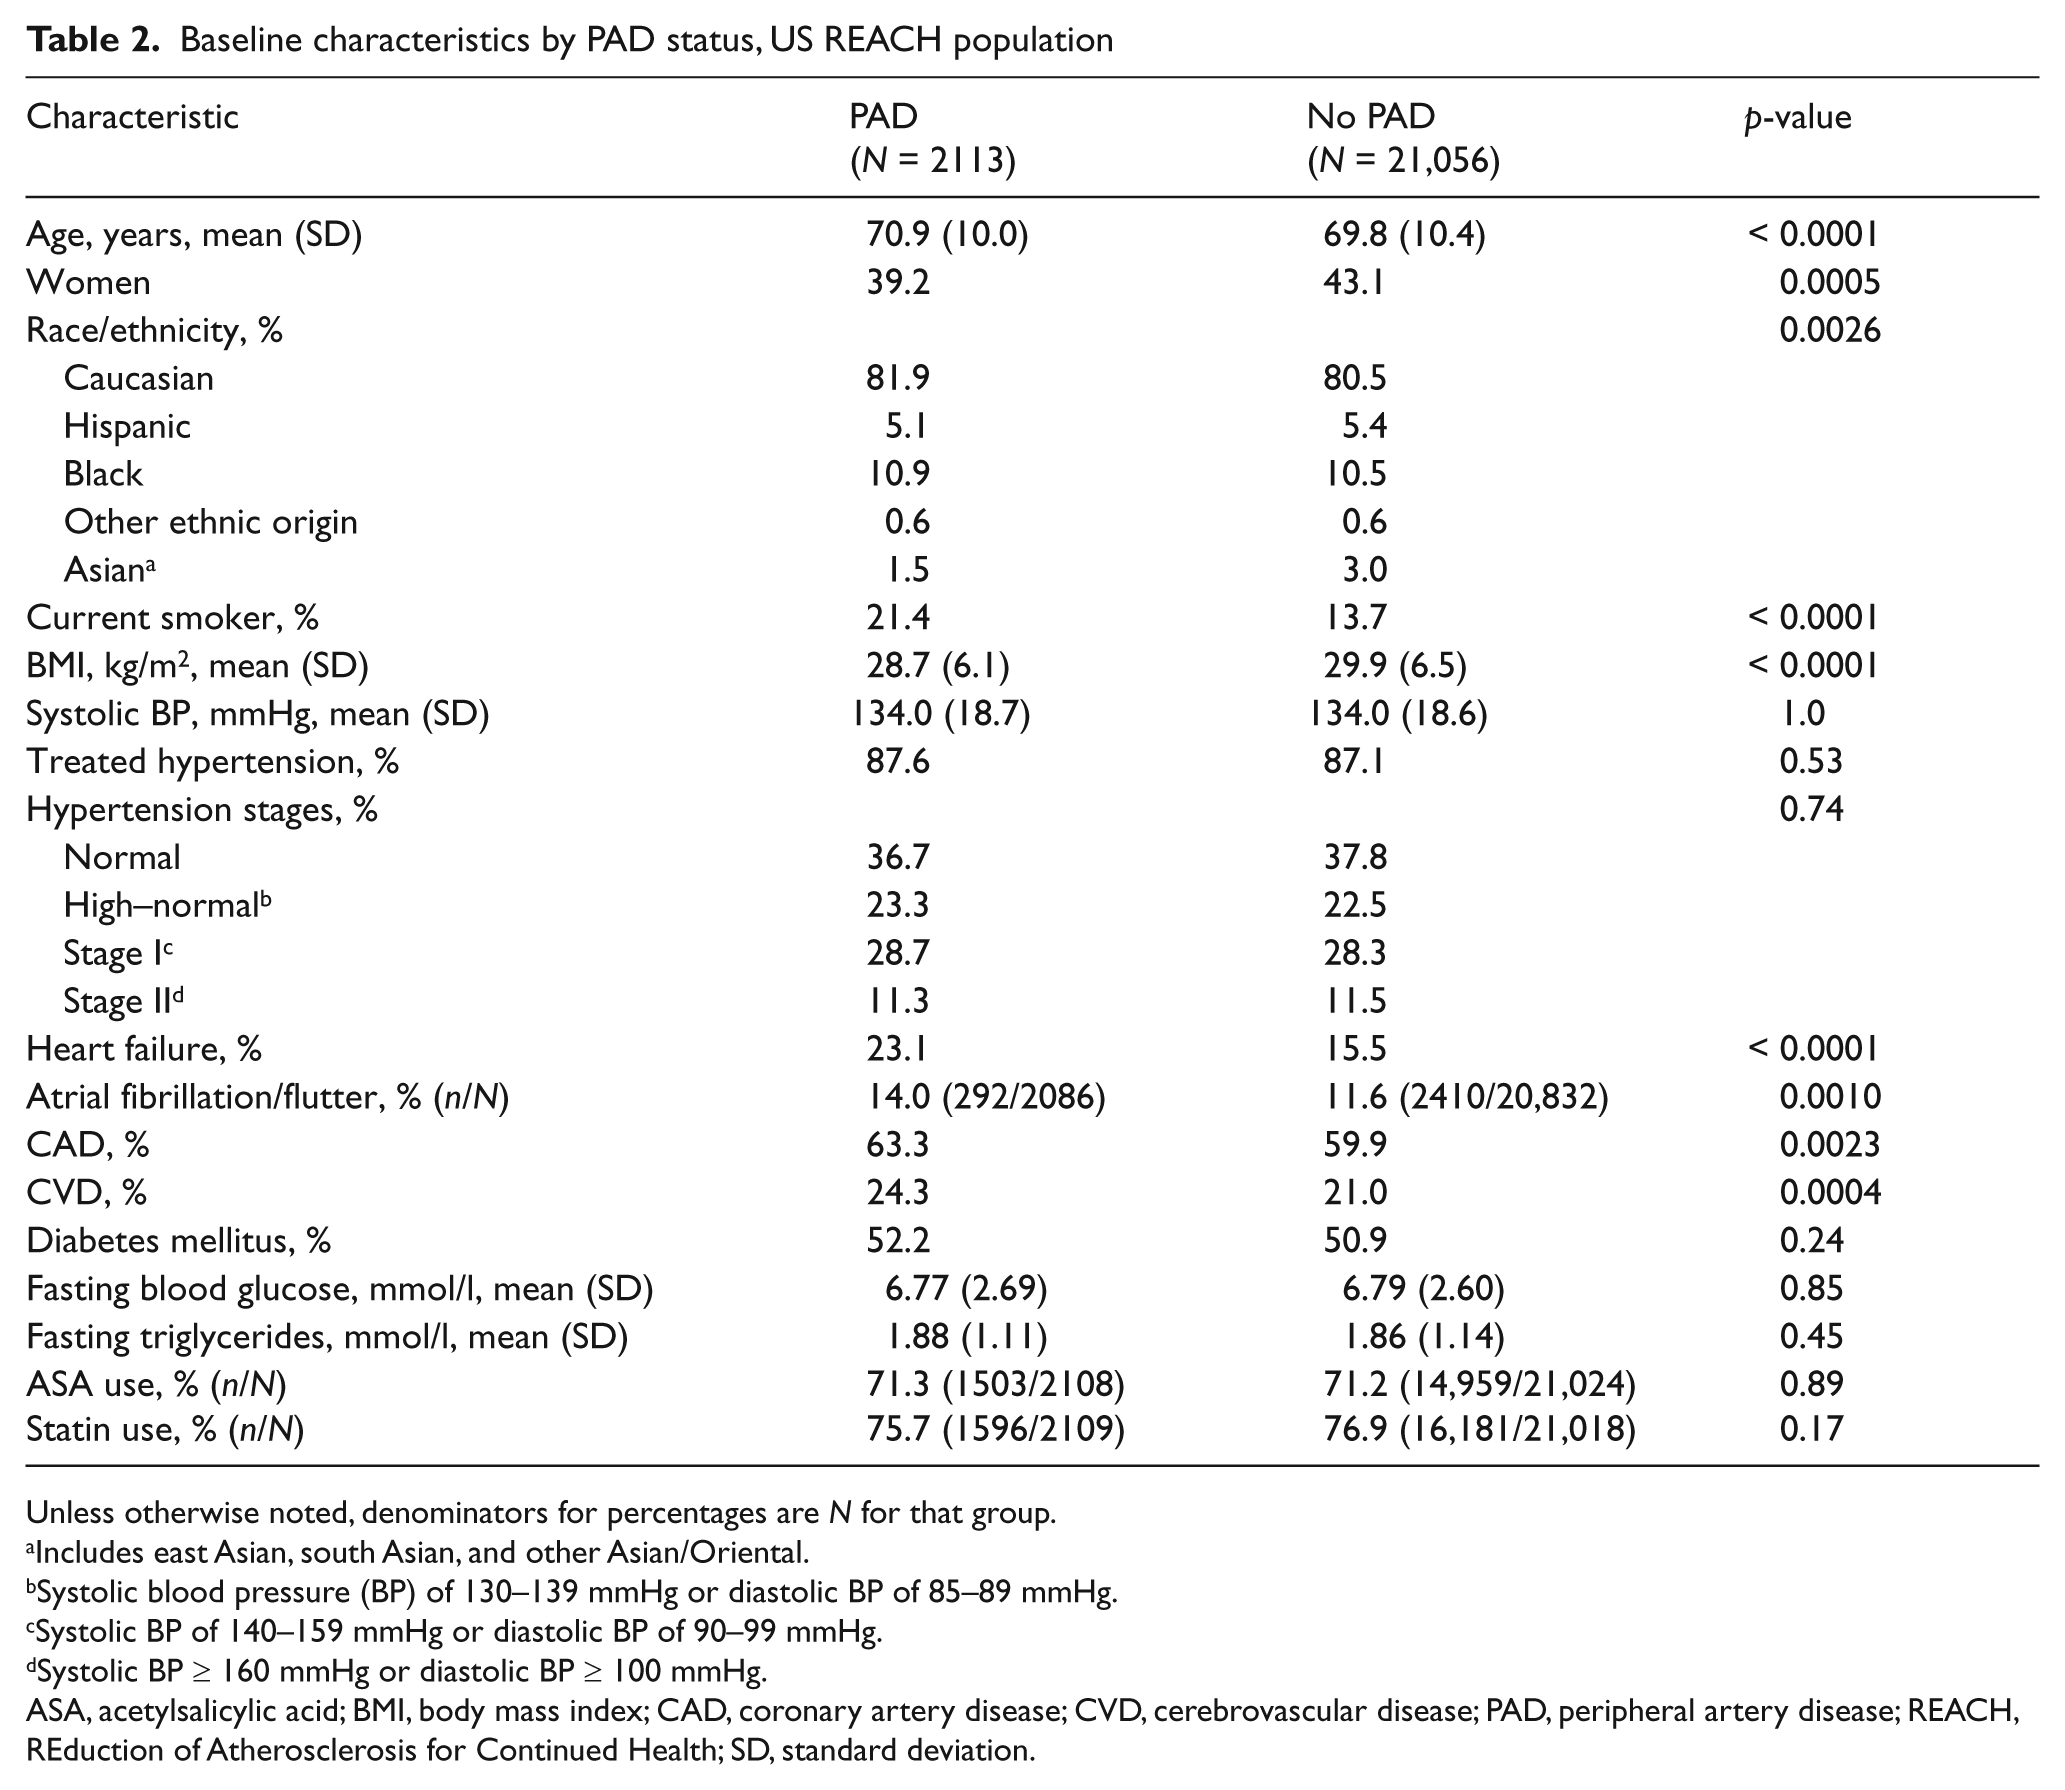
Unless otherwise noted, denominators for percentages are N for that group.
Includes east Asian, south Asian, and other Asian/Oriental.
Systolic blood pressure (BP) of 130–139 mmHg or diastolic BP of 85–89 mmHg.
Systolic BP of 140–159 mmHg or diastolic BP of 90–99 mmHg.
Systolic BP ≥ 160 mmHg or diastolic BP ≥ 100 mmHg.
ASA, acetylsalicylic acid; BMI, body mass index; CAD, coronary artery disease; CVD, cerebrovascular disease; PAD, peripheral artery disease; REACH, REduction of Atherosclerosis for Continued Health; SD, standard deviation.
US REACH PAD score model derivation and internal validation
The final model determined by the stepwise selection procedure included, in order of entry into the model, smoking status, history of CHF, BMI, age, sex, history of CVD, race/ethnicity, diabetes, history of CAD, and hypertension stage. Odds ratios from the multivariable model are given in Table 3.
Multivariable model for PAD prevalence in the US REACH population
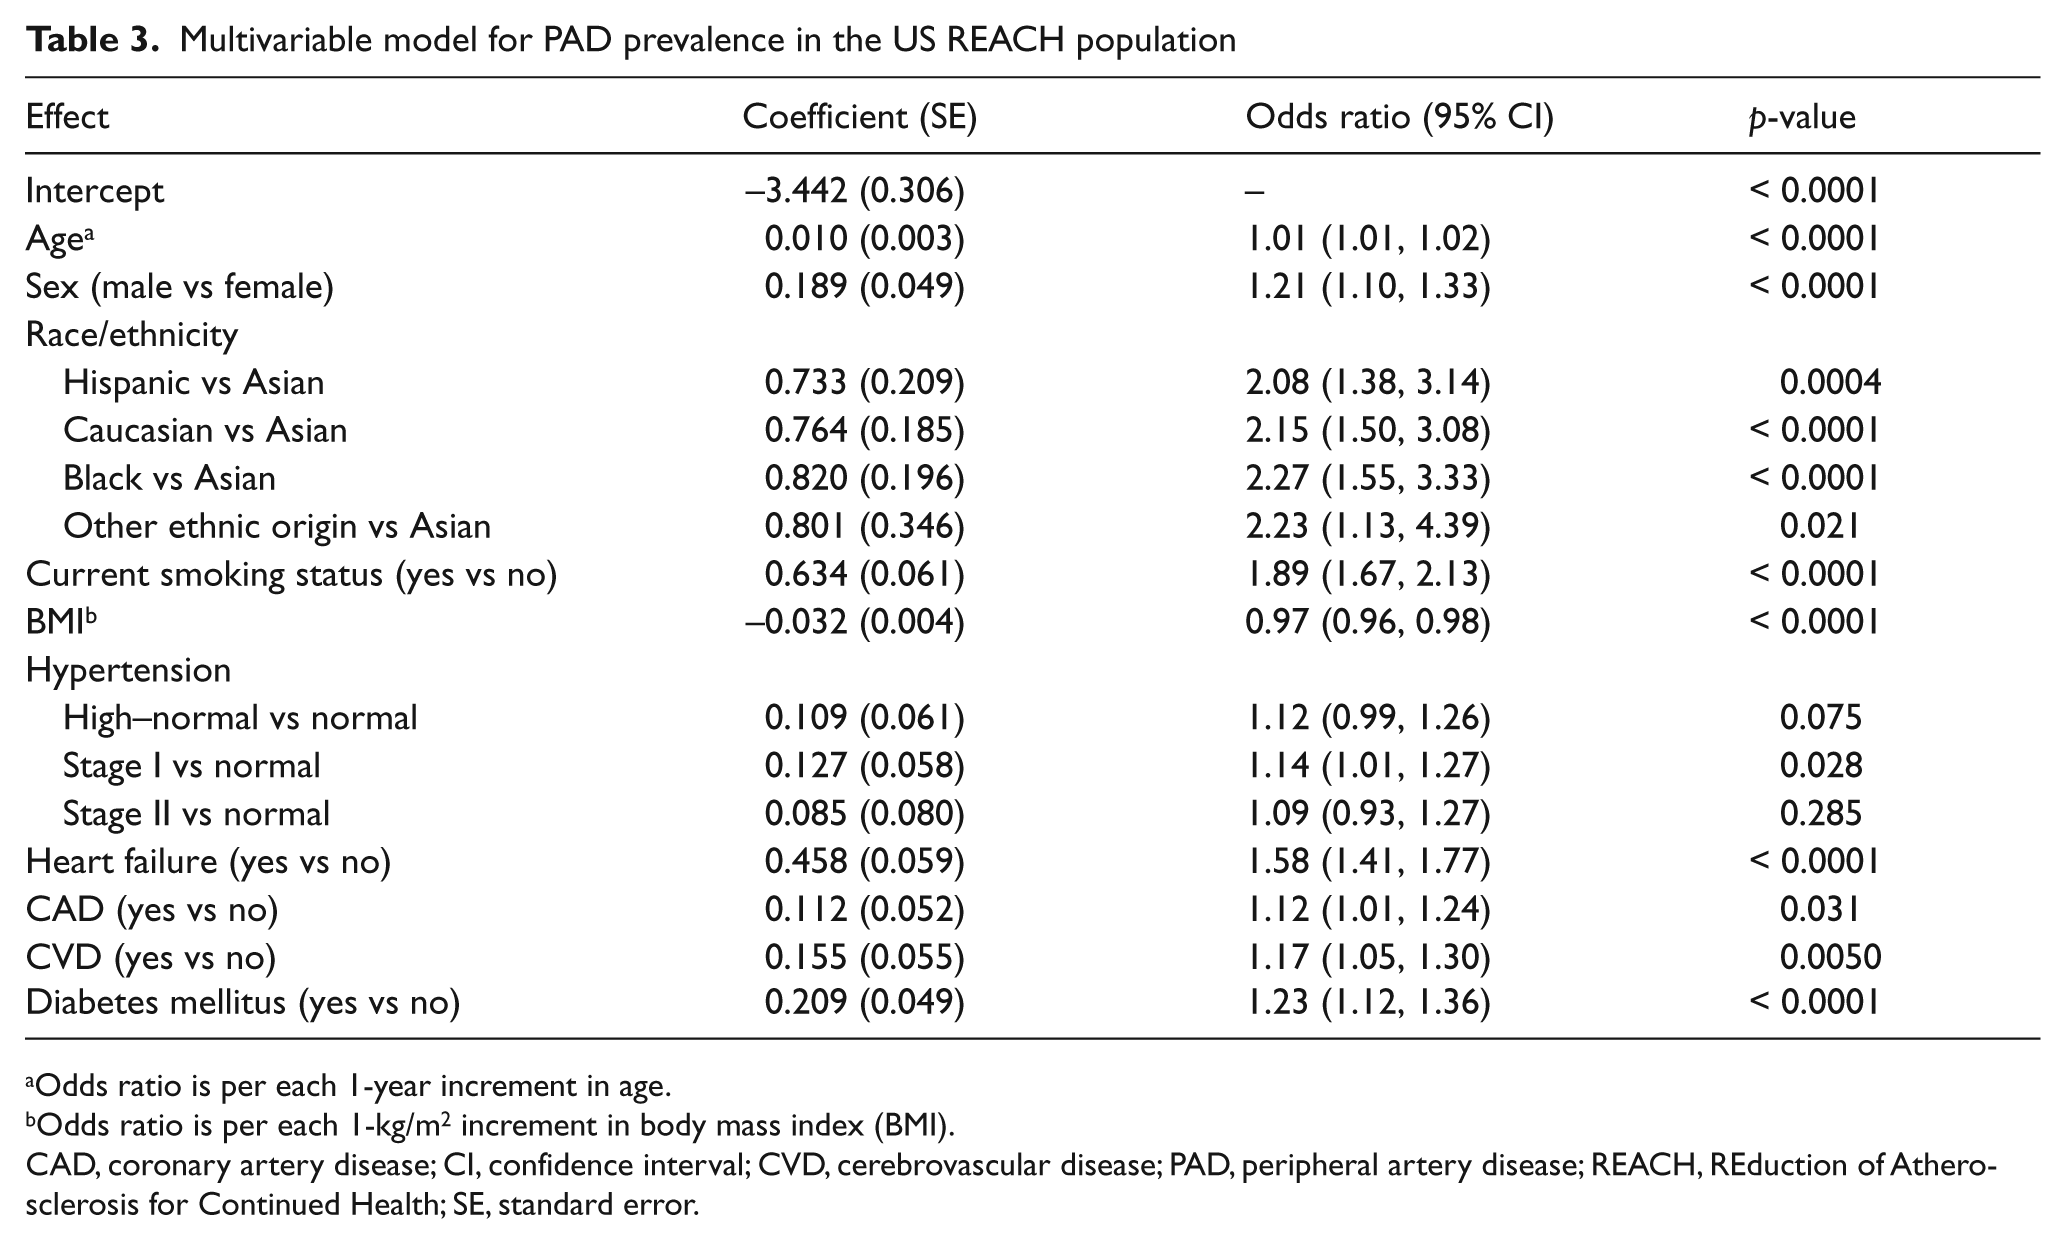
Odds ratio is per each 1-year increment in age.
Odds ratio is per each 1-kg/m2 increment in body mass index (BMI).
CAD, coronary artery disease; CI, confidence interval; CVD, cerebrovascular disease; PAD, peripheral artery disease; REACH, REduction of Atherosclerosis for Continued Health; SE, standard error.
The c-statistic from the final multivariable model was 0.614 (N = 23,169). The internal validation c-statistics were close in magnitude (median, 0.603; range, 0.602–0.605), indicating that the selected candidate variables in the final model have replicable predictive power. The HL χ2 statistic was 12.28, corresponding to a p-value of 0.14 (with 8 degrees of freedom), indicating good fit to the data. The multivariable model-estimated PAD prevalence varied more than threefold from the lowest to highest decile (range, 4.5–16.7%) and corresponded closely with the actual PAD prevalence observed (Figure 1).
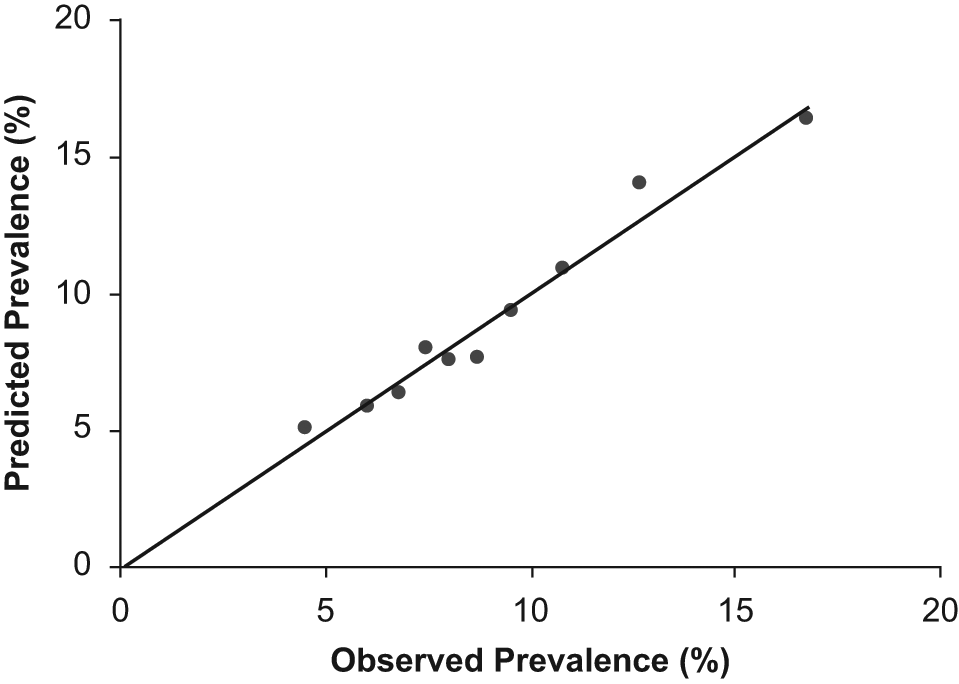
Calibration of the internal validation model, with line of identity denoting perfect calibration.
Figure 2 represents a nomogram of the integer-based score. In this representation, one can more easily discern the relative contributions of risk factors to the overall score. Moreover, the score is mapped to PAD prevalence at the bottom of the graphic. To illustrate use of the score for a particular individual, we calculated the score and estimated probability of PAD for a hypothetical 72-year-old male Caucasian smoker with a BMI of 25 kg/m2, stage I hypertension, diabetes, and concomitant CAD. Given this set of risk factors, the score is calculated to be 54, corresponding to a PAD probability of 19% (Figures 2 and 3).
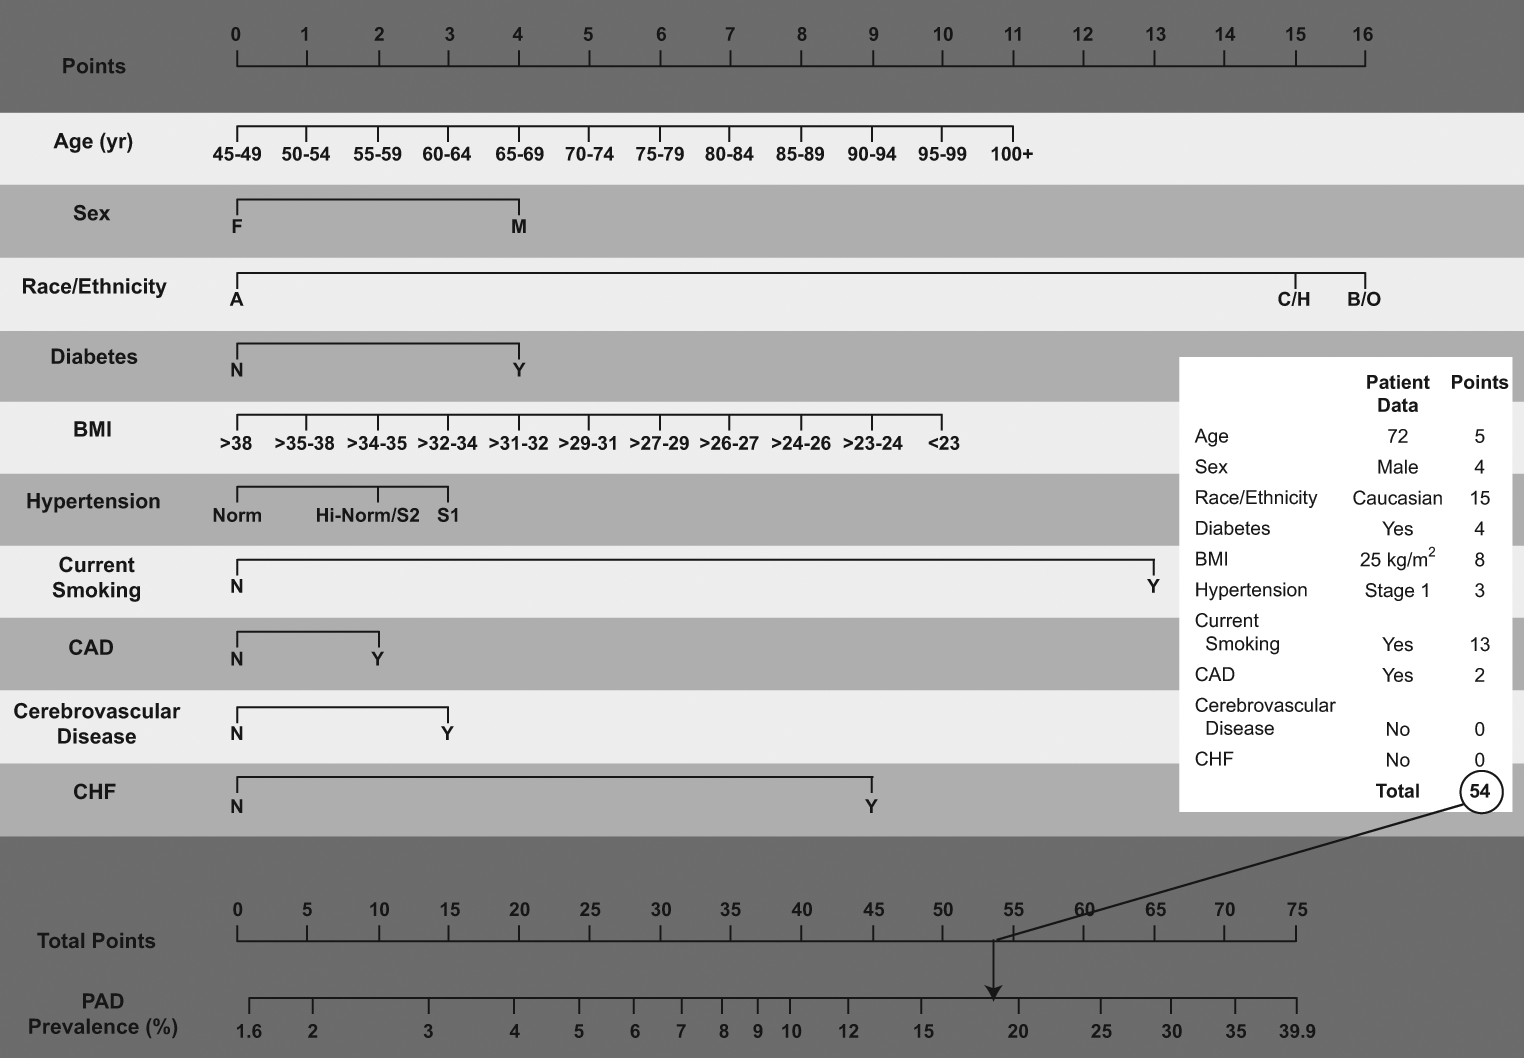
Nomogram for the score, showing an example for a 72-year-old male Caucasian smoker with a body mass index (BMI) of 25 kg/m2, stage I hypertension, diabetes, and prevalent coronary artery disease (CAD). (Race/ethnicity: A = Asian, H = Hispanic, C = Caucasian, B/O = black, other. Hypertension: Norm = normal, Hi-Norm = high–normal, S1 = stage I hypertension, S2 = stage II hypertension. CHF, chronic heart failure; PAD, peripheral artery disease.)
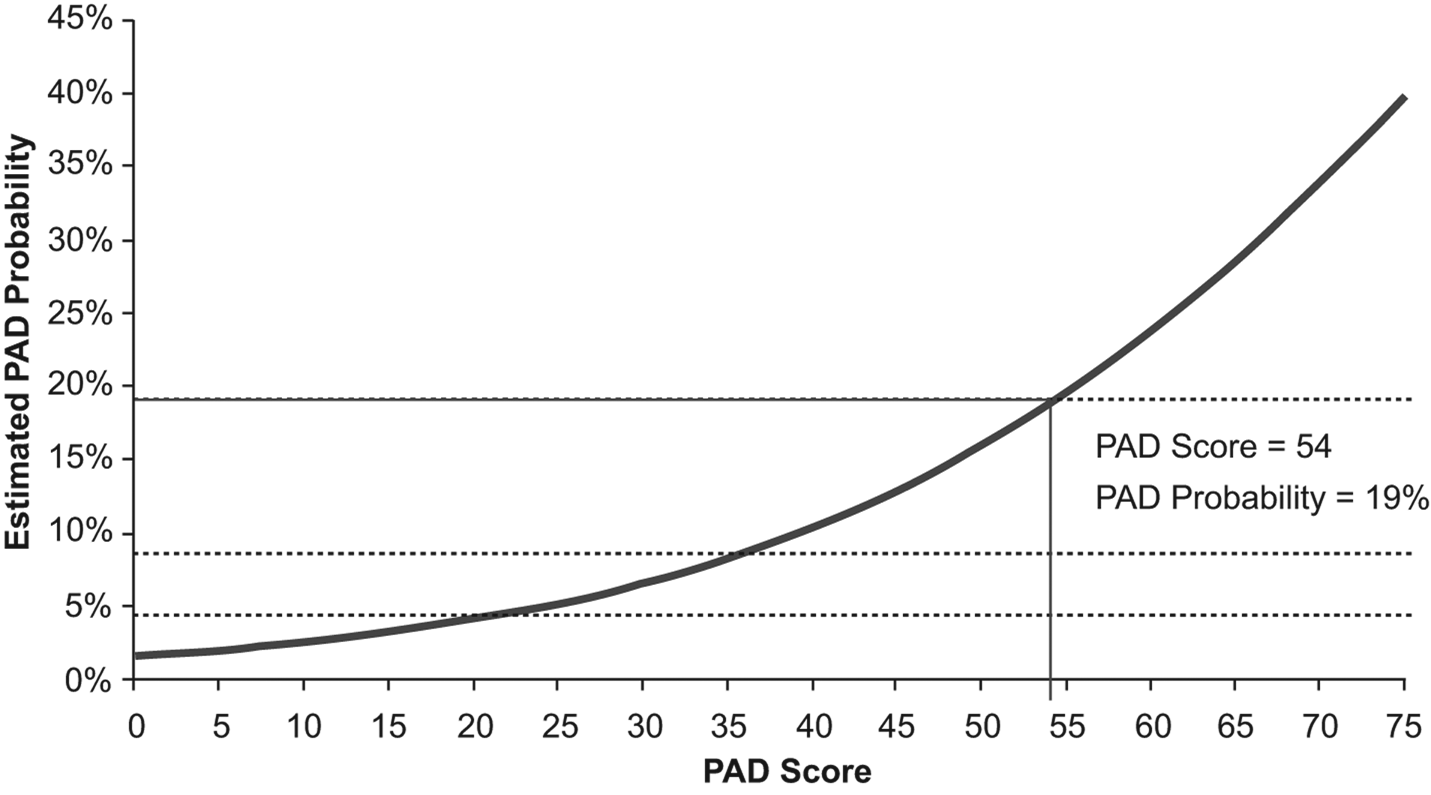
Relationship between individual patient score and estimated prevalence of peripheral artery disease (PAD). The solid line indicating a PAD score of 54 and PAD probability of 19% represents the score and estimated probability of PAD for a 72-year-old male Caucasian smoker with a body mass index of 25 kg/m2, stage I hypertension, diabetes, and prevalent coronary artery disease.
Table 4 displays the performance of the score within the REACH dataset. These data demonstrate the modest sensitivity and specificity values achieved across the score range. While the positive predictive value remained low using this scoring system, the negative predictive value was reasonably high across the range of scores. These values would obviously vary when the score is applied in differing populations.
Diagnostic characteristics of the score in the US REACH dataset
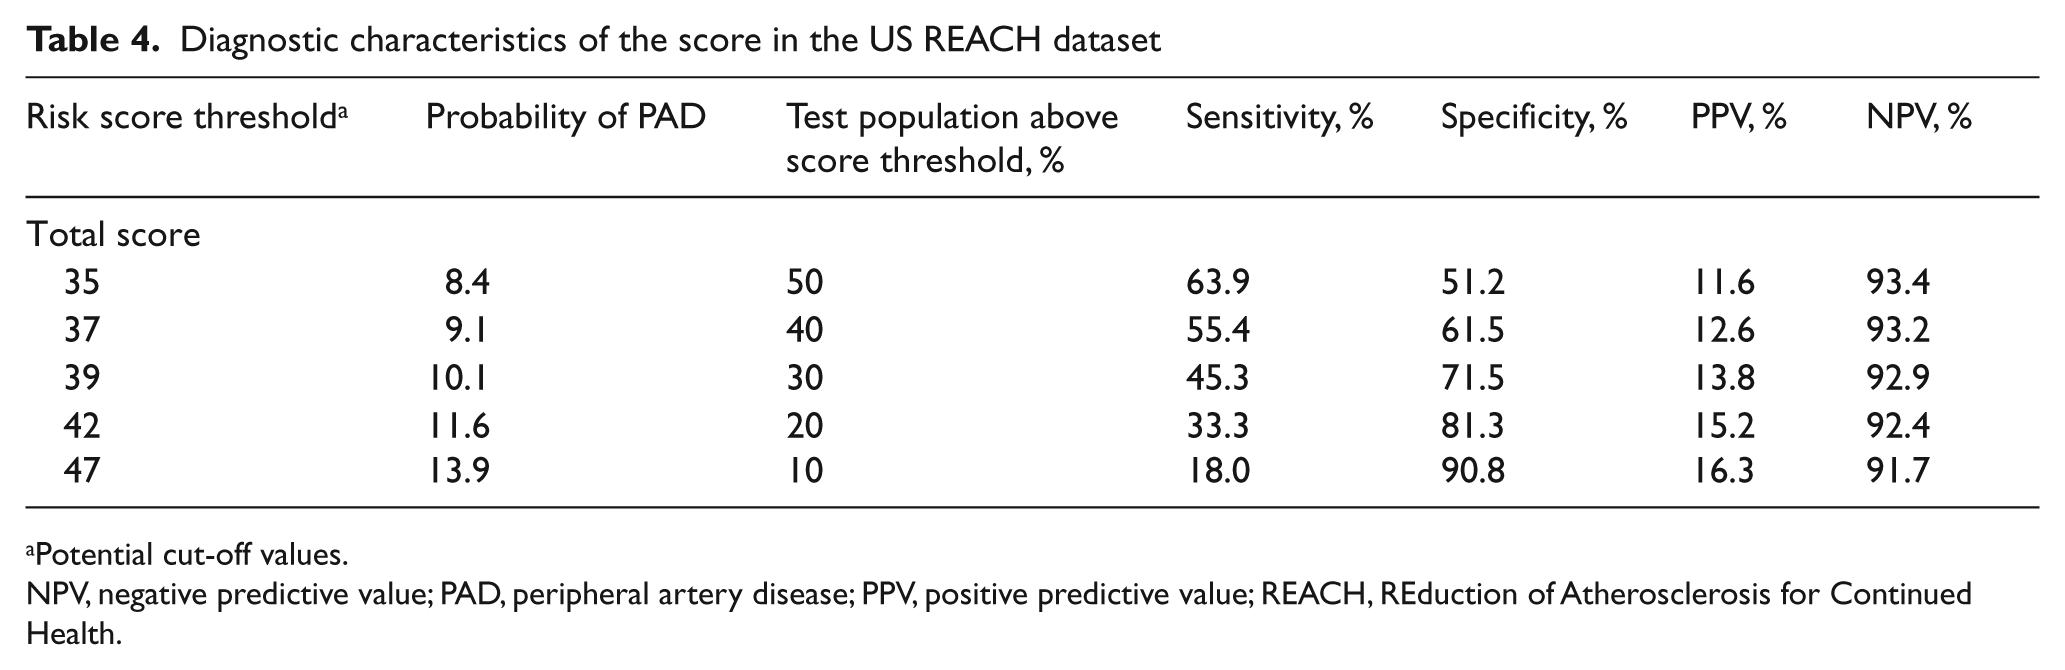
Potential cut-off values.
NPV, negative predictive value; PAD, peripheral artery disease; PPV, positive predictive value; REACH, REduction of Atherosclerosis for Continued Health.
External Framingham Offspring Study validation analysis
The US REACH Registry and FOS populations were well-matched for most variables, including mean age, PAD prevalence defined by ABI, and blood pressure. The REACH population was more racially/ethnically diverse and showed a greater prevalence of CAD and CVD (Table 1). When the US REACH PAD model was applied to the FOS population, the c-statistic was 0.64 when PAD was defined by ABI and 0.63 when PAD was adjudicated by the FOS review committee; the HL χ2 statistic was 28.8 (p < 0.001) and 45.7 (p < 0.001), respectively. Generally, HL χ2 < 20 is considered an adequate fit. Figure 4A displays the predicted prevalence (based on the US REACH PAD model) versus observed prevalence when PAD is defined by ABI. Despite the HL statistic being > 20, the US REACH PAD model predicts the FOS PAD prevalence well, with the exception of participants in the highest risk decile, where the US REACH PAD score under-predicts the risk (the predicted–observed difference in this last decile is the greatest contributor to the large χ2 value of 28.8). Figure 4B displays similar information, but where the observed data for FOS are based on adjudicated PAD events. Here, the fit is not as good, with the US REACH PAD model generally over-predicting the number of adjudicated FOS events. This over-prediction is not surprising, given that the adjudicated PAD rate in FOS is only approximately 5%, whereas the US REACH PAD rate, on which the predictive model is based, is approximately 9%.
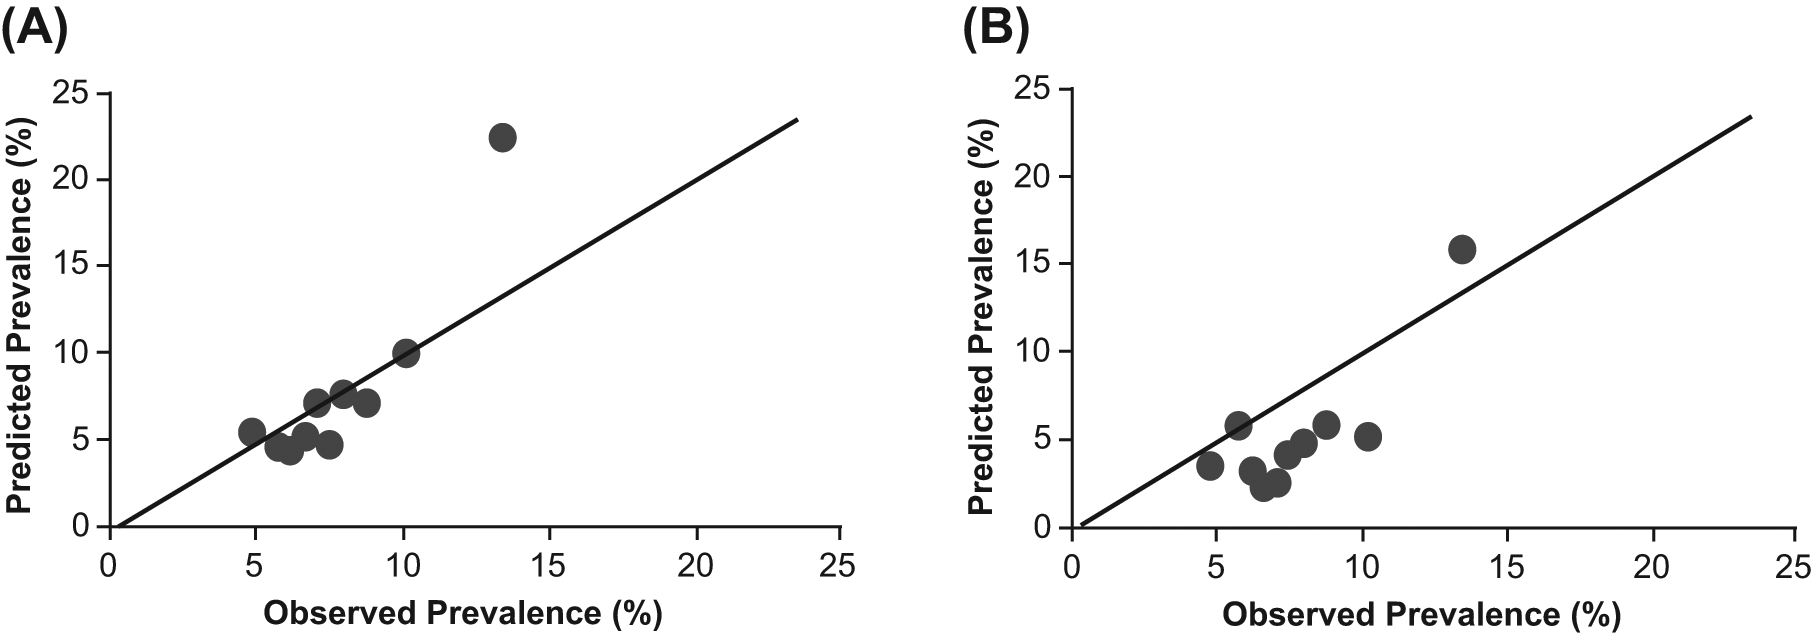
Predicted versus observed prevalence in the Framingham Offspring Study population when peripheral artery disease (PAD) is (A) defined by ankle–brachial index; (B) based on adjudicated values. Predicted values are based on the US REACH PAD model.
Discussion
We have developed and validated a new PAD risk assessment tool that utilizes commonly available demographic and clinical factors, which are readily obtainable at no additional cost, which can effectively improve individual prediction of the ‘current risk’ of having PAD. Such a tool may provide a simple method to ‘pre-screen’ individuals, clinic populations, or community cohorts for PAD, regardless of the size of the defined sample (from an individual to a population), before performance of the more time-consuming ABI measurement.
The ability to identify a high-risk cohort (defined by the positive predictive value), using this risk score tool, may support the two key primary PAD clinical care goals: (a) to identify prevalent PAD in order that cardiovascular risk may be lowered and (b) to provide early recognition of a PAD functional disability so that PAD-specific quality of life might be improved.
The ability to identify a low-risk cohort (defined by the negative predictive value) using this risk score tool may be useful by helping clinicians, practices, and screening programs from fostering overuse of the ABI test. A person identified as ‘low PAD risk’ need not be tested and health care resources might be thus better focused on high-risk individuals. Thus, the risk score might be particularly useful in fostering ‘ABI appropriate use’.
The components of this PAD risk score (age, sex, race/ethnicity, current smoking, history of diabetes, hypertension stage, BMI, and known history of CAD, CVD, and CHF) are easily identified by health care professionals and the public. As laypersons do not often know their individual BMI, the nomogram could easily be adapted to calculate this measure from reported height and weight. Heretofore, there has not been a mechanism to translate a PAD risk factor profile into an integrated score. This is analogous to use of clinically available factors to assess the pre-test probability of venous thromboembolism. 10
This new tool improves on those suggested by other investigators by not requiring an assessment of leg symptoms or a clinical examination. Bendermacher et al. recognized the potential benefit of a PAD risk score, derived from a general practice population in The Netherlands, preselected based on age > 55 years and common atherosclerosis risk factors, but without claudication symptoms. 11 This model excluded use of comorbid CAD or CVD, as it was deemed that risk reduction therapy use would not change if PAD were detected in this population. Thus, only age, smoking, and hypertension were final variables included in this risk model. Such an approach is indeed simple, but may exclude tangible risk that is now shown to be encompassed in the model we have created. Makdisse et al. published a PAD risk score derived from a small (< 175 individuals), elderly population of individuals aged ≥ 75 years from the Epidoso cohort study in Brazil. 12 This study used abnormal pedal pulses, hypertension, cigarette smoking, and exertional leg symptoms as useful predictors of PAD. Nevertheless, these prior efforts either require physician examination (e.g. detection of pedal pulses), accurate recognition of leg symptoms, or exclude important variables (e.g. presence of clinically known atherosclerotic disease in other circulations).
In contrast, this new tool was created with the advantage of being initially derived from the US cohort of the REACH Registry, a very large outpatient, geographically dispersed, national population in which the presence of PAD was well-defined. Inasmuch as no registry ever fully represents the population in whom a risk stratification tool might be used, external validation within the FOS, a true population-based sample, verifies that the candidate variables are indeed predictive, accurate, and could potentially serve an important clinical and public health purpose.
Over the past two decades, many risk detection instruments have been created for the assessment of prospective cardiovascular risk,13–17 venous thromboembolism, 18 osteoporosis,19,20 and asthma. 21 Such scoring systems have impact only when they are able to be easily disseminated, used by clinicians and the public, and their discrimination improves knowledge of risk. We therefore created an easily used nomogram (Figure 2) that could be utilized by the public and individual clinicians, and be programmed into personal digital assistants, smart phones, or electronic medical records.
Application of the score
We have not defined a specific cut point above which an ABI test would be recommended. As noted in Table 4, varying thresholds can be utilized to obtain predictable rates of false-positive and false-negative tests.
Such data may be interpreted within a hypothetical clinic-based or screening population. For example, if the score was applied within a low-risk primary care clinic with 1000 patients aged > 45 years and with an assumed PAD prevalence of 8%, 80 patients would be expected to have PAD. If a cut point of 35 was chosen, 500 patients (50%) would undergo ABI testing; 51 individuals with PAD would be identified, and 449 patients would have a normal ABI. Twenty-nine patients with PAD would not be tested and would thus remain undetected. If a higher cut point of 42 was chosen, only 200 patients (20%) would undergo ABI testing; 27 individuals with PAD would be identified, and 173 would have normal ABI results. Fifty-three patients with PAD would remain undiagnosed because they were not tested.
For an older, higher-risk population with a higher PAD prevalence such as 20%, closer to that of the PARTNERS (PAD Awareness, Risk, and Treatment: New Resources for Survival) study, 1 200 patients would be expected to have PAD. Again, if a cut point of 35 was selected, 500 patients (50%) would undergo ABI testing, with 128 individuals with PAD identified and 372 individuals with normal ABI. Seventy-two individuals with PAD would be untested and undiagnosed. Finally, if a higher threshold of 42 was selected, 200 patients (20%) would undergo ABI testing, and 67 PAD cases would be identified. In this scenario, 133 individuals would have normal ABI results, and 133 patients with PAD would remain untested and undiagnosed.
Elaboration of cut points should be performed after a score is utilized in more diverse community-based populations, with cut points then based on clinical expertise and consensus. The potential derivation of ‘low-risk’, ‘medium-risk’, and ‘high-risk’ cut points could then provide a PAD risk ‘yardstick’ from which future incremental cost-effectiveness studies of ABI use may be modeled. In this frame, individuals at ‘low risk’ would not be encouraged to undergo ABI measurement; individuals at ‘medium risk’ would discuss ABI measurement benefit with their primary clinician; and ‘high-risk’ individuals would undergo such an assessment as is now recommended by all national PAD care and performance guidelines.22,23
All new diagnostic tools promoted for widespread use benefit from careful field testing. We propose that this tool be so tested. The score could be used as an antecedent screening test to enhance the pretest probability of prevalent PAD and applied in (a) community-based mass screening programs; (b) primary care clinics; (c) emergency departments; and (d) web-based sites for layperson use (e.g. http://www.padcoalition.org).
Study limitations
Development of any risk model is intrinsically limited by the population from which it is derived, the population in which it is externally validated, and the potential discriminatory or reclassification benefit offered by the tool. In the REACH Registry, only a subset of individuals underwent ABI measurement (n = 1387); thus, this analysis may have misclassified individuals with asymptomatic PAD. Despite this limitation, this is a large derivation population and the new PAD risk score is able to identify current PAD risk. We note that this score does not predict future risk of incident PAD or future risk of PAD-associated ischemic events. This limitation is mandated by our derivation of this model from a major cross-sectional national dataset. We also note that our derivation populations (REACH and Framingham) are both limited in ethnic diversity. Thus, the utility of the risk score in ethnically more diverse real-world cohorts will require future study.
Despite these intrinsic limitations, we utilized the largest relevant outpatient PAD sample from which to derive candidate variables (the 18,000 individuals in the US REACH Registry cohort with complete baseline risk factor profiles) and to validate the candidate variables within a community-based population cohort (the FOS). The dual use of registry and population-derived cohort data will almost certainly represent the best model available for such an analysis in PAD populations for the foreseeable future.
Conclusion
This new tool uses readily available clinical variables to allow clinicians to estimate the probability of PAD across a wide range of patients with, or at risk for, atherosclerotic disease. Although the predictive power of the model may be limited, there is no better tool currently available to guide cost-effective use of the ABI in at-risk populations. Application of this new PAD score in office practice or screening programs may improve PAD detection in vulnerable, at-risk populations.
Footnotes
Acknowledgements
The first and all subsequent drafts were written by Prof Duval. Editorial support for the creation of this manuscript was provided by Melanie Leiby, PhD, of inScience Communications, Springer Healthcare.
Funding
The REACH Registry is endorsed by the World Heart Federation. Financial support is provided by Bristol-Myers Squibb, sanofi-aventis, and the Waksman Foundation (Tokyo, Japan). Editorial support was funded by the Bristol-Myers Squibb/Sanofi Pharmaceutical Partnership. The statistical support provided by Drs D’Agostino Sr, Massaro, and Pedley was also funded by this partnership.
Conflict of interest
SD had a consultancy relationship with Abbott Vascular and Summit Doppler. JM (Dr Massaro) and AP had support from sanofi-aventis for the submitted work. MJ had a consultancy relationship with Abbott Vascular, Arsenal Medical, AtheroMed, Baxter Healthcare, Boston Scientific, Cordis Endovascular, LC Sciences, Medtronic, Micell Technologies, Nexeon MedSystems, and Takeda Pharmaceuticals. MJ has held stock/stock options in Access Closure, Hotspur Technologies, ICON Interventional, Setagon, Inc., Square One, TMI Group, and Vascular Therapies LLC. MJ has been a board member of VIVA Physicians. WB had a consultancy relationship with Gilead Scientific. WB has received grants/grants pending from Abbott Laboratories. WB has received payment for lectures including service on speakers’ bureaus from Abbott Laboratories, Gilead Scientific, and sanofi-aventis. WB has received payment for development of educational presentations from Gilead Scientific and sanofi-aventis. WB has had travel/accommodations/meeting expenses unrelated to activities listed with Abbott Laboratories, Gilead Scientific, and sanofi-aventis. RC had support from sanofi-aventis for the submitted work. RC had a consultancy relationship and travel/accommodations/meeting expenses unrelated to activities listed with sanofi-aventis. KE has received grant/research support from Biosite, Bristol-Myers Squibb, Cardiac Sciences, Blue Cross Blue Shield of Michigan, Hewlett Foundation, Mardigian Fund, Pfizer, sanofi-aventis, and the Varbedian Fund. KE had a consultancy relationship with the National Institutes of Health, the National Heart, Lung, and Blood Institute, Pfizer, sanofi-aventis, and the Robert Wood Johnson Foundation. GF had a consultancy relationship with and received payment for lectures including service on speaker’s bureaus with Bristol-Myers Squibb and sanofi-aventis. PGS had support from sanofi-aventis for the submitted work. PGS had a consultancy relationship with Astellas Pharma, AstraZeneca, Bayer, Boehringer Ingelheim, Bristol-Myers Squibb, Daiichi Sankyo, Inc./Eli Lilly alliance, GlaxoSmithKline, Medtronic, Merck, Otsuka Pharmaceutical, Roche, sanofi-aventis, Servier, and The Medicines Company. PGS has received grants/grants pending from Servier. PGS has received payment for development of educational presentations including service on speakers’ bureaus from AstraZeneca, Boehringer Ingelheim, Merck, Pfizer, Roche, and Servier. PGS has held stock/stock options with Aterovax. DB had support from sanofi-aventis for the submitted work. DB has received grants/grants pending from AstraZeneca, Bristol-Myers Squibb, Eisai, sanofi-aventis, Amarin, Ethicon, Medtronic, and The Medicines Company. AH had support from Bristol-Myers Squibb and sanofi-aventis for the submitted work. AH had a consultancy relationship with Summit Doppler, ev3, and Talecris. AH has received grants from the National Heart, Lung, and Blood Institute, Cytokinetics, and Abbott Vascular.