
Abstract
The processes of convergence and digitization of television have brought about significant transformations, reshaping audience behaviours and viewing practices. The multiplicity of screens and platforms makes it challenging for traditional TV audience measurement methods to fully evaluate audience size and composition. Extensive datafication of audiovisual media is enabling the analysis of arrays of digital footprints. However, different measurement methods across platforms may yield divergent outcomes, highlighting the need for comparative analysis. The article explores the potential of multidimensional TV audience study to enhance understanding of contemporary TV audiences. Our analysis is based on numerous datasets of Estonian Public Broadcasting, incorporating live, time-shifted and video-on-demand viewing modes – all somewhat distinct in terms of their technical features. The analysis compares the viewing modes in terms of metadata of viewed content, demonstrating how a multidimensional study can provide a more comprehensive, yet differentiating, view of contemporary consumption patterns of televisual content.
Keywords
Introduction
The article explores whether comparative analysis across several viewing modes of television (TV) content has a potential to widen the understanding of contemporary TV audiences by exploiting novel ways of combining data from several sources. The paper introduces a quantitative study conducted on a unique dataset of rankings constructed on viewing data of audiovisual programmes of Estonian Public Broadcasting (ERR). The analysis combines three types of data: viewing modes (scheduled live viewing on TV, scheduled live viewing on the web, time-shifted viewing on TV, and viewing of video-on-demand (VOD)), viewership data for each viewing mode, and metadata categories describing the content (content type, country of origin, production year, channel of release).
TV has faced significant and profound changes in recent decades. Digitization has led to an increasing amount of content, the proliferation of time-shifted viewing, and the success of streaming services. Audiences are increasingly fragmented in terms of the content they consume, where and when they consume it, and the platforms and devices they use. All of these changes have presented a challenge for the traditional living room and TV-set-centric sample-based TV audience measurement (Kelly, 2019; Lotz, 2020; Napoli, 2012). There are concerns regarding the extent to which traditional TV audience measurement methods can capture and describe the whole composition of the audience, or the extent to which the traditional audience exposure reflects the popularity and success. In other words, the multiplicity of screens and viewing modes makes it difficult to evaluate audiences.
At the same time, enforced by the digitized and converging TV landscape, most of the public broadcasters have introduced their VOD services over the past decade (EBU, 2020b). While the viewership on VOD is on the rise, traditional linear TV viewership is declining (EBU, 2025b). Such a shift in consumption of TV content may pose challenges for public service media (PSM). First, in a multi-platform environment, PSM’s success should be judged less by single-channel ratings and more by how effectively a multi-platform service secures universal reach and diverse exposure. This, however, demands more multi-platform measurements (Donders, 2019). Second, diversity has long been recognized as an important aspect of mass media, especially for public broadcasters (McQuail, 1992). Yet, as PSM VOD services adopt personalized features associated with commercial VOD platforms (D’Arma et al., 2021; Iordache and Raats, 2023; Iordache et al., 2024), it remains unclear what effect this has on diverse media consumption. Diversity refers here to a broad and balanced range of content. Operationally, it is assessed through the evenness of content distributions across metadata categories and through how different viewing modes contribute to diverse and balanced exposure and consumption.
Digitization and datafication have greatly expanded the ability to collect and analyze user data. Audience measurement, reception evaluation, and popularity forecasting now draw on digital footprints from social media, service servers, and set-top boxes, offering new solutions to challenges in traditional TV audience metrics. Yet different measurement techniques often produce inconsistent results. Comparative and multidimensional studies are therefore essential, combining datasets to reveal relations between audiences, content types, platform functions, and cultural contexts (Napoli, 2012; Portilla, 2015).
This study applies such an approach by combining and analysing data across several viewing modes. While focused on Estonia, a small market undergoing digital transition, the broader aim is to demonstrate what multidimensional analysis can reveal about PSM performance. A further objective is to assess how distinct viewing modes, especially VOD, support PSM goals of enhancing diversity. The Estonian case thus provides methodological and conceptual insights relevant beyond its national context.
Empirical and theoretical framework
Challenges of traditional TV audience measurement
Measuring and understanding audiences has long been central to media managers and advertisers, with audience size and composition functioning as market ‘currencies’ (Nelson and Webster, 2016). Accordingly, audience measurement has been described as a ‘market information regime’ (Anand and Peterson, 2000) or ‘audience information system’ (Napoli, 2012). This aligns with Meehan (1984) argument that ratings do not simply record audience behaviour but actively construct ‘commodity audiences’ for institutional and market use. Following the liberalization of broadcasting policies, rankings have gradually become key assessment tools for PSMs also (Picard, 2002).
So far, the dominant measurement method has been the long-established sample-based and living-room-centric people meter that justified itself during the stable decades when linear TV viewing was the dominant viewing practice (Kelly, 2019; Neira et al., 2021). However, this method has been challenged in recent decades.
Time-shifted TV viewing was the first major disruption to people meter methods. However, soon it became measurable through audio matching, which compares programme samples with a database to identify viewing regardless of time (Buzeta and Moyano, 2013). At the same time, the explosion of content has further undermined the accuracy of people meter rankings. Fragmentation across niche channels has stretched people meter samples to their limits, measuring the long tail of content is, however, costly (Buzzard, 2012; Nelson and Webster, 2016).
These pressures are compounded by shifts in viewing practices. More content leads to more time-shifting (Neira et al., 2021), while media multitasking has intensified concerns about viewer attention (Portilla, 2015). Niche channels are expected to perform better in terms of engagement (Kosterich and Napoli, 2016), yet these niche audiences remain largely unmeasured by people meter, creating discrepancies between exposure-based and engagement-based metrics (Kosterich, 2016). As content moves beyond the linear logic and from TV sets to other devices, the contexts of consumption become blurred, underscoring the need to better define viewing modes for reliable cross-platform analysis.
New measurement perspectives
The datafication of media has expanded the possibilities for measuring audiences, but none of the new methods are flawless, nor can they fully replace sample-based approaches. Social media metrics, for instance, capture user behavior and engagement with TV programmes by aggregating conversations and reactions, making it possible to identify more programmes, genres, and even the long tail of content. Their strength also lies in capturing the entire online population. Yet they privilege certain types of content, such as live events (Kosterich, 2016), while skewing towards young, tech-savvy users and misrepresenting less active audiences (Kelly, 2019).
Service-centric and set-top-box analytics provide census-level data for specific services, offering valuable scale and stability (Hollifield and Coffey, 2023), but they lack reliable demographic profiles. In parallel, router meters extend coverage to all IP-delivered content within the home across devices connected to the household network (Kantar Media, 2026), but they cannot capture out-of-home viewing. Emerging automatic content recognition (ACR) technology embedded in smart TVs enables device-level data collection by identifying all content displayed on the screen, including streaming, broadcast, and external sources (Anselmi et al., 2024; Lobato, 2025). However, this approach shares the limitations seen in set-top box analytics.
Attempts to develop sample-based methods illustrate both progress and limitations. The portable people meter, attached to panel members rather than TV sets, allows measurement across locations and devices (Hessler, 2021). However, the proliferation of content still restricts what can be captured, as recognition depends on matching audio samples or watermarks to existing databases.
Recent developments have introduced total audience measurement solutions that focus on cross-platform measurement without compromising the availability of demographic data. Examples include Kantar Media, which combines people-meter data with router-meter data (Kantar Media, 2026), and Nielsen, which integrates people-meter data with big data from set-top boxes and ACR (Hessler, 2025). The result is a unified data source that captures viewing across different modes (linear, time-shifted, VOD) as well as different platforms (TV, web, apps) and devices.
New measurement methods show that the success of TV content can be examined differently and comparatively. New methods do not replace old ones; rather, they open up new research perspectives and expand the concepts of success and popularity. Therefore, multidimensional studies have been long suggested to broaden our understanding of contemporary TV audiences (Napoli, 2012; Portilla, 2015).
Although cross-platform measurements exist, it is not available in all markets or PSM organisations, including Estonia and ERR, the case examined in the article. Nevertheless, regardless of whether data originate from a single integrated system or from multiple sources, cross-platform comparison remains important, especially for PSM, for understanding how overall content consumption takes shape. Contemporary audience research should account for the various platforms on which audiences consume media and analyze the functions that audiences attribute to each platform and the reasons behind their platform choices (Napoli, 2012; Portilla, 2015). It also needs to be explored how the distribution of exposure across different platforms is influenced by content types, dayparts or audience demographics (Napoli, 2012).
Technical features of TV and VOD viewing
Linear TV is organized around prime time to reach mass audiences, with scheduling both structuring and enhancing viewership (Ellis, 2000; Ihlebæk et al., 2013; Lüders and Sundet, 2022). Williams (2003) described this as a dynamic of choice versus imposition, where viewers often remain tuned beyond their initial programme. While some resist such flow, many still value the communal aspects of live TV (Lüders and Sundet, 2022). By contrast, time-shifted and VOD viewing enable greater control. Time-shifting allows viewers to adapt schedules to personal routines (Lotz, 2020), while VOD services provide vast libraries that are suggested to encourage autonomy (Markham et al., 2019). Features like auto-play and binge-watching foster prolonged engagement and reshape perceptions of series consumption (Markham et al., 2019; Wayne, 2022), significantly enhancing immersive experiences and user preference for VOD (Evens et al., 2023).
Yet the claims that VOD enforces autonomy are increasingly contested (Cox, 2018; Johnson, 2019). Recommendations, prime shelves, auto-play, and interface design impose new forms of industrial control, creating streaming flows akin to linear TV (Evens and Donders, 2018; Lüders and Sundet, 2022; Matthew, 2020). Rhetorical shifts also reflect how VOD reorients viewing: audiences increasingly speak in terms of genres rather than ‘shows’ or episodes’ (Matthew, 2020), and some prefer re-watching old favorites, utilizing the archival function of VOD (Tryon, 2015). Such tendencies highlight how VOD content selection is structured by genres, periodic or functional categories. Permanence of content availability and prominence of presentation strongly predict viewership (Thurman et al., 2023), and aggregate audiences for niche storylines over time (Fagerjord and Küng, 2019). Together, studies show that long-term access, curated presentation, and recommendations enhance VOD’s ability to attract audiences interested in specific content.
At the same time, there is increasing evidence that actual practices are shaped as much by routines and social contexts as by technical affordances. Audiences develop habitual ‘routes to content’ (Johnson et al., 2024) or ritual step-by-step processes (Iordache et al., 2023), often resisting designed affordances. Johnson et al. (2025) describe this as ‘default viewing’, where technical settings, habitual pathfinding, or household dynamics guide decisions as strongly as platform features. These findings suggest that linear, time-shifted, and VOD modes may cultivate distinctive behavioural defaults. For instance, the persistence of channel loyalty in linear TV, or routine selections in time-shifted and VOD use. Furthermore, audience repertoires are also evidenced to vary by demographics: while most users are shown to use multiple viewing modes, distinct groups are shown to exhibit narrower patterns − such as older viewers relying mostly on free PSM services while younger users focusing on SVOD (Johnson et al., 2023). Esser and Steemers (2026) confirm that younger audiences strongly prefer VOD, and especially content from the US and UK.
Together, viewing modes are not only technical infrastructures but also socially embedded environments where lived practices of audiences, their habits, literacies and expectations matter. As a result, we hypothesize that scheduled live TV, time-shifted TV, and VOD differ to the extent that potentially leads to distinct patterns of content consumption. Therefore, understanding the characteristics of different viewing modes is crucial when measuring contemporary multi-platform TV audiences.
Case of Estonia and Estonian Public Broadcasting as PSM
With 1.4 million inhabitants, Estonia is one of Europe’s smallest media markets. In 2024, 92% of residents aged 16–74 reported using the internet and 57% of them used smart TVs, figures close to the EU average, higher in Northern and Western Europe and lower in the South and East (Eurostat, 2024a; 2024b). TV viewing remains strong: in 2024, average viewing time and weekly reach (83%) exceeded the EBU average, placing Estonia among high-reach TV countries. Time-shifted viewing was also above average, accounting for over 14% of viewing time (EBU, 2025a). While the streaming market lags behind Nordic and Western high benchmarks, Estonia outperforms most Southern and Eastern markets where SVOD penetration remains lower (EBU, 2024a). At the same time, households without a TV set rose to 22% in 2024 (Kantar Emor, 2024). This leaves a growing share of the population outside the people meter panel, Estonia’s main audience measurement tool.
In Estonia, the people meter panel run by Kantar Emor reports metrics of live viewing, viewing on the same day as live (VOSDAL), and playback up to 7 days after broadcast. This measurement approach is typical across European TV markets (EBU, 2025c). Viewing of the ERR’s VOD service on the TV set is measured only if a particular title has been broadcast on a linear channel and 7 days after live, however, separate data for VOD viewing is not provided. Most PSMs in Western Europe, by contrast, have access to performance data of their VOD service apps through their national TV measurement tool (EBU, 2024b). For comparison, four EBU member states deploy router-based metrics, and one uses a portable people meter (EBU, 2025c). Consequently, multi-platform metrics and structural comparisons of viewing modes are both necessary and important in the current European measurement environment.
Our analysis draws on data from ERR, which runs three TV channels, five radio networks, and a portfolio of digital services, including a VOD service. ETV, the main Estonian-language channel, has been broadcasting since 1955. ETV2, launched in 2008, focuses on children’s programmes, sports, and cultural content such as feature films and documentaries. ETV+, introduced in 2015, serves the Russian-speaking minority. ERR content is accessible via four viewing modes: live TV, live TV on the web, time-shifted TV, and the VOD service Jupiter, launched in 2020 with content from all ERR TV channels. ERR’s shift from basic catch-up (since 1998) to a more advanced digital presence thus came relatively late.
Between 2020 and 2023, ERR’s live TV audience declined while VOD surged. The monthly average number of live TV viewers fell by 17%, whereas VOD viewers grew by 205%. Live web viewing rose by 13% and time-shifted TV by 28%. These shifts reveal a decline in the most structured viewing mode (live TV), moderate growth in less structured modes (live web and time-shifted), and rapid expansion of the most flexible option (VOD). Yet live TV still dominates: in 2023, time-shifted and VOD viewers amounted to 12% and 25% of the live TV audience, respectively.
The average gender and age distributions across viewing modes in 2023.
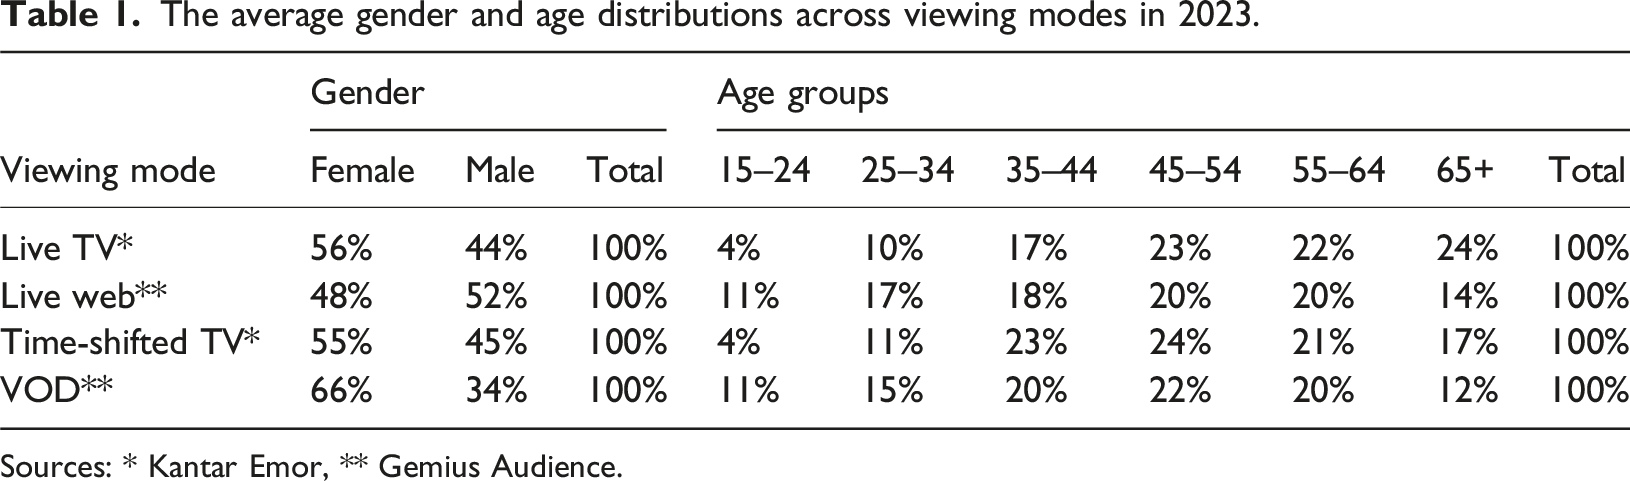
Sources: * Kantar Emor, ** Gemius Audience.
Compared to other EBU members, ERR’s performance is close to average. ETV remains Estonia’s most popular channel, yet the combined weekly reach of ERR’s TV channels (53%) only matches the EBU average, and its 20% market share is below it (EBU, 2025a). In a market with Netflix, Disney+, Amazon Prime Video, and Apple TV + present, ERR’s VOD service has become the most used domestic service. Its popularity rivals Netflix, though among global players only Netflix holds a substantial, sustained market share in Estonia (Kantar Emor, 2024).
ERR has not achieved the digital advancement observed in the Nordic or Western European PSMs (Bruun, 2023; D’Arma et al., 2021; Iordache and Raats, 2023). Still, Estonia is digitally more advanced than many Southern and Eastern European countries (EBU, 2024a; Eurostat, 2024b). ERR remains in transition: linear TV is strong but declining, while newer viewing modes, especially VOD, are growing. This makes a multi-platform perspective crucial for capturing dynamics and differences between viewing modes. Even in the Nordics, where PSM digitization is more advanced, linear viewing remains significant (Bruun and Lassen, 2023; EBU, 2025a). Hence, multi-platform metrics are vital across contexts to assess how PSM fulfils its mandate. The need for PSM-specific indicators beyond commercial KPIs has been underscored before (Grün and Neufeld, 2022; van Es, 2017). The approach here contributes to this effort by emphasizing diversity as a core PSM principle.
Diversity refers to the principle that in a democratic society citizens should access information from a broad mix of sources and viewpoints in order to make balanced, well-considered decisions (Helberger et al., 2016). It also strengthens societal resilience by fostering a discursively diverse public sphere that enables citizens to make sense of dynamic social life and to navigate complex ecosystems of meaning (Hartley et al., 2020). However, to support cultural identity and social cohesion, PSM-promoted diversity should go beyond mere variety to also ensure proportional balance (Ibrus et al., 2023; Stirling, 2007).
Objectives of the research
The article aims to examine how viewership of TV content varies across four viewing modes within one PSM ecosystem, and what those differences imply for multi-platform audience measurement. For this, we utilize methods of integrating data from multiple sources, that is, conducting a multidimensional TV audience study. We do not claim universality; rather, we offer an analytically bounded Estonian case study and interpret its patterns with reference to recent work on the shift from broadcast to online PSM.
Over the course of the research, we: • Compile weekly rankings for four distinct viewing modes; • Profile viewed content by metadata; • Quantify viewed diversity within each metadata category and viewing mode, and examine proportional balance across viewing modes.
On one hand, this approach allows us to potentially discover and describe how the technical features of the viewing modes may lead to distinct patterns of content consumption. On the other hand, it enables us to evaluate the level of diversity each viewing mode embodies, which is an important indicator in our case set in the context of PSM.
Data and method
The study focuses on the content broadcast on three ERR TV channels and published on its VOD service. To investigate possibly different content preferences across four viewing modes, typically to multidimensional research, we assembled a multi-source dataset. For TV viewing (scheduled live and time-shifted viewing) we used data collected by Kantar Emor through its traditional sample-based TV audience measurement survey of Estonian residents aged 4 and older. The number of viewers counted in the survey reflects the average viewership per minute during the broadcast content unit. For scheduled live viewing on the web and VOD viewing, we used server data of the ERR’s web services using a web analytics tool, gemiusPrism. The number of online streaming viewers represents unique web browsers from which the content has been streamed for at least one second. Hence, it is important to highlight that the viewing numbers gathered from several sources using different measuring methods cannot be directly compared. However, as stated above, our goal is not to compare the exact viewership numbers of individual films or shows, but to examine the structures of viewed content across metadata categories such as content type, origin, production year, and channel of release.
To identify the content that audiences watched, we compiled weekly rankings for each of the four viewing modes over a 52-week period (2 January 2023 until 31 December 2023). This resulted in 208 weekly rankings containing all the viewed titles with viewership numbers for all four viewing modes. Altogether, the dataset of analysis contained over 40 thousand rows, including approximately 3000 distinct content titles.
Variables
The metadata for titles originates from ERR’s Provys TVoffice database. For the first metadata category (content type), we consolidated ERR-defined values into 11 groups to align with the EBU’s reporting standards (EBU, 2020a): • news and politics • informative and documentary shows and series • entertainment (including games and lifestyle shows) • infotainment (including breakfast TV) • scripted series • feature films • culture and religion • sports • music • education and science • kids and animation.
For the metadata category of origin, we simplified the values into eight groups relevant to the Estonian cultural and geographic context (similarly to Ibrus et al., 2023): • Estonia (domestic, including ERR’s own production) • Nordic countries (Finland, Sweden, Denmark, Norway, Iceland) • other European Union countries • the United Kingdom • the United States and Canada • Russia and the former USSR • coproduction • rest of the world.
We treated production year as a continuous variable and therefore did not group it, allowing analysis across the full range of values. Finally, the channel of release refers to the TV channel where the content was first aired. In the context of ERR’s audiovisual content, the possible options were TV channels ETV, ETV2 and ETV+.
We compared the distributions of metadata categories across viewing modes in two ways. First, we examined the distributions without considering viewer numbers, using the count of distinct viewed titles. Then, we compared viewing modes by taking viewership numbers into account, i.e., comparing the distributions that represent the sum of viewers. The first approach represents more of the structure of TV programming and VOD’s content catalogue, while the second one indicates viewers’ preferences within the list of viewed content.
For each viewing mode, we first assessed all the values of the metadata categories using two metrics: the number of viewed titles (count) and the number of viewers (sum). Using these figures, we computed percentage distributions for all metadata categories within each viewing mode. For example, we first identified that, among all the viewed titles in live TV viewing, feature films constituted 17%. We then identified that, among all live TV viewers, 3% watched feature films.
Based on the percentage distribution, we calculated the Herfindahl–Hirschman Index (HHI) for each metadata category within each viewing mode. The HHI assesses the degree of concentration and has been previously used to examine the genre concentration of TV programmes (Kosterich, 2016; Li and Chiang, 2001). A low value of the index reflects a situation where shares of values of a category are distributed evenly (the distribution is more diverse). A value of 10,000, on the other hand, indicates a ‘monopolistic’ situation, where one value holds 100% of the distribution.
We operationalize diversity as the evenness of shares within each metadata category (measured with HHI) and assess balance as the equitable distribution across viewing modes. This links measurement to mandate and identifies which modes advance balanced diversity, and where corrective interventions may be needed.
Results
Distinct titles by viewing modes in the weekly rankings of 2023 and title overlaps between pairs of viewing modes.
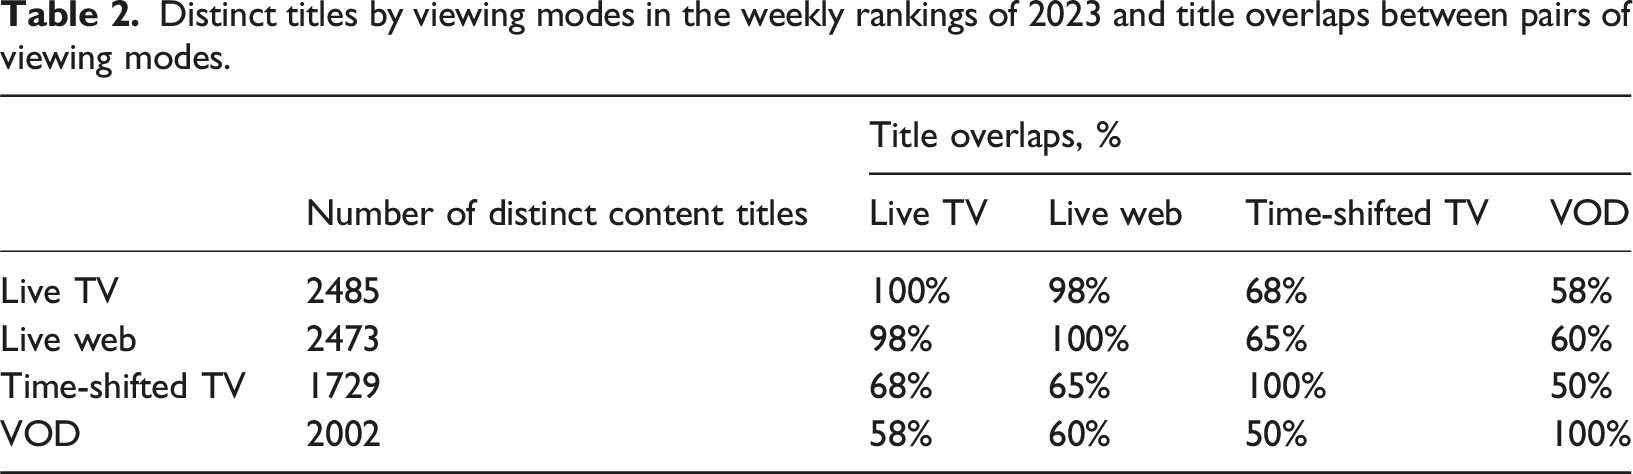
The larger numbers for live viewing modes are likely explained by the fact that almost all linearly broadcast content finds some either active or passive audience. In the case of time-shifted and VOD viewing, however, a more active content choice needs to be made, and therefore, the number of viewed titles somewhat decreases. The same tendency is indicated by the overlaps of viewed content titles between pairs of viewing modes presented also in Table 2. The viewed titles of both live scheduled viewing modes are expected to overlap almost completely (98%). However, for time-shifted viewing, which also allows viewing only the titles broadcast on live TV, the share of overlapping titles with live viewing decreases (65–68%). In the case of VOD, the overlap with live viewing decreases even more (58–60%), but the number of viewed titles is greater than for time-shifted viewing. The latter can be explained by the fact that VOD viewing is not schedule-based, and the catalogue of VOD contains a large number of older titles that are currently not being broadcast.
The differences in the number of viewed titles primarily indicate the varying content options and technical features of different viewing modes. To explore the substantial and inherent differences, it is helpful to compare the distributions of content types presented in Figure 1. Shares of content types in the weekly rankings of 2023 by viewing modes, based on count of viewed titles.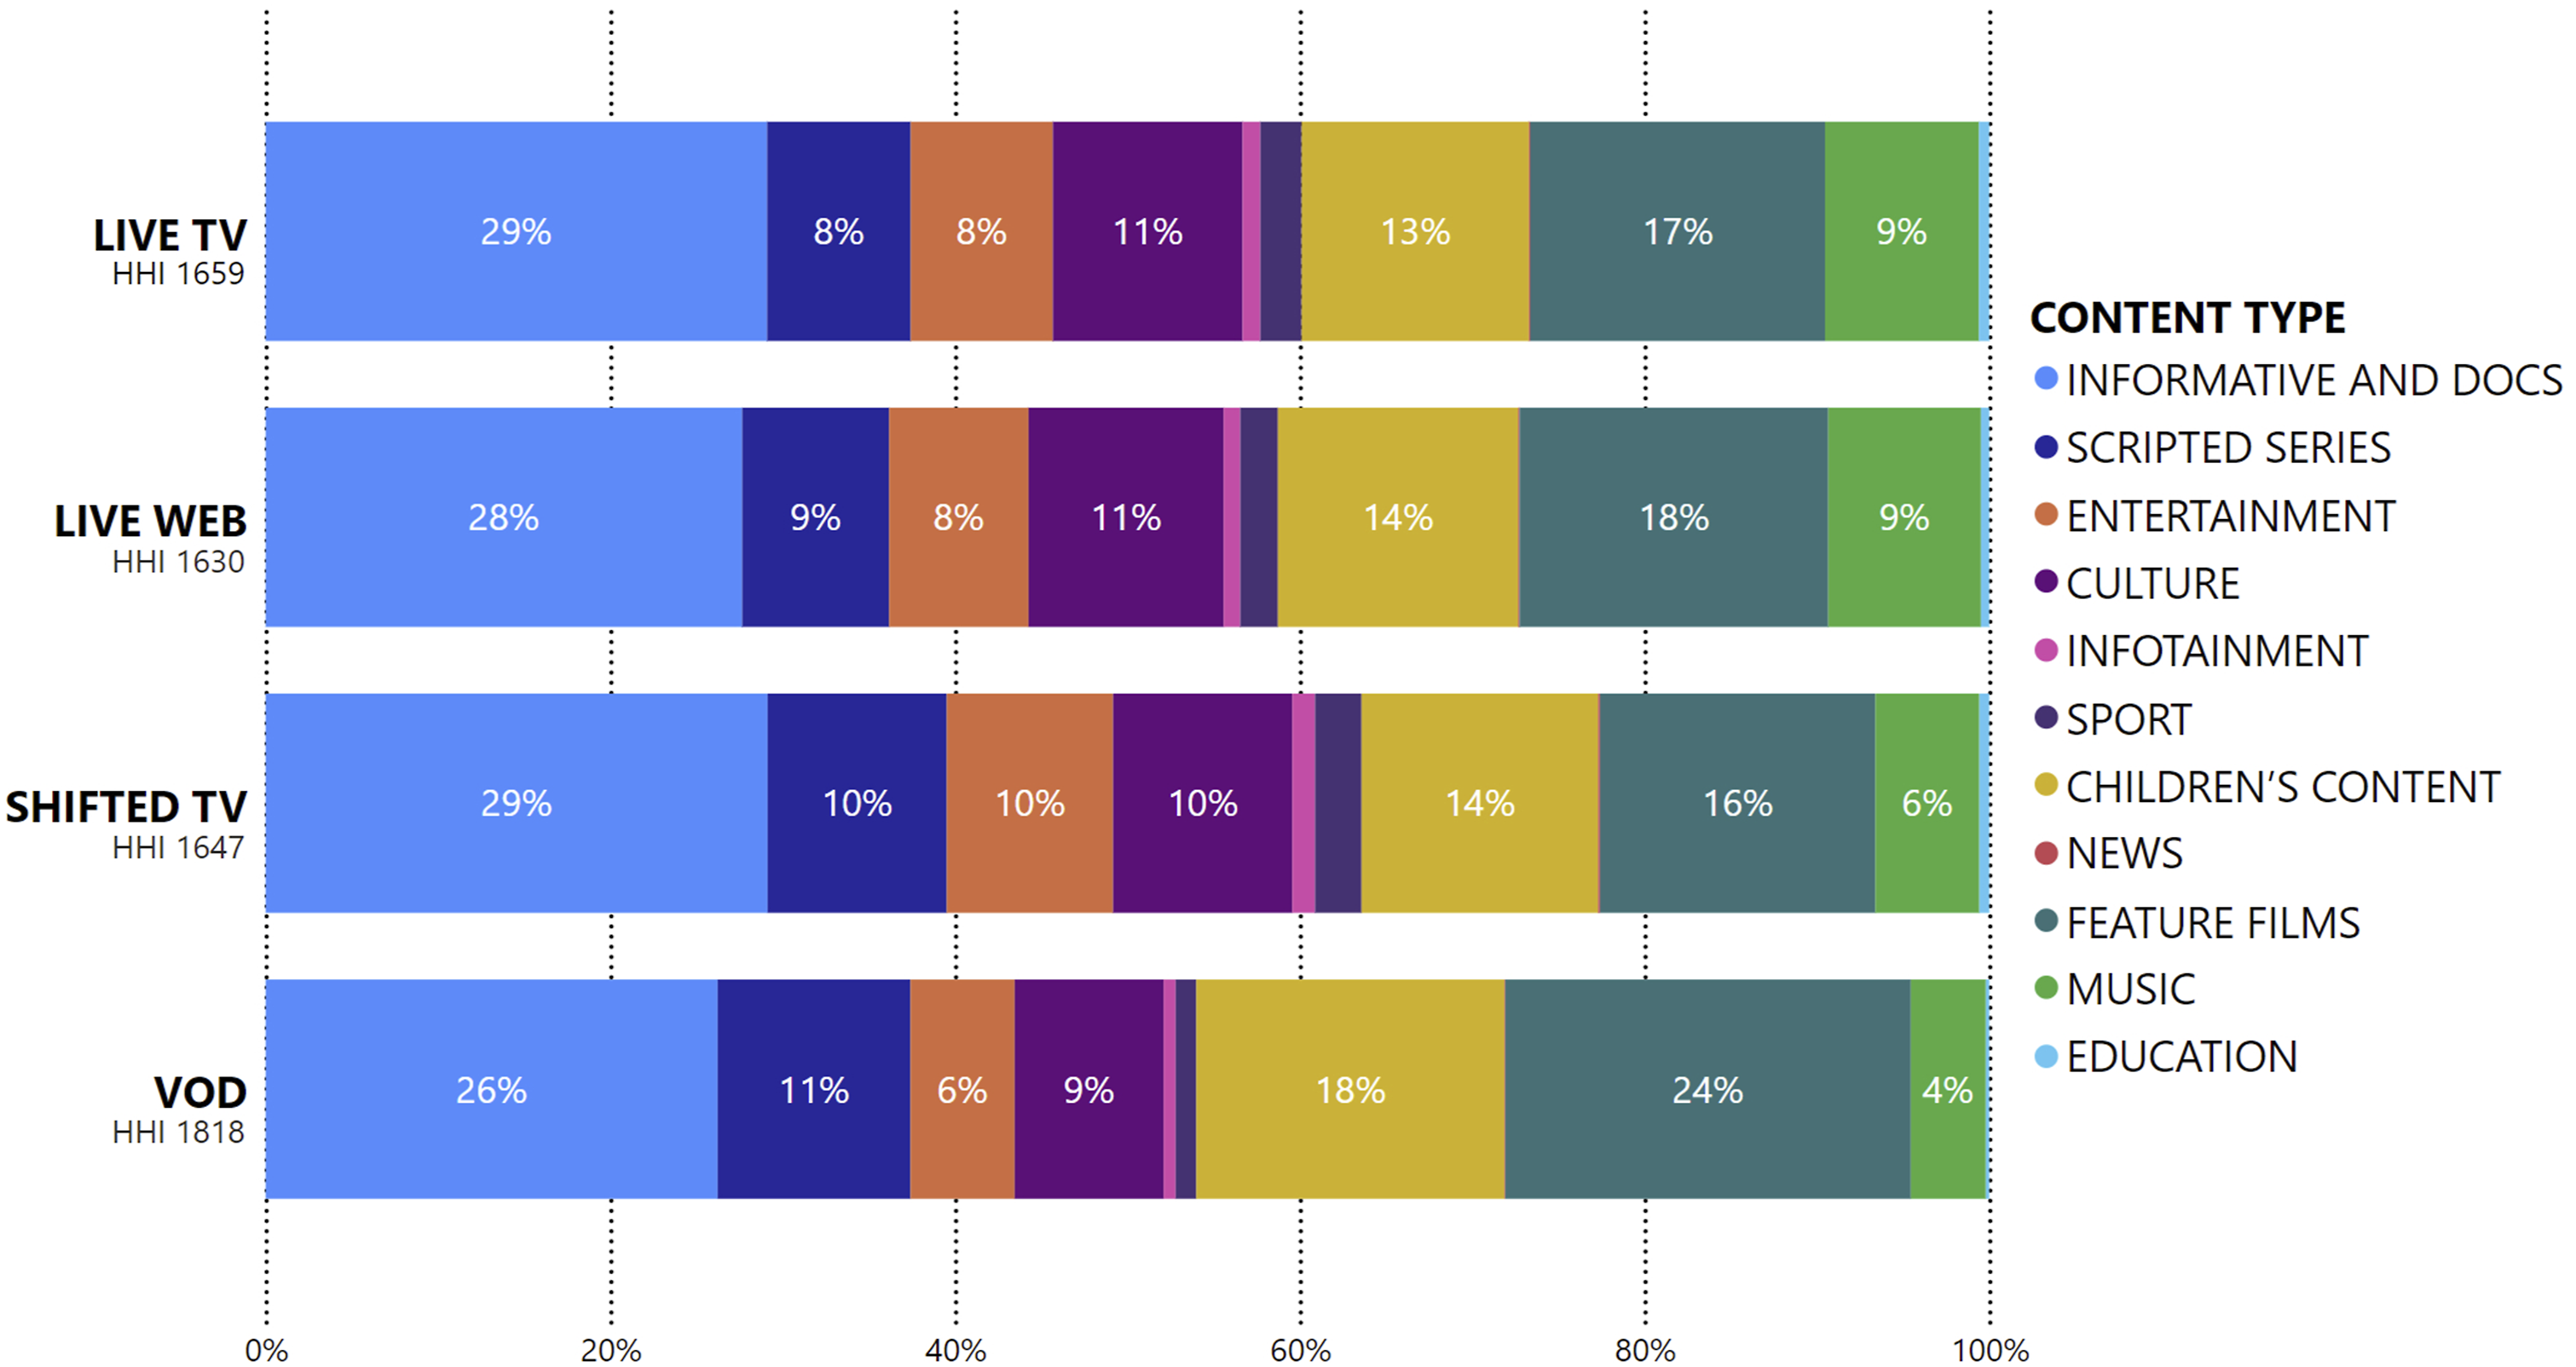
Although the viewing modes differ to some extent in their distribution of content types, the overall structure is similar across all viewing modes. The largest portion of viewed titles consists of informative and documentary content (26–29%), followed by feature films (17–24%), kids’ content (13–18%), culture (9–11%), series (8–11%), music (4–9%), and entertainment (6–8%). Only VOD stands out with a somewhat higher proportion of feature films and kids’ content and a lower proportion of music titles.
In terms of the HHI values, live and time-shifted viewing modes show similar low concentration levels (HHI 1630-1659). In contrast, VOD exhibits somewhat higher concentration (HHI 1818), largely driven by the greater share of scripted and kids’ content. Despite this, based on the count of viewed content titles, all viewing modes exhibit similarly quite diverse distributions across content types.
However, the picture is quite different in Figure 2, where the sum of viewers, instead of the count of viewed titles, is used to describe the distributions of content types. The sum of viewers reflects the popularity of the viewed content, not just the structure of the viewed content titles. Shares of content types in the weekly rankings of 2023 by viewing modes, based on sum of viewers.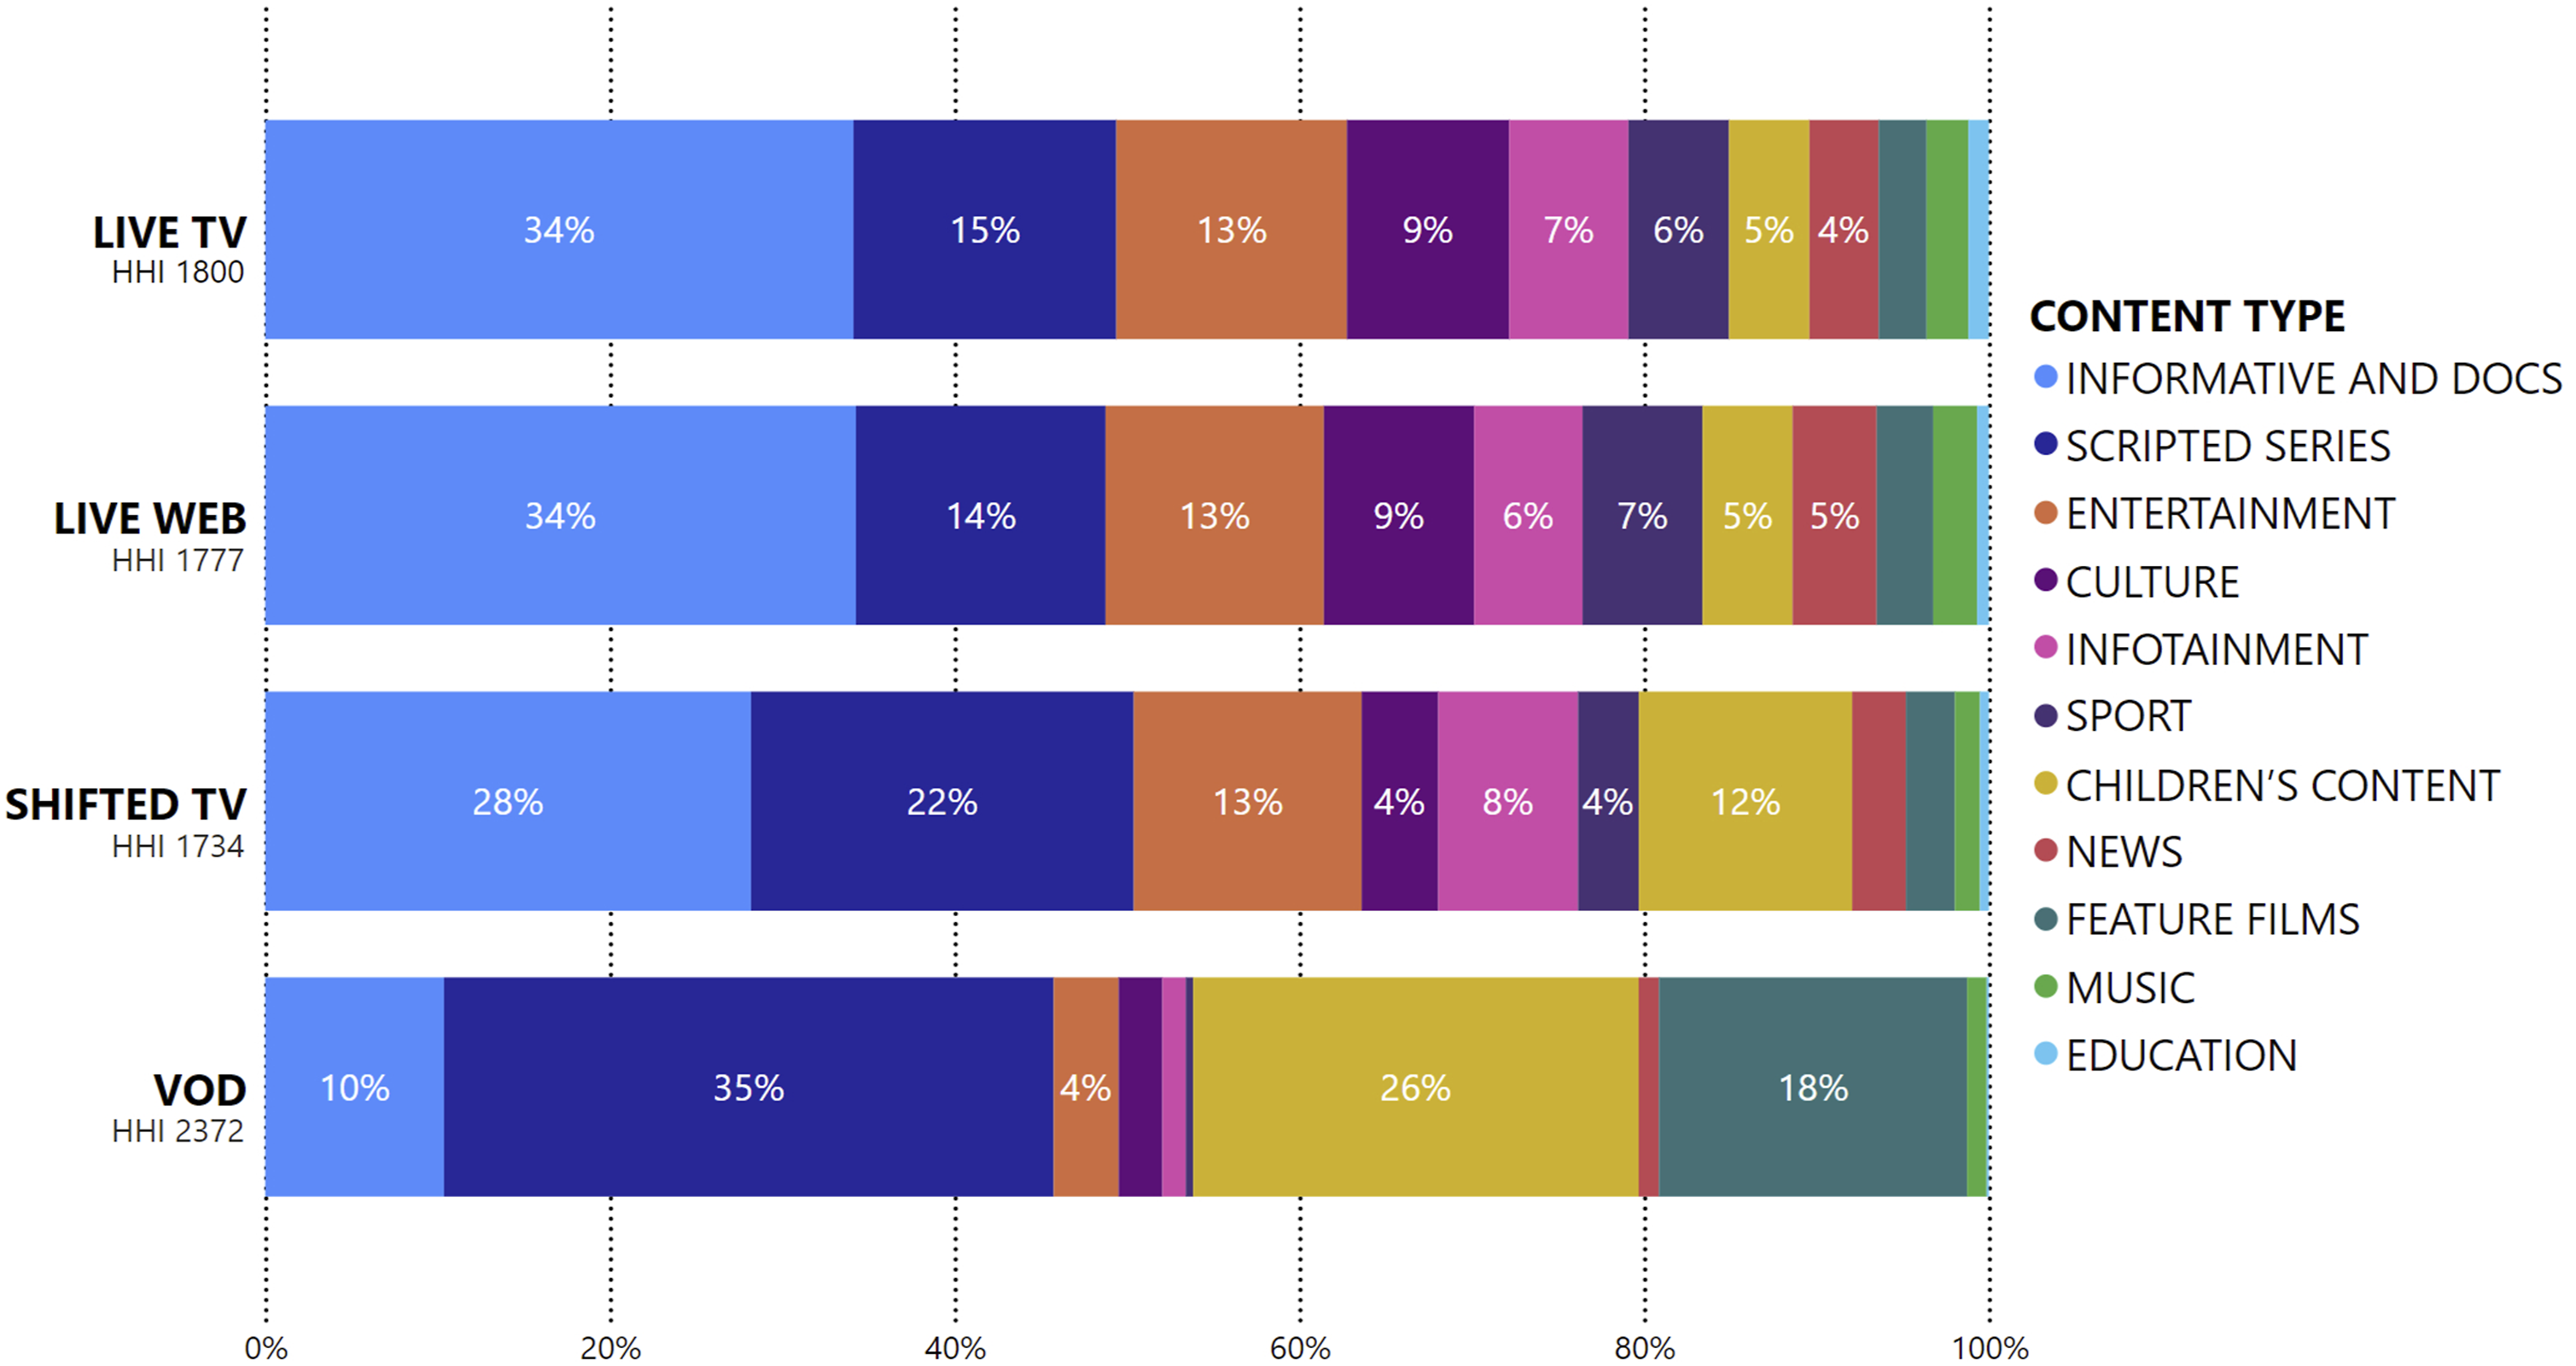
The identified differences in Figure 2 indicate that for live viewing, informative content and documentaries are the most popular content type (34%). As on-demand options expand, the popularity of content types shifts from topical programmes towards scripted content. While in addition to current affairs, the content of live TV viewing includes a relatively high proportion of series (15%), feature films rarely gain significant viewership (3%). This fact strongly suggests that live viewing is closely tied to the TV schedules, with a sizable amount of informational content scheduled for prime time and feature films scheduled for late night. Informational content also quickly loses its relevance, making it less attractive for VOD and time-shifted viewing, while the value of scripted content remains significant for a longer period of time. In the case of series, VOD may also be preferred as it allows for uninterrupted binge-watching, whereas following a series on live TV may result in accidentally missing an episode.
It is important to note that both live viewing modes are very similar in terms of the popularity of content types. This suggests that regardless of the live viewing mode (on TV or the web), the popularity of the content is largely determined by the technical features of live viewing, such as linearity and scheduled programming, and not by the device used. Also, while live TV audiences include more women and older viewers, and live web audiences more men and younger viewers, these demographic differences do not appear to affect content preferences. This again seems to indicate that the technical features of live viewing, and not other factors, primarily determine the content popularity in live viewing.
Regarding the HHI values, live and time-shifted viewing modes have lower concentration (HHI 1734-1800) than VOD, which is somewhat more concentrated (HHI 2372), mainly because of the high amount of viewers of scripted content (series and feature films 53% in total). This also points to the subject of diverse content consumption. While live viewing, shaped primarily by programming and scheduling, ensures relatively diverse consumption across content types, the concentration of VOD audiences around scripted content could pose challenges for PSMs such as ERR. Thus, although the structures of viewed titles appear similarly diverse across all viewing modes, viewership figures reveal an imbalance in the popularity of content types on VOD.
The extent to which the viewed content across viewing modes differs based on the countries of origin will be focused on next. Figure 3 demonstrates that for live and time-shifted modes, almost half (47-49%) of the viewed titles have a domestic origin. The shares of other countries of origin are also very similar for these three viewing modes. However, compared to the other viewing modes, VOD differs somewhat, with a slightly lower proportion of titles of Estonian origin (37%) and a higher proportion of titles from the European Union (22%). Shares of content origins in the weekly rankings of 2023 by viewing modes, based on count of viewed titles.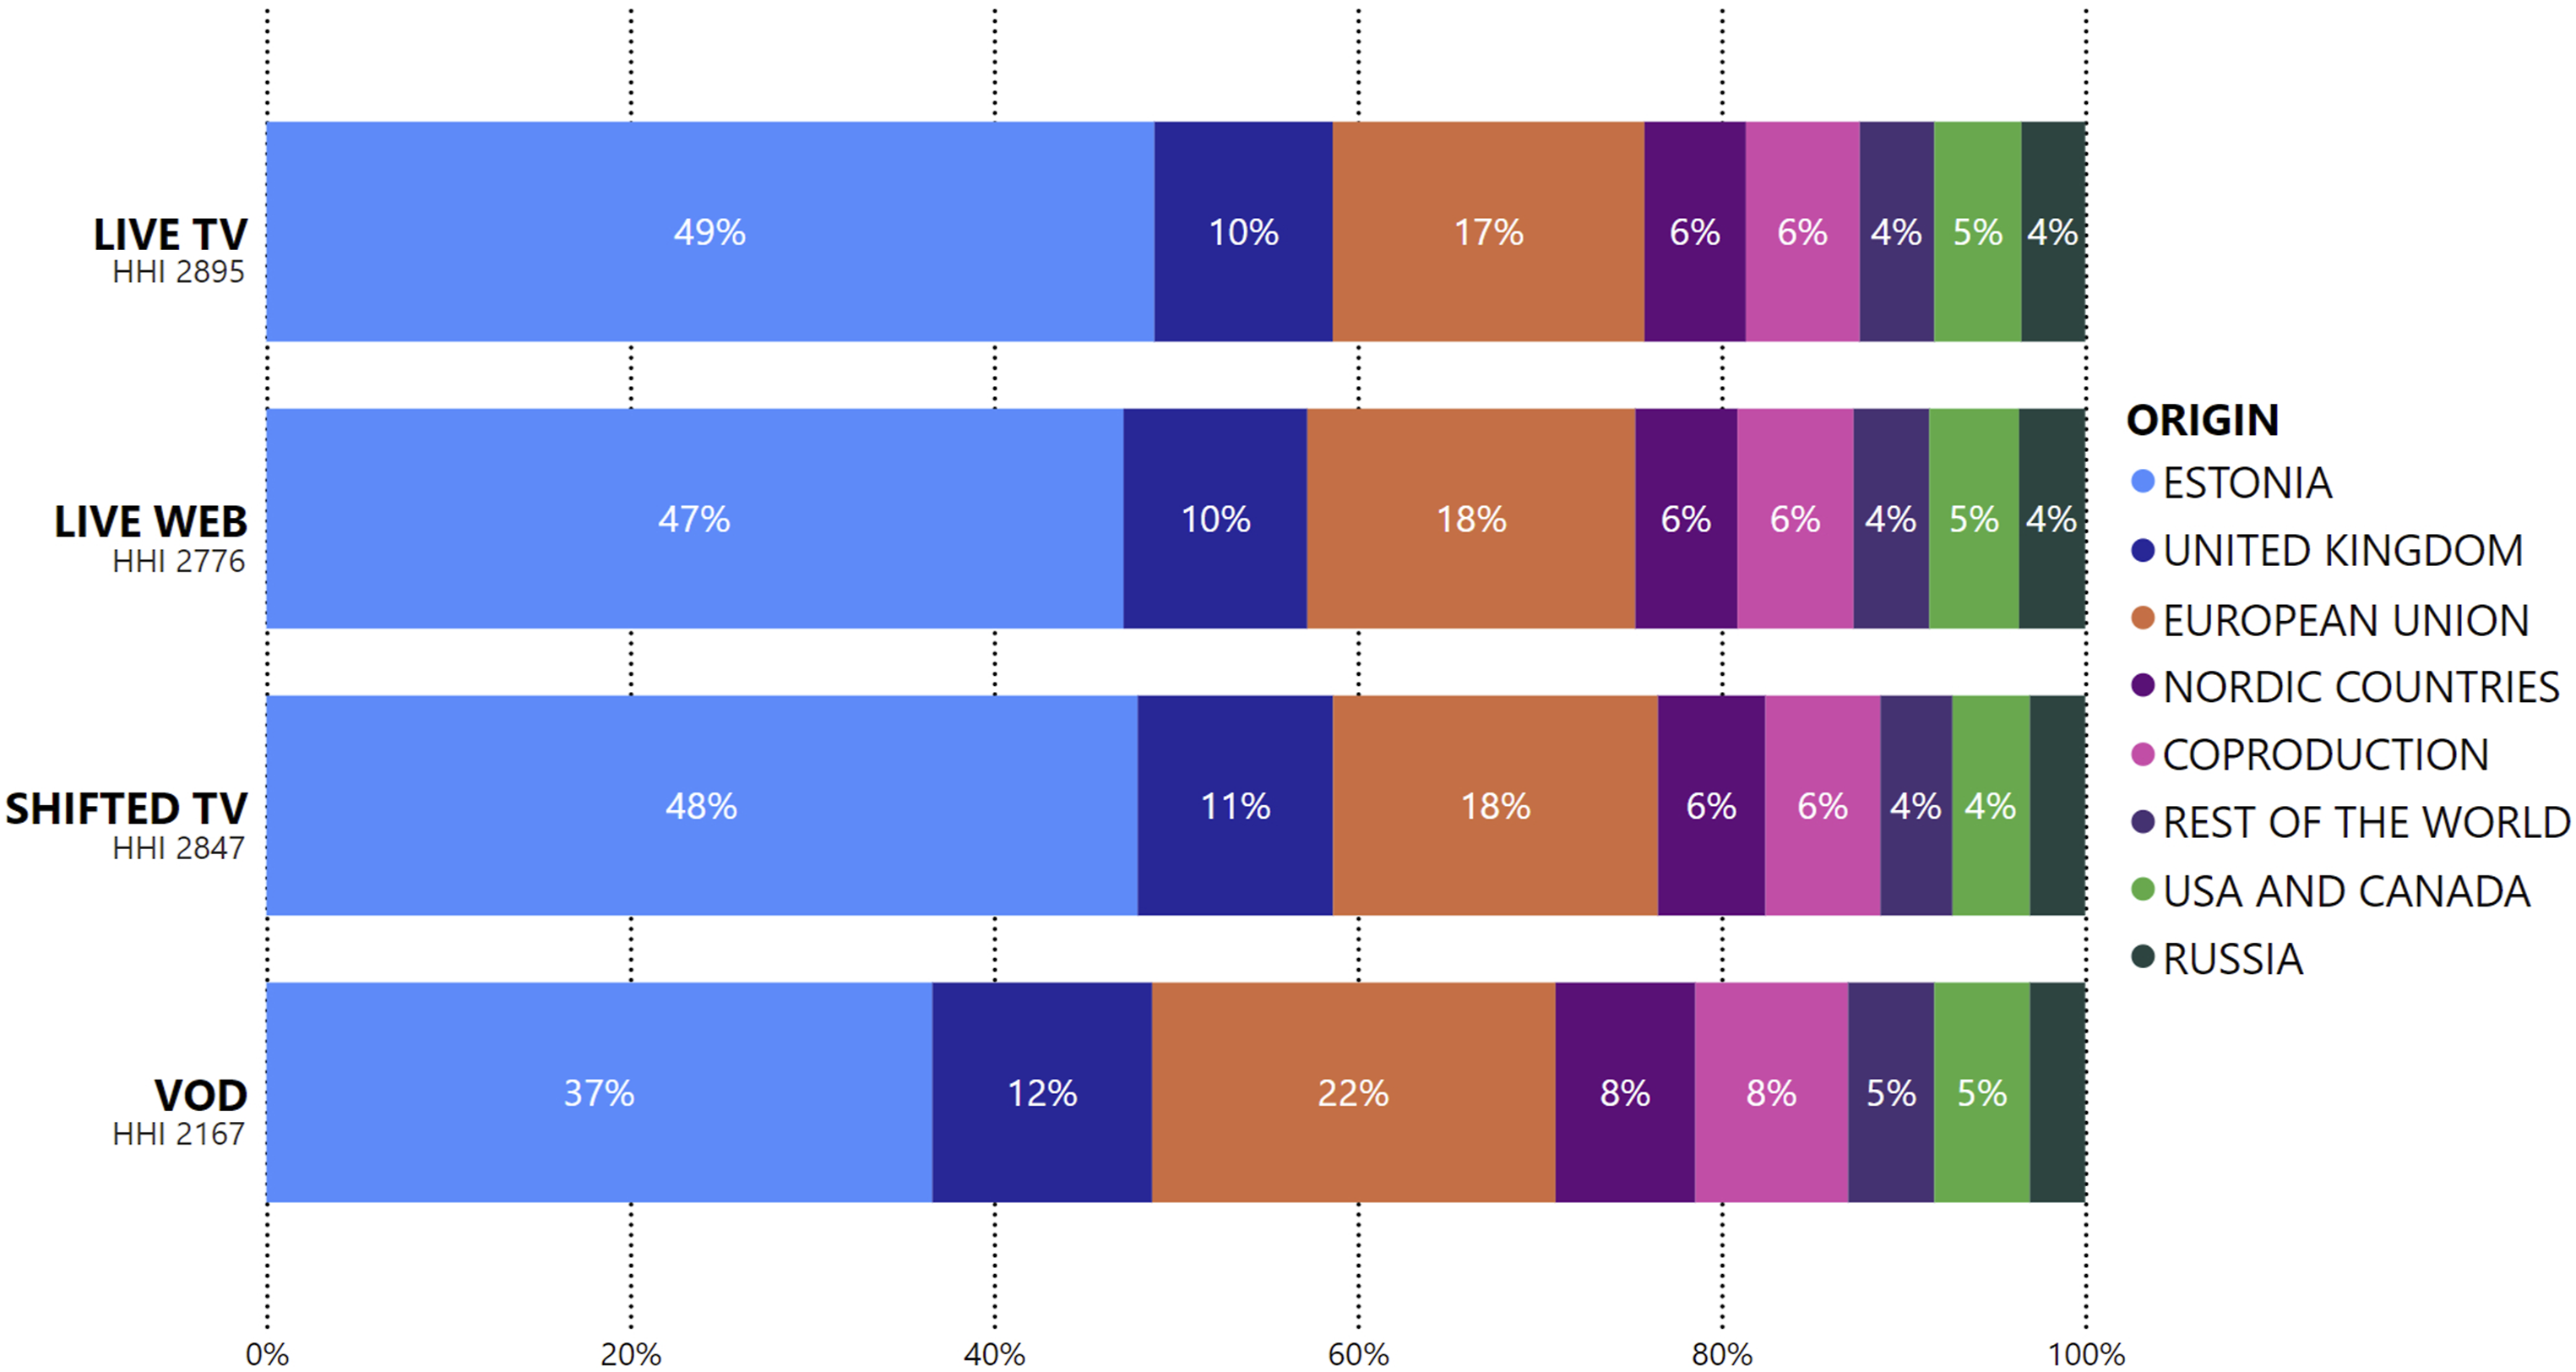
Similarly, in terms of the HHI values, live and time-shifted viewing modes show quite similar concentration levels (HHI 2776-2895). In contrast, VOD exhibits somewhat lower concentration (HHI 2167), mainly due to the smaller share of Estonian titles. However, based on the viewed content titles, all viewing modes exhibit quite similar distribution structures in terms of countries of origin.
As with the content types, the distributions of countries of origin significantly change when, instead of the count of viewed titles, the viewership numbers are taken into account.
Figure 4 demonstrates that for both live viewing modes, a large majority of the viewers (76–77%) have viewed content of domestic origin, whereas for time-shifted and VOD viewing, the proportion of domestic content viewership decreases and the importance of other countries increases. For VOD, the countries with the second highest proportion (22%) are the United Kingdom and the European Union. The content from outside of Europe is also notably popular. While it accounted for only 3% of the viewers in live TV viewing, this content comprised 10% in the case of VOD viewing. Shares of content origins in the weekly rankings of 2023 by viewing modes, based on sum of viewers.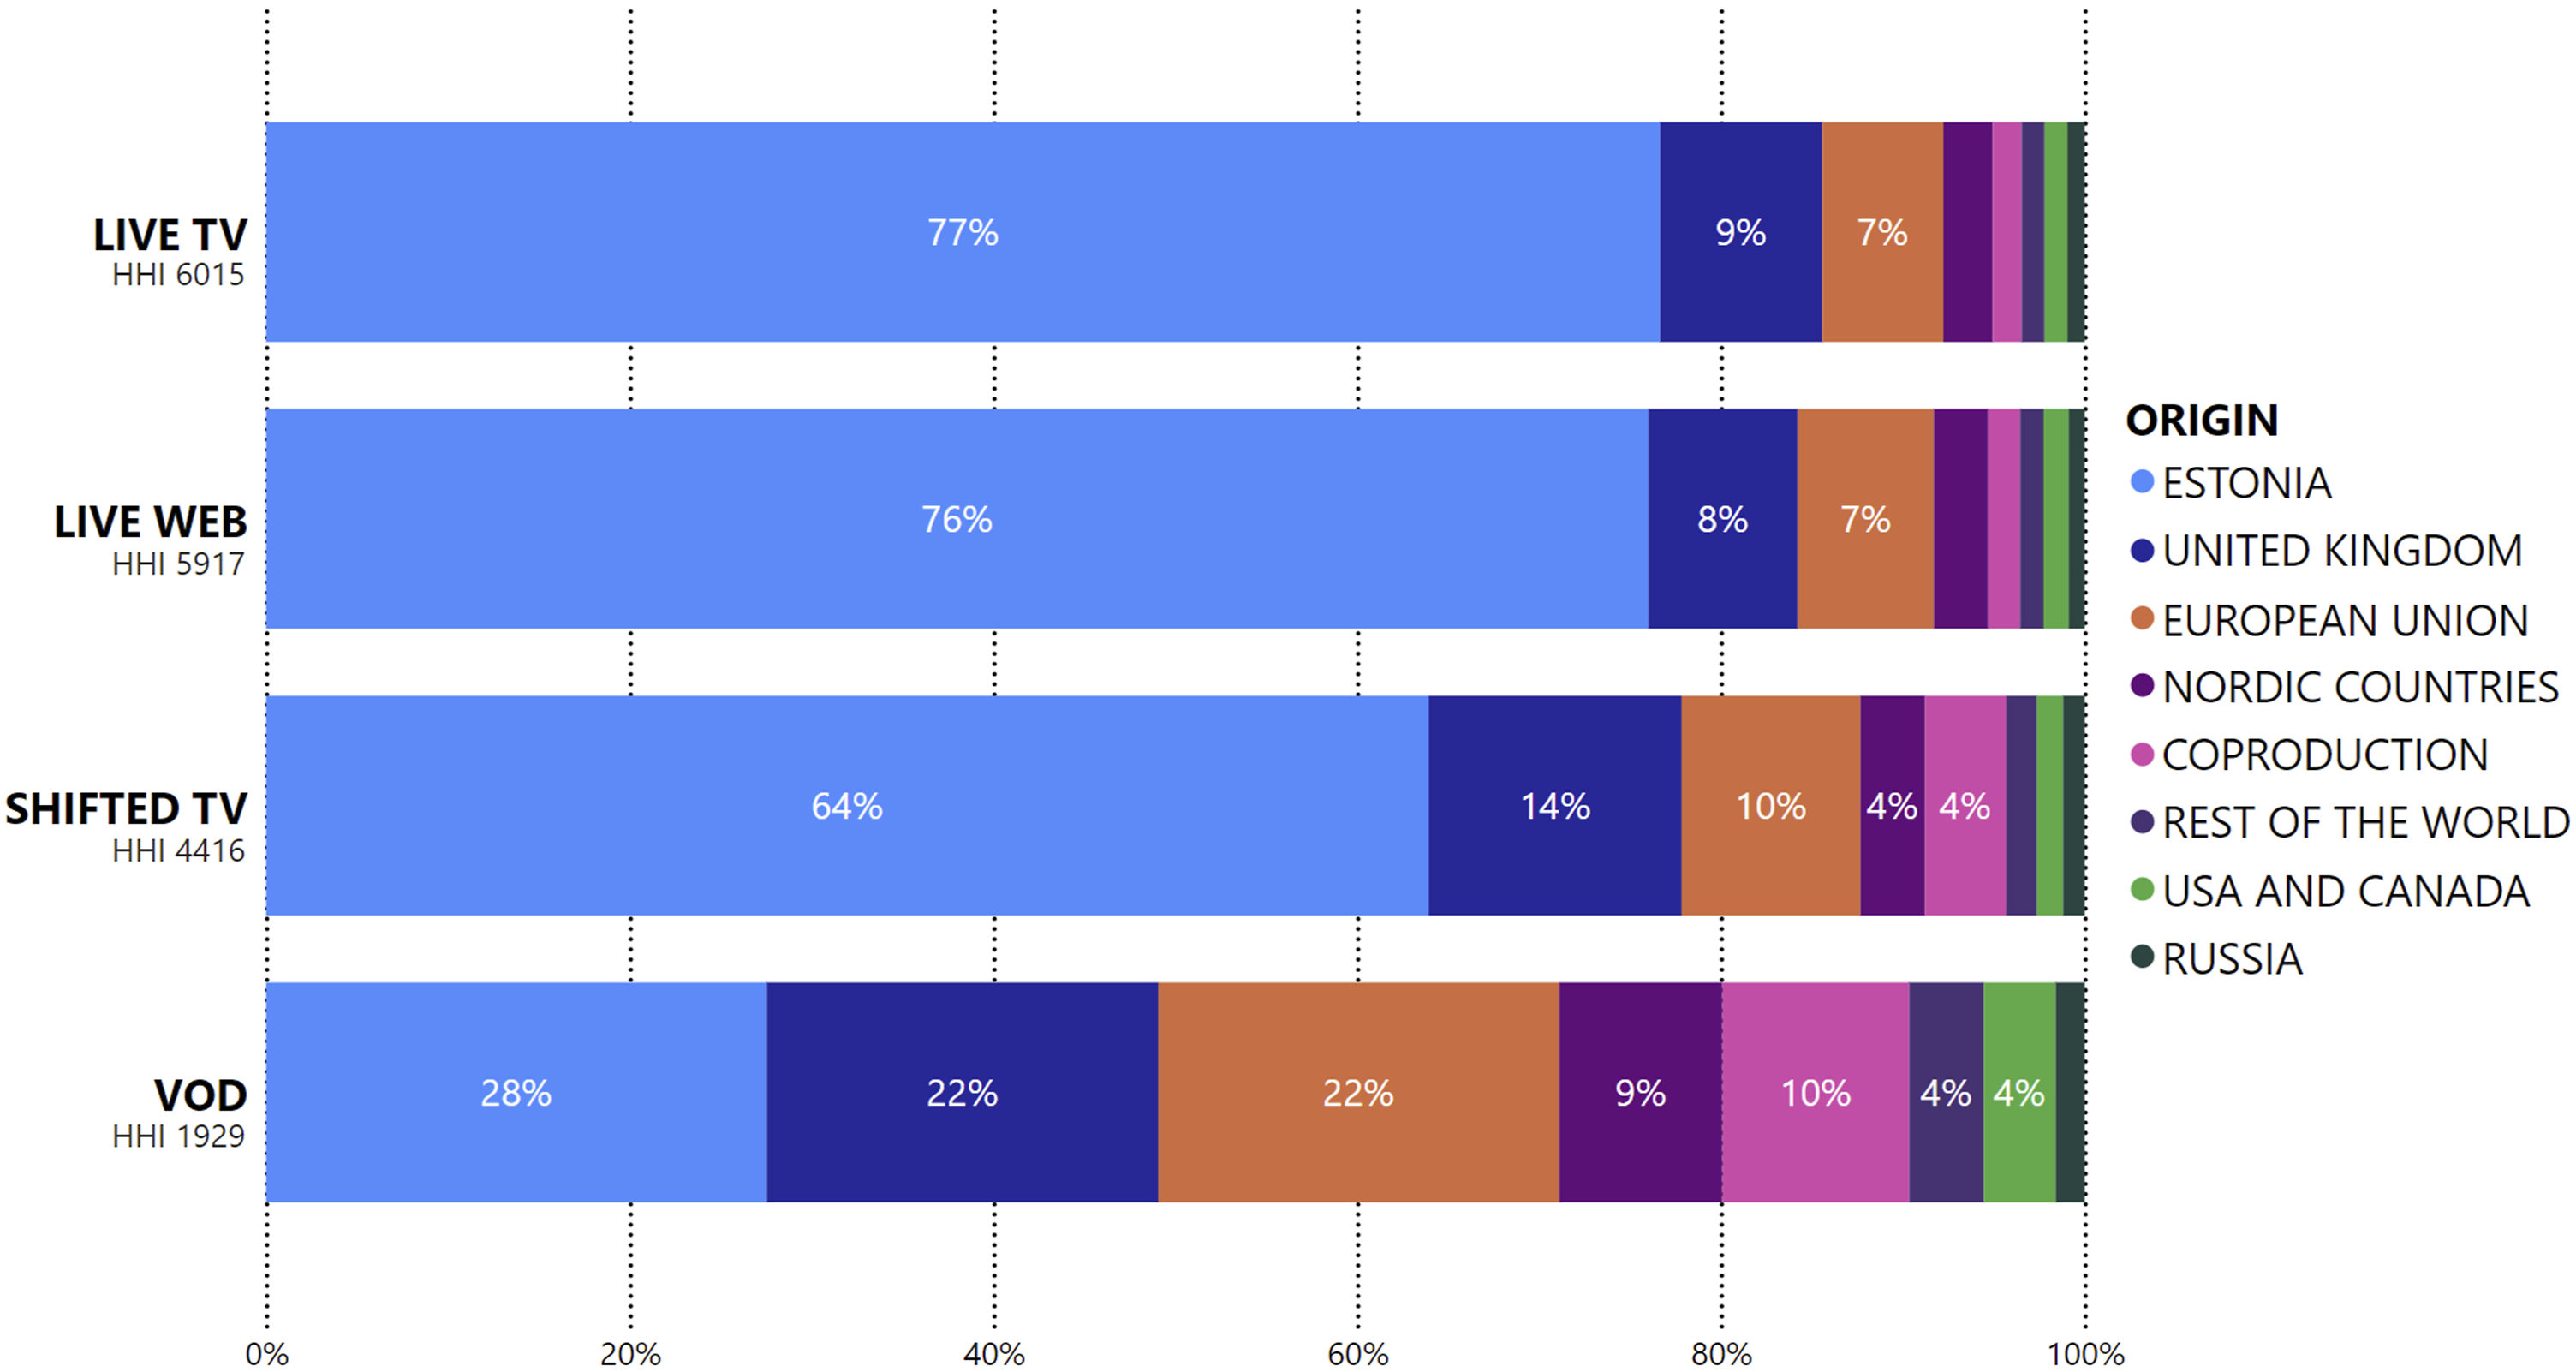
While VOD stood out among the viewing modes for having the highest concentration in terms of content types, the situation is reversed when it comes to the countries of origin. The HHI values of live viewing modes exhibit relatively high concentration levels (HHI 5917-6015), while time-shifted viewing is somewhat less concentrated (HHI 4416), and VOD is clearly the least concentrated, with an HHI value of 1929. Hence, based on viewership numbers, the viewed content on VOD is geographically the most diverse.
After comparing content types and countries of origin, it can be acknowledged that these metadata categories appear to be somewhat interconnected. The informative and also entertainment content that stands out in live viewing is predominantly produced in Estonia by ERR, whereas the scripted series and feature films more popular in time-shifted and VOD viewing are primarily acquired content produced outside of Estonia (see also Ibrus et al., 2023).
Based on the previous analysis, it can be assumed that the production year can also be linked to the metadata categories observed. Figure 5 illustrates that, based on the count of viewed titles, the distribution of content production years is similar across all viewing modes. The bulk of the content watched is from recent years, with titles from 2023 making up 12–13% of live and VOD views and 16% for time-shifted viewing. Over the past 5 years, the proportion of titles viewed is 55–56% for live and VOD, and 59% for time-shifted viewing, indicating that more than half of the titles watched in all modes are recent. Distribution of production years in the weekly rankings of 2023 by viewing modes, based on count of viewed titles.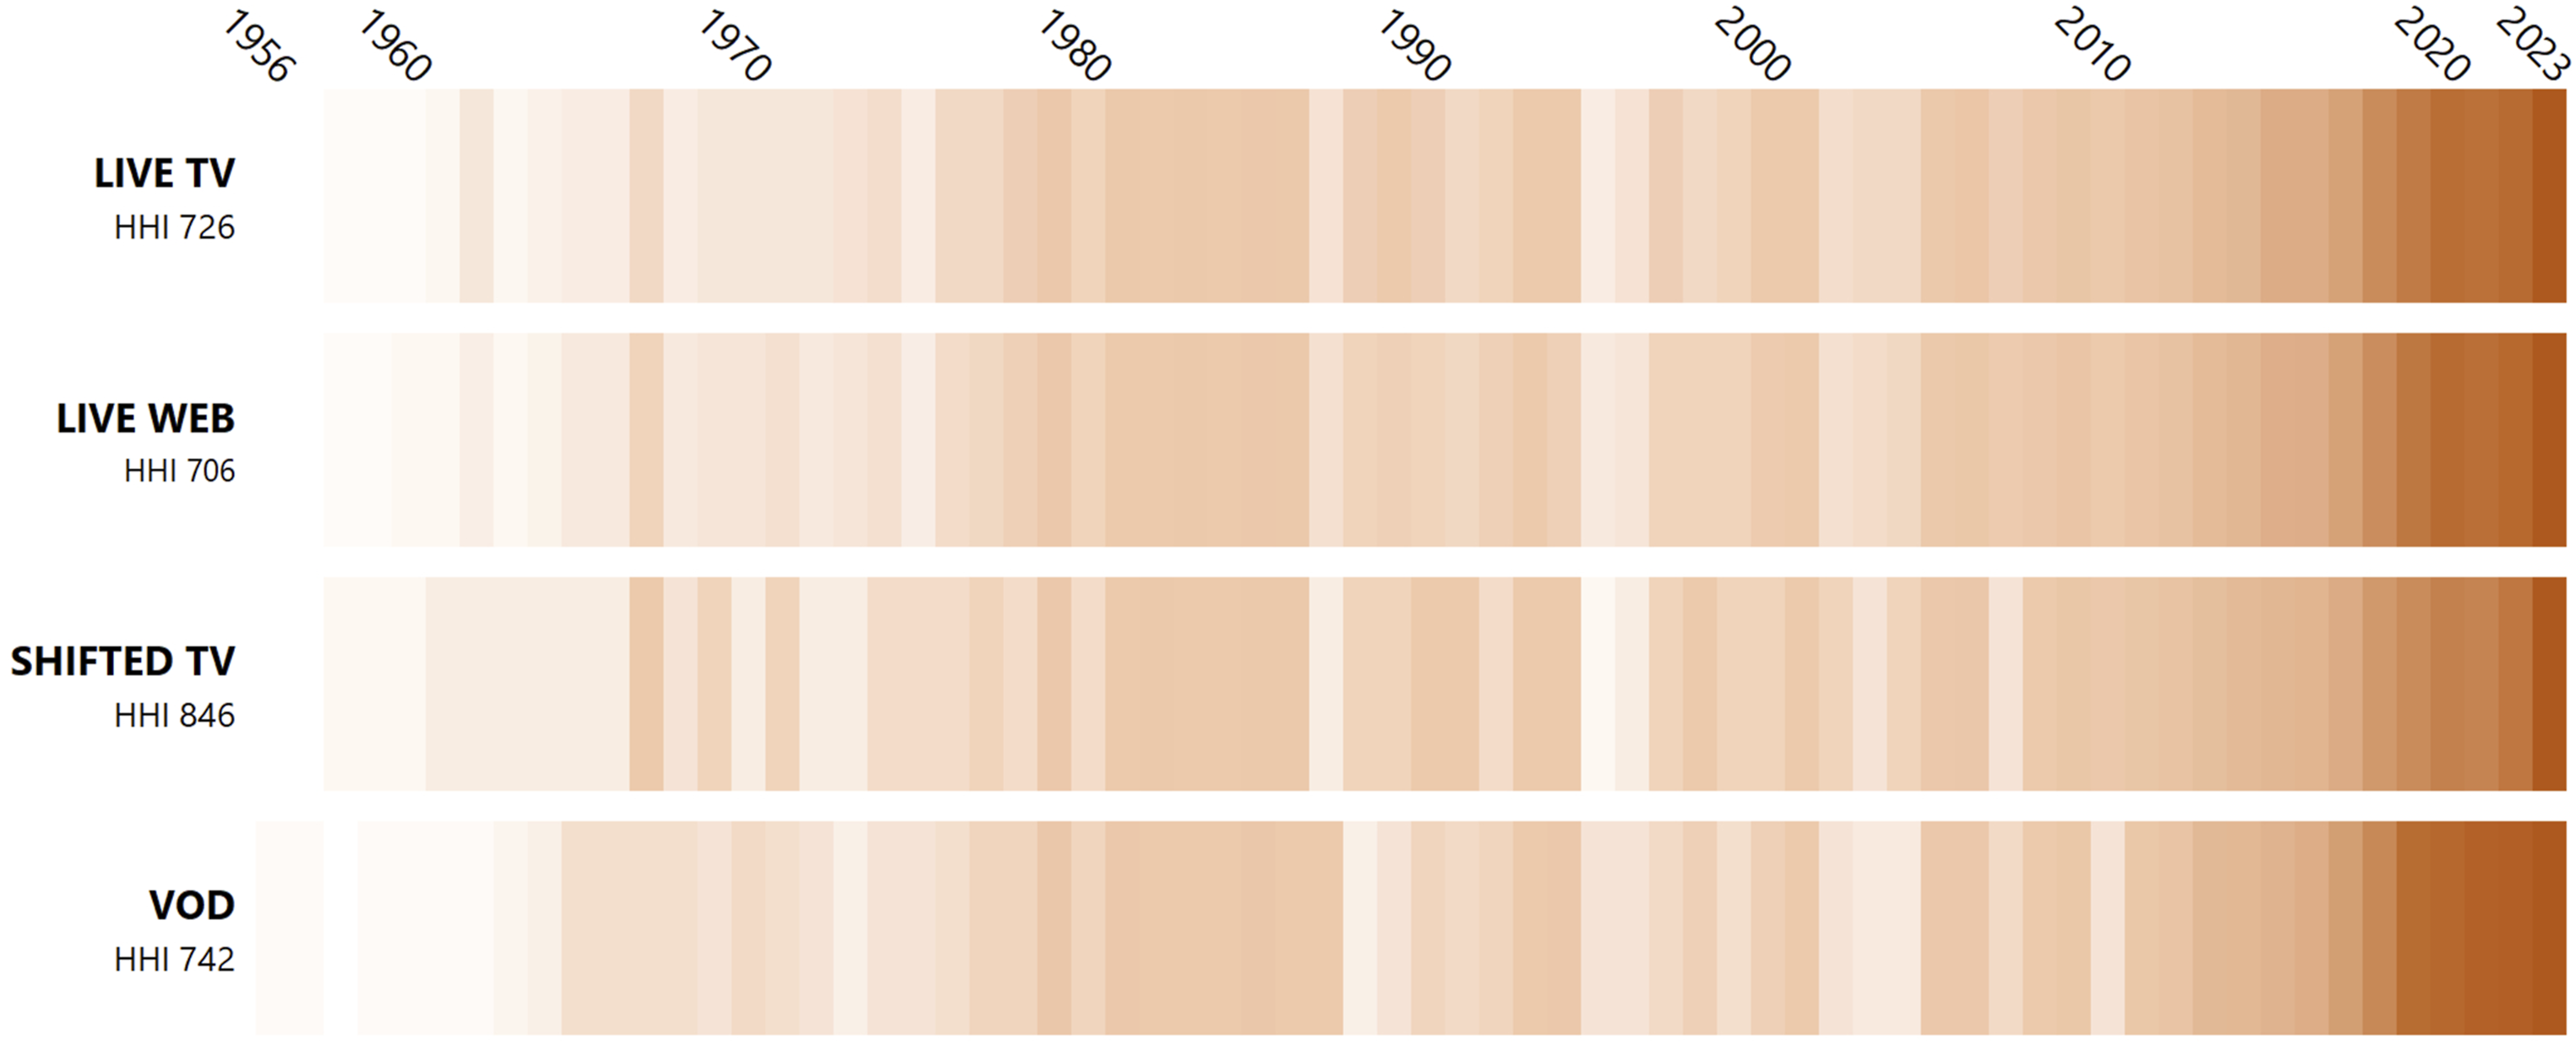
Once again, the use of viewership numbers significantly alters the picture. Figure 6, which presents distributions based on sum of viewers, shows that over half of the viewership for live TV (56%) concentrates on 2023s content across all modes, except VOD, where it’s about 16%. This difference aligns with previous findings that live viewing modes tend to feature more current content. Distribution of production years in the weekly rankings of 2023 by viewing modes, based on sum of viewers.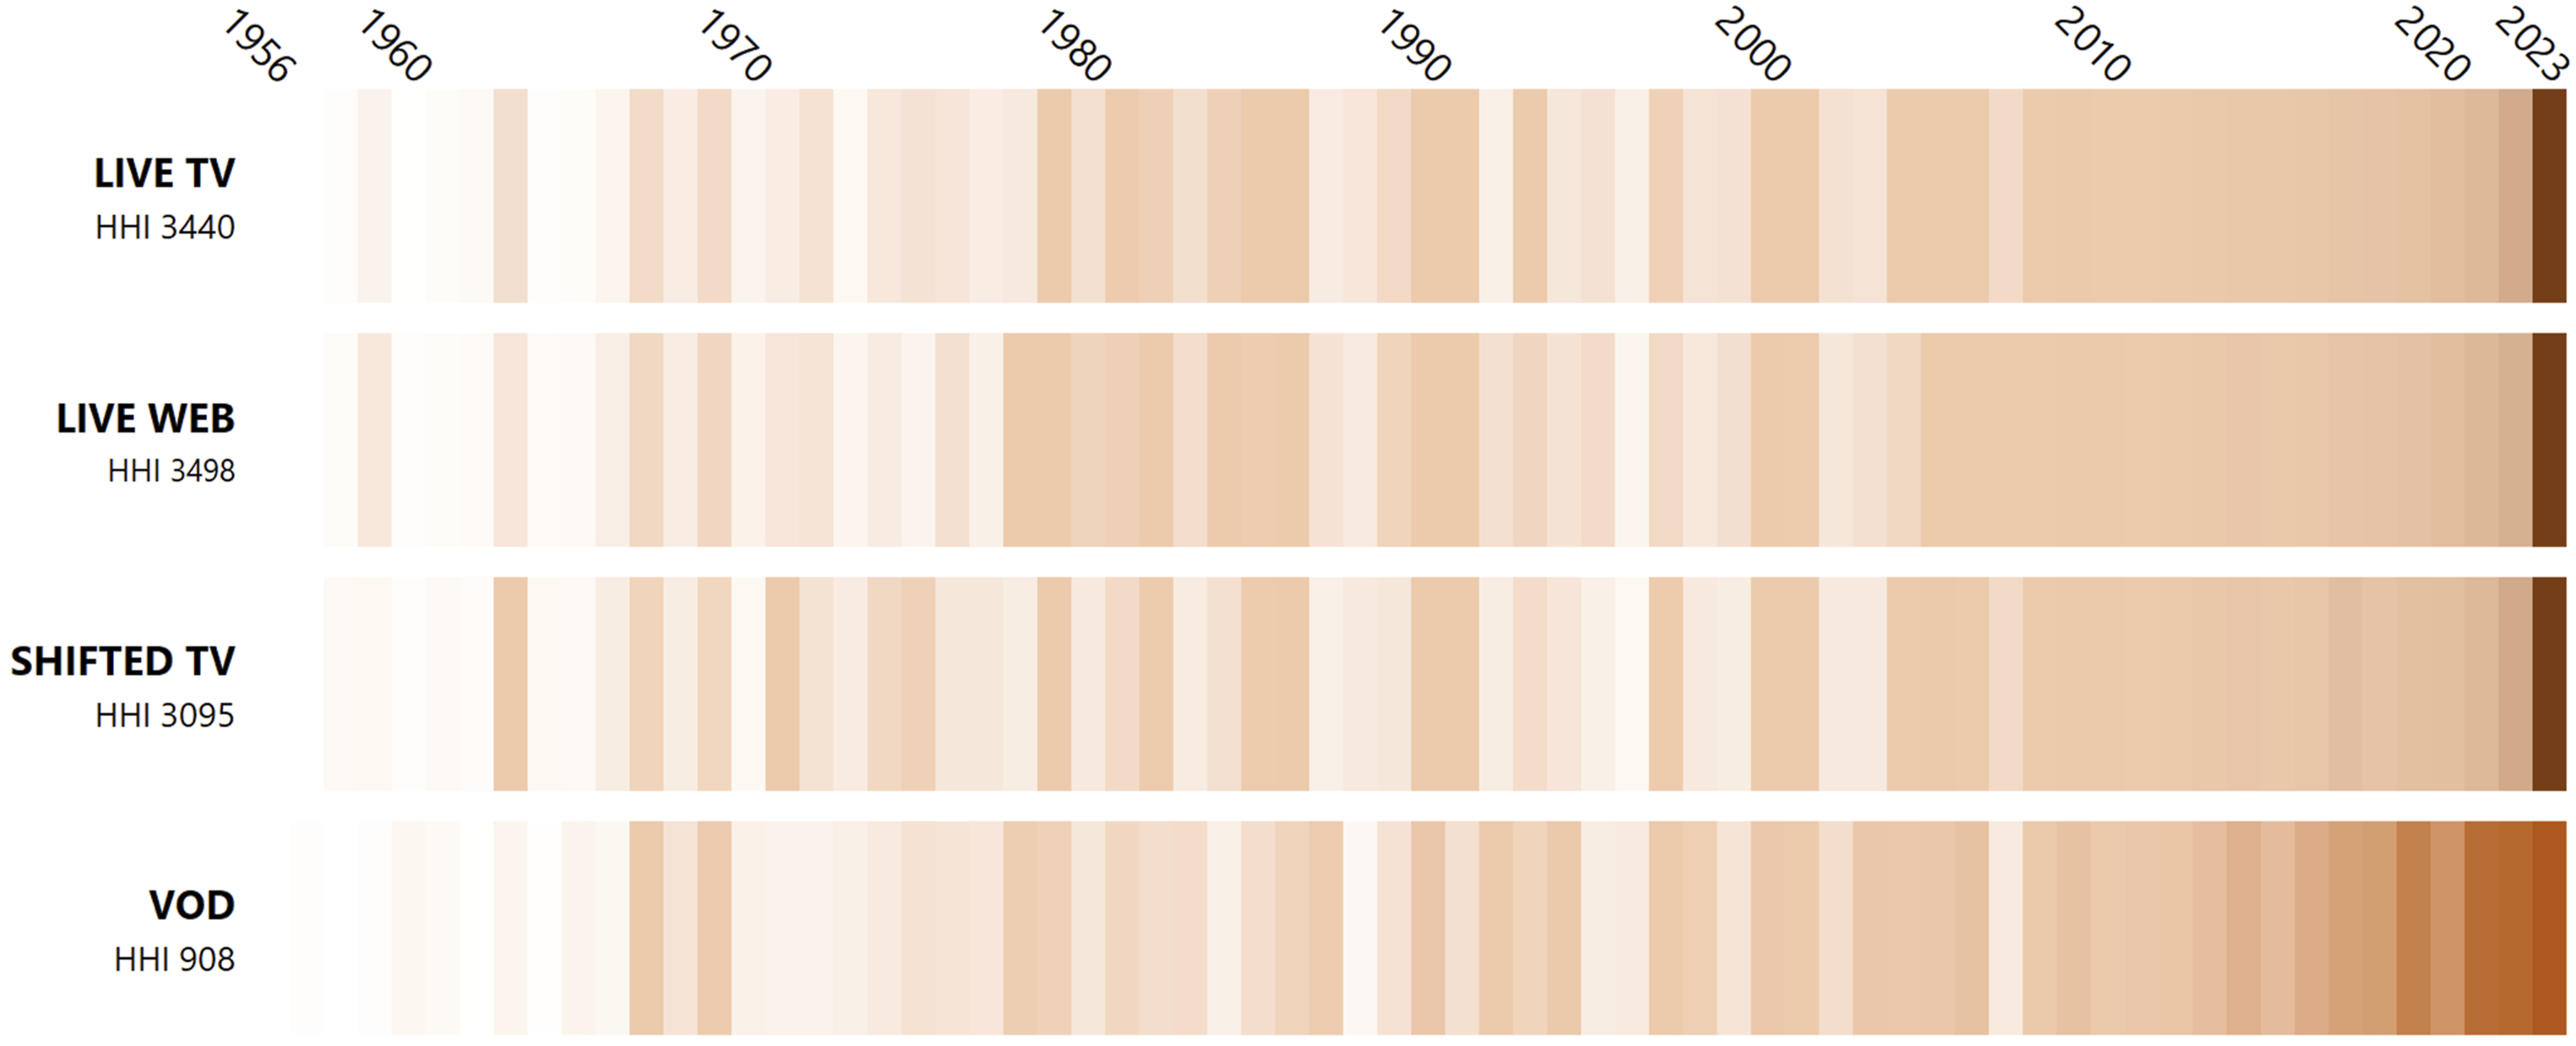
VOD’s distribution exhibits the greatest diversity in terms of production years. For example, content produced between 1960 and 2010 accounts for only 3% of the viewers in live TV, while the corresponding figures for time-shifted and VOD viewing are 6% and 14%, respectively. The same tendency can be witnessed among the HHI values − the figure for VOD viewing (HHI 908) being significantly lower than for the rest of the viewing modes (3095-3498) − pointing to the archival traits of VOD.
As a last metadata category, TV channels of release were compared. The distributions across viewing modes based on the count of viewed titles are presented in Figure 7. It is evident that the largest number of viewed titles comes from the channel ETV2 (41–50%). This is explained by the fact that ETV2 broadcasts kids’ content (including cartoons, which are relatively short and therefore allow for a larger number of distinct titles to be included in the programme) and feature films. In contrast, ETV and ETV + broadcast a large amount of regular informative and infotainment magazines, meaning that title repetition is much higher from week to week. Shares of channels of release in the weekly rankings of 2023 by viewing modes, based on the count of viewed titles.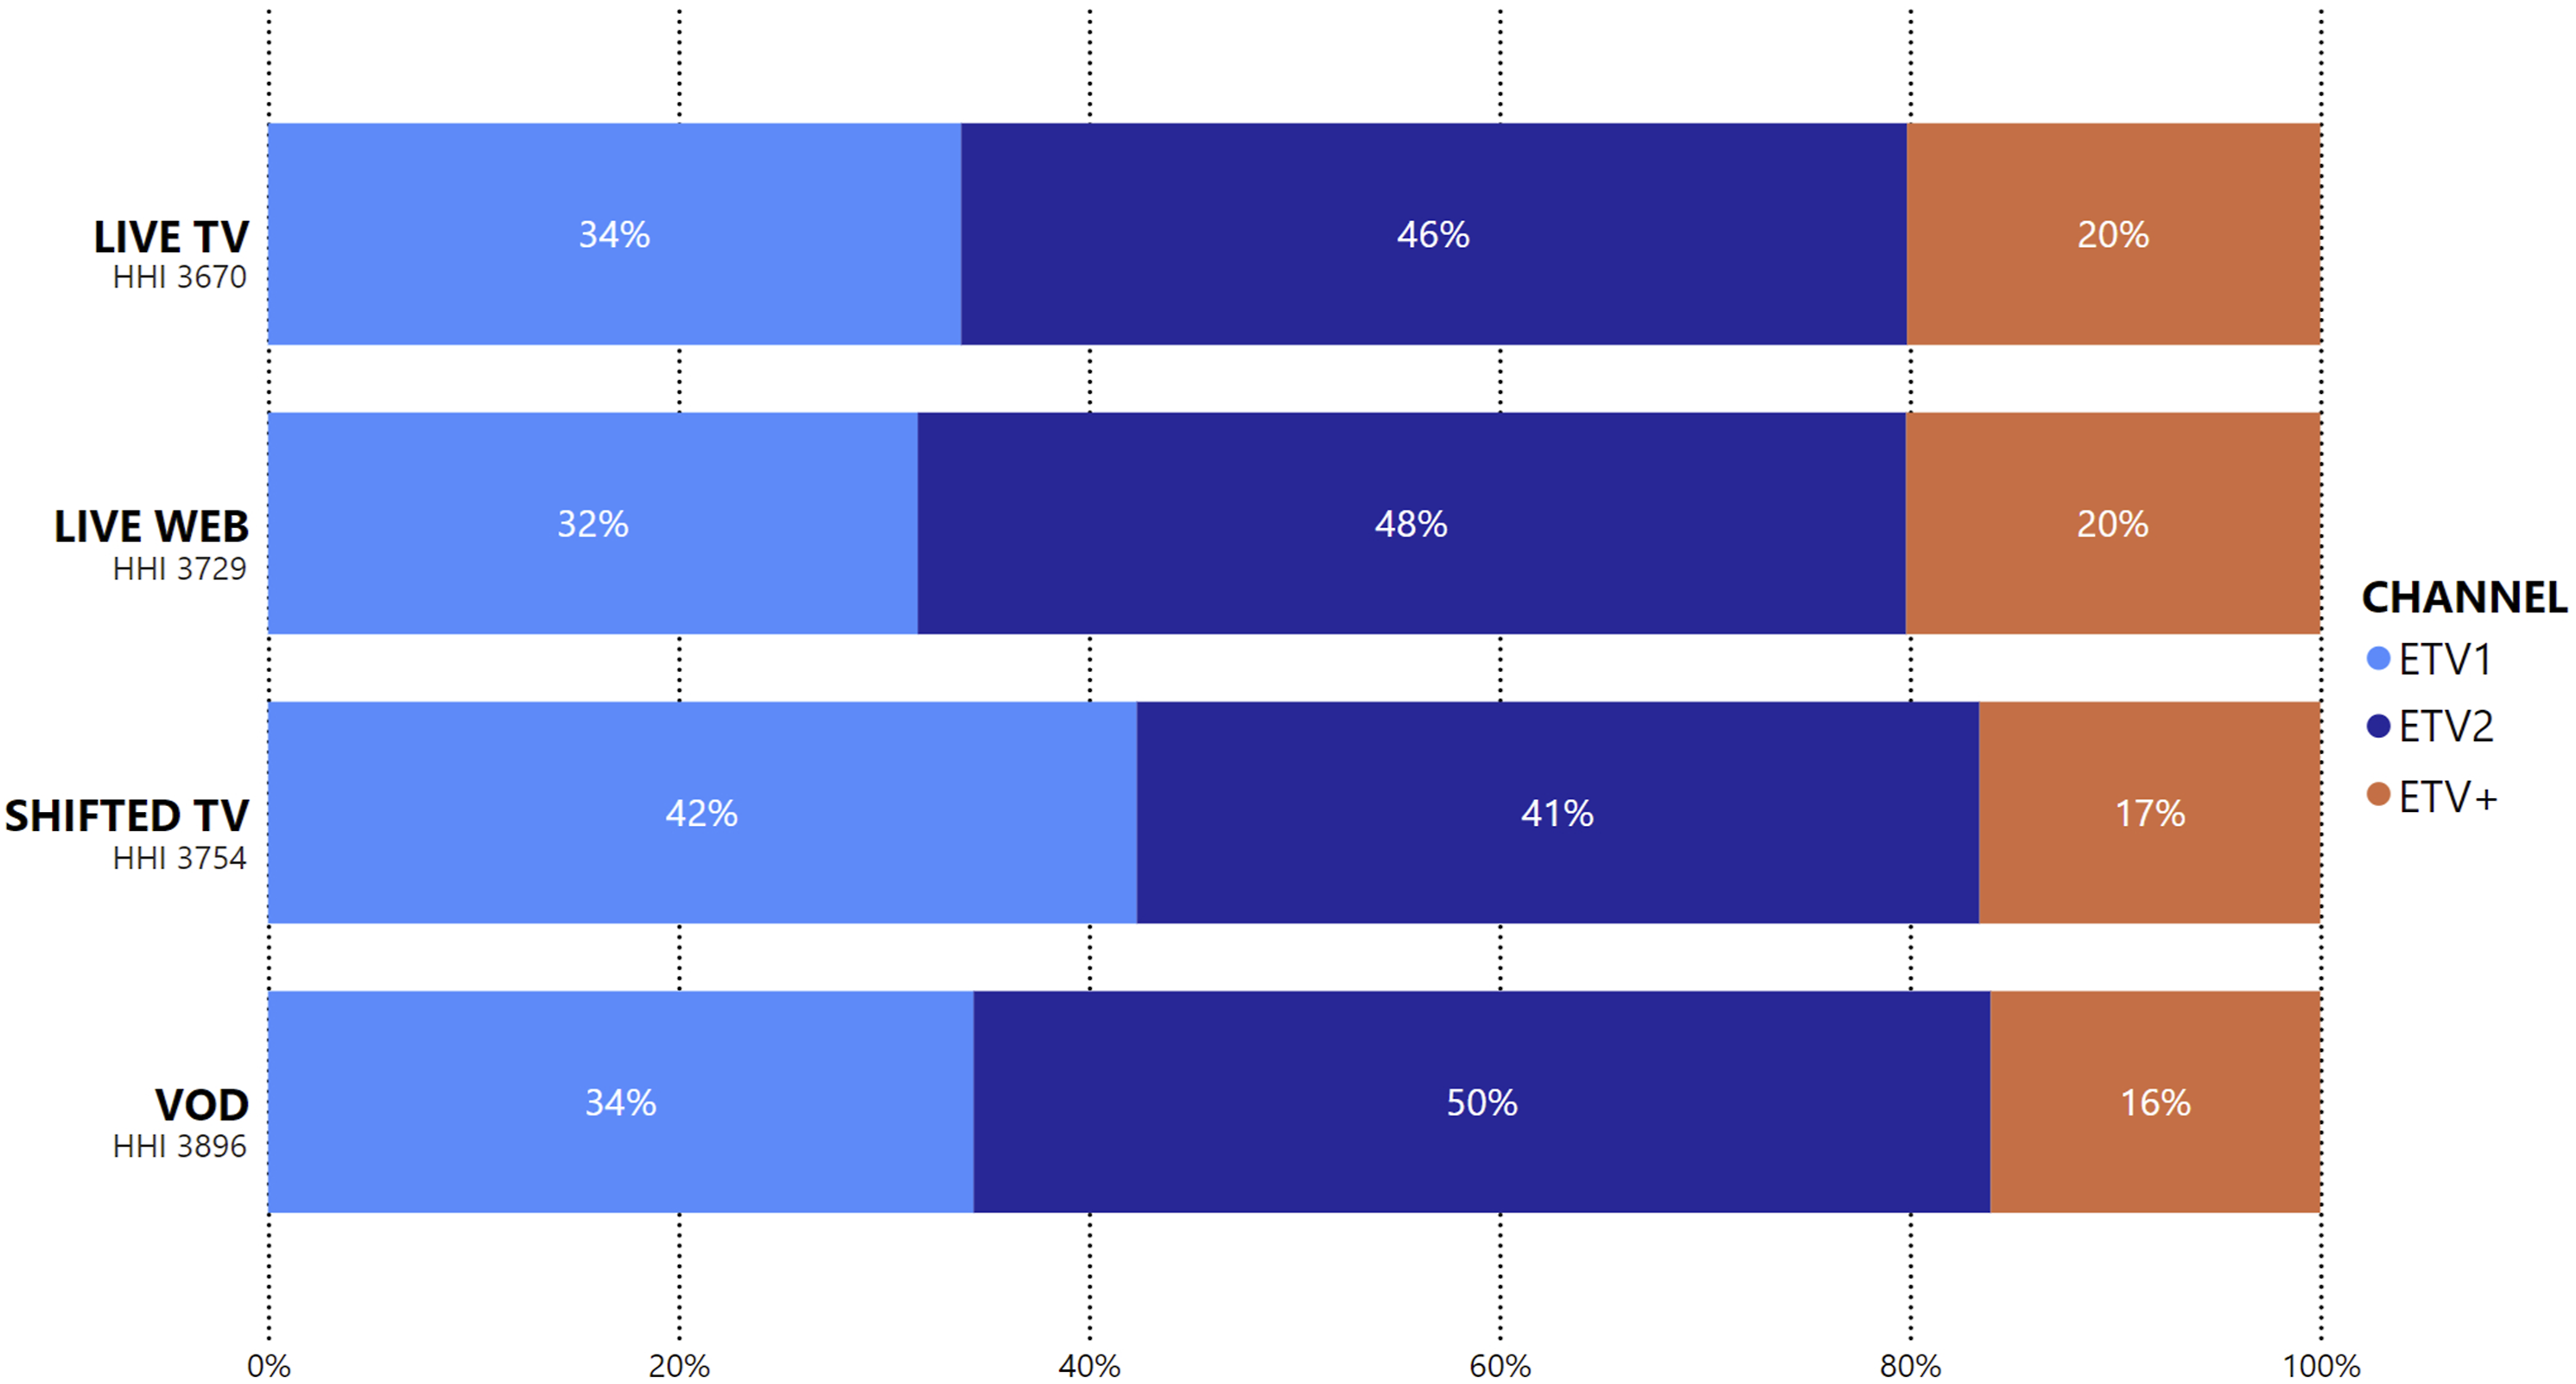
The HHI values are similar across the viewing modes (HHI 3670-3896), with only time-shifted viewing differing slightly from the other modes, as there is no significant difference between the proportions of ETV and ETV2.
Figure 8 which demonstrates the distributions of release channels based on the sum of viewers, aligns with the previous results that the vast majority (83–84%) of live viewers watch content originating from ETV. Yet, the VOD service that incorporates content emanating from all TV channels seems to have, however, an equalizing effect on content popularity. The high share of ETV2’s programmes (40%) in VOD’s popular content is primarily due to the feature films, documentaries and kids’ content aired on ETV2 and published on the VOD service. The share of ETV+’s programmes (10%) in VOD’s popular content needs to be highlighted too. Compared to other viewing modes, the share is higher, indicating VOD’s capacity to increase the popularity of content initially aired on smaller channels by making it available beyond the scheduled niche channel and across multiple devices. Shares of channels of release in the weekly rankings of 2023 by viewing modes, based on sum of viewers.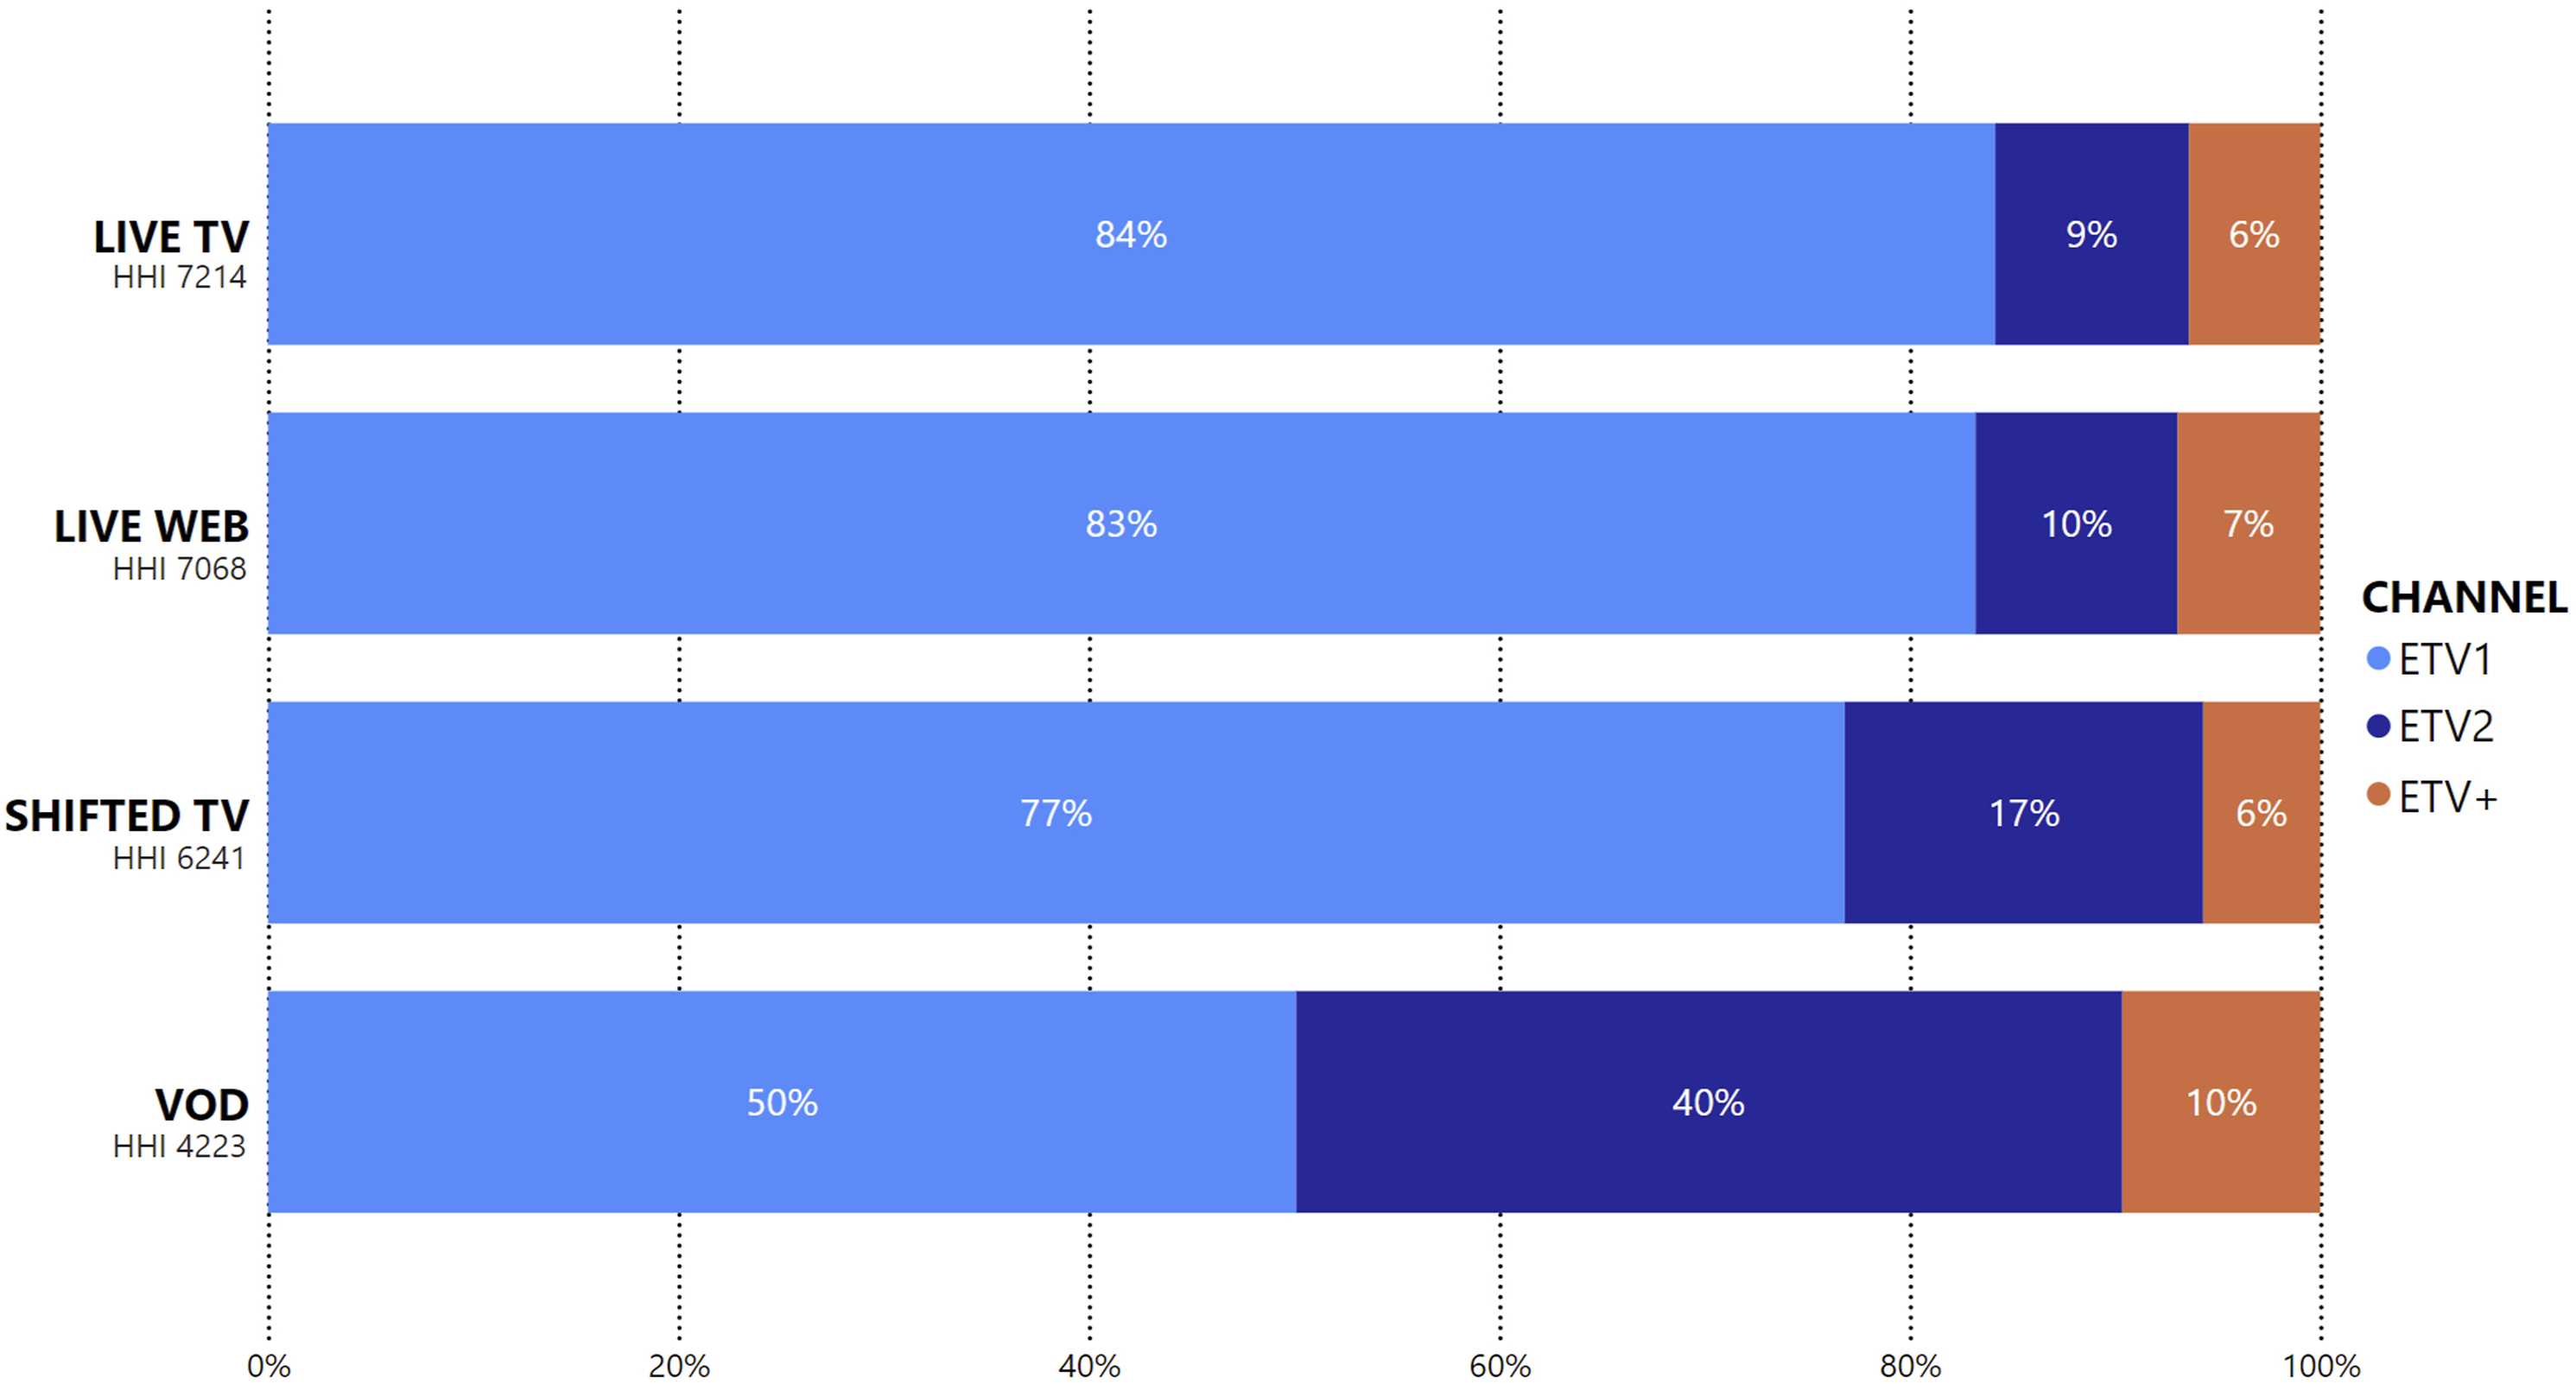
Summarizing the results of the analysis, it can be stated that the distribution structures of viewed titles across viewing modes are similar in terms of all observed metadata categories. However, viewing modes differ significantly when considering the viewership numbers, especially when comparing live and VOD viewing modes. VOD is the least diverse in terms of content types, but the most diverse in terms of countries of origin, production years, and the channels of release. There are no major differences between live viewing on TV and the web, whereas time-shifted viewing falls between live viewing and VOD.
Conclusions
In this study, we have demonstrated how combining multiple datasets in a multidimensional framework can broaden the understanding of contemporary TV audiences and supplement traditional people meter measurement with new knowledge. While our case of Estonia and ERR represents only one possible configuration, the approach illustrates the potential of integrated datasets to shed light on patterns of TV consumption in the multi-platform era.
Our empirical analysis compared several viewing modes in terms of metadata categories and provided an opportunity to better understand how technical features can translate into distinct patterns of content consumption. The significant differences between live TV and VOD viewing in their popular content, ascertained in the study, can be partly explained through the somewhat minor differences between live and time-shifted TV viewing. It is important to note that the list of titles available is exactly the same for both latter viewing modes. Therefore, the time-shifted viewing’s sliding away from the traits characterizing live viewing towards those characterizing VOD can be explained by the viewers’ increased ability to watch preferred content at a suitable time, the latter ensured by the longer availability. Taking the even longer availability, greater content selection, and ability to binge-watch, the popular content of VOD viewing tends to result in significantly different viewing patterns. Another finding of the study that supports this argument is the lack of major differences between the two live viewing modes (TV vs the web). This indicates that distinct results in popular content are not determined by the device or screen used, but rather, by the freedom (or its absence) in choosing viewing time and the quantity of available content.
We underscore the role of audience practices in shaping these patterns. The findings resonate with recent audience research, which highlights how content discovery and platform preferences are structured not only by platform affordances but also by expectations, routine behaviours, and demographic clustering. For instance, differences in age and gender profiles were particularly notable for VOD, where female audiences were proportionally larger and content preferences diverged most strongly from other modes. At the same time, Johnson et al. (2023) results suggest that a large share of viewers actively use multiple viewing modes, meaning that their overall consumption may remain diverse; it is just that different modes are chosen for different types of content. As a result, imbalances across modes may be less problematic than they appear. Nevertheless, in line with recent audience studies, our results suggest that multi-platform analysis must account for both technical features and socially embedded practices if it is to capture the full dynamics of content consumption.
Further, an important finding was that content that was not afforded prime time slots often gained more popularity via time-shifted and VOD viewing. Additionally, content from smaller niche channels stands out in both schedule-free viewing modes. Hence, although VOD may reinforce scripted content, it can also enhance the reach of otherwise marginalised content, thereby having the potential to improve the public value provision by PSMs. When evaluating the audience for scripted and niche content, it is therefore necessary to establish a multi-platform measurement across viewing modes. In the context of PSM, more attention should also be paid to evaluating diversity and balance across all viewing modes. Our analysis suggested that VOD can have both a balancing (geographical and temporal aspect) and a disruptive effect (discursive/thematic aspect). This suggests a dual role for PSM in managing the risks of scripted content’s concentration while leveraging on-demand affordances to broaden cultural exposure.
For PSM, the findings carry strategic and normative implications. The case of ERR shows that even in smaller markets, where institutional capacity is limited and digital transition is ongoing, the shift from linear to VOD is reshaping the balance between factual and scripted, mainstream and niche, domestic and foreign content. As VOD grows, it risks amplifying certain genres or demographics while marginalising others. In this context, developing multi-platform metrics, including indicators of diversity and balance, is essential for evaluating PSM’s performance in an environment where TV viewing is increasingly fragmented.
This study is not without weaknesses. Future research should consider audience perceptions of viewing modes and the structural differences between TV programming and VOD catalogues in greater depth. Also, content prominence is likely crucial in shaping popularity and should be examined across modes, for instance, prime vs. non-prime-time slots on TV or prime shelves vs. only searchable content on VOD.
Footnotes
Acknowledgments
We thank Raigo Piibar from Estonian Public Broadcasting for his assistance in preliminary data collection.
Funding
The authors disclosed receipt of the following financial support for the research, authorship, and/or publication of this article: The writing of this article was supported by the Estonian Research Council (grant PRG 1641).
Declaration of conflicting interests
During the research and writing of this article, Raul Lobanov was working part-time for Estonian Public Broadcasting.
Data Availability Statement
It is not possible to share the data, as it contains detailed information about the publishing strategies, viewership numbers, and content metadata of Estonian Public Broadcasting.