
Abstract
Using Netflix’s weekly Global Top 10 lists for English-language and non-English-language series and films, this article highlights some of the ways in which the world’s most popular streaming platform misrepresents both the production and consumption of its most popular geographically diverse global content. First, the Global Top 10 lists create a series of false equivalencies between the popularity of English-language and non-English-language content that mask the difference in production budgets between the two categories. Second, Netflix’s publicized data isolates the global audience distribution of non-English-language content from other economic, technological, cultural, and political factors affecting local media ecosystems as demonstrated through an analysis of South Korea. Third, in failing to account for genre-related differences, the Global Top 10 lists distorts audience behavior in the Ibero-American region. Despite the variety of limitations presented by the incomplete audience data from Global Top 10 lists, when properly contextualized with recent academic research and economic information extracted from the specialized trade press publications, this article argues that the relationship between global streaming audiences and geographically diverse content is far more complex than it appears in the Netflix’s industrial discourses.
Keywords
Introduction
In recent years, Netflix executives have framed the service’s content commissioning process as one offering a greater equality of opportunity than other global buyers. This is achieved through the repeated invocation of the notion that Netflix commissioned series ‘come from anywhere’ and are then ‘loved everywhere’ (Bajaria, 2021; Brown, 2022; Netflix, 2021). Yet, the history of Netflix commissions does not reflect the diversity of content implied by such claims. Using data from Ampere Analysis, Lotz (2021) and her co-authors find that, through February 2021, 95 percent of Netflix’s domestic commissions came from only 17 countries (517). This article contributes to the ongoing scholarly discussions of streaming diversity by analyzing Netflix’s weekly Global Top 10 list data for English-language and non-English-language series and films across almost 2 years (June 2021 to May 2023) from the perspective of global media industries and audiences.
This analysis finds that Netflix’s presentation of its most popular content misrepresents the production and consumption of geographically diverse global content in several significant ways. First, as a result of being structured by a dichotomic ethno-linguistic classification, the Global Top 10 lists create a series of false equivalencies between the popularity of English-language and non-English-language content, working to obscure the former’s substantially larger production budgets. This leads to the following paradoxical observation: Netflix’s content catalogue and viewership figures reflect an opening of global audiences to audiovisual content produced beyond English-speaking countries, but this does not entail a decline in the appeal and consumption of US-produced media content. Second, although the popularity of Korean content is often associated with major global changes in media content flows, this analysis argues that it is misleading to isolate the global audience distribution of non-English-language content from other economic, technological, cultural, and political factors affecting local media ecosystems. This claim is supported by data from the Global Top 10 lists that indicate the global audience distribution for non-English-language television content is both highly concentrated and unrepresentative of the languages, cultures, and societies that generate the majority of Netflix’s revenues. Third, this analysis argues that the generic characteristics of the telenovela, the most popular and traditional Latin American television genre, allow for misrepresentations of audience behavior in the Ibero-American region. In addition, a consideration of the Latin American television series that appear on the Global Top 10 lists points to a fragmentary and asymmetrical map of Netflix’s investment in the region where most of the commissioned or co-commissioned original content is produced in and for the two largest regional markets: Brazil and Mexico.
This article begins with a discussion of scholarly literature addressing various conceptions of diverse content as related to the industrial contexts of streaming television. The following section provides a description of the methods and analytic approach used in this research. Next, the findings are presented in three sections that correspond to the issues described above. Taken together, the analysis of Korean and Latin American content on Netflix’s Top 10 Lists highlights the ways in which non-English-language is misrepresented in both national and regional contexts. This article concludes with a consideration of the implications of these findings for future research, arguing that that the relationship between global streaming audiences and geographically diverse content is far more complex than it appears in the Netflix’s industrial discourses.
Global television flows and diverse streaming content
Traditionally, scholars concerned with the global flows of television content have mirrored industry wisdom regarding audience preferences for local (de Sola Pool, 1975) or culturally proximate (Straubhaar, 1991, 2007) content. Such theorizations assert that local specificity limits international appeal. As a result, the most successful properties in the global television market are thought to be the product of strategic efforts to ‘deculturize’ narrative content (Bielby and Harrington, 2008: 89). From prime-time soap operas (Liebes and Katz, 1993) to more recent reality formats (Stehling, 2013), academics note that globally popular content frequently includes elements to which audiences from a variety of cultural backgrounds can relate. It is this notion of universal appeal that is often used to explain the success of a particular series despite national audiences’ preferences for local content.
Yet, since Netflix’s most recent global expansion in 2016, executives have consistently emphasized the importance of commissioning ‘local for global’ drama series (Hopewell and Lang, 2018). According to then-head of global television Bela Bajaria, for example, local producers are ‘extraordinarily empowered, local decision makers’ who ‘make the decisions in their own time zone in their own country and in their own language’ which results in the export of ‘local authentic stories and shows [to] everywhere around the world’ (Ramachandran, 2021). As scholars of transnational television note, however, the ‘local’ is all too often collapsed into the national (Esser, 2016) and a series’ country of origin is not a useful indicator of cultural specificity (Lotz and Potter, 2022: 690). With these caveats in mind, scholarship addressing Netflix’s relationship to ‘diverse’ global content has proceeded along four interrelated paths that are particularly relevant for this research.
First, scholars interrogate what precisely it means for Netflix to have become a global streaming platform. Lobato (2019) and Jenner (2018), for example, explore Netflix’s internationalization from the perspective of transnational television, defined as television distribution systems that cross one or more national borders. As a transnational television service, Lobato (2019) argues that Netflix’s global expansion should be understood as a multi-sited process of localization. At the broadest level, the service’s ability to operate in any national context is dependent upon adequate broadband infrastructure to support streaming video and regulatory approval. With the necessary infrastructure in place and having received the approval of regulators, Netflix must then establish a distinctive niche for itself in every international market. According to Lobato (2019), the service’s commitment to geographically diverse original productions, like its localization strategy more broadly, demonstrate the ‘fundamentally local nature of global taste’ (182). Jenner (2018) likewise argues that Netflix functions as a transnational broadcaster that integrates itself into national media systems. Citing the example of regulation in Poland, she notes that the company is ‘often forced to adapt to national culture through media policies’ (Jenner 2018, 189). At the same time, translation and dubbing allows for further integration. This ‘domesticated’ content heightens the service’s appeal for national audiences even though Netflix series are created for transnational audiences and are often multilingual (Jenner 2018, 237). Although Lobato’s and Jenner’s analyses of Netflix as transnational television differ in significant ways, both scholars argue that a primary consequence of global expansion and the company’s efforts to appeal to audiences in more than 190 countries is that it is now impossible to address Netflix as a single, coherent service.
A second relevant stream of recent scholarship seeks to map Netflix’s global content commissions. For example, Iordache et al. (2022) find that between 2012 and 2020, Netflix invested in 176 European scripted series through a combination of licensing, co-production/co-financing, and continuation deals (241). Using a sample of 306 co/commissions, Lotz (2021) finds that 58 percent of the series in the sample were produced outside the US (202). Using data from 17 countries, Lotz et al. (2022) find that the cumulative effect of this geographic diversity is that ‘Netflix libraries are not overwhelming composed of American titles, but they are also not particularly local’ (514). The significance of Netflix’s commissions, however, extends beyond the value of tracking the amounts and localities of particular investments. As Lotz (2023) observes, the global commissioning of streaming content is important for ‘two key conversations in media studies that are centrally concerned with questions of culture and power’ (22). The first relates to the relationship between technological change, economic practices, and shifting production norms. The second is concerned with the practices and consequences of transnational video flows.
A third stream of research evaluates the locality of Netflix’s globally commissioned series. Although some research argues that Netflix originals lack the cultural specificity of domestic series produced by traditional national television industries (Ibarra and Navarro, 2022), most scholars understand such dynamics in more complex ways. Considering the case of Australian supernatural crime series Tidelands (2018), for example, Scarlata et al. (2021) argue that the series relies on a ‘dual mode of address’ (142) in its attempts to balance the demands of simultaneously appealing to national and global audiences through specific creative choice regarding locations, casting, and genre. Using textual analysis, Wayne (2023) examines the narrative role of place in two Netflix original police dramas: Dogs of Berlin (2018) and Young Wallander (2020-2022). He argues that in becoming recognizable for local viewers while remaining familiar and accessible to nonlocal audiences, the importance of locality can meaningfully vary within the narrative arc of a given series. The significance of locality for scholars seeking to understand Netflix led Idiz et al. (2024) to develop a methodological framework that defines and measures locality with the hope that it could provide a basis for future analysis.
Fourth, scholars are increasingly interested in the use of ‘diversity’ within the context of Netflix’s industrial discourses. Since 2016, executives at Netflix have often asserted that the streaming service is a force for global good. At a press event in Paris early that year, for example, Netflix founder Reed Hastings told the audience that ‘by building a globally available service, sharing content from all parts of the world, that we can do our part of increasing global understanding towards a goal of greater peace and empathy’ (Bryan, 2016). Indeed, scholars note the centrality of diversity, in particular, cultural diversity and cosmopolitanism, for Netflix’s brand image (Elkins, 2019; Havens and Stoldt, 2022). However, as Asmar et al. (2023) observe, ‘By appealing to discourses of global citizenship and diversity, Netflix brands itself as translator across cultures able to speak to everyone. In that sense, diversity becomes a competitive advantage to attract audiences and accumulate commercial and cultural value’ (36).
Yet, as a result of Netflix’s long-standing anti-transparency data policies (Wayne, 2022), scholars have been unable to connect these various strains of research on streaming diversity to reliable audience data. Even with the introduction of a national Top 10 feature in 2020 offering ordinal ranking of the most popular series in a given country on a given day, scholars’ ability to make global claims about the consumption of Netflix content remained limited (Scarlata, 2023). In November 2021, however, Netflix introduced a new data policy that included the continual release of multiple weekly top 10 reports (backdated to late-June 2021) listing the most-watched English-language and non-English-language films and TV series (Porter, 2021). These weekly reports, released every Tuesday, are based on hours viewed from Monday to Sunday the previous week for both original and licensed titles. In addition, Netflix also began releasing updated lists of the platform’s all-time most popular films and series as well as weekly lists of the most popular films and TV series in over 90 specific national markets.
Specifically, this data is available in three different data sets. The ‘Global Lists’ include four global top 10 lists for film and series Film (English), TV (English), Film (Non-English), and TV (Non-English) that rank titles by weekly hours viewed worldwide. The ‘Country Lists’ include weekly top 10 lists for more than 90 countries ranked by hours viewed. However, the number of viewing hours in the ‘Country List’ is not provided. The Country Lists, unlike in the Global Lists, do not contain any linguistic criteria, and the viewing audience figures are the only criterion ranking the shows. The ‘Most Popular Lists’ include the top 10 most popular all-time Netflix films and series (again, separating English-language from non-English-language) based on the hours each title was viewed in its first 91 days on the platform. Data for each program includes show title, rank, and hours viewed. Although such viewing data fails to provide the substantive transparency desired by academic and industry observers alike, this research proposes that Netflix’s weekly top 10 lists do provide scholars with new opportunities to interrogate the relationship between Netflix and the popularity of geographically diverse streaming video content.
Methods
This research examines Netflix’s weekly Global Top 10 list data for English-language and non-English-language content across almost 2 years starting on June 28, 2021 and ending on May 29, 2023. This data includes 445 different seasons of television series and 880 films. As noted above, the raw data from Netflix includes the following categories: category (Films (English), Films (Non-English), TV (English), or TV (Non-English)), weekly rank, content title, season title (for TV only), and weekly hours viewed. To assist in the data analysis, the raw data was augmented with a variety of additional variables including: The name of the country or countries where the content was produced, the estimations of Netflix’s subscribers numbers in the country or countries that produced the content, the genres according to IMDB Pro’s website, films’ runtime, and, specifically for television series, the number of episodes across the relevant season and the average running time individual episodes in minutes.
This data publicized by Netflix is not intended to reflect the number of viewers for individual films or television series. Instead, this audience data is constructed in terms of viewership hours within a single week for the 10 most globally popular films and television series. However, a rough estimation of the size of an audience in terms of individual viewers was obtained through the conversion of viewing hours into individual viewers. The formula for the conversion of viewing hours into single viewers is based on the division of the weekly viewing hours for a single series with the total amount of hours obtained from the sum of the series’ episodes running time within the season appearing on Netflix’s top 10 list. This metric, labeled ‘viewers’, was added to the dataset. Initially, there was concern regarding the accuracy of viewers as a metric of audience size since it presumes that individuals are engaging with Netflix content by themselves and cannot account for the possibility of individuals watching the same content more than once. These concerns, however, were soon put to rest. In June 2023, Netflix’s Global Top 10 list began to include the number of views per show, in addition to the number of hours viewed (Porter, 2023). As a number of trade press sources noted, Netflix’s calculation of views (dividing the total hours viewed by the runtime of the content) was the same as the researchers’ initial calculation of ‘viewers’. 1 Consequently, the discussion of views in the discussion of data below are figures calculated by the researchers using the same formula as was later employed (and continues to be employed) by Netflix.
The findings generated by this analysis are presented in three sections. The first section examines how Netflix’s dichotomic ethno-linguistic classification of English-language and non-English-language content obscures some of the ways in which the streaming service privileges the former over the latter. Next, this analysis considers the popularity of Netflix’s South Korean content to understand the emerging dynamics of audiovisual entertainment production and consumption in the global streaming era. Lastly, the popularity of Latin American content is considered in relation to Netflix’s investments in the region. Despite the variety of limitations presented by the incomplete audience data from Global Top 10 lists, when properly contextualized with recent academic research and economic information extracted from specialized trade press sources, the research findings presented below identify some of the ways in which Netflix uses its audience data to misrepresent the production and consumption of geographically diverse global content.
Netflix’s top 10 lists as ethno-linguistic construct
Unlike the television content flows examined by scholars during the 1980s and the 1990s who were primarily concerned with single national territories (Sinclair, 1998; Straubhaar, 1984), 2 Netflix’s Global Top 10 lists claim to represent the whole – or rather, Netflix’s – world. Defining the ‘nationality’ or even the language of content within the current media ecosystem is more difficult than in the past because a significant share of contemporary streaming media content is produced by multinational, transnational producers, and features different degrees of on-screen multilingualism (Ribke, 2023). The overwhelming majority of English-language series appearing on Netflix’s Global Top 10 list are television series produced or co-produced in four English-speaking countries: the US, the UK, Canada, and Australia (subscribers from these countries represent 41 percent of the company’s global subscriber base (Brzeski, 2022; Sweney, 2023; Szalai, 2023)). Defining non-English-language content is more complex, because a large number of those series are co-productions involving American producers and English is one of the languages spoken across such series.
Nonetheless, to evaluate the balance of English-language and non-English-language content in Netflix’s world, it was necessary to create two new Global Top 10 lists, one for television series and the other for films, that include all content regardless of language. The sum of viewing hours for all content that appeared on each new list was then calculated to establish the percentage of viewing hours for English-language and non-English-language content. The result of this arithmetic operation found that English-language accounted for 62.5% of the total Global Top 10 Television list viewing hours while non-English-language series accounted for 37.5%. Data from the Global Top 10 films list also indicates that English-language films represent a significantly higher share than non-English-language films, encompassing 67 percent of the total viewing hours across the period studied. The fact that the proportion of viewing hours for English-language films is higher than the proportion of viewing hours for English-language series is not surprising, given the long-standing hegemonic position of the Hollywood film industry (Crane, 2014; McKenzie et al., 2023). At the same time, there is some evidence that audiovisual producers in non-English-language markets are more inclined to invest in television series due to perceptions of lower economic risk in comparison to feature films (Gaustad, 2019; Gómez and Muñoz Larroa, 2023). Following Rosa and Flores (2017), however, this analysis argues that Netflix’s Global Top 10 list operates as an ethno-linguistic construct that creates a false perception of equivalent popularity between English-language and non-English-language content.
It is useful to compare the audience data for Netflix’s most popular English-language and non-English-language series with their respective production budgets. In the data addressed by this research, the single most popular English-language series is the fourth season American science fiction horror drama Stranger Things (2016-present) with nearly 1.9 billion hours viewed. The most popular non-English-language series is the first season of South Korean dystopian drama Squid Game (2021-present) with nearly 2.3 billion hours viewed. After dividing the hours viewed by the total runtime of each season, the fourth season of Stranger Things and the first season of Squid Game received approximately 144 million views and 275 million views, respectively. Yet, a direct comparison of this audience data cannot account for the economic impact of each of these series. According to trade press reports, Stranger Things’ fourth season is the most expensive Netflix production of all-time costing an estimated $270 million for nine episodes (Flint, 2022). In contrast, the nine episodes that constitute season one of Squid Game cost only $21.4 million to produce (Clark, 2021). Dividing these production costs by the number of views, it seems that Netflix spent $.08 per view for Squid Game while spending $1.87 per view for Stranger Things’ most recent season. This difference indicates Netflix’s most popular non-English-language series achieved a significantly larger audience with significantly less economic investment.
A similar trend appears among Netflix’s most popular film content. During the period researched, the top ranked English-language film on the Top 10 list is the American political satire Don’t Look Up (2021) with nearly 390 million hours viewed. With an impressive cast of Hollywood mega-stars including Leonardo DiCaprio and Jennifer Lawrence, Don’t Look Up had a budget of $110 million and was acquired by Netflix during its production process (Mendelson, 2021). According to the data, the most popular non-English-language film is the Norwegian monster movie Troll (2022) with slightly more than 175 million hours viewed. Troll’s initial budget was $5.5 million but that amount increased considerably following Netflix’s involvement with the project (Pedersen, 2023; Steinkjer, 2022). 3 Assuming (for the sake of argument) that Netflix doubled the initial budget for Troll and applying the same calculations as above, Netflix spent $.05 per view for Troll in comparison to $.68 per view for Don’t Look Up. As with the television series Top 10 list, Netflix’s most popular non-English-language films economically outperform the most popular English-language film content.
Considering Netflix’s Global Top 10 lists for television series and films collectively, the findings described above leads to a paradoxical observation. On one hand, Netflix’s content catalogue and audience data reflect an opening of global audiences to audiovisual content produced beyond English-speaking countries. Yet, at the same time, this data does not indicate a decline in the appeal and consumption of media content produced or originating from the US. The substantial budgetary gaps between the most popular English-language and non-English-language films and television series point to persistent asymmetries that were not foreseen by either scholars working within the cultural imperialism thesis or scholars asserting an ongoing erosion of American cultural industries’ hegemony (Ribke, 2017; Straubhaar, 1991; Thussu, 2006).
Netflix’s South Korean content and global popularity
Viewing hours by country in Netflix's global top 10 english and non-english series.
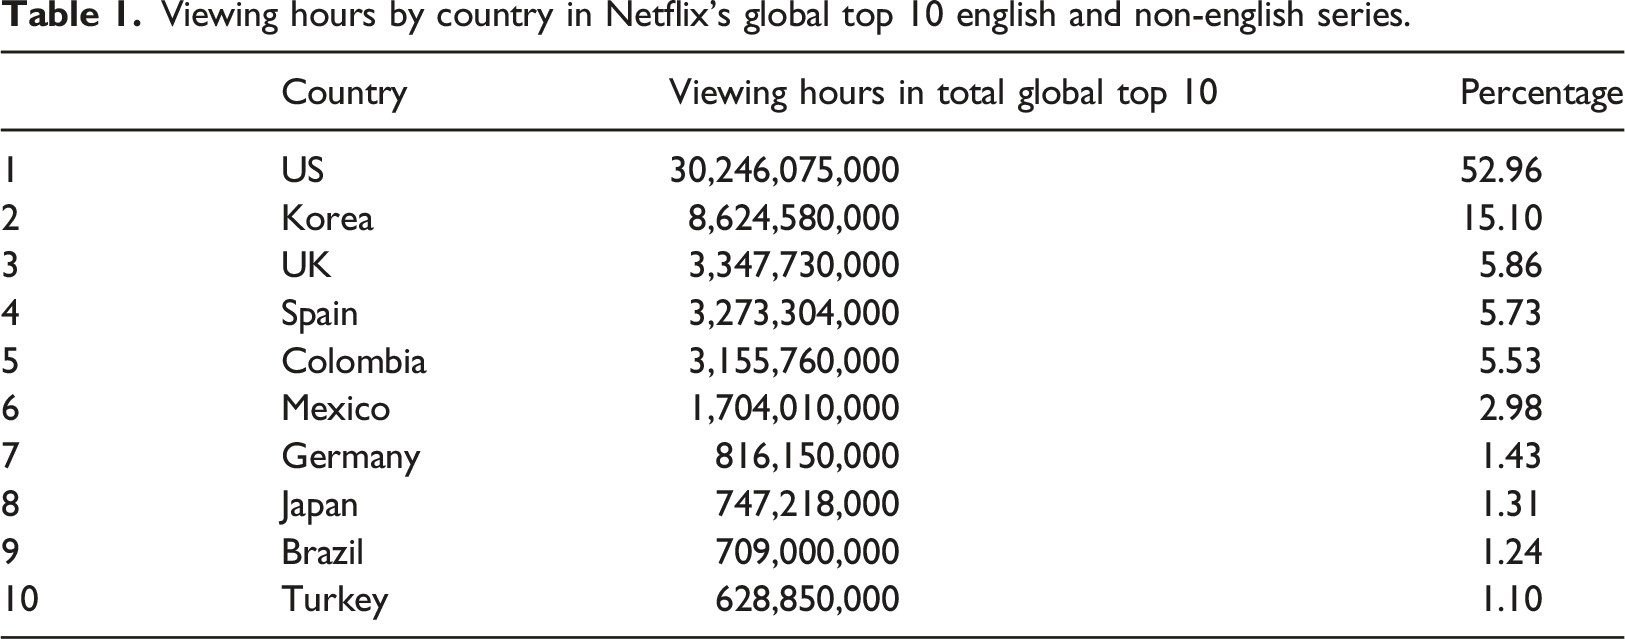
According to the data included in this research, South Korean content is the most popular non-English-language content streamed by Netflix subscribers accounting for 36.1% of all non-English-language viewing hours and 15.1% of total viewing hours. Spain and Columbia are the next most popular sources of global content accounting for 5.7 and 5.5% of the combined English-language and non-English-language viewing hours on the Global Top 10 lists, respectively. The popularity of South Korean content is certainly related to Netflix’s investments there. As Lotz (2021) observes, South Korea is second only to the US regarding the number of Netflix series commissions and co-commissions (202). Netflix’s non-English Global Top 10 list includes 55 Korean series. The generic diversity of these series is often interpreted as an indication of Korean media industries’ creativity and production capability (Ju, 2020; Noh, 2022). In the context of this analysis, however, the data provides opportunities to explore the significance of the popularity of Netflix’s Korean content in three ways.
First, it is useful to compare the popularity of Korean series, as the most globally popular non-English-language content, to the popularity of American series as the most popular English-language content. To do so, it is necessary to calculate the sum of Korean Global Top 10 shows’ viewing hours and dividing those hours by the sum of the shows’ total running time. This is complicated by Netflix’s choice to publicize data based on specific seasons rather than series as a whole. After calculating each specific season’s run time (i.e., the sum of each episode’s running time within a single season), the sum of all Korean series run time is calculated to obtain the total run time of Korean content on the Global Top 10. This total Korean content run time was divided by the number of viewing hours associated with this content which provides the number of hours viewed per hour of content streamed around the world. The same procedure was then applied to the Global Top 10 US shows. While Korean series on the Global Top 10 amassed 11.2 million hours viewed per hour of Korean content streamed, US Global Top 10 content collected 1.61 million of hours viewed per hour of US content streamed. In other words, US content’s larger global viewing figures are the result of a much larger pool of content produced and or made available by Netflix in comparison with non-English-language content. As observed above in connection to Global Top 10 lists for English-language and non-English-language films and series, Netflix’s acquisition of Korean contents appears to represent extremely profitable investments both in terms of viewing hours/running time of the shows and in terms of acquisition and/or production costs.
Second, the international popularity of Korean content offers some significant insights regarding the relationship between the generic characteristics of the content on Netflix’s Global Top 10 list and the international division of labor among entertainment media industries across the globe. For example, 33 percent of American content in the Global Top 10 list is comprised of low-budget, non-fiction genres, such as reality shows, game shows, and docutainment series. In contrast, non-fiction genres represent only 4.5% of Korean series on the Global Top 10 list. While some observers may identify in this trend a sign of Korean media industry’s strength, it is equally indicative of the American entertainment industries’ capacity to produce and export both extremely expensive audiovisual content along with relatively low-budget television products. This provides American producers with a wider spectrum of options in their efforts to navigate the increasingly competitive landscape of the global media market. Unlike the consumption of higher-status non-English-language fiction content (like dramas) which seems to traverse national frontiers relatively easily, lower-status content such as reality shows and sitcoms appear to be consumed primarily in the contexts of national audiences and national cultures. However, as several studies have shown, non-English speaking nations/market are more receptive to lower-status American television content because non-English speaking audiences have long been exposed to American content and American culture (Kalviknes Bore, 2011; Mikos and Castro, 2021).
Third, the popularity of Korean series as demonstrated by data from Netflix’s Global Top 10 list is all-the-more notable given Netflix’s relatively small subscriber base in that country in comparison to those in other global production hubs like Brazil and Mexico. In 2020, for example, Netflix had 3.8 million subscribers in South Korea (Frater, 2021). That same year, Brazil’s subscriber base was expected to surpass 15 million (Amaya, 2020) and Mexico’s was an estimated 7.4 million (Gómez and Muñoz Larroa, 2023: 89). Yet, there is evidence that South Korean Netflix subscribers are significant consumers of their own national content. Although Netflix does not release the viewing hour figures for specific national top 10 lists, during the period examined in this research, 90 percent of the viewing hours for the content on the weekly Korean ‘Country List’ are spent on local television content. In other words, the Korean market exports Korean content and consumes Korean content. Despite these impressive figures, the incomplete data from Netflix’s Global Top 10 lists do not provide a sufficient empirical base to support either generalizations about the reversing of power structures in media industries or generalizations related to South Korea displaying patterns akin to cultural imperialism.
Taking a step back, it remains an open question as to whom is the primary beneficiary of the relationship between Netflix and South Korean media industries. Certainly, the popularity of South Korean content benefits Netflix economically (Shaw, 2021) and bolsters the company’s broader long-standing claims regarding the diversity of its original content (Hyo-won, 2016). Yet, even as Netflix’s participation in the Korean media market supports the production of high-budget content and the distribution of Korean series across the world, producers and broadcasters have expressed their concerns about its long-term negative effects for multiple reasons (Kim, 2022). The economic scale of Netflix co-productions work to the detriment of independent Korean producers and broadcasters who cannot compete with the scale and resources of the global streaming giant (Park et al., 2022). Furthermore, by maintaining control over the global streaming rights for the Korean productions they commission/co-commission, Netflix keeps the lion’s share of profits generated from this content. Given these issues, Korean producers are rightly concerned that a dependency on foreign capital will turn the Korean media industry into subcontractors of the global streaming platforms at the expense of local broadcasters and audiences (Kim, 2023). Questions as to whether the ‘Korean Wave’ (Ju, 2020: 8) will turn into a stable flow of Korean media products is beyond the scope of this article. However, the economic dependency of Korean producers on foreign/American media corporations and platforms to finance and distribute their products should be read as a warning sign suggesting a more complex contextualization of global media production and consumption patterns.
Netflix and the regional dynamics of Latin American media industries
In contrast to the previous section which focuses on a single national market, this section examines the Latin American television content that appears on Netflix’s Global Top 10 list to provide insights regarding the company’s production and consumption patterns in the region. Latin America is comprised of three dozen nation-states that share some major characteristics, such as similar religious demographics, a common painful colonial past, two closely related Iberian languages and a social/economic structure that makes this region one of the most unequal of the world (Ribke, 2023). The question as to whether Latin American countries conform a single cohesive media content market is more complex to answer in comparison to English-speaking nations/markets. Nonetheless, the analysis of Latin American content viewership is useful in efforts to understand intraregional and transnational dynamics in the global streaming market.
With regards to viewing hours, Colombian television content is the fifth most popular on Netflix’s Global Top 10 list trailing only US, Korea, UK, and Spain. Considering regional productions collectively, Latin American television content amounted to 10.5% of the total viewing hours for Netflix’s Global Top 10 list. Excluding series co-produced with American companies, that number decreases to 9.4%. This is surprisingly low since Latin American subscribers represent 18 percent of Netflix’s global subscriber base (Menezes, 2023). In addition, there is a discrepancy between the revenue the region generates for Netflix and the company’s investments with regards to commissioned content. In 2022, for example, Latin America produced more than four billion dollars of revenue which represents nearly 13 percent of total global revenue (Szalai, 2023). Yet, only 10 percent of Netflix’s commissioned series are produced in Latin America (Lotz, 2021: 204).
Examining the generic identity of Latin American Global Top 10 television content is illustrative of the regional production and consumption patterns, but also of Netflix’s overall policy towards the region. 60 percent of Latin American content viewing hours on Netflix’s Global Top 10 list corresponded to shows from the telenovela genre, a fact that creates a false impression of higher viewership figures. While television series viewership numbers correspond to shorter series typically consisting of eight-to-twelve episodes per season, telenovelas have more than 150 episodes on average and a similar running time to drama series. For example, while Korean Global Top 10 content had an average of 11.2 million hours viewed per hour of Korean content streamed, Latin American telenovelas obtained an average of 1.6 million hours viewed per hour of content streamed, a similar proportion to that obtained by American television content in the Global Top 10 list. However, while American content in the Top 10 list is mostly composed of high-budget commissioned content, Colombian telenovelas are low-budget productions even by local standards. 70 percent of the Global Top 10 viewing hours for Latin American telenovelas were directed towards licensed Colombian telenovelas, which were broadcast in Colombia and Latin America by local networks several years previously. Only one out of 17 Latin American telenovelas, the Mexican Donde Hubo Fuego (High Heat) (2022) is classified as a Netflix original series.
Yet, Colombian telenovelas’ large number of viewed hours is not reflected in Netflix’s investment in Colombian commissioned content, which lagged behind Mexico, Brazil and Argentina (Lotz et al., 2022). Considering Latin American content on the Global Top 10 List by country of origin, whether the series were co/commissioned or licensed, running time, and viewed hours figures, a revealing picture emerges reflecting the unequal market size and media industries’ economies within the region. In that context, Brazil and Mexico are regional leaders in providing commissioned and co-commissioned content to Netflix’s library, a fact that is reflected in the Global Top 10 list. When totaling the running time of Latin American original series in the Global Top 10 data and then dividing that number by the sum of Global Top 10 Brazilian and Mexican original series run time, the results indicate that those two countries produced 88.3% of Netflix’s commissioned regional content.
After examining Latin American content performance on Netflix’s Global Top 10 list, one can extract three partial conclusions that coincide with previous research on Netflix’s economic strategies and performance in Latin America. First, Netflix’s revenues and subscription numbers in Latin America are not reflected in the company’s investment in the production of local content. The fact that Latin American audiences are, to different degrees, used to watching American content since the early days of broadcast television is perhaps one of the most convincing main explanations given for Netflix’s lower investments in local productions (Garcia Leiva et al., 2021). Although some studies have argued that national audiences exhibit strong preferences for local content (Straubhaar, 1984, 1991), Latin American media industries, with the exception of Mexico and Brazil, are unstable due to the recurrent political and economic crises in the region. During specific periods of time, countries like Argentina and Venezuela, for example, experience periods of booming in local production. Yet, such periods are followed by a decline in local production which leads to the increased importation of ‘canned’ foreign content. It is local audiences’ tolerance of local, intraregional, and foreign (mostly American) television contents that, according to Lobato (2019), was Netflix executives’ primary justification for the company’s early expansion into Latin America.
Second, Netflix’s investments in the production of audiovisual content in the Latin American region do not appear to be shaped by global audience data regarding viewing hours or viewership in general, but by the countries’ market and subscription base. This is most evident in the cases of the Brazilian and Mexican media industries and their larger consumer markets. While the lion’s share of Brazilian and Mexican commissioned content may not turn, for different reasons, into Netflix’s most viewed shows across the globe, producing original shows in those countries may answer the local audiences’ demand for local content (Cornelio-Marí, 2020; Meimaridis et al., 2021). At the same time, producing local content in those large nation/markets may add to the platform’s appeal across Latin America because the smaller countries in the region also have a long history of exposure and consumption of Brazilian and Mexican television products (Ribke, 2020; Sinclair, 1998).
Third, there is a growing contradiction between the regional analysis of media production and consumption following traditional geo-political and historical mappings and the dynamics of present-day media industries’ ecosystem. In the case of Mexican and Colombian co-productions with US producers and broadcasters aimed at transnational Spanish-speaking audiences such as Narcos (2015-2016), Narcos: Mexico (2018-2021) and La Reina del Sur (2011-present), for example, defining such shows in terms of a single national media industry is inaccurate and will inevitably create a distorted image of global media flows. Instead of identifying individual series with single nations/media markets, there is a need for creating new categories and classification systems to understand evolving patterns in media production and consumption. Obtaining more financial information about a show’s production, developing a more refined theoretical framework to define the content’s cultural and/or linguistic identity along with reliable data regarding the global distribution of their audiences will be a decisive step to achieving that goal.
Discussion
Using the fragmentary and partial data publicized in Netflix’s Global Top 10 lists, this article begins to examine some of the ways in which the world’s most popular streaming platform misrepresents both the production and consumption of its most popular geographically diverse global content. Like its past efforts to publicize audience data (Wayne, 2022: 200–202), Netflix uses the Global Top 10 as a vehicle through which viewership figures can be separated from the broader context of the media industries. Separated from their industrial context, this audience data supports Netflix’s brand image as a benevolent corporate sponsor of diverse global streaming content. For example, the prominence of Korean content on Netflix’s Global Top 10 may well create the impression that the US-based streaming service is helping to reverse the historical imbalances in global content flow. Yet, considering the impact of foreign investments in the Korean media industry is indicative of persistent asymmetries between American/English-speaking countries and national media industries outside the ‘Anglo-Saxon’ axis (Ribke, 2017). Similarly, the popularity of Colombian content creates a distorted image of Netflix’s involvement in the Latin American region. If viewership drives investment, as Netflix often implies with regards to national markets like South Korea (Frater, 2023), then it would be reasonable to expect Netflix to make significant investments in the Columbian film and television industries. Of course, this has not happened and the bulk of Netflix’s regional investments have been directed towards the two largest national media markets (Brazil and Mexico). As such, it seems reasonable to expect that Netflix’s regional investments in local original content production will primarily be related to national market size and purchasing power rather than global views or audience size.
These arguments are not intended to diminish Netflix’s achievements with regards to the production and distribution of geographically diverse global content. Although there is little to merit the hyperbolic ‘disruptive’ claims that Netflix as a Silicon Valley company has ‘revolutionized’ Hollywood, the company is leading the market in this regard. Since the beginning of 2020, Netflix has commissioned 814 titles internationally – more than twice as many as Warner Bros Discovery and Amazon, and more than three times as many as Disney (Dams, 2022). And this investment in geographically diverse content produces economic benefits for Netflix in a variety of ways. In its marketing and corporate communication, Netflix emphasizes the production of non-English-language content as part of a ‘strategy of differentiation’ (Asmar et al., 2023: 7) to highlight the differences between its offerings and those of its competitors. In this way, the production of global content becomes incorporated into other industrial discourses Netflix has used in the past for purposes related to brand differentiation (Wayne, 2020). More directly, the economic benefits generated by the most popular global content gives Netflix a competitive edge at a time of contraction within the American television industry (Schneider, 2024) and increasing investor demands of profitability from streaming platforms (Reinicke, 2024).
Looking ahead, this research has several implications for scholars seeking to understand geographically diverse content within the context of the streaming media ecosystem. First, what Netflix says and doesn’t say about the popularity of its global content must be understood in relation to the competitive dynamics of the streaming market. Whatever value Netflix might have recently discovered in data transparency as an inherent virtue, it is impossible to separate the competitive advantage that data releases provide. As the most popular streaming platform, publicizing audience data is a win-win for Netflix. If competitors like Disney+ and MAX (formerly HBOMax) continue their unwillingness to publicize audience data, then Netflix can continue to claim market dominance. If, on the other hand, these trailing competitors publish audience data, then Netflix will likely be confirmed as the most popular global streaming service. Second, this research highlights the ways in which Netflix’s public discussions of its audience data further limit possibilities for collective understandings of popular television in the age of streaming. The lack of geographically specific audience data (beyond ranked content without number of views) and the unwillingness to release weekly view data beyond the top 10 ensure that connections between popularity and viewer behavior are articulated on Netflix’s own terms. Yet, somewhat counter-intuitively, an increasingly competitive streaming market has reduced the value of what little data is made available. To put it another way, Amazon, Warner Bros Discovery, Paramount Global, and Disney’s ongoing refusal to publicize audience data limits the conclusions that can be drawn from the data that Netflix does publicize. Third, in spite of being partial and fragmentary, the data published in Netflix’s Top 10 lists does provide scholars with new and substantial opportunities to deepen our understanding of contemporary audiences and the global flow of television/video content. As this article begins to illustrate, the self-serving corporate reality of Netflix’s publicized audience data need not deter scholars from taking such data seriously regarding its implications for concepts long central to making sense of television content and audiences.
Footnotes
Declaration of conflicting interests
The author(s) declared no potential conflicts of interest with respect to the research, authorship, and/or publication of this article.
Funding
The author(s) received no financial support for the research, authorship, and/or publication of this article.