
Abstract
Researchers frequently rely on expert surveys to acquire information about political ideology and political parties, which they then use to explore a range of political phenomena such as proximity voting and satisfaction with democracy. Yet it is unclear whether experts and citizens place the parties similarly, which may have important implications for studies that rely on expert data. To what extent do citizens share expert views regarding political party placements? Using original data from Canada, we use multidimensional scaling techniques to examine and compare the responses of academic and journalist experts against a random sample of Canadians to a range of party placement questions. Our results suggest there is considerable variation between citizens and experts, and among specific subgroups of the general population. These findings have important implications for studies of party competition, voting behavior, and government responsiveness.
Introduction
In any given election, many political parties position themselves strategically along the most salient issue spaces to maximize vote share (Downs 1957) and so researchers have developed several tools and datasets to measure how parties position themselves when they compete for votes (Carroll and Kubo 2021; Marks et al. 2007; Rheault and Cochrane 2020). One of the most popular ways of measuring party positioning has been expert surveys (Bakker et al. 2018; Martínez-Gallardo et al. 2022; Rohrschneider and Whitefield 2012), which have been used to investigate the dimensions of party competition across time and space. While these survey data are valuable, one potential drawback is that they rely exclusively on expert opinion. If expert and citizen opinions diverge, then relying on expert surveys alone could be problematic for some analyses of vote choice and party competition. Studies of proximity voting (Rohrschneider and Whitefield 2012; Rosset and Kurella 2021), for instance, rely on experts to “correctly” place the parties before calculating the distances between the parties and voters to determine whether voters chose the correct party that matches with their preferences. Yet it may be that some groups of citizens do not place the parties in the same positions as the experts do, and so spatial models that do not consider this possibility may be missing an important part of the story. A similar problem may face studies of democratic satisfaction (Stecker and Tausendpfund 2016), which also rely on calculating the distance between parties (as determined by experts) and voters to explain varying feelings of democratic satisfaction.
To what extent are citizen and expert party placements similar to each other? We answer this question by drawing upon original data collected from identical surveys modelled on the Chapel Hill Expert Survey and administered to Canadian experts and citizens in early 2022. Our findings suggest that a single left-right dimension seems to underpin political party competition in Canada and most importantly, that there is significant heterogeneity between citizens and experts. We also find that there is significant heterogeneity among citizens themselves with respect to how they place the parties, with age, gender and education structuring the variation in important ways.
Our paper is organized as follows. It begins by surveying the literature on party competition and the differences between experts and citizens in terms of their ability to collect, evaluate, and use relevant information to analyze political phenomena. We then describe our data, methods, and results before concluding with a discussion of how future researchers might benefit from taking into account the differences between experts and citizens in their analyses of party competition, vote choice, and democratic satisfaction.
Identifying the Dimensions of Party Competition
The spatial model of voting (Downs 1957) presumes that citizens will vote for whichever party is closest to them in a political space. For simplicity, many choose to think about this phenomenon in terms of a single left-right, liberal-conservative dimension and so a variety of studies have spent considerable time exploring what “left” and “right” mean across time and space (Cochrane 2015; Joshi 2021; Lewis 2021).
Political competition, however, need not be, and is often not, unidimensional. While a left-right dimension is clearly present and influential across many countries, party competition is also frequently structured by linguistic, ethnic, and regional axes. In Europe, studies have found that three dimensions underpin variation in party-voter congruence and vote switching across 24 countries (Bakker et al. 2018). In Canada, Godbout and Høylund (2011) and others (Johnston 2017) argue that party competition is structured mainly along two dimensions, whereas Cochrane (2015) suggests that the left-right dimension is complicated by the existence of “one left” and “multiple rights.” In the United States, scholars argue that most political conflicts are reducible to one single left-right dimension: liberal versus conservative (Bakker et al. 2018: 268; Poole 2005).
Identifying these dimensions is often done by assessing the political parties in a country using expert placements. The Chapel Hill Expert Survey (Jolly et al. 2022) has, since 1999, used information from experts (political scientists) to estimate where parties stand on a range of issues. While certain types of parties, such as extreme parties, can be more difficult for experts to reliably place (Marks et al. 2007), most studies have found that CHES party placements by experts are valid and robust across European and Latin American contexts (Jolly et al. 2022; Martínez-Gallardo et al. 2022). Bakker et al. (2022), for instance, have found that European parties can be reliably placed along three dimensions: an economic left/right, a social left/right, and pro/anti-European integration. Similarly, Martínez-Gallardo et al. (2022: 10), drawing upon data from the 2020 Chapel Hill Expert Survey-Latin America, find that “Latin American parties organize along ideological lines” and that “ideological structuring is mostly explained by a single dimension that largely revolves around the economy.” Political competition is therefore not the same in all societies, and expert survey data can help researchers identify the situation in each country. 1
Citizens Compared to Experts
While the views of experts are informative for understanding what most parties are offering to voters in terms of policies and priorities, they cannot tell us whether voters see the parties’ stances the same way. Existing research offers mixed evidence for whether experts and citizens offer similar assessments of various political phenomena. Charron (2016), for instance, finds that “citizen and expert perceptions of corruption” are quite similar across 24 European countries. In contrast, Walgrave et al. (2022) find that politicians are not very good at estimating the policy preferences of the general public or their own partisan electorate, even though substantive representation is one of the core responsibilities of most elected representatives.
Given these mixed results, what differentiates an expert from a non-expert? Some argue that “experts are those within a given domain who ‘have more beliefs (or high degrees of belief) in true propositions and/or fewer beliefs in false propositions within that domain than most people do (or better: than the vast majority of people do)” (Goldman 2001: 91). Experts are thought to possess more information and more accurate information and can deploy that information effectively to address problems. Where their information comes from, whether through formal training or practical experience, matters less than simply having access to non-trivial amounts of accurate information, relative to non-experts.
Given these considerations, it is important to consider where voters (as non-experts) get their information from, and the quality of that information. In the context of party politics, most voters rely on information shortcuts and cues to make sense of party competition (Achen and Bartels 2017). Such shortcuts are plentiful, including social networks, partisanship, and economic conditions, among others (Arceneaux 2008; Bischof and Senninger 2018).
Cues can also be mediated by different institutional configurations, which can lead to individual- and system-level variation in perceptions. Otjes (2018), for example, finds that the degree to which the economic preferences of citizens fit with a left-right dimension varies by individual and system-level features. One of these features is attention paid to politicians whose own views fit on a left-right dimension. Similarly, Fortunato et al. (2016) demonstrate that citizen understanding of left-right party positions can depend on how useful the notion of left and right is for helping them to understand politics. Using data from the Comparative Study of Electoral Systems (CSES) and the European Election Study (EES), they find that left-right knowledge is related to how well the terms indicate coalition composition, but not policy positions.
Parties themselves also send signals about their stances. Busch (2016) investigates how well voters can perceive party ideologies, in relation to party manifestos (using Comparative Manifesto data). She finds that voters are not less able to identify party ideological positions after parties shift their stances, and in fact can have increased accuracy if the change is on economic issues only. However, there is a limit to how well voters can correctly perceive changes in party competition. If multiple parties change positions, then the capacity of voters to accurately identify those changes is limited. Fortunato et al. (2016) also find that voters are better at identifying the placement of parties when the parties are ideologically distinct, and Vegetti et al. (2017) echo that, looking at similarity to experts in situations of polarization.
An alternative perspective is that what really matters is not the amount of information that an individual has at their disposal, but whether they can choose the correct information to apply towards the problem or issue at hand. According to Shanteau (1992: 82), “What separates the expert from the novice, in my view, is the ability to discriminate what is diagnostic from what is not. Both experts and novices know how to recognize and make use of multiple sources of information. What novices lack is the experience or ability to separate relevant from irrelevant information sources. Thus, it is the type of information used - relevant versus irrelevant - that distinguishes between experts and others.”
As a result, one might expect that, relative to experts, the average citizen will be less likely to correctly ascribe party positions and to correctly evaluate government performance (Kennedy et al. 2022). This expectation is based upon the research noted above - that experts are more likely to choose and prioritize relevant information when mobilizing their knowledge to complete a task (Holst and Molander 2019) - and that citizens may be responding to a host of potentially conflicting, misleading, or confusing information sources.
If this expectation regarding citizen and expert divergence holds true with respect to party placements, then relying on expert assessments alone may not be enough for understanding party competition, party behavior, and vote choice. As well, if voter assessments are unreliable, then at least some of the electorate may be supporting the wrong parties for the wrong reasons. This assumption has important implications for how well parties can represent those who voted for them. It could also mean that some individuals are voting according to their interests, or “voting correctly” (Lau and Redlawsk 1997), to different (and perhaps less obvious) extents.
In the next sections of the paper, we evaluate whether citizens in one advanced democratic context, Canada, perceive parties in the same way that experts do. We also explore whether there is systematic variation in how subgroups of citizens perceive the parties. Before turning to these tasks, we briefly provide some pertinent information about the parties and the Canadian party system.
The Canadian Party System
Canada has long had a multi-party system, but it has not been stable. This feature makes the case particularly interesting because, as noted above, shifts in multiple party positions can complicate perceptions. The term “party system” is meant to describe the distinct pattern of party competition that exists in a country. Classic works on comparative party systems usually focus on two main characteristics: “(1) the number of relevant parties, and (2) the degree of fragmentation in the system” (Koop and Bittner 2013: 309). Since its founding in 1867, Canada has had five party systems, distinct not only in terms of the previously stated criteria, but also in terms of how the political parties framed their appeals, built their support bases, and organized their party structures. In the first system, Canada’s political parties (of which only two at the time, Liberal and Conservative, were competitive) relied heavily on patronage to win elections and build state capacity (Pilon 2017). In the second system, dating from the 1921 election, parties focused on establishing effective mechanisms for building and managing regional bases of support, especially as significant regional cleavages began to emerge. Smaller regional parties developed to address some of these interests (e.g. the Progressives, Social Credit, and Co-operative Commonwealth Federation) but they did not enjoy the same success as the Liberals and Conservatives. The third system, coinciding with the establishment of the New Democratic Party (NDP) in 1963, saw political parties modernize their organizational structures and party leaders seek direct connections with the electorate rather than working through regional brokers. During this period especially, the differences between the Liberals and Conservatives were often blurred as they fought to appeal to the same electorate. The beginning of the fourth system is more contested, but some authors point to the dramatic election of 1993 as the turning point, when the number of competitive parties went from two and half parties to five and regional issues once again became prominent (Walchuk 2012). In that election, the previous majority Conservative government was reduced to only two seats in the House of Commons and the Bloc Quebecois, a separatist party that only competed in Quebec, narrowly became the Official Opposition ahead of the populist Reform Party that competed exclusively in Western Canada.
The fifth party system, which remains in effect as of 2023, is characterized by a return to a smaller number of competitive parties. It emerged after the merger of the centre-right Progressive Conservative and right-wing Canadian Alliance parties in 2003 (Walchuk 2012). This system includes the Liberal Party of Canada, typically focused on brokerage and centrist policies; a centre-right-wing Conservative Party of Canada; and a left-wing New Democratic Party of Canada (Johnston 2017; Koop and Bittner 2013). Despite all the changes over the years, only the Liberals and Conservatives have ever formed the government.
Party competition in Canada today is much less focused on regional and nationalist concerns (such as Western alienation and Quebec separatism) than it has been in the past, and more focused on ideological differences. The nature of the competitive minor parties in this system, all of which attract less than 5% of the vote, reflect these trends: the Green Party of Canada is focused primarily on environmental issues and the People’s Party of Canada (PPC; part of the landscape since 2019) styles itself as a populist, right-wing party. Indeed, recent studies suggest that “ideological consistency has increased” in recent years (Gidengil 2022) and polarization among the parties, not a usual feature of Canadian politics, has grown larger (Johnston 2014).
There have been few studies of the ideological dimensions of party competition in Canada, and none (to the best of our knowledge) about the current party system. Carroll and Kubo (2021) conducted a comparative study using CSES data to investigate the complexity of left-right perceptions, which simplifies down to how well a single dimension can explain left-right perceptions. Their analysis of Canadian data from 1997 reveals that Canada was among the most complex systems, but that the result was largely driven by the regional parties in the fourth party system. Choma et al. (2010) looked at the attitudes of candidates in the 2006 election (in their view, politically sophisticated individuals) and found that a two-dimensional space, with moderately correlated economic left-right and social left-right dimensions, best explained the patterns in the data. This finding corresponded to their expectations that sophisticates would have more complex structures to their views beyond a single left-right dimension. Given the lack of more current and more party-focused data, it is an open question of how many dimensions structure political competition in Canada today and whether citizens understand those dimensions in the same way as experts.
Data and Methods
We draw upon unique surveys of Canadian political scientists (n = 149), journalists (n = 16) and citizens (n = 1522) for our analysis. 2 The surveys were based upon the CHES expert survey questions, with modifications to fit the Canadian context, and data were gathered from January to April 2022. Unlike the CHES project, we included journalists in our expert group to expand the range and because we were curious as to whether their perceptions would match those of academics. In the analyses below we collapse the expert groups together as our analyses revealed no differences between the groups (see Appendix A1).
The surveys presented identical versions of questions about multiple dimensions of politics. Respondents were asked to place each of the political parties (Liberal, Conservative, New Democratic Party, Green, Bloc Quebecois, and People’s Party of Canada) on a 0–10 scale for each of the following dimensions: general left-right; economic left-right; libertarian/postmaterialist versus traditional/authoritarian; public services versus reducing taxes; market deregulations; wealth redistribution; civil liberties versus law and order; social lifestyles; immigration policy; environmental protection; international security and peacekeeping missions; rights for ethnic minorities; and rights for Indigenous peoples. The anchors at each end of the scales indicated extreme positions on the policy or issue in question. Respondents were also asked to indicate the importance of the economic left-right and libertarian/postmaterialist versus traditional/authoritarian dimensions to the public stance of each party. We then presented them with a list of issues and asked which were the first, second and third most important over the previous year. The list of issues includes anti-elite rhetoric; civil liberties; corruption; decentralization; deregulation; environment; ethnic minorities; immigration; international security; multiculturalism; nationalism; public services versus taxes; redistribution; religious principles; social lifestyle; state intervention; urban versus rural; Aboriginal rights; and health care. Finally, we gathered some basic demographics about each respondent.
We restrict our sample to those who were able to place at least three parties on all 10 issues (though they need not be the same three parties on each issue). This is required because the underlying algorithm estimates a linear mapping of the individual’s party placements on the estimated true party placements. To be able to evaluate consistency with the underlying dimension, we need at least three points because any two points will fit perfectly. This is not a problem for our data as most people are able to place the NDP, Liberals and Conservatives across a wide array of issues. Appendix 3 provides more information about which observations remain in and out of the sample.
Empirically, we have two objectives: to evaluate the dimensionality of the Canadian party system for experts and citizens and to investigate differences and heterogeneity in those perceptions. To address these goals, we used all but the general left-right; economic left-right; and libertarian/postmaterialist versus traditional/authoritarian issue placements in the dataset. Our analysis of dimensionality reveals that the perceived differences between parties are well-represented by a single dimension for both experts and citizens.
To investigate differences and heterogeneity, we followed a multi-step process to map the parties in space. First, we subjected each of the 10 issues to a basic space scaling analysis to generate party placements that are purged of differential item functioning (DIF) (Armstrong et al., 2021).
3
By estimating the linear mapping of “true” ideal points to individual idiosyncratic evaluations, the effect of perceptual differences of the scale is eliminated. This model assumes a matrix of inputs
From
The results of our analysis are the
To produce measures of uncertainty for the placements, we followed the general procedure outlined by Jacoby and Armstrong (2014). We generated bootstrap datasets of individual perceptions and subjected those bootstrapped datasets to a basic space scaling analysis and then the DIF corrected placements to an MDS. We then use a Procrustes rotation to put the estimated bootstrap configuration into maximum geometric similarity with the configuration matrix estimated from the original data (thus placing them on the same scale, as much as possible). In a single dimension, the Procrustes rotation can be calculated with a linear model. For example, consider the placements
We applied this procedure to the expert and citizen datasets, comparing the two to identify differences. Turning to our analysis of individual-level heterogeneity, we treat the 165 experts (journalists and academics) as a single group (see Appendix A1), but we identify different groupings of citizen respondents for analysis. We focus on demographics to divide the data for our examination of citizen heterogeneity. For education, we divide the sample into three categories (Low, Middle and High), corresponding to high school or less, post-secondary not culminating in a university degree, and those with a university degree or more, respectively. For age we divide the sample into three groups: 18–44, 45–64 and 65+. We treat gender in a binary fashion using those who identify as men or women. 5 We then compared the party placements of each of these groups to the experts.
Results
Dimensionality and Citizen-Expert Comparison
Using the DIF corrected party placements on the 10 issues identified above, we estimate MDS solutions with dimensionality from one to five. We use the estimated point configurations to calculate the predicted inter-point distances between the parties. Next, we calculate the squared correlation between the estimated distances and the true distances between the party placements. For citizens, the squared correlation between the predicted and observed inter-point distances for a one-dimensional solution is around .997, and 0.976 for the experts. Additional dimensions beyond the first add very little, thus we conclude that the underlying structure of the data is unidimensional. 6
Having established that a single dimension adequately reproduces the inter-point distances, we can investigate the complexion of the estimated dimension. Figure 1 shows the unidimensional mapping of parties for experts versus citizens. Clearly, experts see all parties as occupying a distinct space on this single summary dimension. Given the established validity of expert placements, we take this result to be a good estimate of the “true” placements of the parties in ideological space. Expert and citizen placements, 10-item scale.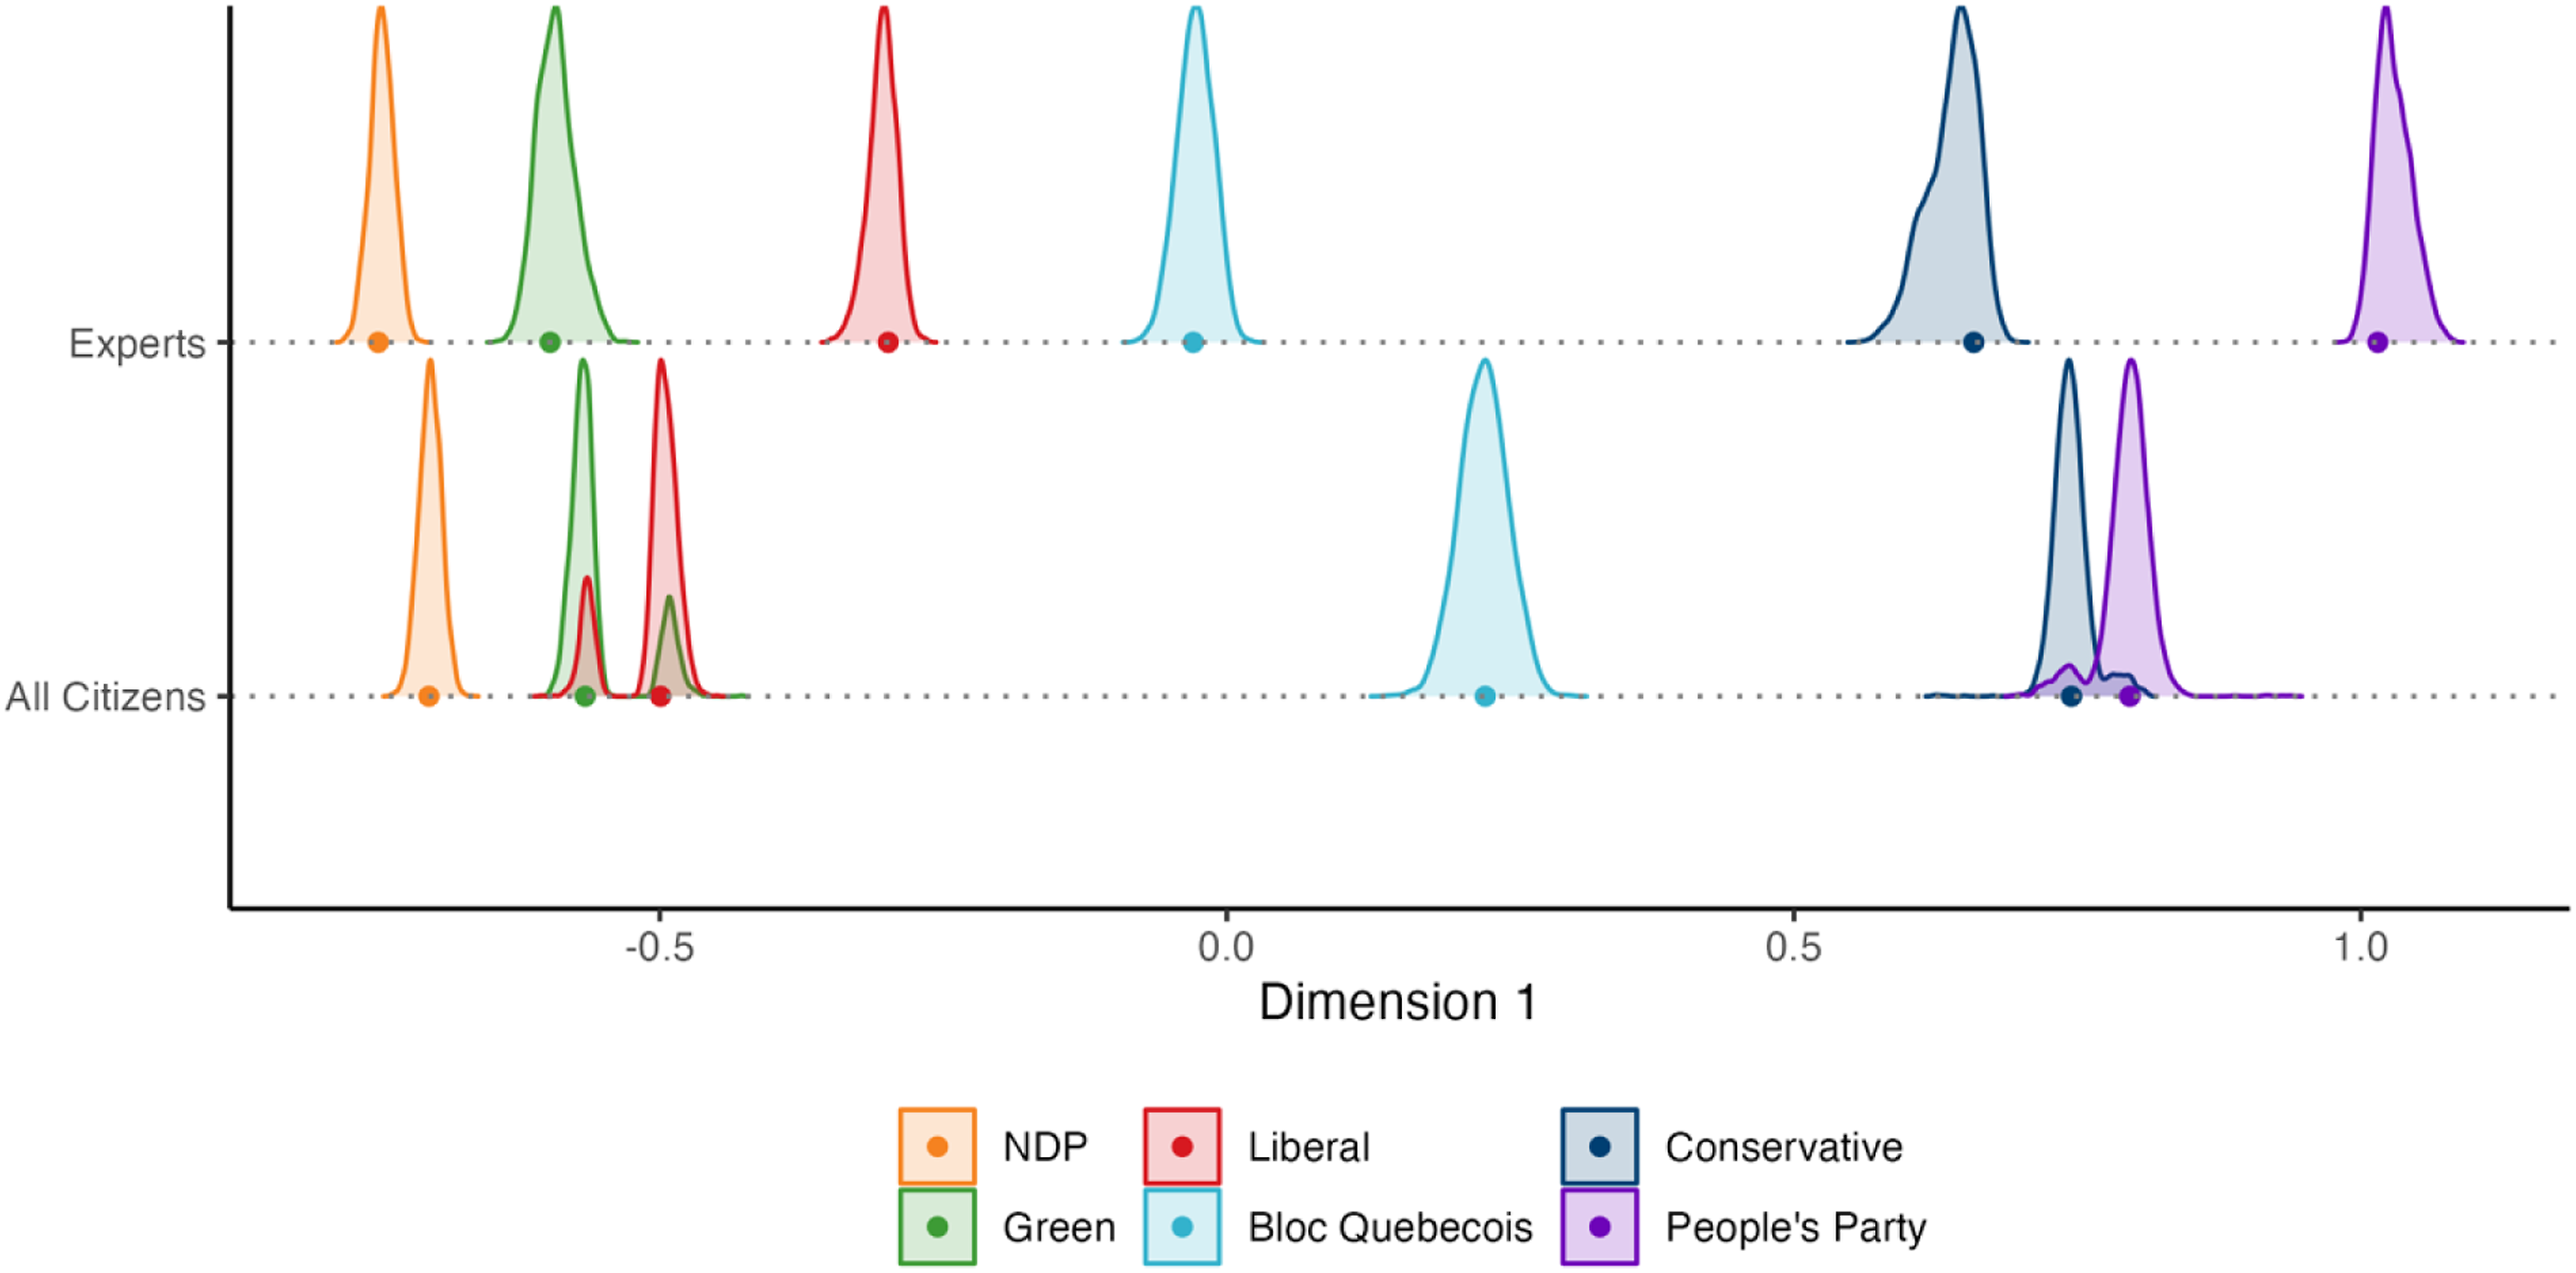
Turning to the citizen mapping, a single dimension also emerges from the data. However, we do not observe the same distinct placements of the parties by citizens. There are clusters of parties on each end: New Democratic Party (NDP), Liberal and Green on one end and Conservative and People’s Party of Canada (PPC) on the other, with a single party (the Bloc Quebecois or BQ) in the middle.
More interesting is that the distributions for four of the parties – Liberal, NDP, Conservative, and PPC – are distinctly bimodal, suggesting disagreement about the NDP-Liberal and Conservative-PPC pairs. Figure 2 shows the bivariate density plots of the Liberal-Green pair on the left and the Conservative-PPC pair on the right. In roughly 20% of the bootstrap samples, the Greens are to the right on the Liberals; the Conservatives are to the right of the PPC in about 7% of the bootstrap samples. This pattern suggests that citizens’ perceptions of these parties are heterogeneous and so including or excluding groups of observations (as the bootstrapping algorithm does) can result in different orderings of the parties on the main dimension. The bi-modal distribution is an indicator of important within-group heterogeneity. The presence of these bimodal distributions does not invalidate the bootstrapping procedure for understanding variability in the responses, but it does point to uncaptured heterogeneity that requires further investigation. Two dimensional density plots of bimodal parties.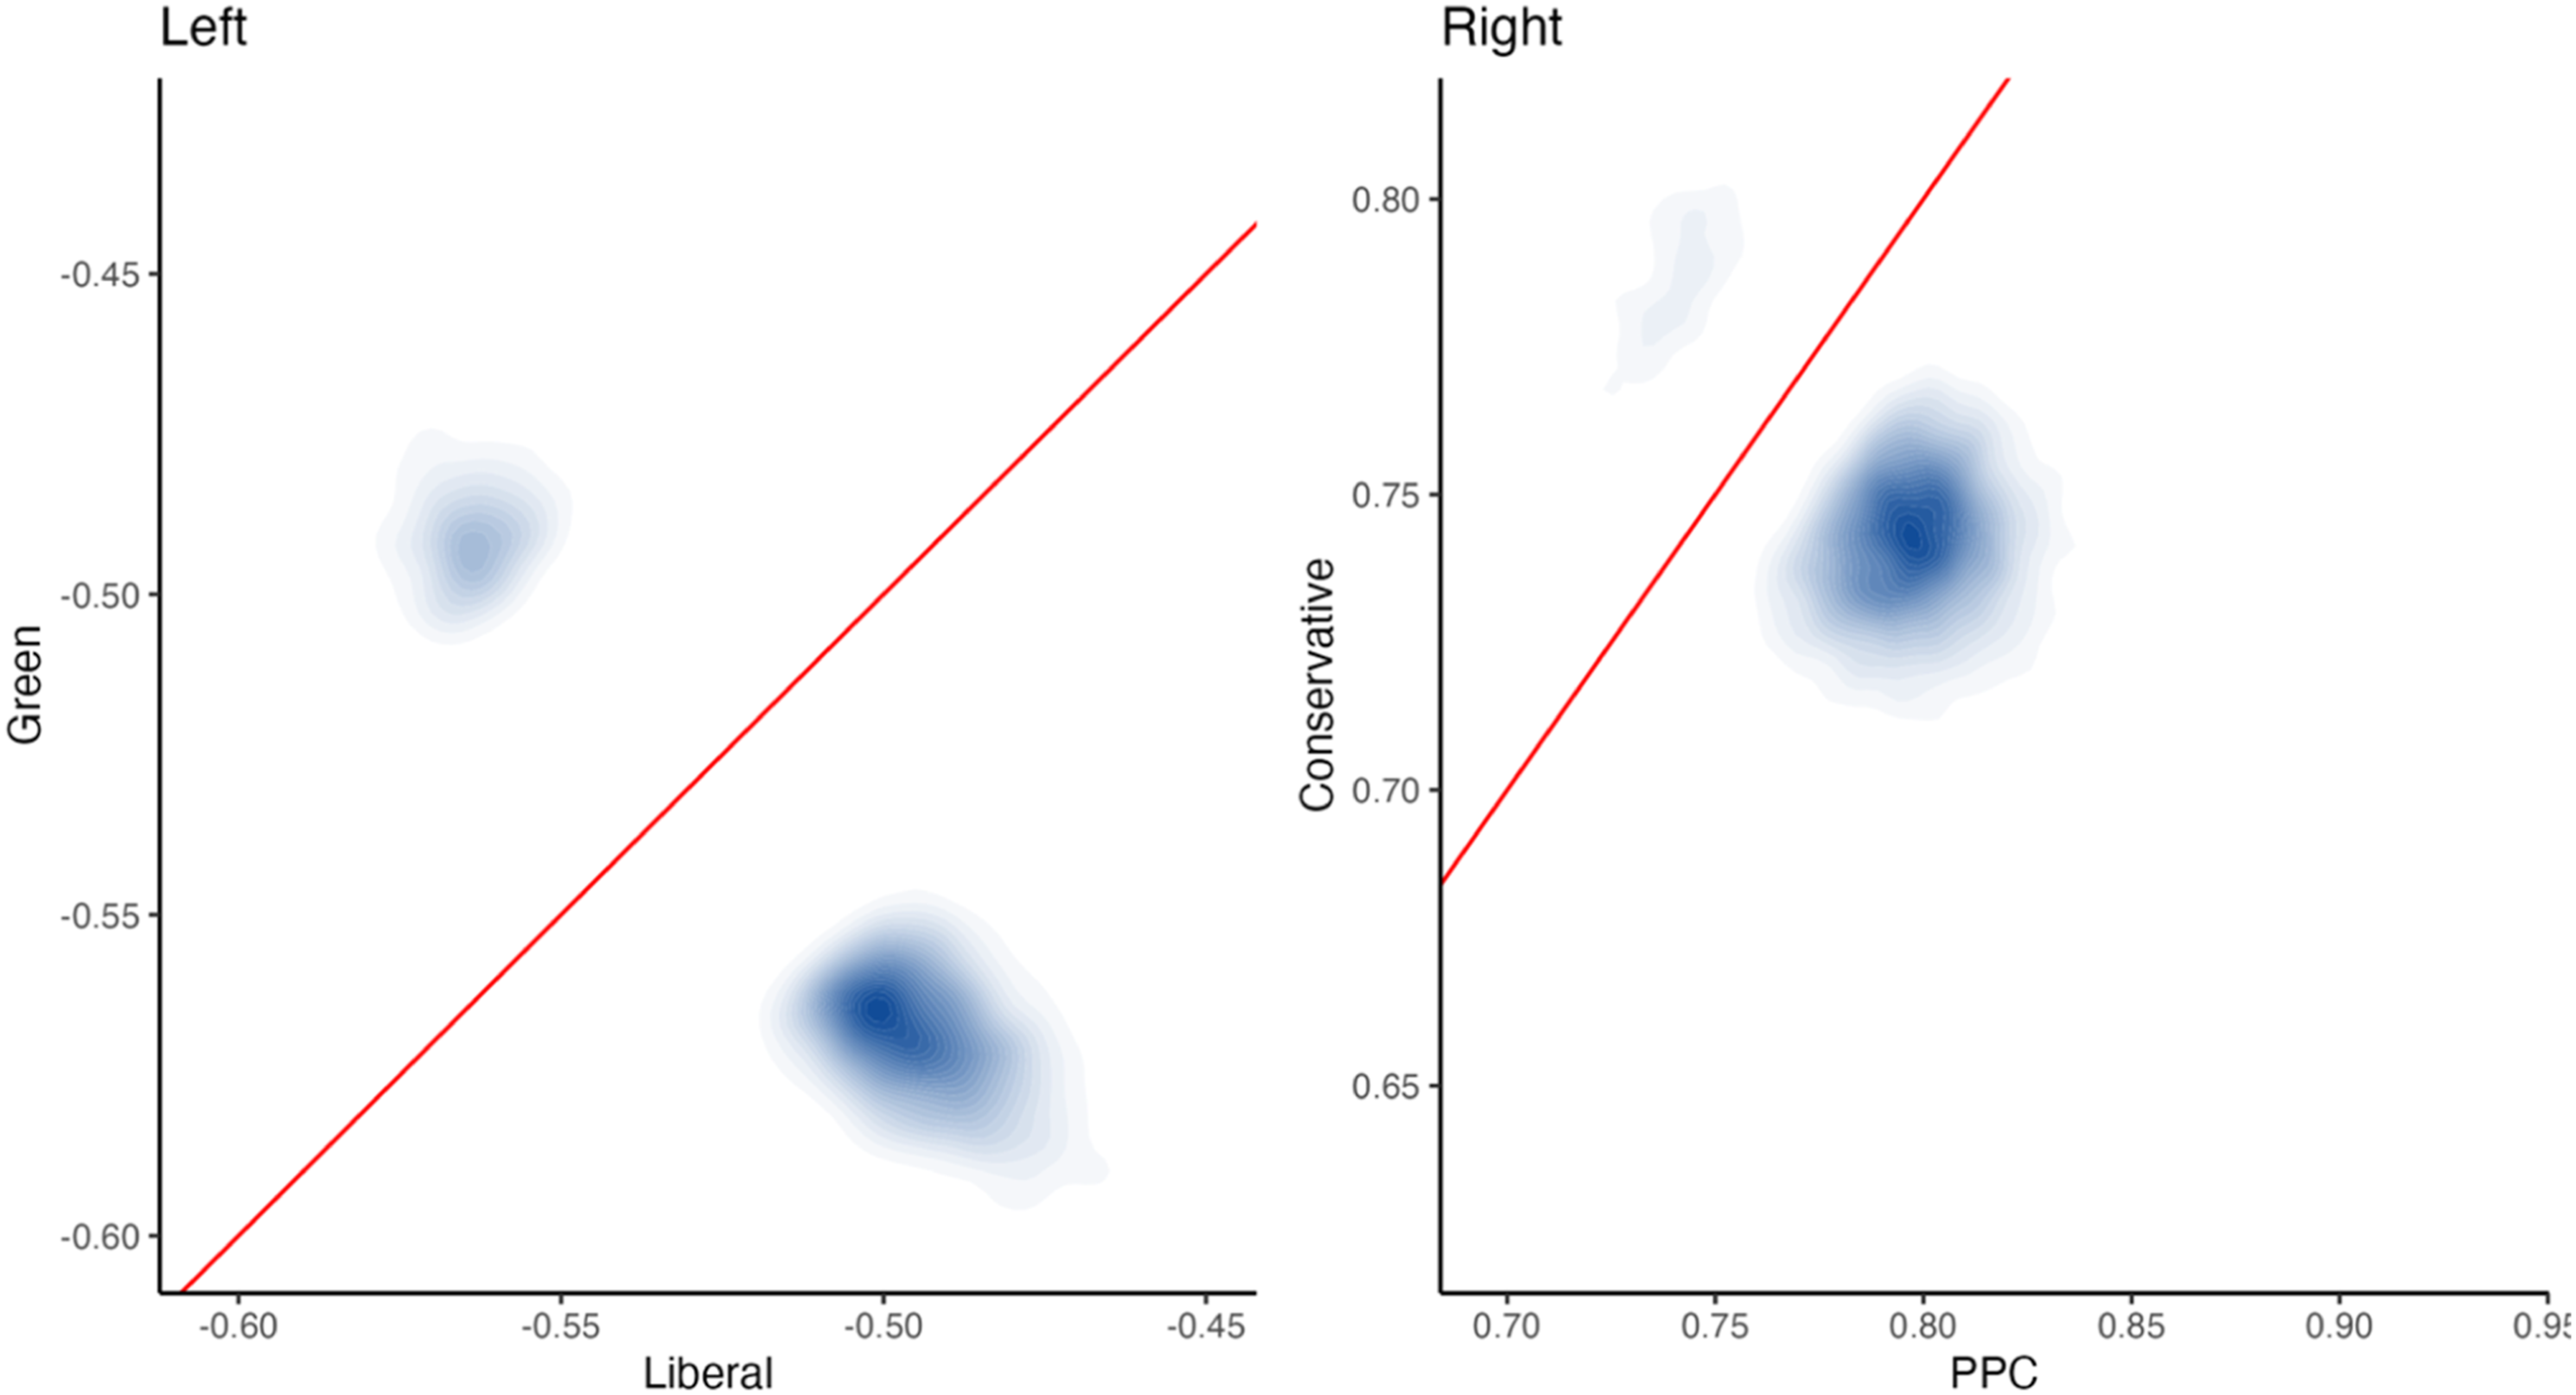
Heterogeneity
We suspect that the heterogeneity identified above may correspond with systematic differences between individuals. To investigate this proposition, we compare the party placements on the 10-item scale for different groups of citizens relative to experts. All the results discussed below are displayed in Figure 3. Within each set of groups (gender, age, education, ideology) the rows are ordered in terms of similarity to experts measured by the squared correlation of expert inter-point distances and group-based placement inter-point distances; these are indicated in parentheses next to the group label. Estimated Party Placements by Groups, 10-item scale.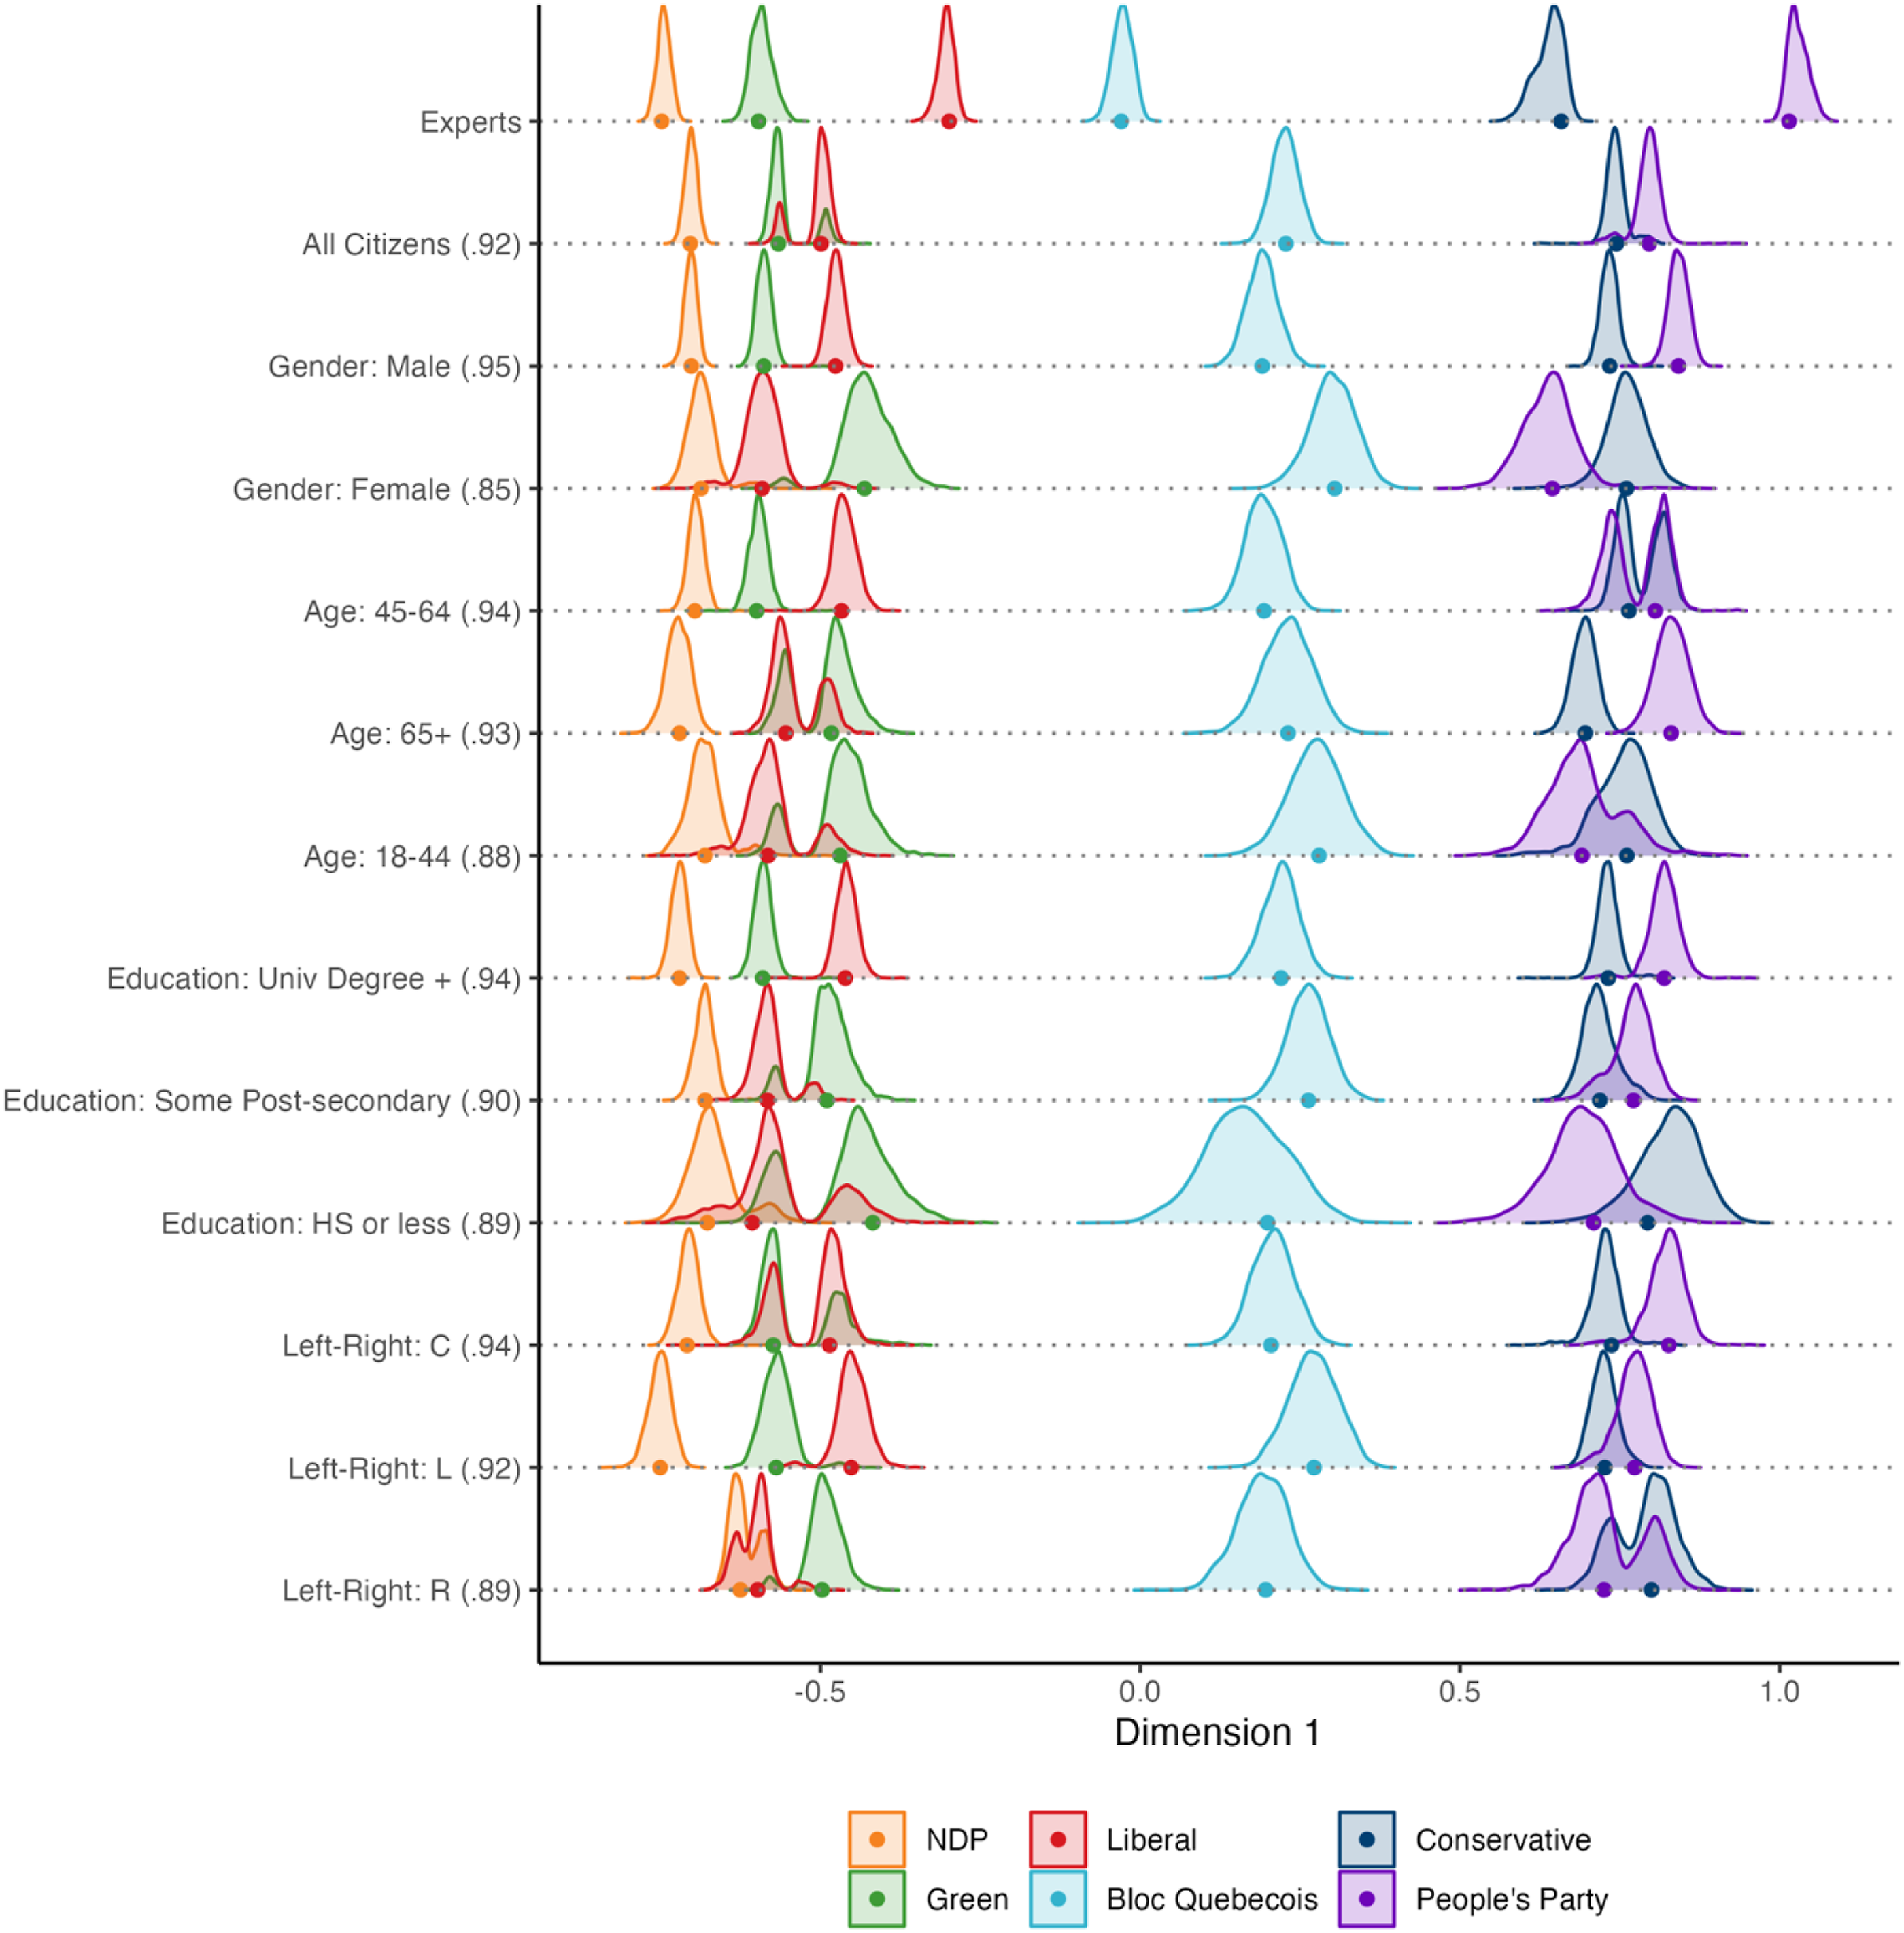
We begin with gender. Verba, Burns and Schlozman (1997) and Gidengil et al. (2008), among others (Mehravar et al. 2023; Solt 2008), have documented a very clear gender gap when it comes to political information. This gap is likely due to gendered differences in terms of political interest, resources, and political priorities. Given these findings, we expect that women’s party placements (relative to men) will be less similar to expert party placements. Figure 3 (rows three and 4) confirm this expectation. Women’s party perceptions are substantially less precise than those of men and experts. 7 Women see the Liberals to the left of the Greens and the Conservatives to the right of the People’s Party – both pairs in reverse order relative to the experts (and male citizens). These gendered party placements are interesting given existing research that finds women are more likely to support left-leaning parties (Anderson and Stephenson 2010: 18) and are more focused on social issues (Gidengil 1995; Mehravar et al. 2023), both of which experts and men seem to associate with the NDP rather than the Liberals. Also of interest, men and women place the Bloc Quebecois right of centre, whereas the experts place them to the left. Finally, the distributions for women are universally wider than they are for men. We calculated the median absolute deviation (MAD) for each party’s placement based on the bootstrap values. The MADs for women are between 1.5 and 2.9 times as big as those for the men.
Moving to age, we expect that those who are older are likely to be more familiar with political parties due to life cycle effects. Jennings (1996), for instance, finds that as people age, they tend to lose factual/textbook knowledge about the mechanics of governments but gain knowledge about current events relative to younger citizens. Smets (2021: 290) and others (Dassonneville 2016) find that the relationship between age and turnout is curvilinear, with turnout increasing until about age 60, at which point it levels off and then drops around age 70, at least among citizens in Western democracies. Given their increased political knowledge and participation, we expect older individuals to be more likely to perceive the parties’ ‘true’ positions relative to younger individuals.
The results in Figure 3 (rows 5–7) indicate that this expectation is partially substantiated. Older individuals (45 and up) tend to correspond more closely with the experts. Those 45–64, on average, have the same ordering as the experts. However, the distributions for the Conservatives and the PPC are bimodal – in only roughly 51% of the bootstrap samples is the PPC to the right of the Conservatives. This pattern indicates some confusion among middle-aged citizens about their relative placement. The oldest individuals in the sample (65+) reverse the ordering of the Liberals and Greens, on average, but the Liberal and Green distributions are bi-modal. In roughly 68% of the bootstrap samples, the Liberals are to the left of the Greens. Note that it is the 45–64 year-olds who actually have the most similarity to the experts, consistent with the literature about the curvilinear effect of age on political engagement. Like women, 18–44 year-olds place the Liberals to the left of the Greens and the Conservatives to the right of the PPC with slight bi-modality in both pairs of distributions.
We next consider education, which is a standard correlate of many measures of political activity, engagement, and information (Hillygus 2005; Persson 2015). Although the exact mechanism by which formal education contributes to political engagement is debated, education is nonetheless a useful demographic to examine because one might expect that the party placements of the most educated citizens will be most similar to the experts, given that political science experts generally have the highest levels of education. As shown in rows 8–10 of Figure 3, the results suggest that education does matter in terms of the extent to which citizen and expert party placements correspond. Those with high school or less and those with some post-secondary, for instance, place the Liberals to the left of the Greens. The least educated citizens also place the Conservatives to the right of the PPC, in contrast to the experts (and those with University degrees). Like males, University degree holders place all parties in an order that is consistent with the experts. In our sample, women are slightly less likely to have university degrees (44% vs 50% for men), but this difference is not big enough to account for the difference in placements. 8 Like age and gender, these findings suggest that education may be an important demographic characteristic underpinning some of the differences in expert and citizen placements.
Finally, we turn to left-right self-placement. A reasonable assumption is that individuals will have a stronger interest in parties closest to their self-placement relative to parties that are further away. This stronger interest should result in individuals expending more effort at distinguishing between the parties closest to them, relative to parties further away from their self-placement. This task may be complicated, however, by the number of parties that are thought to occupy the left, centre, and right and so we expect citizens to place parties on the left closer together relative to the experts. The results in the last three rows of Figure 3 show that our expectations are mostly correct. The experts place three of the parties on the left (the New Democratic Party, the Green Party, and the Liberals), one party very slightly left of centre (the Bloc Quebecois), and two of the parties on the right – the Conservatives and the People’s Party of Canada. In terms of whether citizen self-placement affects the placement of parties that are closer and further away from citizen self-placement, it seems that self-placement does help citizens somewhat approximate the expert placement of parties closest to them. Those on the left order the parties in the same way as experts (in general, though they seem to perceive only a slight difference between the PPC and Conservatives). Further, those on the left place more distance between the parties on the left than any other group. Those on the right see a great deal of similarity between the Liberals and NDP and see both parties to the left of the Greens. Further, the distance between the left parties is smallest for those who identify on the right indicating that they may perceive all left-wing parties to be ideological substitutes for each other. Those in the centre also get the ordering right, but bimodal distributions for the Greens and Liberals suggests that there is some confusion about their relative placement. While those on the left conform to our expectations, those in the centre and on the right do not.
Investigating demographic differences
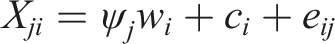
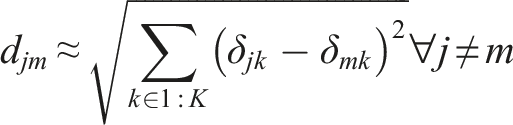
Given the demographic differences described above, we investigate further by analyzing the importance of each variable on party placement. To do so, we develop a measure of distance between each individual’s placement of the parties and the placements of the experts. First, we need to develop an individual party placement that corresponds with the one generated for the experts. For each individual, we define
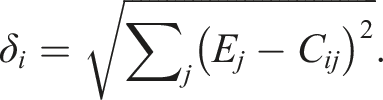
We then estimate an OLS model of Variable importance in predicting distance from experts.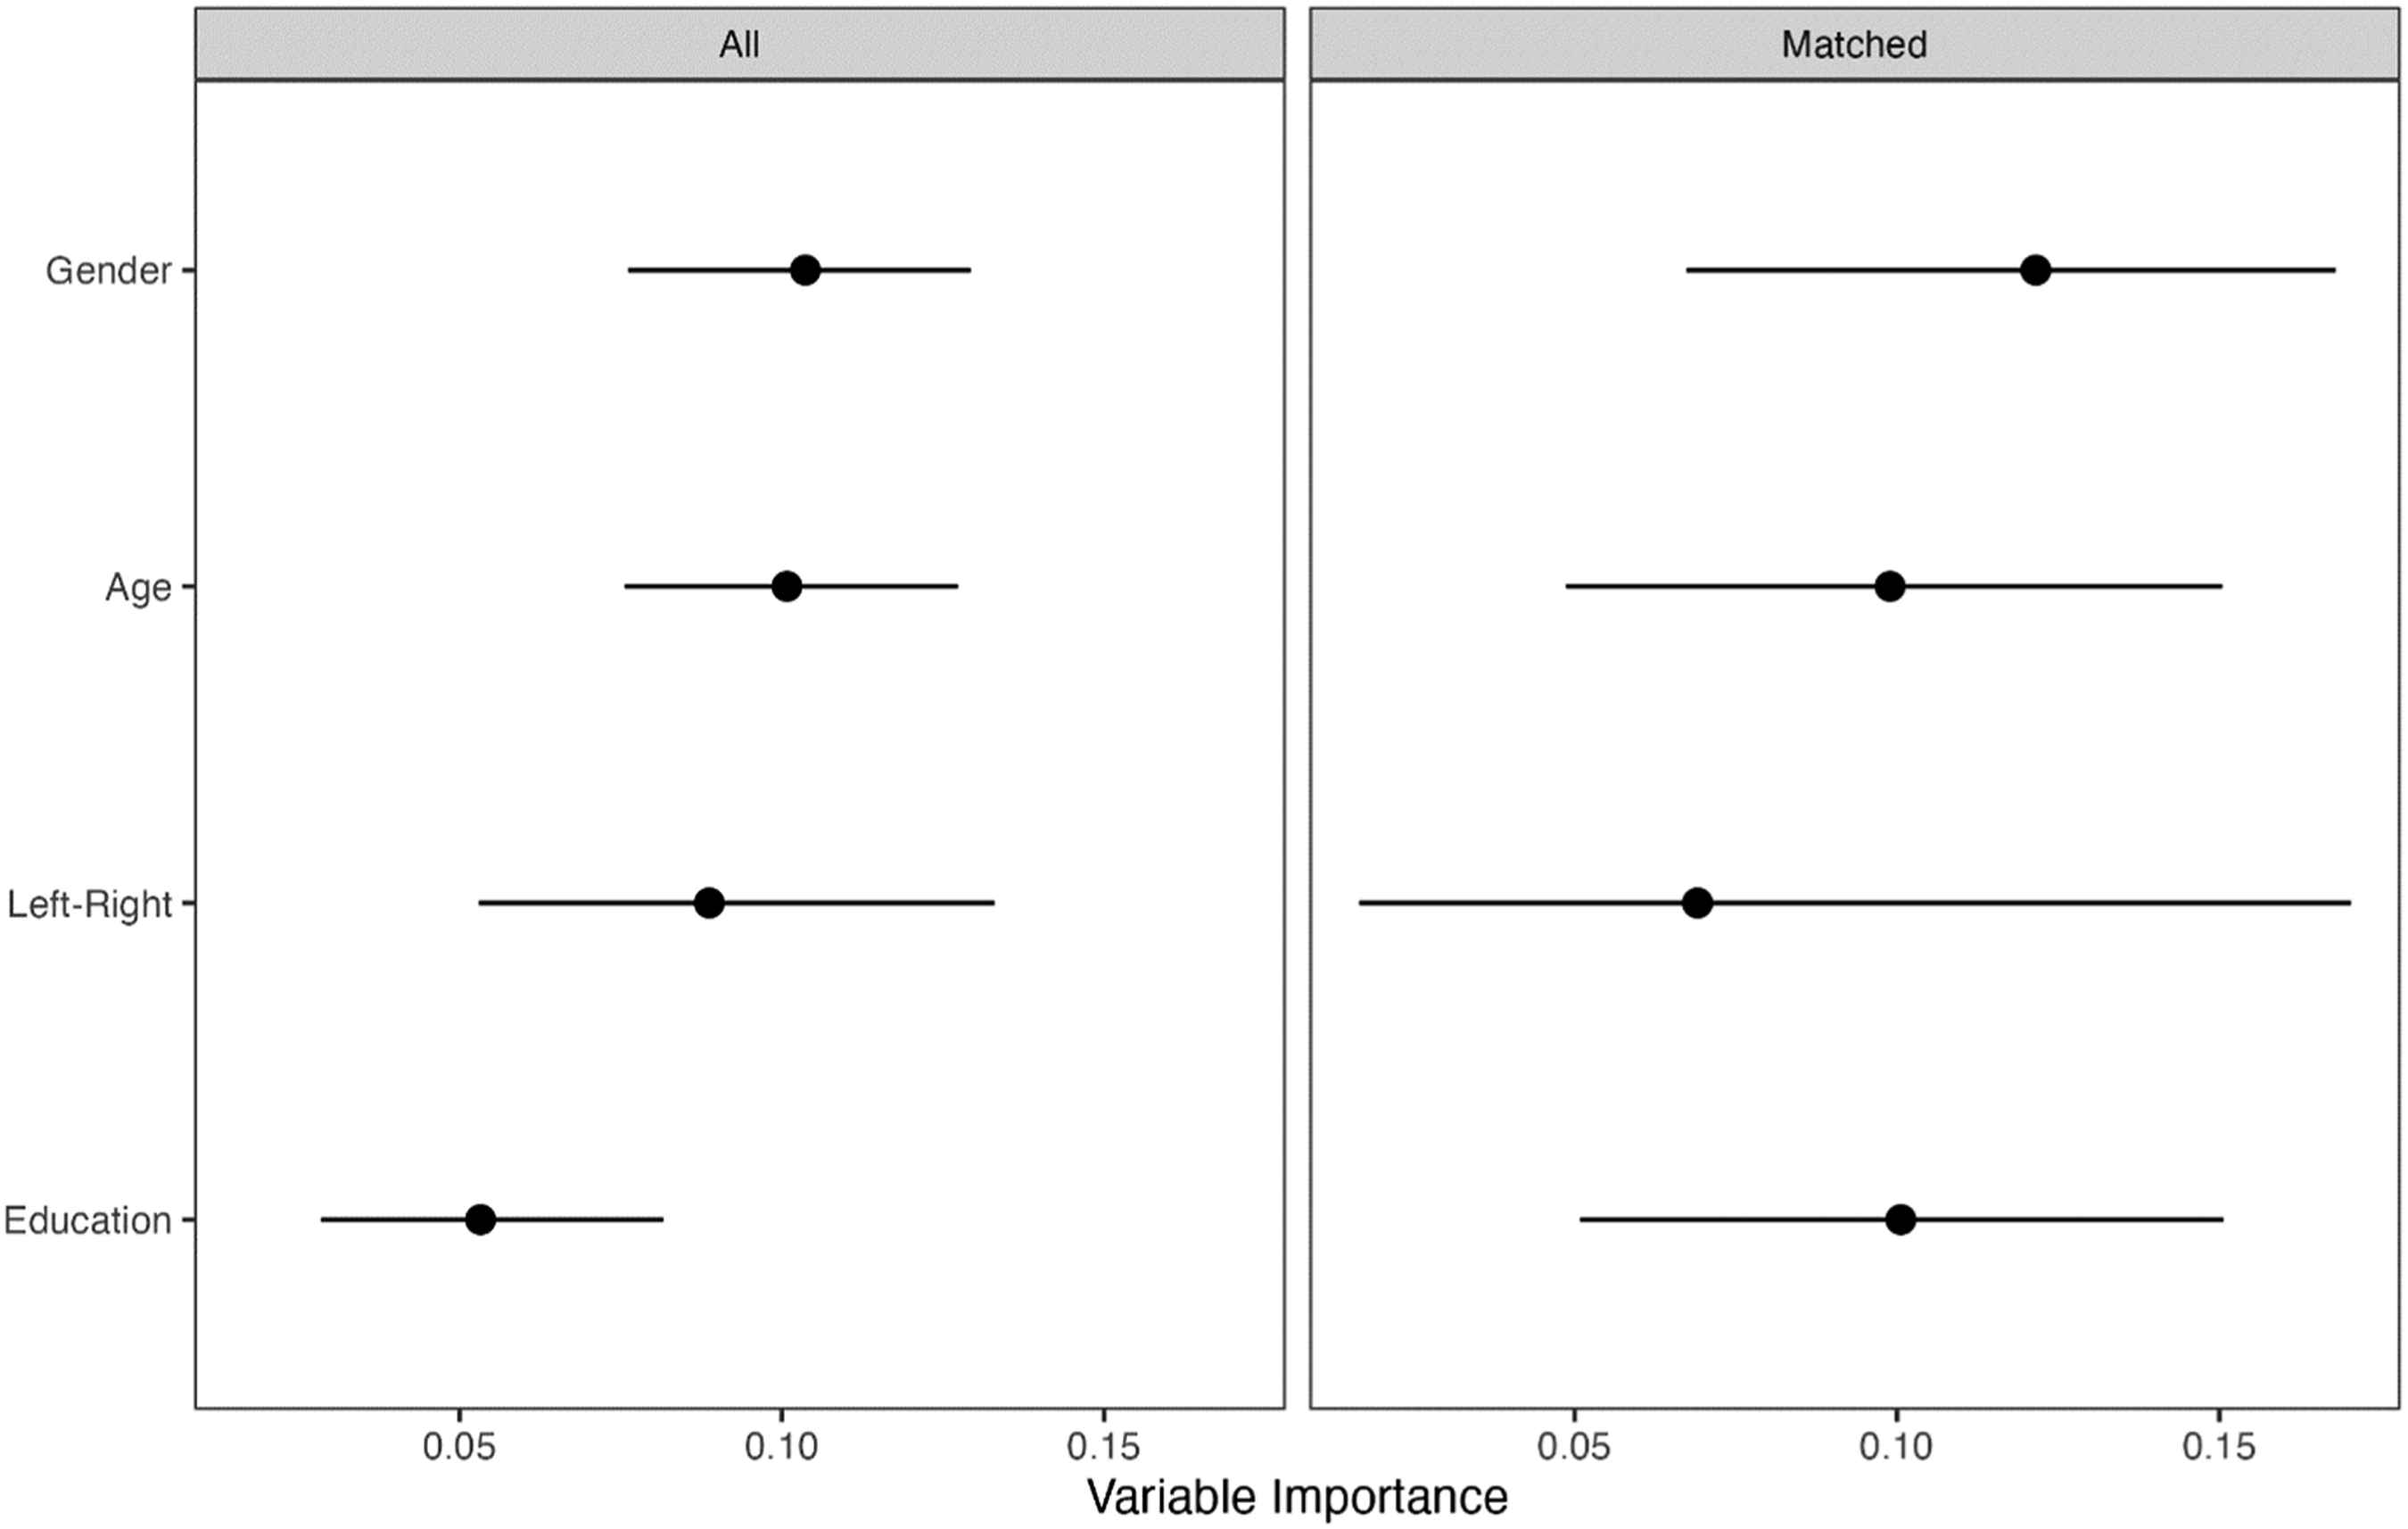
Does salience matter?
Our results show considerable variation in the predicted distances between citizen and expert placements. One possibility is that there is heterogeneity in the issues citizens perceive as salient to parties relative to experts. To control for this possibility, we looked at the responses to the questions that asked respondents to identify the most important issue for each party. We then coded the 19 potential responses into four broad groups: - National Identity: Nationalism, Indigenous rights, Decentralization, Anti-elite rhetoric, Corruption, and Urban versus rural - Economic: Public Services versus taxes, Deregulation, Redistribution, and State intervention - Social: Environment, Social lifestyle, Civil liberties, Religious principles, Health care, Immigration, Ethnic minorities, and Multiculturalism - International Security: There is a single issue for international security.
We identified a “salience profile” for each expert and citizen – the set of issues they identified as most important for each party. 12 We then identified all citizens who had a profile that was the same as at least one expert profile. To see whether the salience of issues accounts for the observed variation in our analyses, we re-estimated the model described above on just this subset of 237 citizens. The variable importance figures for this model are labeled as “Matched” in Figure. The results differ from the unmatched sample in that left-right self-placement is no longer significant. While the importance of gender and education have increased slightly, none of the values is significantly different from any other value. When additional controls for perceptions of what issues are salient for parties are included, we still observe heterogeneity in party placements by demographic and ideology groups.
Salience profiles and numbers of observations.
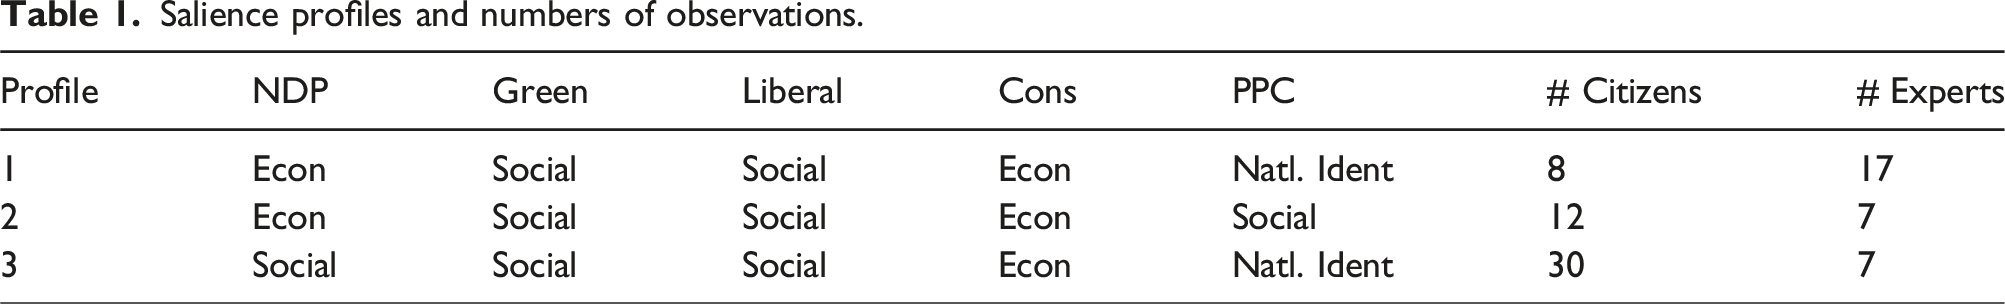
Using these observations, we estimate the bootstrapped basic space scaling on the individual issues and then the MDS on the resulting DIF-corrected placements, just as above. For profiles 2 and 3, the squared correlation between the expert and citizen inter-point distances looks a lot like the highest values in Figure 3 (.94 for both profile 2 and 3). The first profile, on the other hand, has a squared correlation of the inter-point distances of around 0.06. For this salience profile, citizens put the Liberals, Conservatives and NDP all at roughly the same left-of-center value. The Greens are far to the right and the PPC between the mainstream parties and the Greens, but still on the right. Compared to the second and third profiles, the first is older and less educated and slightly more ideological. Both analyses here suggest that salience may be an important factor in party placements, but in both cases, there are indications that salience is far from the whole story.
Since salience seems to have some bearing on correspondence with the experts, we also consider how demographic variables predict expert-like salience profiles. We generate a binary variable where 1 indicates that the citizen has a salience profile that is the same as at least one expert salience profile (0, otherwise). We then estimate a logistic regression using the demographic variables to predict expert-like salience profiles. We find that age and left-right self-placement are significant (education and gender are not). Older respondents (65+) have a probability of having an expert-like profile that is on average about .15 higher than the youngest respondents (18–44). Those on the ideological left have a probability of having an expert-like salience profile that is .16 higher than those on the ideological right. Both differences are statistically significant. Interestingly, gender, which exhibited one of the biggest effects in the analysis above, is not significant here. 13 These results demonstrate that citizens who have expert-like salience profiles are systematically different from those who do not, but not in such a way that would explain all the results above.
Consistency across individual issues
The analysis above was a multi-step process and we did little to investigate the results of the auxiliary basic space scaling analysis. Perhaps those results can help explain the observed differences across groups. In particular, does the same pattern of citizen-expert similarity emerge if we look at the individual issues? We calculate the squared correlation between each of the 10 sets of DIF-corrected issue positions for each demographic group and the expert DIF-corrected issue positions. We then calculate the group’s rank regarding correspondence with the experts. If results were consistent across all issues, then every group would have the same rank on every issue. Figure 5 shows the bar plot of ranking for each group across the 10 issues. A value of one indicates the group with the closest correspondence to the experts and a value of 11 the least correspondence. Values are ordered by demographic variable and within variable from bottom to top by average rank. Correspondence of citizens and Expert placements by group and issue.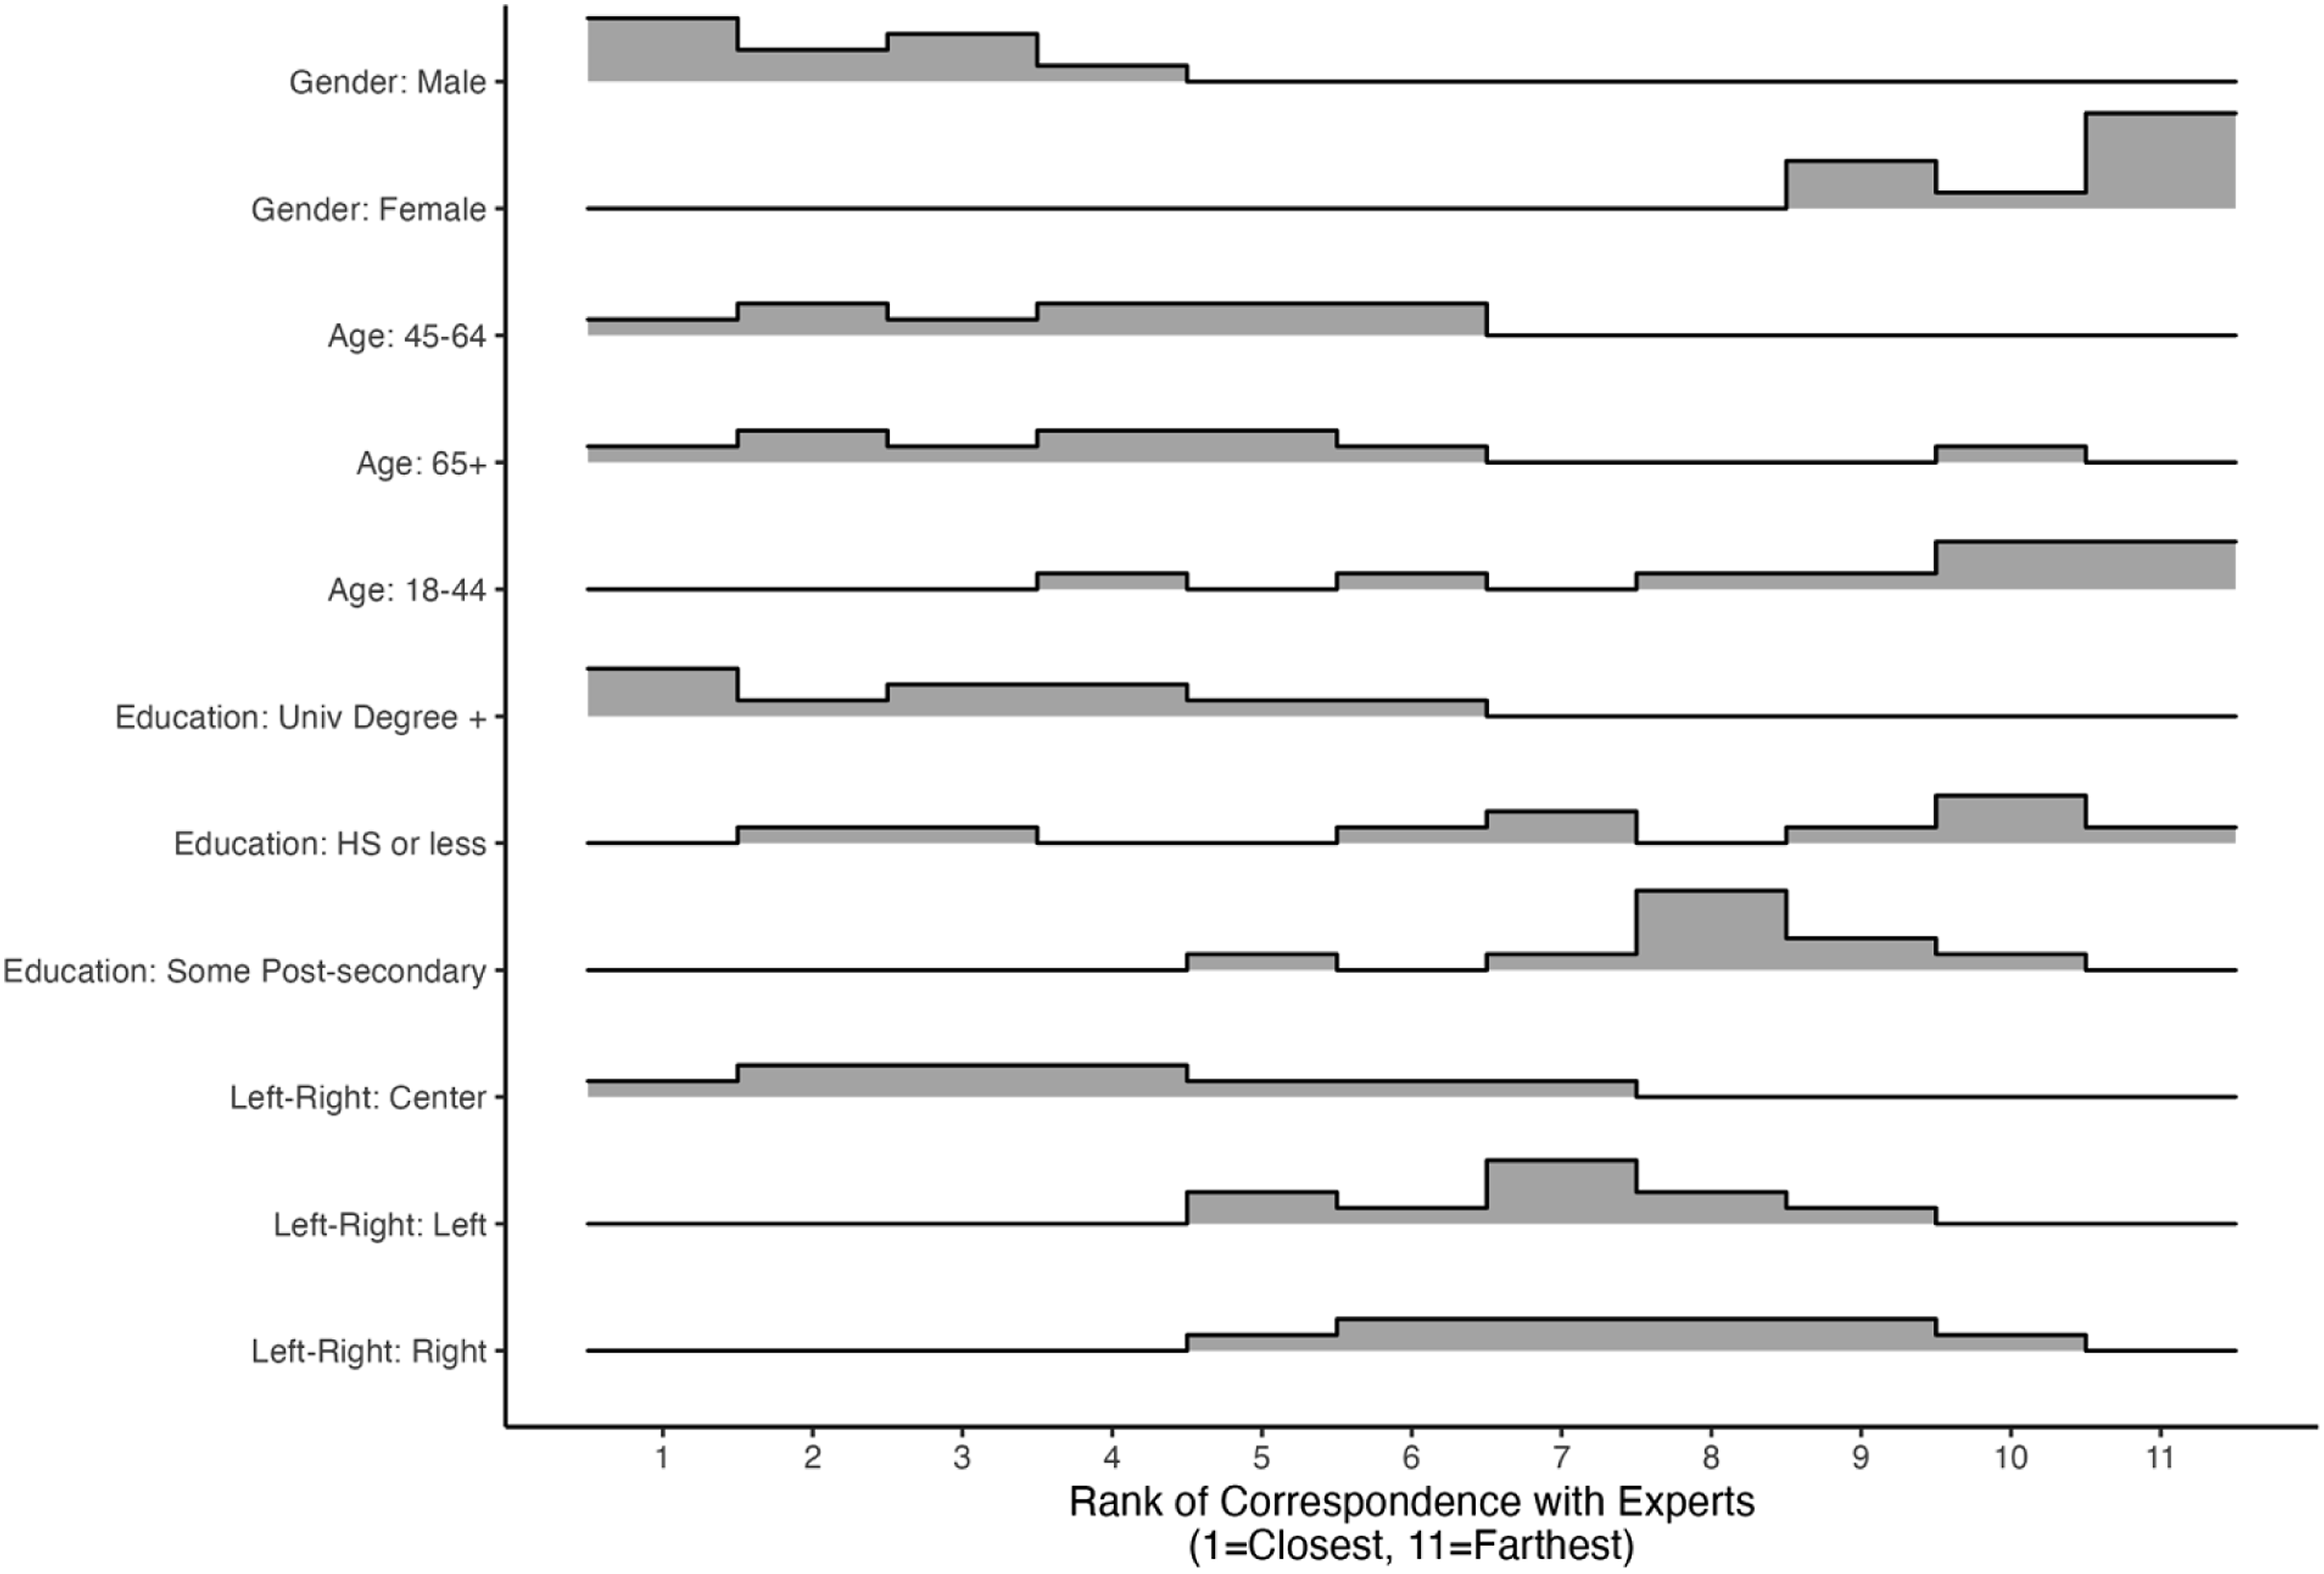
Figure 5 shows results that are largely consistent with our previous findings. Males tend to correspond quite closely with experts having ranks of 1–4 and females considerably less closely with ranks 9–11. This is the “cleanest” result in this part of the analysis. We also find that middle-aged and older citizens have ranks that indicate closer correspondence than younger citizens, though this is not universal. Similarly, those with the highest level of education tend to correspond more closely with experts across issues than those with middling and lower levels of education. Further, there seems to be no interesting difference in the ranks of the two lower education groups. In the analysis above, we find that those in the centre have closer correspondence with the experts on the 10-item scale, closely followed by those on the left. Here, the main result holds – those in the centre correspond with the experts more closely across issues – but there seems to be relatively little difference between those on the Left and Right. Overall, there is nothing to suggest a great deal of inconsistency across issues, though there is certainly some variation. This pattern indicates that the results we find above are likely not driven by systematic differences across issues.
Conclusion
In this paper we investigated whether citizens and experts perceive parties, and therefore political competition, in the same way. Recognizing the validity of expert assessments gathered using the methodology of the CHES, we gathered comparable data from experts and citizens in Canada to facilitate our study. Using multi-dimensional scaling techniques on party placements for 10 issues, we discovered that a single dimension best described modern political competition in Canada and that this dimension mapped nicely onto left-right. On other hand, we uncovered substantial heterogeneity in party placements among citizens relative to experts, especially in terms of age, gender, and education levels, and to a lesser extent, left-right self-placement. We probed the group-level heterogeneity further and discovered that age, gender, and education seemed to have the most influence on whether a group’s party placements were more or less similar to those of experts.
Overall, these results suggest that expert placements alone do not fully capture how most citizens place the parties. Different groups of citizens place the parties differently, which raises important and potentially troubling questions regarding the ability of voters to choose and vote for the “correct” party that most closely matches their ideological and policy preferences. Rohrschneider and Whitefield (2012), for instance, calculated the ideological distance between parties and voters using data from their own expert survey and voter data from the European Social Survey (round 2), to identify “correct” versus “incorrect” partisans. These calculations, however, may not be accurate if the expert survey data do not provide an accurate measure of party placement in each political system. Relatedly, if some voters are not able to vote for the party that closely matches their preferences, the result might be the erosion of democratic legitimacy, deference to authority, and institutional trust given that the selected parties are unlikely to deliver the kinds of public goods expected by those who voted for them. It could also encourage parties to become more polarized as they seek to differentiate themselves from each other as frustrated voters express dismay at parties that do not keep their promises or which may be perceived as abandoning their ideological commitments in favour of politics and convenience.
Future research might build on our work by examining the extent to which these findings hold across democratic contexts, especially in countries that employ federal systems or in places where subnational party systems exist, both of which could complicate the ability of experts and citizens to place the parties. It is an open question as to whether the patterns we observe in this study are unique to Canada, although we expect that it is not given that other countries like Australia, Britain, New Zealand, the United States, and others share some or many of the characteristics of the Canadian political system. Researchers should explore whether these findings travel to other countries, given their potential implications for existing explanations of proximity voting, projection effects, and democratic satisfaction.
Researchers could also investigate further the potential mechanisms underlying the age, gender, and education differences we observe in our study. For instance, researchers might investigate whether the gendered results observed in our study are the result of projection effects (Jensen 2009), in that men and women non-experts are perceiving the parties differently depending on how much they like or dislike the parties, candidates, and/or leaders. Other researchers might turn to the literature on political knowledge (Delli Carpini and Keeter 1996), which has examined how these demographic variables may be useful measures (of motivation, sophistication, and opportunity) for predicting whether individuals are likely to be politically knowledgeable. It might also be fruitful to explore whether the distance between expert and citizen party placements is a better measure of political knowledge compared to questions that ask respondents to correctly name political leaders or the functions and branches of government.
Supplemental Material
Supplemental Material - Do experts and citizens perceive party competition similarly?
Supplemental Material for Do experts and citizens perceive party competition similarly? by Dave Armstrong, Laura Stephenson, and Christopher Alcantara in Party Politics
Footnotes
Declaration of conflicting interests
The author(s) declared no potential conflicts of interest with respect to the research, authorship, and/or publication of this article.
Funding
The author(s) disclosed receipt of the following financial support for the research, authorship, and/or publication of this article: This work was supported by The University of Western Ontario; Faculty of Social Science Internal Grant.
Supplemental Material
Supplemental material for this article is available online.
Notes
Author biographies
References
Supplementary Material
Please find the following supplemental material available below.
For Open Access articles published under a Creative Commons License, all supplemental material carries the same license as the article it is associated with.
For non-Open Access articles published, all supplemental material carries a non-exclusive license, and permission requests for re-use of supplemental material or any part of supplemental material shall be sent directly to the copyright owner as specified in the copyright notice associated with the article.