
Abstract
Evidence suggests that as public opinion towards immigration becomes more negative, so the descriptive representation of ethnic minority groups is increasingly restricted. Recently, some initial research into the causal mechanism hinted that this effect is driven by patterns of candidacy. This suggests that political parties are creating an ‘ethnic penalty’ of their own in the selection stage. This paper investigates the relationship between patterns of candidacy, party strategy, and public opinion in Great Britain from 1997 to 2019, and proposes that ‘punitive parties’ are strongly responsible for shaping the representational outcomes of minority groups. I find support for earlier suggestions that parties are increasingly likely to place ethnic minority candidates away from ‘winnable’ contests as anti-immigrant hostility rises. These findings are important for our conceptions of ethnic penalties, of party behaviour in selection processes, and for the study and cause of improving political representation.
Introduction
The moment in which a candidate is successfully elected is the final step in a long, meandering river of opportunities and processes which feed into election day, and end with representation. Sadly, the reality in many political systems is that the number and quality of opportunities given to candidates is not equal across them, and the processes do not treat everyone fairly. Prospective representatives from certain socio-demographic, religious, and economic backgrounds find themselves disadvantaged compared to others, and, as such, electoral success is too often biased away from too many. Political parties are charged with being ‘gatekeepers’ to representation, and while they ultimately provide the vast majority of representational opportunities, they can also create punitive pressures on (prospective) candidates from ‘non-traditional’ backgrounds seeking to become representatives.
Those in less advantageous positions face what literature articulates as ‘barriers’ to representation, which can be found from spring to estuary along the course of representation. Opportunities can be restricted at all stages, from prospective candidacy (intention to run), all the way through to election at the ballot box (and beyond). Many barriers occur prior, but are intrinsically connected, to the traditional concept of ‘ethnic penalties’ – voter-based sanctions levied against minority candidates on election day as a result of some form of prejudice or discrimination. While much research tends to focus on those election day outcomes (the ‘estuary’), there is a much larger size and spread of interconnected and interdependent exclusionary forces pushing against minority-group participation (the ‘upstream’).
This research contributes to the literature by developing a framework for ‘punitive parties’, who will strategically discriminate against ethnic minority candidates when they deem it electorally prudent to do so. I find strong evidence that there is a systematic and quantifiable pattern of political parties positioning minority candidates away from ‘winnable’ contests in areas where the public displays less tolerance for diversity. In short, parties are moving minority candidates away from seats where they perceive that their non-white appearance might ‘cost’ the party a result. Further, from some preliminary analysis on 2019 candidate data, there is a suggestion that the relationship affects Black candidates to a greater degree than others. I argue that this combination of public opinion and party strategy is one of the most significant blockages to electing parliaments which fully reflect the ethnic diversity of their populations, and works in tandem with (and drives) other exclusionary forces.
Political (under) representation
While in recent years improvements have certainly been made in making parliaments across advanced democracies more reflective of the ethnic diversity in their populations, minority ethnic groups still remain under-represented in the legislative chambers of the vast majority of developed countries (Bird et al., 2010; Bloemraad and Schönwälder, 2013; Ruedin, 2013). Britain, as one such under-representative political system, provides an excellent case study to examine the wider development of minority-group representation in Western democracies and its socio-cultural and (party) political barriers. The country has a long history of immigration and multiculturalism, significant public anxiety and controversy over migration, a localised majoritarian electoral system, and highly favourably voting (and, prior to 1983, citizenship) rights given to immigrants from former colonies in Africa and Asia (Bloemraad and Schönwälder, 2013; Ford, 2011; Ford et al., 2015; Meer and Modood, 2009; Modood, 1997; Saggar, 2004). If parties are negatively impacting representational opportunities and outcomes here, it is highly likely that the same could be happening in other countries with comparable political (party) systems, histories, populations, and public contention with (non-white) immigration and ethnic diversity.
The term ‘ethnic minority’ in the British context is effectively a synonym for demographic groups with non-white racial backgrounds (Heath et al., 2013; Modood, 1997; Nimmi, 1991). This differs to concepts of immigrant-origin minorities, which includes white immigrant groups such as mainland European immigrants, or other ethnic minority backgrounds without racial minority status, such as Travellers or Gypsy communities (Bloemraad and Schönwälder, 2013; English, 2019a, 2019b). The study of ethnic minority groups and their socio-political integration has long been the focus of academic work and high-profile civil society and political debate (Hepple, 1968; Modood, 1994; Saggar, 2003; Solomos, 1989). Despite this long and very public history of concern, even after the recent 2019 British General Election the number of Members of Parliament (MPs) from ethnic minority backgrounds is still only around 50% of the total needed for the House of Commons to fully reflect its population in terms of ‘descriptive’ representation (Mansbridge, 1999; Pitkin, 1967). In the narrow sense, this means that the presence of non-white MPs in elected positions across British politics does not reflect the presence of non-white populations living in the country (Banducci et al., 2004; English, 2019b; Norris and Lovenduski, 1995; Sobolewska, 2013), and in a broader sense, it is also the case that minority groups remain under-represented in positions of authority, power and leadership in the British parliamentary system (English, 2019a).
A range of issues arise when ethnic minority groups are systematically disadvantaged and shut out: declining participation and feelings of ‘belonging’ and ‘legitimacy’ in the political system (English et al., 2019; Gay, 2001, 2002; Martiniello, 2005), 1 reduction in responsiveness to (ethnic minority) constituents (Costa, 2017; McKee, 2019), and overlooking of minority-group issues and concerns in policy and decision making (Mansbridge, 1999; Sobolewska et al., 2018). Increasing diversity in parliament is a widely agreed strategic and normative goal among British political parties (Sobolewska, 2013), and among political elites and institutions across the democratised world (Banducci et al., 2004; Bird et al., 2010; Bloemraad and Schönwälder, 2013). Further, Saggar and Geddes (2000) argued that increasing representation and participation is mediated by and can in turn affect the political institutional context, and bring issues of race politics out from ‘the margins’ and into the mainstream of ‘political life and political analysis’. Higher descriptive representation is also connected to stronger substantive representation of minority groups, which impacts (the prevalence of) debates and discussions on salient topics for these typically excluded groups, such as racial discrimination, justice, immigration policy, and extremism (Saalfeld and Bischof, 2013; Sobolewska et al., 2018).
Under-representation in political systems is usually understood as being caused by either ‘supply’ side or ‘demand’ side factors (Sobolewska, 2013; Norris and Lovenduski, 1995). While before the turn of the century there was certainly problem in terms of supply of candidates coming forward from ‘non-traditional’ backgrounds (Norris and Lovenduski, 1995), this situation has undoubtedly improved in recent years (Sobolewska, 2013). Around 95 MPs would need to be non-White British to ‘reflect’ the size of the minority-ethnic British population (which is estimated at around 14.5% in England and Wales, according to the most recent Annual Population Survey results). 2 As such, the 138 minority candidates standing for election almost a decade ago in 2010 (Fisher et al., 2014) demonstrates no real shortage in terms of supply for minority group representation. The potential stock of MPs is certainly there. We are therefore left to investigate the possibility that demand-side influences hold back representation.
Ethnic penalties in existing literature
The potential for voters to punish candidates from minority ethnic backgrounds is what is known as the ‘ethnic penalty’ hypothesis, and is one explanation for the under-representation of ethnic minority candidates in British parliament. Across a number of previous works, consistent evidence has been found that – all else being equal – an ethnic minority parliamentary candidate will face something of a disadvantage at the ballot box due to voter discrimination in British elections (Curtice et al., 2018; Fisher et al., 2014; Martin and Blinder, 2020; Norris et al., 1992; Stegmaier et al., 2013; Thrasher et al., 2015). Voter prejudice might be ‘active’ in terms of outright hostility towards ethnic minority groups, or more subtle in terms of in-group favourability or competency judgements (Fisher et al., 2014). So, in situations where their party might be increasing its vote share across the board, non-white candidates appear to see their individual increases limited relative to their white colleagues. Equally, when a party is declining nationally, often it is the case that ethnic minority candidates will be hit hardest by said decline. This systematic disadvantage will make it harder for ethnic minority candidates to gain election, slowing the course of representation.
Punitive racial-based voting in Britain has been detected as recently as the 2017 General Election, with Curtice et al. (2018: 460) finding that the Conservative party were up by an average on only 1.6 points when fielding a newly challenging ethnic minority Conservative candidate, compared to an average of 5.2 when the candidate’s ethnicity was not changed. In survey research during the run-up to the same election, Martin and Blinder (2020) also found evidence of voter discrimination against minority ethnic candidates – specifically those from Pakistani backgrounds, and Black Caribbean background when candidates expressed support for pro-minority policies. Furthermore, a major longitudinal study from Thrasher et al. (2015) also detected ethnic penalties in local authority elections, and concluded that it was ‘undoubtable’ that electoral contests were being decided on the basis of voter discrimination against ‘non-British sounding’ candidates in council elections ranging from 1973 through to 2012.
In the wake of the 2001 and 2005 Islamic terrorist attacks on New York and London respectively, Fisher et al. (2014) investigated voter discrimination against Muslim candidates at the 2010 General Election. They summarise their findings by stating that ‘evidence from the last general election shows that white British voters, on average, are less willing to vote for ethnic minority candidates, especially Muslim candidates’, and further, that the ‘relative unwillingness of specifically anti-immigrant whites to vote for Muslim candidates, together with the known positive association between anti-immigrant sentiment and Islamophobia, suggests that the Muslim-candidate electoral penalty is driven by prejudice and discrimination’ (Fisher et al., 2014: 900). This individual-level unwillingness to vote for minority candidates on the part of white-majority voters collects and then drives the punitive effects noted at the aggregate-level.
However, Fisher et al. (2014) did also argue that ethnic penalties were in all ‘difficult to detect’ and unlikely to have had much influence on the actual result of (General) election contests. This is a view shared across much of the literature on ballot box ethnic discrimination, with Sobolewska (2013: 622) stating that ‘the significance of the ethnic penalty might be overstated’ in current research. Stegmaier et al. (2013) too argued that sometimes race ‘did not matter’ when explaining electoral outcomes, and that existence and extents of ethnic penalties depended on highly specific contextual arrangements of candidates, ethnicities, and voters. As such, scholarship has largely closed the door on the potential for ethnic penalty effects to be dictating representational outcomes.
Broadening the penalty framework: Punitive parties
This research does not attempt to challenge the general consensus regarding the influence of voter penalties on election outcomes, but focusing on the punitive behaviour of voters alone misses much of the discriminatory structuring of representational opportunities and outcomes that occurs prior to the moment of that ballot box contest. These ‘upstream’ effects are actually an important factor in masking and mediating penalty sizes measured at the ballot box in previous research. In other words, the limited size and scale of ethnic penalty effects is a consequence of their much larger actually potential size – a potential which is to some extent known and being strategically avoided by political parties (Durose et al,. 2011; English, 2019b; Sobolewska, 2013). It is in that direction which this research turns the conversation, and proposes the idea of ‘punitive parties’ who act to restrict opportunities for minority candidates when it is (deemed) strategically beneficial to do so.
Political parties are often charged with being ‘gatekeepers’ to representation (Bloemraad and Schönwälder, 2013; Caul, 1999; Norris and Lovenduski, 1995; Sobolewska, 2013), and in the British context, candidate nominations are generally carried out and determined by local branches and organisations of political parties, who exercise a great deal of autonomy in this regard. As Sobolewska (2013: 620) writes, Labour and Conservative candidate selection for British General Elections has normally been a ‘multi-stage process’, where a nationally approved and vetted list of candidates can ‘apply for local election’. Selection for individual constituencies is then handled by the local parties themselves, who draw up short-lists for local party members to vote on. There have been some exceptions to this general structure over the study period, such as the suspension of centralised candidate approval by Labour in 2015 (handing more control directly to local parties), and the use of ‘open primaries’ in some Conservative safe seats in recent elections (Criddle, 2016, Alexandre-Collier, 2016). It is not entirely unheard of for central party authorities to propose candidates to local branches and push them into selecting them – for example, the Conservative ‘A-List’ strategy in 2010 (Hill, 2013). However, in general, the process is much more delicate and consensual than in most other political systems where central party authority can be (almost) unilaterally exercised on candidate selection procedures (Hazan and Rahat, 2010; Sobolewska, 2013).
The suggestion that ‘non-traditional’ candidates can and do face disadvantage and discrimination in the candidate selection process is hardly novel nor controversial. Nor is it novel or controversial to assert how important this element of the representational story is: ‘party nomination serves as a choke point that will either close off entrants or, alternately, open up the pathway into politics’ (Tolley, 2019: 70). Scholarship has consistently highlighted how women, ethnic minority, and (more recently) disabled would-be election candidates are treated poorly or shut out entirely in the selection and election process by political parties and their nomination strategies (Evans and Reher, 2020; Shah, 2014; Tolley, 2019). This is often put down to the impact of exclusionary, closed networks among party elites, socio-economic inequalities meaning participation and networking become (or are) more challenging for under-represented groups, and outright discrimination and prejudice.
The contribution of this research is to bring public opinion into the heart of our accounts of discrimination within the selection process, and place this mechanism in a wider punitive framework concerning selection and election. There is growing evidence attesting to the impact that public opinion and attitudes towards diversity and difference has on mediating the advancement of minority representation in British politics. Geddes (1998: 152) first proposed that the descriptive representation of ethnic minorities may be tempered by public opinion, writing that ‘if the prevailing national mood is hostile [toward ethnic minority participation]…this will place constraints on political opportunity’. Following from this, both Ruedin (2009, 2013) and English (2019b) found evidence for this effect. Ruedin (2009, 2013) studied the relationship between antiimmigrant sentiments and minority group representation in cross-national perspective, and found that (2009: 249) ‘Cultural attitudes – particularly when measured as positive attitudes towards marginalised groups in society in general – appear to be the key driver of ethnic representation in national parliaments’. English (2019b: 18) systemically analysed the relationship between levels of representation for ethnic minorities in British politics and public opinion towards immigration at five elections from 1992 to 2010, and concluded that a more hostile ‘public opinion does have a significant negative impact on the representation of ethnic minority [immigrant origin] groups’.
Though we have evidence that the two factors are indeed related, we have only minimal insights into the underlying process. In other words, away from ballot-box penalties, there are significant gaps in our understanding about how public opinion restricts representational opportunities. While evidence suggests that public opinion and representation are connected, the casual mechanism is as yet uncovered, and a full theoretical framework not yet developed. There was some suggestion of what may be happening in this regard again from English (2019b), who ran a preliminary analysis on parliamentary candidates which demonstrated the possibility of candidate-level impacts of public opinion on representation. This research proposed, in line with a very similar argument put forward by Durose et al. (2011: 93), that increasingly hostile local public attitudes towards diversity and difference may well be noticed by local party selectors, who may then in turn avoid selecting a minority candidate for fear of an electoral backlash.
From this, we can build an expectation that if local parties anticipate that a non-white candidate might not be so well received in their constituency because of local issues, grievances, about and/or hostility towards diversity and difference, then – if the party had something to lose (in that they either hold the seat or it is a marginal they are contesting) – the chances of an ethnic minority candidate being selected will decrease. In this sense, and if this suggestion matches reality, parties become exclusionary and will discriminate against minority candidates when they deem it electorally prudent to do so. If parties are acting as exclusionary forces, then they and their reactions to (perceived) public opinion must also be considered punitive. This mechanism is the ‘punitive parties’ element of wider restrictions and barriers that ethnic minority candidates face when seeking election – including exclusionary forces noted in previous selection literature, and voter penalties.
This strategic discrimination would in turn have an impact on actual ethnic penalties measured at the ballot box. If parties are anticipating and seeking to avoid them, then we would detect fewer penalties. Thus, the limited size and scale of ethnic penalty effects measured in existing literature (Fisher et al., 2014; Sobolewska, 2013) is a consequence of their much larger potential, which is being strategically avoided by political parties (Durose et al., 2011; English, 2019b; Sobolewska, 2013). Furthermore, the strategic angle to such discrimination could also be used by parties to mask, justify, or motivate some of the prejudicial and exclusionary practices occurring elsewhere in the selection process as discussed above. Each of these ethnic-based barriers and blockages to representation can be viewed as part of the same punitive framework and mechanisms of exclusion.
Empirical evidence
Data
To test the expectation that higher public hostility towards diversity and difference restricts the selection opportunities of ethnic minority candidates, regression analysis was conducted on a unique and extensive database covering election candidates and public opinion since 1997. Figures are aggregated to the regional level, for reasons detailed below and in the Online Appendix (mainly due to constraints on the public opinion data). The dependent variable in the analysis is the number of ethnic minority candidates fielded in ‘winnable’ seats in each region at each election by either the Labour or Conservative parties. These are the only two political parties to have contested every constituency in each General Election, 3 and have provided the overwhelming majority of ethnic minority candidates and MPs, over the study period (Sobolewska, 2013). Candidate ethnic (minority) status is as determined and recorded by data collectors using online visual information (from social media, candidate pages, news articles, and so on). 4 It is not a measurement of ethnic self-identification. 5 A seat is considered winnable at a given election if either one of the following two conditions are satisfied: 1) the party for which the minority candidate is standing already holds the seat, or 2) the party for which the minority candidate is standing requires less than a 5% swing to win and take the seat for themselves (therefore the gap between them and the current incumbent is 10% or less). 6
Table 1 shows the total number of Labour and Conservative British parliamentary candidates from 1997–2019 identified as being from ethnic minority backgrounds. It shows an almost linear rise in the total number of ethnic minority candidates fielded in British General Elections over the study period, with a particularly sizeable jump between 2010 and 2015. The Labour Party provides more opportunities than their Conservative counterparts in four out of seven of the elections in the study, including in the latest two contests (2017 and 2019).
Number of conservative and labour minority candidates in British elections.
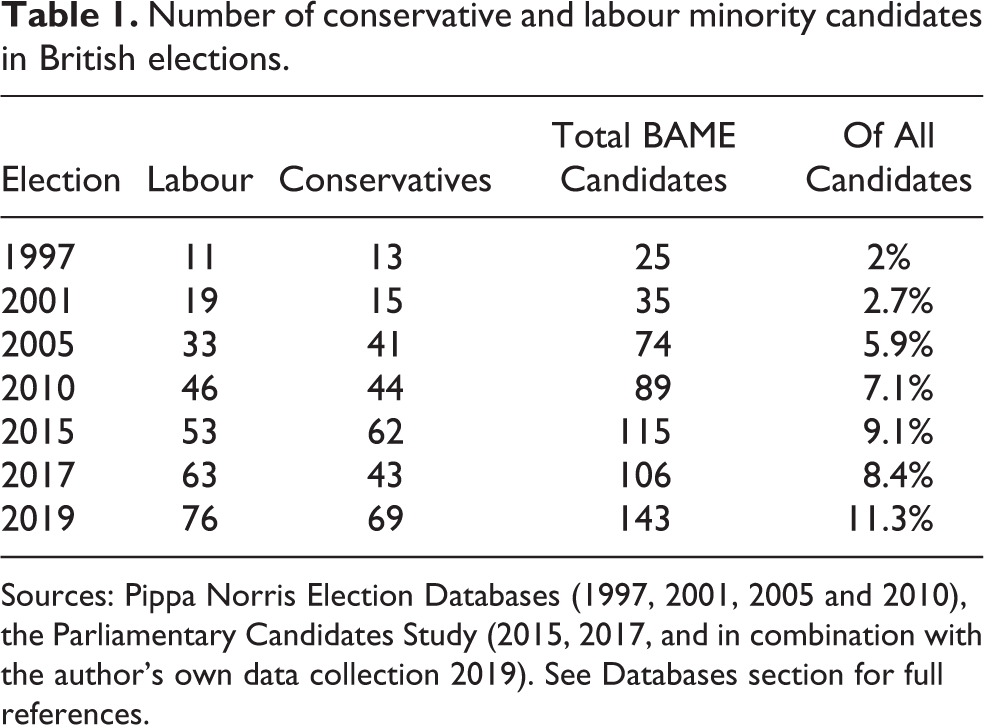
Sources: Pippa Norris Election Databases (1997, 2001, 2005 and 2010), the Parliamentary Candidates Study (2015, 2017, and in combination with the author’s own data collection 2019). See Databases section for full references.
Moving below the country-wide figures, Figure 1 shows the percentage of minority candidates positioned in winnable contests – competitive races in which a minority candidate is not just fielded by a political party, but would stand a good chance of winning – in each region at each election time. London is far ahead of all other regions in terms of the percentage of seats there ‘opened up’ for minority representation. Opportunities are also (relatively) high in the South East region, and the West Midlands (home to Birmingham – the country’s second-largest city and a major hub of ethnic diversity). On the other hand, there are very few ‘winnable seat’ opportunities given to minority candidates in Wales, the North East, the South West, or the East Midlands.
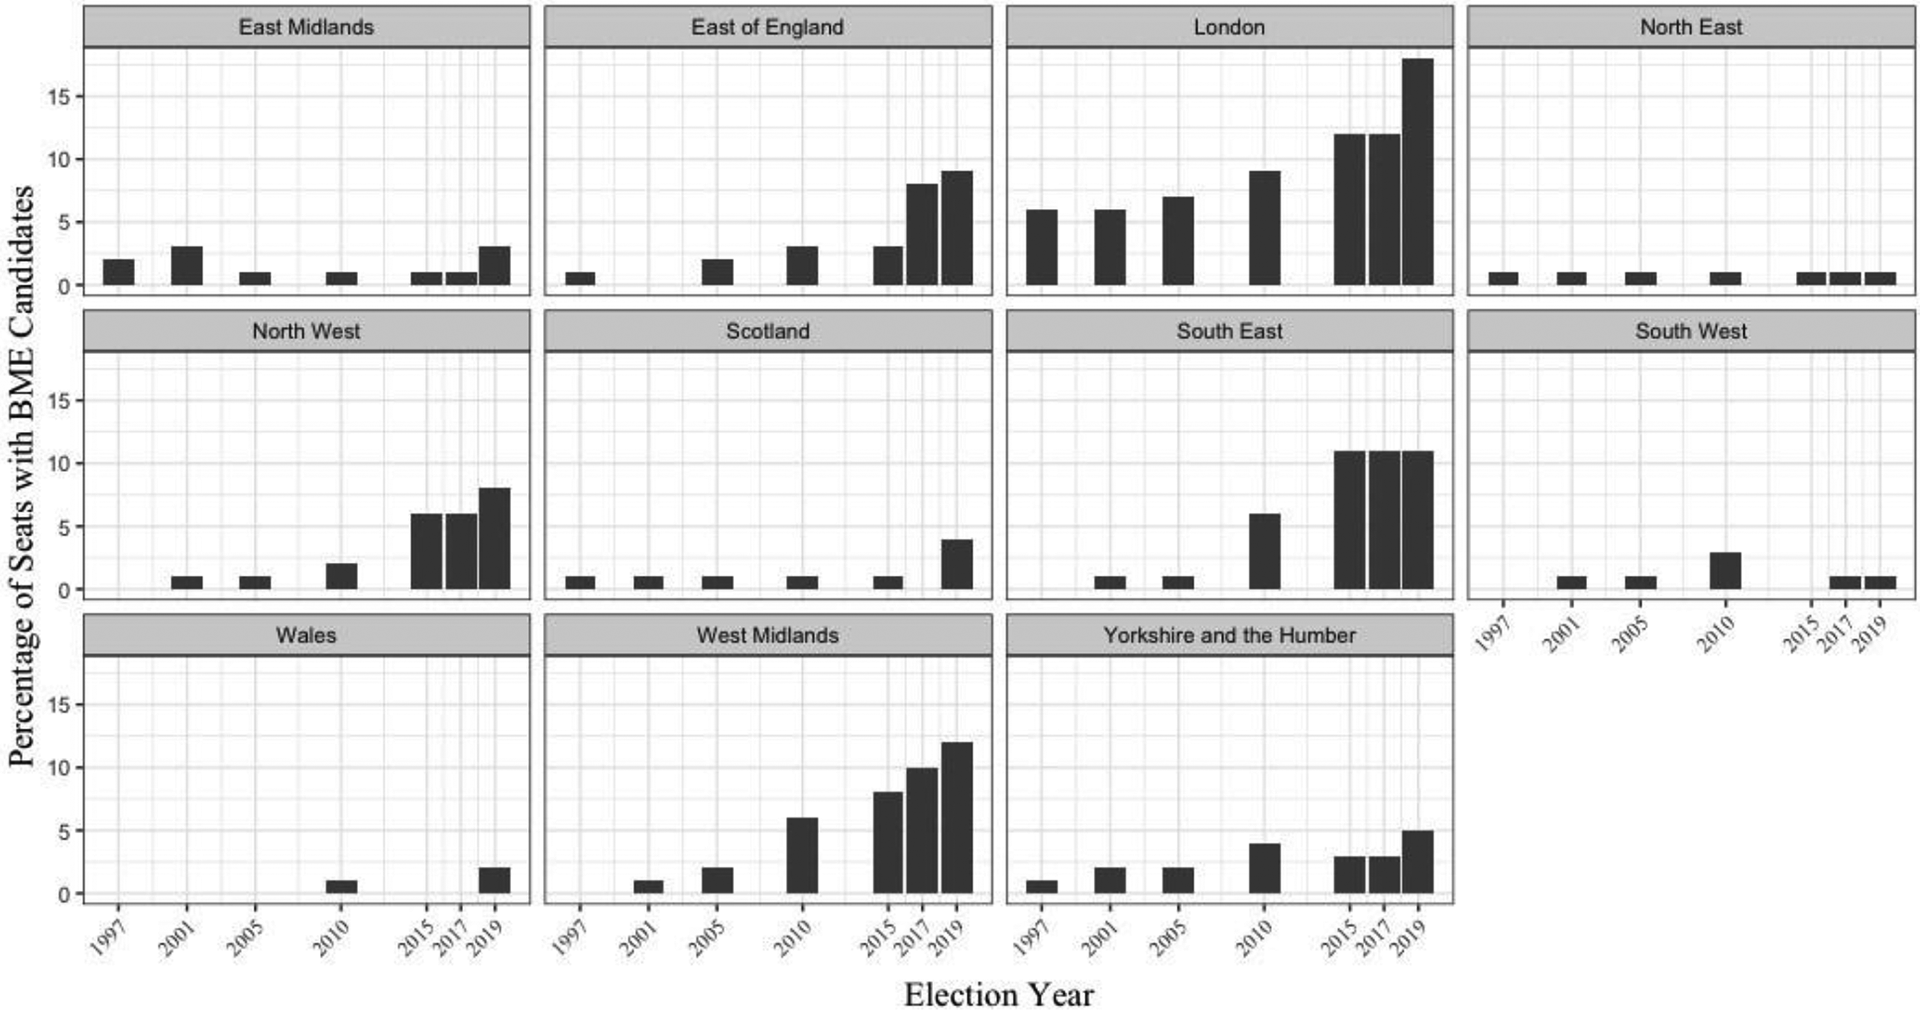
Number of ethnic minority candidates in winnable positions, per region. Source: Pippa Norris Election Databases (1997, 2001, 2005 and 2010) and the Parliamentary Candidates Study (2015, 2017 and in combination with the author’s own data collection for 2019). See Online Appendix for full references.
Public opinion is measured from harmonised and aggregated survey data on attitudes towards immigration from five high-quality, longitudinal sources. 7 The database includes questions covering immigration levels, the impact of immigration on the British economy and society, views on immigration levels and impacts from specific immigrant groups, family reunification, repatriation, and the impact and influence of immigration on the British labour market. Individual responses were analysed and aggregated to the national 8 and regional levels using an updated (by the author) version of Professor James Stimson’s (1991) ‘dyad ratios’ algorithm in the R statistical software programme. The algorithm allows us to estimate the ‘latent attitude’ towards immigration which runs through a range of otherwise incomparable sources, questions, and respondent answers, by harmonising measurement of the change in responses to repeated questions over time in a process similar to a factor analysis. 9
To be included in the question series database, a question must have been repeated at least three times over the study period. A full documentation of the question items, their sources, and their wording can be found in the Online Appendix. The topic of immigration is used as the measurement for public opinion on diversity and difference – rather than a measurement of race relations and/or multiculturalism for three reasons. Firstly, immigration opinions have been connected to ethnic minority candidacy opportunities in previous literature (English, 2019b). Secondly, question coverage on issues specifically of race and race-relations alone is not sufficient enough to create a long and stable time series over the study period at the national and regional levels. There are only a handful of repeated items asked in these survey sources which can be conceptualised as pertaining to race relations or tolerance of ethnic diversity across the last 40 years. Thirdly, overall, attitudes towards all racial, ethnic, and non-native out-groups tend to move and scale well together and follow similar patterns (in trend, if not level) over time (Ford, 2008; Meuleman et al., 2009), and immigration question series have been used as a proxy measurement for attitudes towards other (and more general) out-groups in previous literature (Jennings, 2009). This latter point is demonstrated in the Online Appendix to this research through the construction of a ‘race relations and xenophobia’ time series (using the 10 items from the above sources plus the Eurobarometer) which is then compared to the immigration measurement at the national level. Large regions are the most practical level at which to work with these aggregated data, and this approach to measuring opinions towards out-groups in Britain has been taken previously by English (2019b), Drinkwater et al. (2013), Van Hauwaert and English (2018), and Markaki and Longhi (2013). 10 This research continues the tradition of using the large Government Office Regions, or NUTS1 11 regions, for breaking out and analysing regional public opinion in Britain.
Figure 2 shows regional level opinions over time in Britain since 1990. This represents data for the key independent variable used in the regression analysis. Attitudes in London and Scotland for instance remain systematically more positive than other regions, while – with the exception of the final few years in the study – attitudes in regions such as Wales and the North East are much less positive on average. Some regions do not see such a dramatic turn in the later years as others, with Yorkshire and the Humber, the South West, and the North West remaining fairly low on the scale compared to others such as the South East and the West Midlands as the study period concludes.
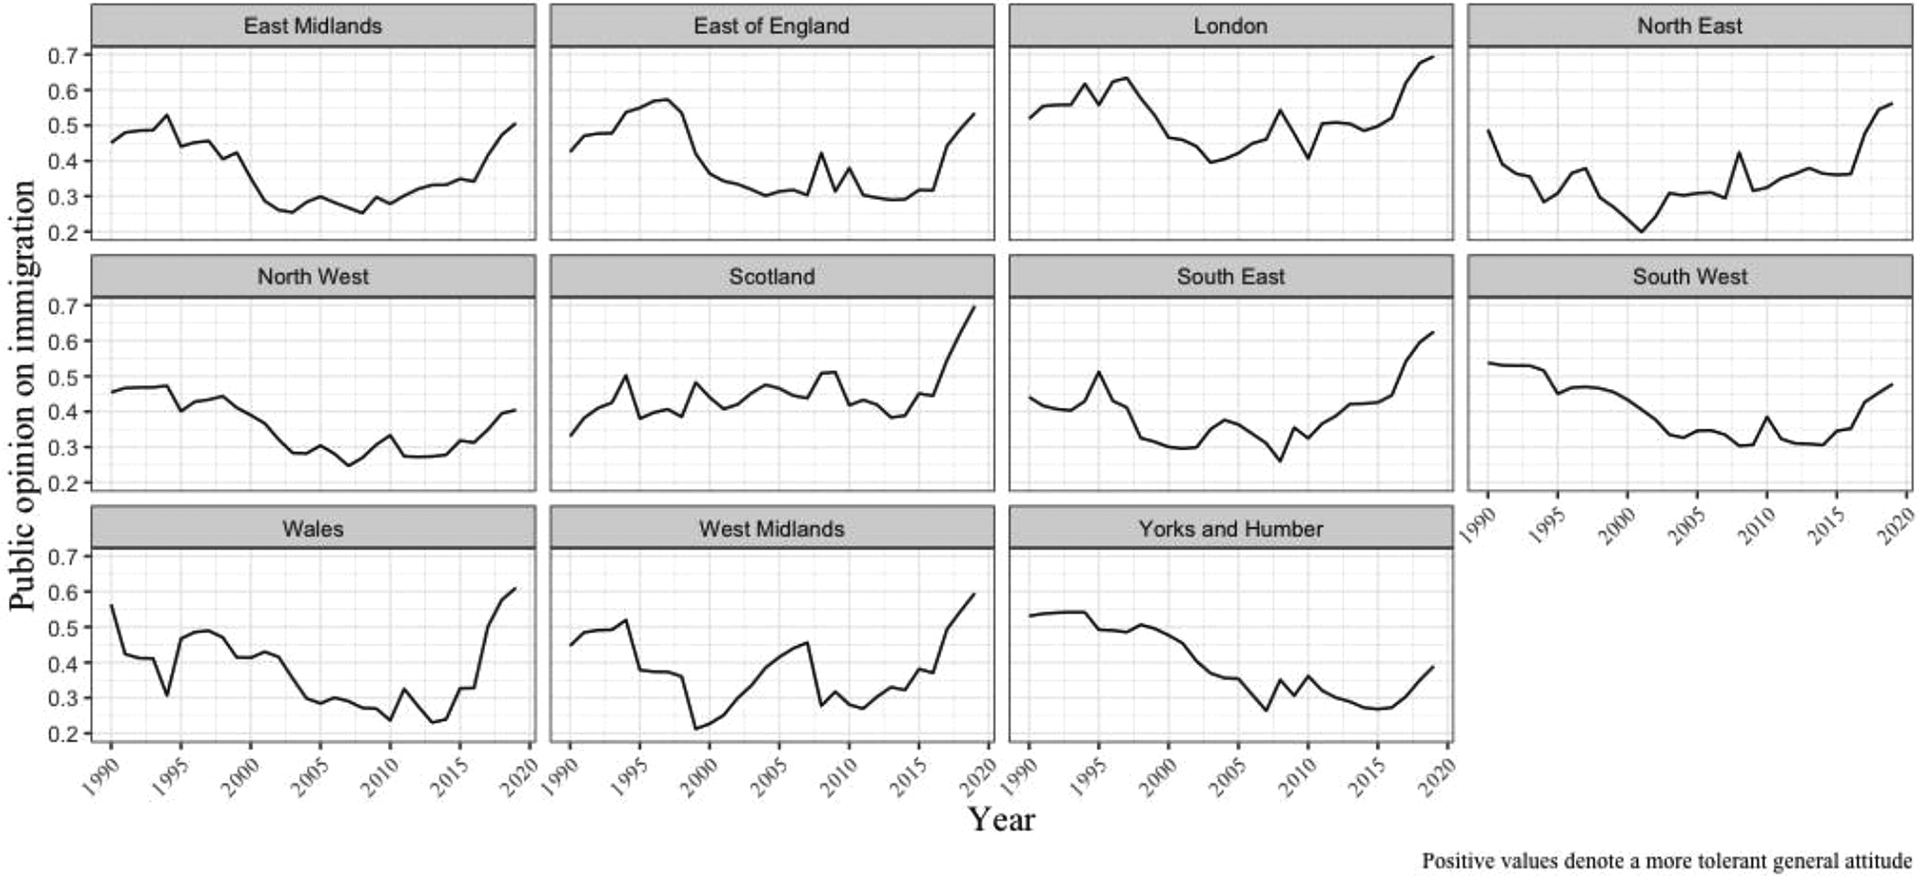
Public opinion on immigration in British regions. Per region: 163 observations across 24 time series. Eigenvalue estimates range from around 50% to 75% of variance explained. Data from the BES, BSA, EVS, WVS, and ESS harmonised and aggregated by the author using the Stimson dyad-ratio algorithm. For full descriptive statistics on measurements and data citations, see the Online Appendix.
Four additional control variables (alongside a dummy variable for each election to account for the panelled nature of the research design, and a further dummy variable for party) were as follows: (1) the share of the population identifying as from an ethnic minority background in the region at each election year, (2) latent support for the anti-immigrant parties, (3) urbanisation and population density, and (4) the number of incumbents retiring/stepping aside. Controlling for ethnic minority populations and urbanisation provides an account for the extent to which minority groups are able to effectively mobilise and participate in the political system, with both higher ethnic diversity and urban density previously connected to better localised opportunities and outcomes for representation (Martin, 2016; Saggar and Geddes, 2000; Sobolewska, 2013). The figures for non-white populations come from the UK Census (1991, 2001, and 2011) and the Annual Population Survey (2005, 2015, 2017, and 2019). For urbanisation, a dummy variable for the presence of an urban area within the region containing over 2-million people was leveraged. 12
Bringing in a measure of anti-immigrant party activity accounts for the impact that local contexts of anti-immigrant mobilisation might have: as outlined in English (2019b), a hostile climate could both increase (in terms of a counter-mobilisation to defend interests) and decrease (suppress the desire of immigrant groups to engage in the hostile, unwelcoming political system) local incentives to stand for parliament. Strong local anti-immigrant movements could also contribute to parties’ strategic judgement about positioning minority candidates in winnable seats. The figures used are the combined vote shares for the British National Party, United Kingdom Independence Party, and the Brexit Party at the European Elections prior to the (General) election year. Using results from ‘second-order’ elections such as this is a more effective measurement of latent potential support for parties who are otherwise often ‘squeezed out’ in General Election contests (Hobolt and Spoon, 2012; Reif and Schmitt, 1980). Finally, though it is not completely unheard of for sitting MPs (previously successful candidates) to move constituencies or to be deselected for the upcoming election by their local parties, the number of opportunities for ethnic minority candidates finding winnable contests to compete in will naturally be much higher when a greater number of incumbents stand down ahead of the election (Shah, 2014; Sobolewska, 2013). 13 Therefore, the final control variable counts the number of seats without incumbents standing ahead of the election.
Modelling strategy
As the dependent variable was a count measurement, taken at the party level, with two observations in each region per election creating a ‘repeated measures’ panel design to the data, 14 the relationship was estimated using a Bayesian Poisson regression model with a panel structure specification. 15 The log transformation of the total number of seats which were ‘winnable’ for each party at the regional level at each election was used as the offset variable. This accounts for the fact that many regions will provide more winnable contest opportunities overall for Labour and Conservative candidates (mostly through having far more seats, such as the South East) than others (for instance, Scotland since 2015). 16 Weakly-informative prior probabilities were established through simulation and cross-referencing with the limited existing research on the relationship between public opinion and representational outcomes. 17 The expectation was that a non-zero, positive, relationship would be found between increasingly open and tolerant local attitudes towards immigration and higher numbers of ethnic minority candidates fielded in winnable seats at British elections over the last two decades. For further reference, the model workflow (including establishing priors), model postestimation figures, alternative Bayesian model specifications and frequentist models using the otherwise same specification can be found in the Online Appendix.
Regression analysis
Table 2 shows the regression results, with the estimate column representing the mean coefficient size from the posterior distributions. The second numeric column shows the standard deviation of the posterior distribution of each parameter estimate. The intervals reported are 89% credible intervals. 18 The coefficient of 3.2 for the public opinion variable indicates that our number of expected ethnic minority candidates fielded in winnable positions will increase by around 25 if a region moves from entirely restrictive in its opinions to entirely open. The credible intervals do not cross zero, 19 and suggest that there is an 89% probability that the effect-size is between 1.5 and 4.9. 20 This gives us strong evidence in favour of a positive relationship between public opinion and opportunities for ethnic minority candidates to stand and achieve representation. Our prior expectation is therefore met, and we have more than sufficient evidence to credibly reject the suggestion that the relationship between public opinion and candidate selection is zero (or negative).
Bayesian Poisson regression results.
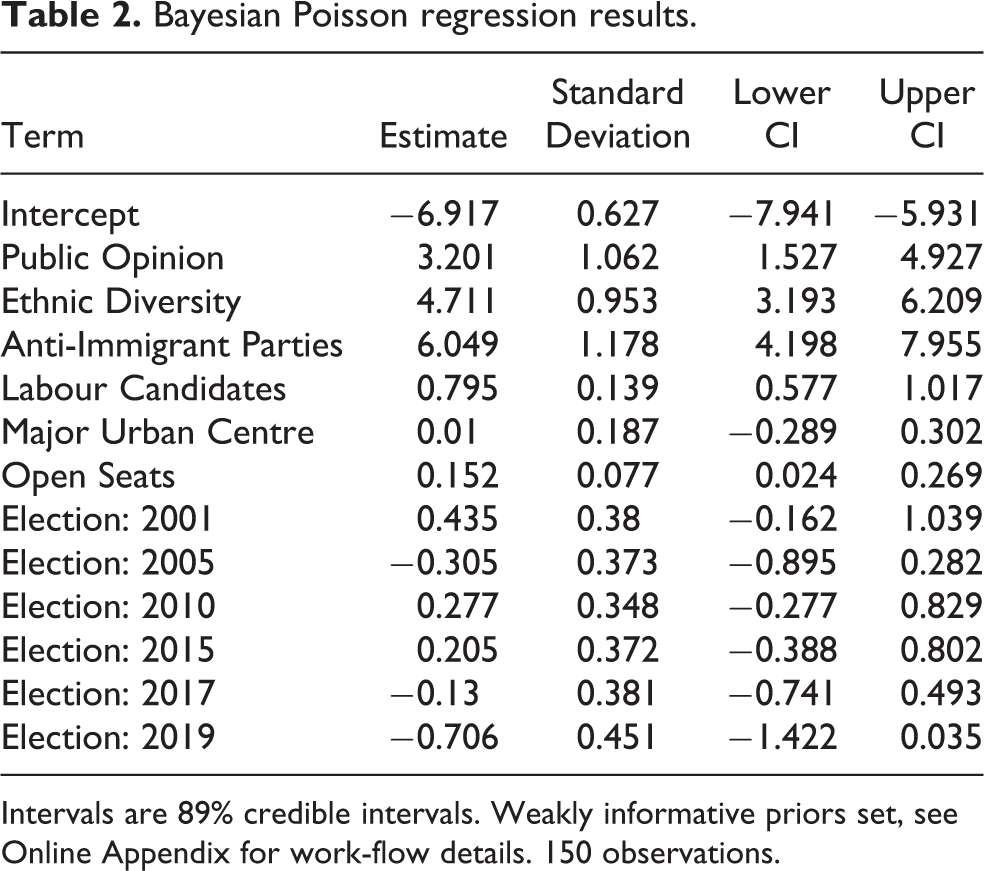
Intervals are 89% credible intervals. Weakly informative priors set, see Online Appendix for work-flow details. 150 observations.
There are important relationships between ethnic minority candidate opportunities and ethnic diversity and anti-immigrant party strength. These estimated coefficients of 4.7 and 6.0 respectively confirm prior expectations that the potential stock of minority representatives and counter-mobilisation impetus are important factors in the representation story. There is no relationship to speak of between increased probability of ethnic minority candidates being fielded in winnable positions and higher urbanisation/population density. Though, as previously noted, any urban density measurement correlates highly with diversity metrics, and so much of this effect is likely being captured by the non-white population model parameter. Finally, the Labour Party coefficient is positive, and the intervals do not contain zero. This suggests that ethnic minority candidates in winnable positions are more likely to be Labour candidates, and therefore confirms previous suggestions and observations regarding the Labour Party providing more opportunities for successful minority descriptive representation at General Elections.
Difference in effects between ethnic minority groups
Ethnic minority communities are not a homogeneous group in terms of their backgrounds, socio-political views and experiences, and representation. There are numerous groups within the ethnic minority umbrella, each with their own distinct histories and experiences of the British political system and those (particularly from the majority group) organising, voting, and representing within it (Fisher et al., 2014; Ford, 2011; Storm et al., 2017; Uberoi, 2020). It is therefore important that research reflects this, and at this point I turn to investigate how the above observed relationship might differ by major ethnic group.
The body of minority-ethnic candidates is not sufficiently large enough and the data not specific enough about their background in the earlier period of this study to perform group-level analysis in this research. However, for the latest election, candidate ethnic background data is disaggregated into four categories with healthy counts in each: White, Asian, Black, and all Others. Figure 3 shows the relationship between public opinion on immigration (scale reversed this time, so that higher values indicate more restrictive aggregate opinions) and the number of candidates in ‘winnable’ contests by major ethnic minority group as it appears in the 2019 data.
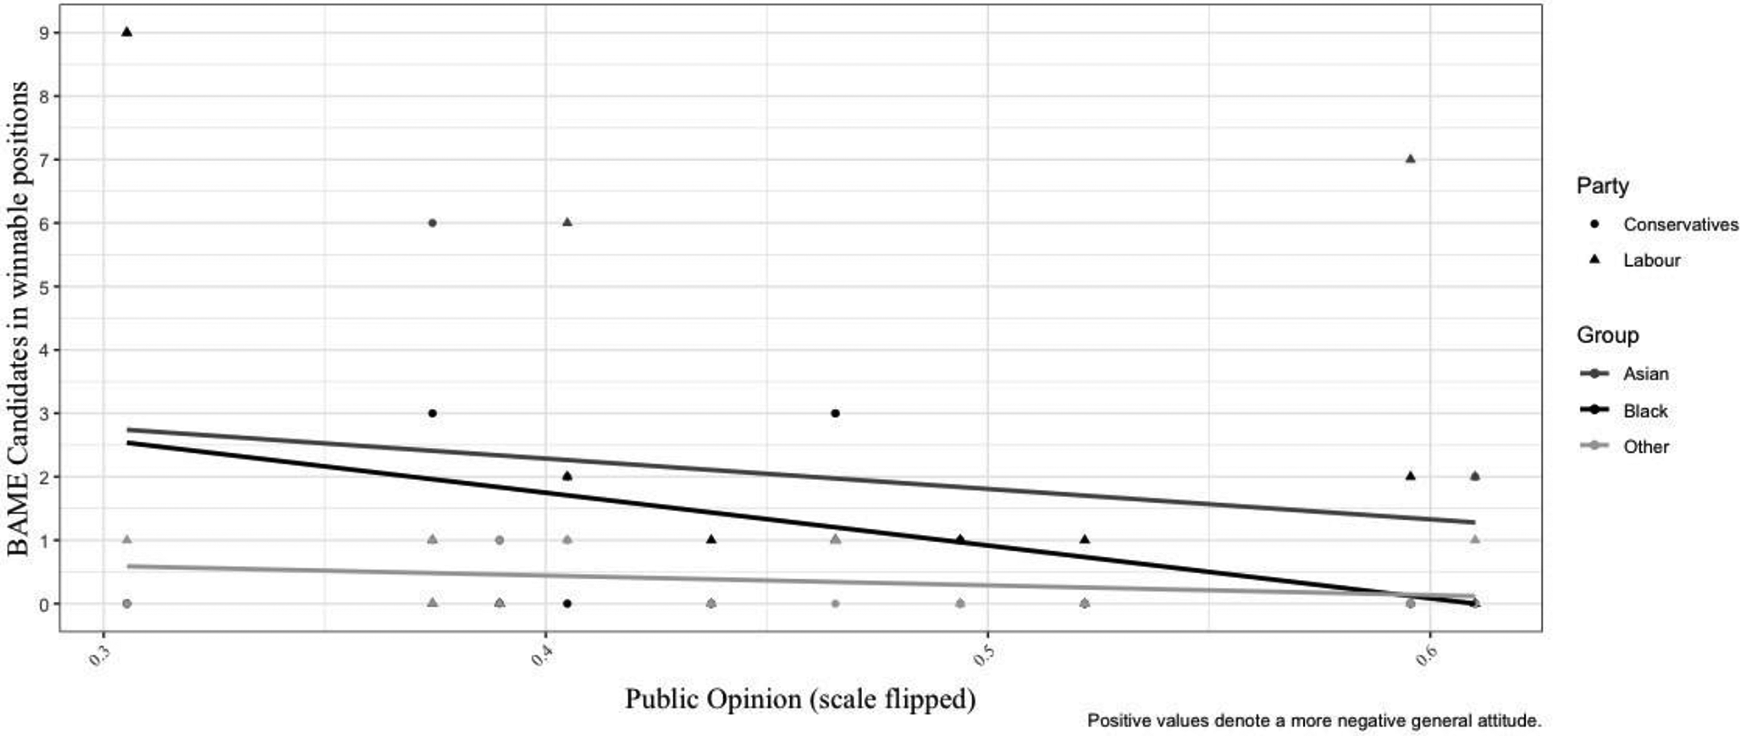
Bivariate relationship between public opinion and candidate opportunities, by major ethnic minority group. Sources: Parliamentary Candidates Study in combination with the author’s own data collection, and public opinion data from the BES, BSA, EVS, WVS, and ESS harmonised and aggregated by the author using the Stimson dyad-ratio algorithm.
The data suggest that while candidates from all major ethnic minority backgrounds appear to have fewer opportunities where public opinion becomes more restrictive, the slope is particularly steep for black candidates. On average, where public opinion is least restrictive, a party will field on average around two or three Black candidates in winnable positions. Where it was most restrictive, the average number of Black candidates in winnable positions comes down – on average – to zero. Simple multivariate regression analysis on these data points (controlling for candidate party in addition to public opinion) confirmed negative slopes for all groups, but Black candidates were the only group with a coefficient credibly/significantly away from zero. 21 This is an important first insight into how the relationship between public attitudes and candidate opportunities may play out differently for candidates from different ethnic backgrounds, but further and more rigorous research (including more elections and a formal modelling process) is required (and strongly encouraged) before any firm conclusions can be made.
Discussion
This research aimed to make two substantial, simultaneous contributions. Firstly, I aimed to demonstrate that there has been a systematic impact of public opinion on patterns of minority candidacy in British elections over the past 23 years. This in turn aimed to develop existing suggestions that the previously observed relationship between higher rates of anti-immigrant public opinion and lower levels of descriptive representation was being driven by this strategic placement of minority candidates away from ‘winnable’ contests in contexts of higher public hostility towards immigration. The empirical research suggests that there is indeed a substantively important relationship between public opinion and candidate opportunities, and that we can expect ethnic minority candidates to be systematically disadvantaged when public opinion is at its most restrictive. Preliminary evidence also suggests that it is Black candidates in particular who may find themselves ‘shut out’ most when local publics are more hostile.
Secondly, I aimed to position this strategic placement of ethnic minority candidates away from winnable contests – the ‘punitive parties’ conception – at the centre of our frameworks for minority candidate opportunities and restrictions. As well as measurable and influential in their own right, these strategic considerations and manoeuvres may also explain a) why ballot-box ethnic penalties are not as substantially large as we might expect (because parties anticipate them and avoid giving voters the change to produce larger ones), and b) why party elites will work strategically and carefully themselves open and close opportunities for increasing diversity among candidates and parliamentarians, in turn creating strict and narrow conditions and opportunities for electoral success for minority candidates when party elites are not actively helping their cause (either nationally or locally).
That said, there is still much to do in terms of future research. These measures and findings are aggregations of phenomena which are ostentatiously driven at a much more individual/localised level. So, though the data shows strong support for the prior expectations outlined in this research and in previous literature, this predicates a certain arrangement of action and agency at the individual and party-selectorate level which aggregate analysis is not able to explain. It is assumed in this analysis that patterns of candidacy measured and correlated at the regional level with public opinion is in fact caused by decision making by party selectors. But patterns of candidacy like this could also be caused by decision making processes by candidates themselves – perhaps it is the case that minority candidates are simply not contesting selection when local public opinion is more hostile. Future research should proceed on this track and investigate and challenge those assumptions. One potential dynamic that this study was not able to test is the effect that individual (prospective) candidate ideologies might have on this relationship. Following from findings shown by Martin and Blinder (2020), could it be that an ethnic minority (prospective) candidate who takes strong and active positions on issues of race, ethnicity, and racial justice will be hindered by the effects noted in this paper to a greater extent than a minority (prospective) candidate who tries to plays down or avoid discussing these issues? Further, could the effect be mitigated or exacerbated by their parties’ own policy/ideological positions on issues of racial equality and representation?
Following research should also look to expand on the very preliminary findings in the final empirical section of this paper regarding the group-level dynamics of the effects, and continue to push research into considering diversity within diversity in its empirical frame. Lastly, at this individual level, future research should investigate potential concurrent and magnifying effects caused by intersectionality – what role does gender play in explaining these patterns, or exclusion based on social class or political networks? These are all questions which future research should look at and develop into a full story of the impacts that public opinion on immigration has on the political representation of minority groups through from candidacy to Premiership.
Supplemental material
Supplemental Material, sj-pdf-1-ppq-10.1177_1354068820973851 - High rejection, low selection: How ‘punitive parties’ shape ethnic minority representation
Supplemental Material, sj-pdf-1-ppq-10.1177_1354068820973851 for High rejection, low selection: How ‘punitive parties’ shape ethnic minority representation by Patrick English in Party Politics
Footnotes
Acknowledgements
I would like to thank the following individuals and groups for their invaluable help and contributions to this research: Maria Sobolewska, Andrei Zhirnov, Jennifer van Heerde-Hudson, Rosie Campbell, Beth Kühnel Mann, Negus Woldegiorgis, Alhussein Elrayah, Susan Banducci, Pippa Norris, Oliver Heath, Sir John Curtice, Stephen Fisher, Rob Ford, Will Jennings, Nicole Martin, Chris Wlezien, Chris Hanretty, Lorien Jasney, Gabriel Katz, Travis Coan, Steven M. Van Hauwaert, and the attendees of the 2018 Elections, Public Opinion, and Parties conference.
Declaration of conflicting interests
The author(s) declared no potential conflicts of interest with respect to the research, authorship, and/or publication of this article.
Funding
The author(s) received no financial support for the research, authorship, and/or publication of this article.
Supplemental material
Supplemental material for this article is available online.
Notes
Author biography
References
Supplementary Material
Please find the following supplemental material available below.
For Open Access articles published under a Creative Commons License, all supplemental material carries the same license as the article it is associated with.
For non-Open Access articles published, all supplemental material carries a non-exclusive license, and permission requests for re-use of supplemental material or any part of supplemental material shall be sent directly to the copyright owner as specified in the copyright notice associated with the article.