
Abstract
Background:
There is limited knowledge on the post-glymphatic structures such as the parasagittal dural (PSD) space and the arachnoid granulations (AGs) in multiple sclerosis (MS).
Objectives:
To evaluate differences in volume and macromolecular content of PSD and AG between people with newly diagnosed MS (pwMS), clinically isolated syndrome (pwCIS), or radiologically isolated syndrome (pwRIS) and healthy controls (HCs) and their associations with clinical and radiological disease measures.
Methods:
A total of 69 pwMS, pwCIS, pwRIS, and HCs underwent a 3.0 Tesla magnetic resonance imaging (MRI) including selective inversion recovery quantitative magnetization transfer imaging to compute the macromolecular-to-free water pool-size-ratio (PSR) and the free water relaxation rate (R1f), T2-weighted (T2-w) volumetric isotropic turbo-spin-echo to segment the PSD and AG, T2-w fluid-attenuated inversion recovery images to compute T2-lesions burden, and a T1-w sequence to quantify chronic black holes (cBHs) burden and brain parenchymal fraction.
Results:
After adjusting for age and sex, larger frontal (p = 0.006) and parietal (p = 0.047) PSD volumes along with larger parietal AG volumes (p = 0.033) were measured in patients compared to HCs. Parietal PSD volume correlated with cBH PSR (r = −0.430, p = 0.032).
Conclusion:
Upon diagnosis, enlarged structures in the post-glymphatic system may be observed, indicating a need for further investigation of their role.
Introduction
Current knowledge indicates that both the choroid plexus (CP) of the ventricles, along with the capillaries and the interstitium of the brain parenchyma, are sites of production of the cerebrospinal fluid (CSF) 1 and that the glymphatic system 1 is responsible for clearing the CSF of its waste products. The traditional view of the CSF production and elimination states that following production, CSF circulates to the fourth ventricle via the Sylvian aqueduct and the subarachnoid spaces through the foramen of Magendie and Luschka and is subsequently cleared through the dural venous sinus. 2 The arachnoid granulations (AGs) have also been recognized as sites of CSF reabsorption. 3 Recent studies, however, challenge this view. For example, it is now suggested that CSF may be absorbed into the bloodstream also through the capillaries and meningeal lymphatics. 4 The exact function and role of AG in humans is also not completely understood, 3 and novel evidence ascribes to the AG an auxiliary role, particularly during conditions of increased intracranial pressure. 5 Recent data also indicate that AG contains cells, cellular debris, and molecules signaling immune events, thus representing regionalized central nervous system (CNS) folds where the innate and adaptive immune systems communicate. 6 Last, regions surrounding the dural sinuses, such as the parasagittal dural (PSD) space,7,8 are also viewed as a potential site of fluid egress from the glymphatic system.
Given the growing literature recognizing the relevance of PSD and AG for the regulation of the CSF circuit, 1 our group has implemented novel non-contrasted magnetic resonance imaging (MRI)-based methods to assess the PSD and intravenous AG in vivo, non-invasively. These methods have been applied and validated to the aging population9,10 and to people with neurodegenerative diseases. 11
Multiple sclerosis (MS) is a disease of the CNS featured by a complex interplay between inflammatory and neurodegenerative processes. There is an increasing recognition of the importance of an altered CSF production-elimination system. At the production site, MRI and positron emission tomography (PET)-based studies showed an increased volume of CP along with increased fluorine-18 fluorodeoxyglucose uptake, both interpreted as indirect indicators of inflammatory activity. 12 Associations between CP and white matter (WM)-lesion volume, disability accumulation, and retinal thinning have also been reported. 12 At the elimination site, only a few studies have been performed thus far assessing the CSF clearance system in pwMS using the diffusion tensor images derived from water diffusivity along the perivascular space (DTI-ALPS)13,14 which is considered a proxy of CSF diffusivity and clearance along the perivascular spaces. Lower DTI-ALPS values were found in pwMS relative to healthy controls (HCs), 13 and in people with progressive MS relative to those with relapsing-remitting MS, inferring a link between an altered CSF clearance and disease severity. 13 However, no previous studies assessed the integrity of post-glymphatic structures such as the PSD or AG in MS. Although recent studies suggest that these structures account for a small amount of clearance of the CSF, they represent an important interface between the CNS and peripheral immune cells. 8
To fill this knowledge gap, here we leverage our previous work and use our in-house developed MRI techniques and implemented automated algorithms to segment and measure the volume and macromolecular and water content of PSD and AG. We used selective inversion recovery quantitative magnetization transfer imaging (SIR-qMT) from which we derived the macromolecular-to-free water pool-size-ratio (PSR) and the free water relaxation rate (R1f) maps 15 to measure the degree of tissue injury and the macromolecular content of PSD and AG. PSR and R1f (1/T1) are considered indirect measures of tissue macromolecular and water content, respectively, as previously validated against histoathology.15–17 Clinical studies in our group also showed that PSR distinguishes MS lesions from non-lesional areas with a higher degree of accuracy compared to radial diffusivity and magnetization transfer ratio.18,19
We tested the hypothesis that alterations in morphology of the PSD and AG are present as early as the time of disease diagnosis and even in the pre-clinical phase are associated with the quantity and quality of tissue injury in MS.
Subject/methods and materials
Ethics, participants, and study design
This study followed the Health Insurance Portability and Accountability Acts of 1996 (HIPAA) regulations for US studies. The institutional review board (IRB) of the Vanderbilt University Medical Center and the Veterans Health Administration approved the study and each participant signed an informed consent before being enrolled.
A total of 69 participants, including individuals with newly diagnosed MS (pwMS hereafter) 20 and clinically isolated syndrome (pwCIS) 20 based on the 2017 revised McDonald’s criteria, 20 and radiologically isolated syndrome (pwRIS) 21 as defined by Okuda and collaborators, 21 and HCs were consecutively enrolled. Patients were enrolled when their diagnosis was formally made by the referring neurologist. Thus, while some of them presented at the time of the first symptom (pwCIS) or the incidental discovery of an abnormal MRI (pwRIS), others were in retrospect found to have other clinical events or signs suggestive of clinically defined MS with either a relapsing-remitting or a primary progressive course. All the subjects were required to be steroid-free for at least 30 days before the scan day. All participants underwent a 3.0 Tesla (3T) brain MRI and a clinical assessment using the Expanded Disability Status Scale (EDSS), 22 the Timed 25-Foot Walking Test (T25-FW), 23 the 9-hole peg test (9-HPT), 24 and the minimal assessment of cognitive function in multiple sclerosis (MACFIMS) battery 25 within 60 days from the research MRI scan. The scores of the cognitive function tests were adjusted for age, sex, and level of education. Subjects were not included in the study if they were younger than 18 years; had contraindications to an MRI; other systemic or CNS autoimmune, neoplastic, or infectious illnesses; uncontrolled hypertension, diabetes, and hyperlipidemia; cardiac diseases; prior exposure to MS disease-modifying agents (aside from glucocorticoids given for a relapse); and history of ischemic or hemorrhagic stroke. Any participant showing clinical change between the enrollment date (which coincided with the clinical assessment) and the MRI was also excluded.
MRI acquisition
A whole-body 3T MRI scanner (Philips Healthcare, Best, The Netherlands) equipped with a volume transmit 32-channel receive head coil (NOVA Medical, Wilmington, MA, USA) was used. The MRI protocol included 2 mm-thick T1-w turbo spin-echo (TSE) and T2-w fluid-attenuated inversion recovery (FLAIR) as well as a three-dimensional T1-w post-Gd 1-mm-thick magnetization prepared rapid gradient echo (MPRAGE) sequences. The macrocyclic agent gadobutrol was injected at a dose of 0.1 mmol/kg of body weight. The interval between Gd injection and scanning was around 30 seconds. All the scans covered the entire brain, had no inter-slice gap, and were acquired axially. The research sequences relevant to this study included the SIR-qMT15,18,26 and a T2-w volumetric isotropic turbo-spin-echo acquisition (VISTA).9,10 Details of SIR-qMT and VISTA, both previously developed in our group,9,10,18 are reported in Table 1. Due to changes in the CSF flow with the circadian rhythm, 27 MRIs were all acquired between five and eight post meridiem.
Pulse sequence parameters.
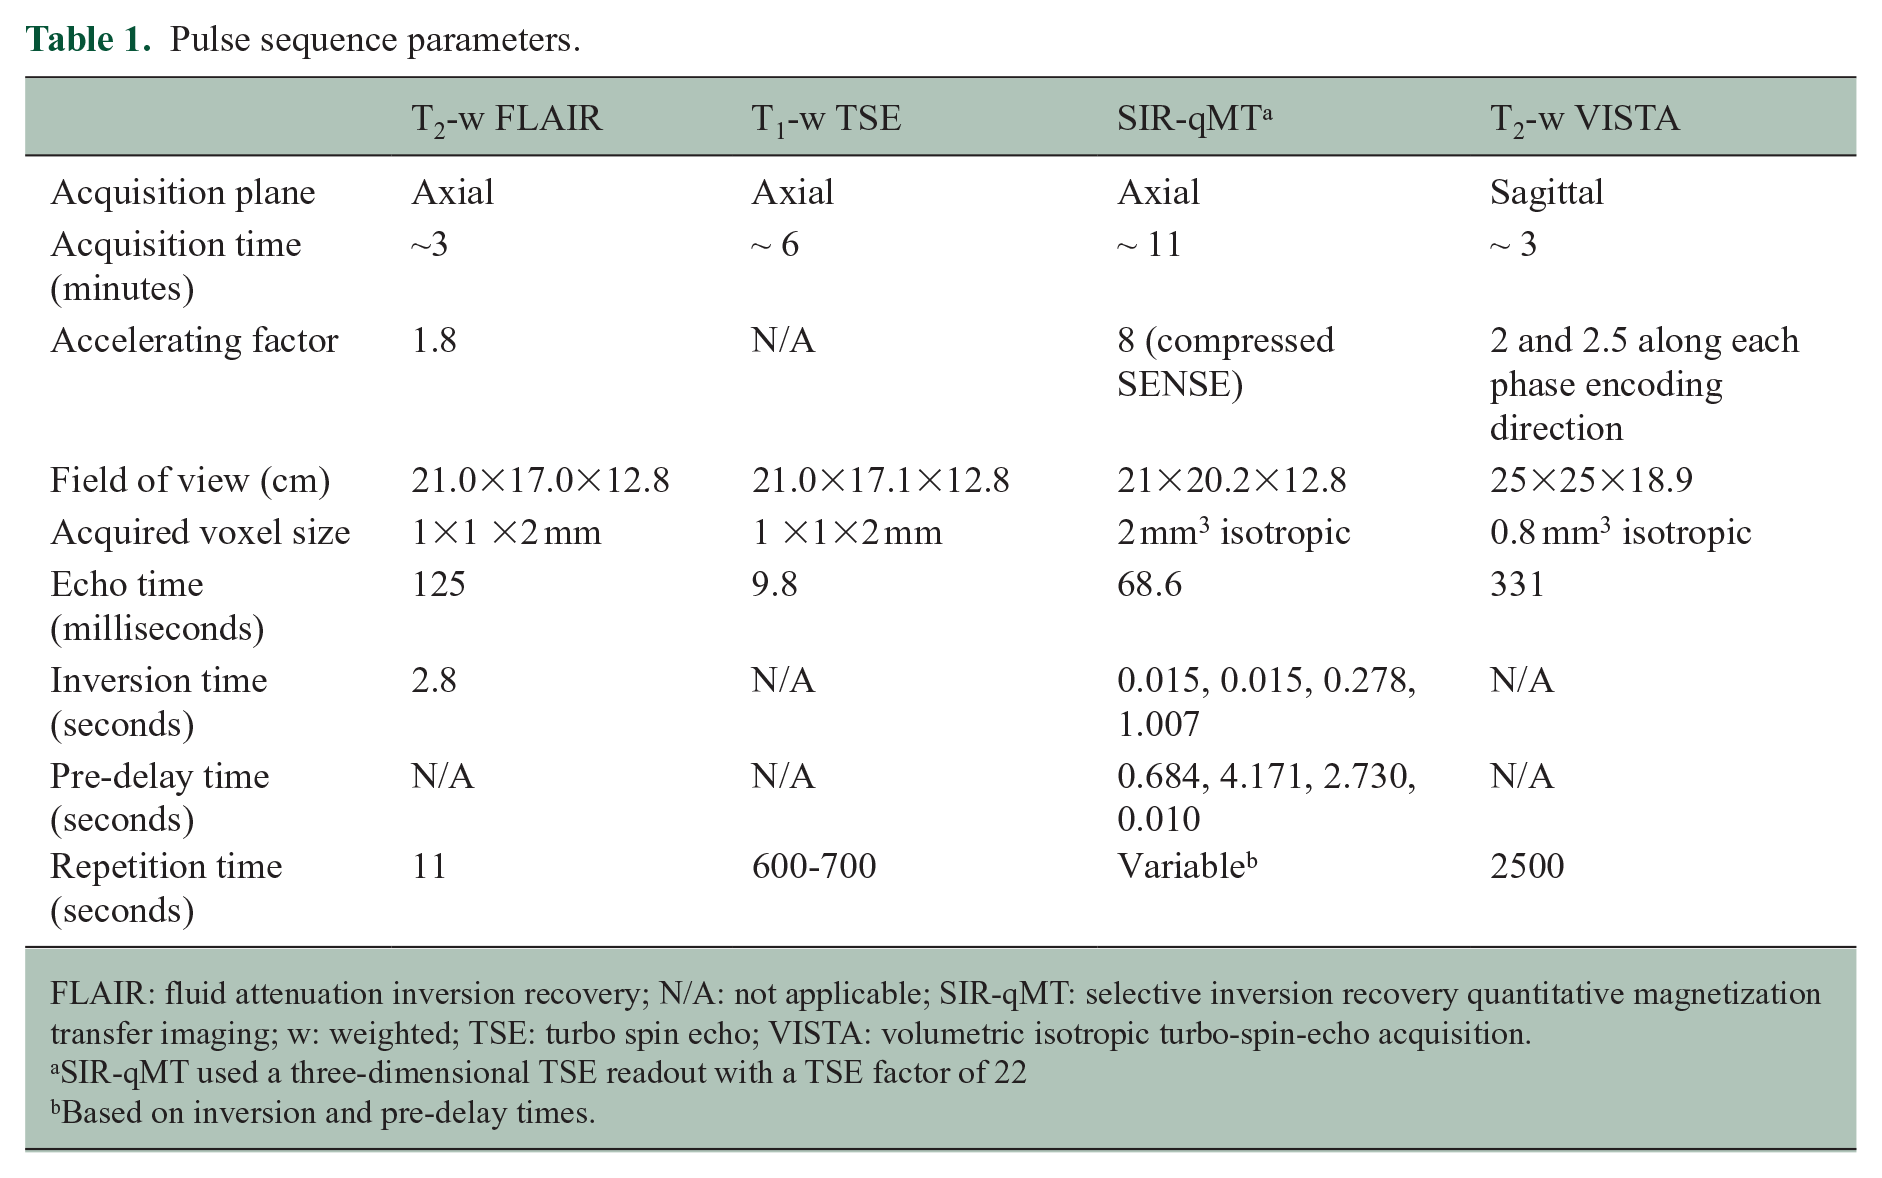
FLAIR: fluid attenuation inversion recovery; N/A: not applicable; SIR-qMT: selective inversion recovery quantitative magnetization transfer imaging; w: weighted; TSE: turbo spin echo; VISTA: volumetric isotropic turbo-spin-echo acquisition.
SIR-qMT used a three-dimensional TSE readout with a TSE factor of 22
Based on inversion and pre-delay times.
Image post-processing
Parametric map computation
SIR-qMT-derived PSR and R1f maps were calculated using previously published algorithms. 28
Image registration
T1-w TSE images, post-Gd MPRAGE, R1f, and PSR parametric maps were linearly registered to the T2-w FLAIR image using the FMRIB’s Linear Image Registration (FLIRT) tool in in the FMRIB Software Library (FSL) FSL. 29
WM-lesion identification, and volumetric and parametric computations
WM-lesion analyses were performed using visualization, graphic, and statistical tools available in the Medical Imaging Processing, Analysis, and Visualization (MIPAV) software version 7.3 (https://mipav.cit.nih.gov/). T2-hyperintense 30 and T1-hypointense lesions, for example, chronic black holes (cBHs) 31 and contrast-enhancing lesions (CELs) were identified by the main author (A.T.) and reviewed by the senior author (F.B.). CELs were subsequently excluded from further analysis. All WM-lesions were delineated manually; masks were then overlaid onto the PSR and R1f maps and corresponding quantities were derived.
Brain parenchyma fraction computation
Brain volumes were estimated using AssemblyNet 32 using the subject T1-w TSE MRI. AssemblyNet consists of a two-layer ensemble of convolutional neural networks estimating brain structures following the Desikan–Killiany–Tourville protocol. 32 AssemblyNet estimates total intracranial and brain parenchyma volume (i.e. total gray matter and WM volume). 32 Brain parenchyma fraction (BPF) was obtained by dividing the brain parenchyma volume by the intracranial volume.
PSD and AG volume computations
PSD segmentation masks were created using T2-w VISTA. A recently released software based on a machine learning approach (https://github.com/Center-of-Imaging-Biomarker-Development/spesis) was applied to automatically segment the PSD and AG. This software was built upon a stack of two fully convolutional neural networks, trained on scans acquired from a variety of different asymptomatic controls and participants suffering from various neurodegenerative diseases.
This method automatically delineates the PSD, AG, and superior sinus lumen using T2-w signal intensities. The method segments only type 1 intravenous AG which are the AG within the superior sagittal sinus. 3 The details and validation of this method were previously reported.9–11 The PSD and AG were divided into four subregions: prefrontal, frontal, parietal, and occipital PSD. The prefrontal and frontal regions were separated by a plane passing through the pituitary gland and the rostrum of the corpus callosum, with the prefrontal area located ventrally and the frontal area dorsally. The parietal region was distinguished from the frontal region using the central sulcus and extended to the parietal–occipital fissure, while the occipital region was defined from the fissure to the most posterior part of the PSD and AG. The resulting masks were transformed back to the native T2-w space using the inverse transformation. The quality of the segmentations was assessed visually by the two first co-authors and corrected if necessary. Figure 1 illustrates PSD segmentations in an HC (Figure 1(a) and (c)) and a pwMS (Figure 1(b) and (d)), while Figure 2 shows the AG segmentations in an HC (Figure 2(a) and (b)) and a pwMS (Figure 2(c) and (d)).
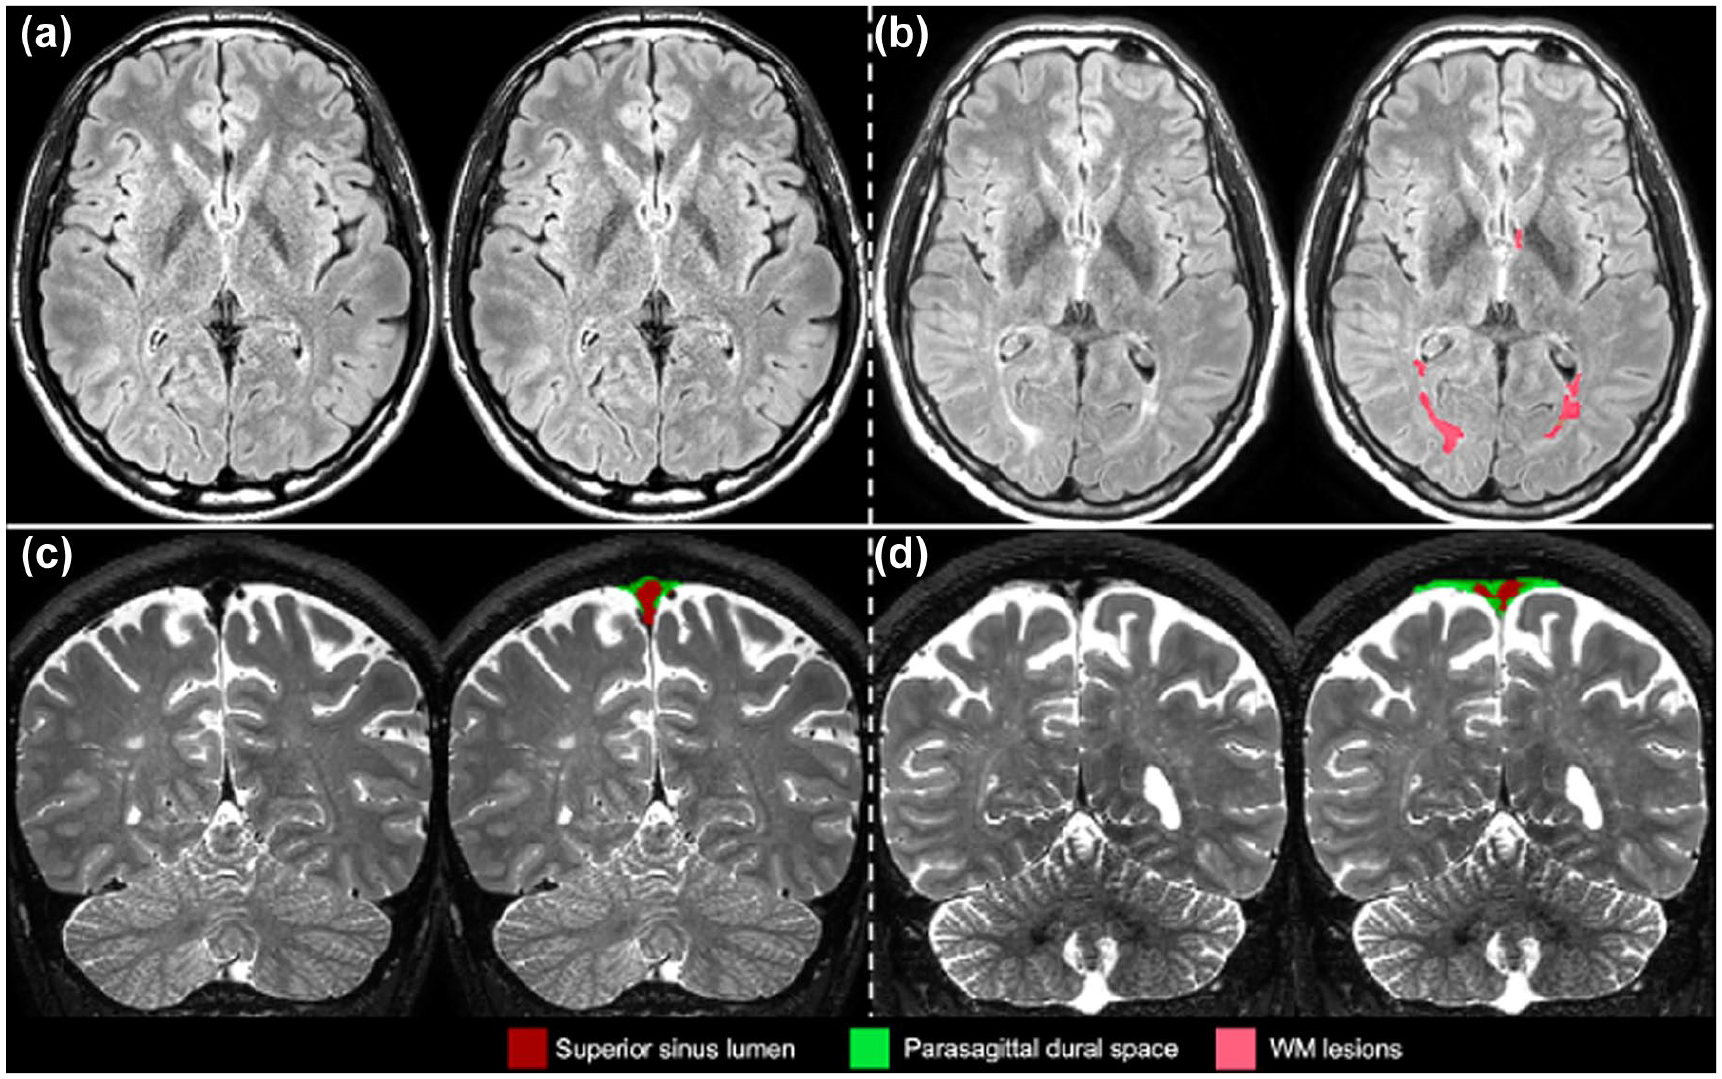
Parasagittal dural space segmentation. Case examples illustrating parietal parasagittal dural space (PSD) hypertrophy associated with the increase in white matter (WM) lesion prevalence. From top to bottom panels (a and b), axial view of a T2-weighted fluid-attenuated inversion recovery image with lesion segmentation overlaid and coronal view of T2-w volumetric isotropic turbo-spin-echo acquisition image with PSD segmentation overlaid. Panels (a and c) represent data collected from a healthy control; panels (b and d) represent data collected from person with multiple sclerosis.
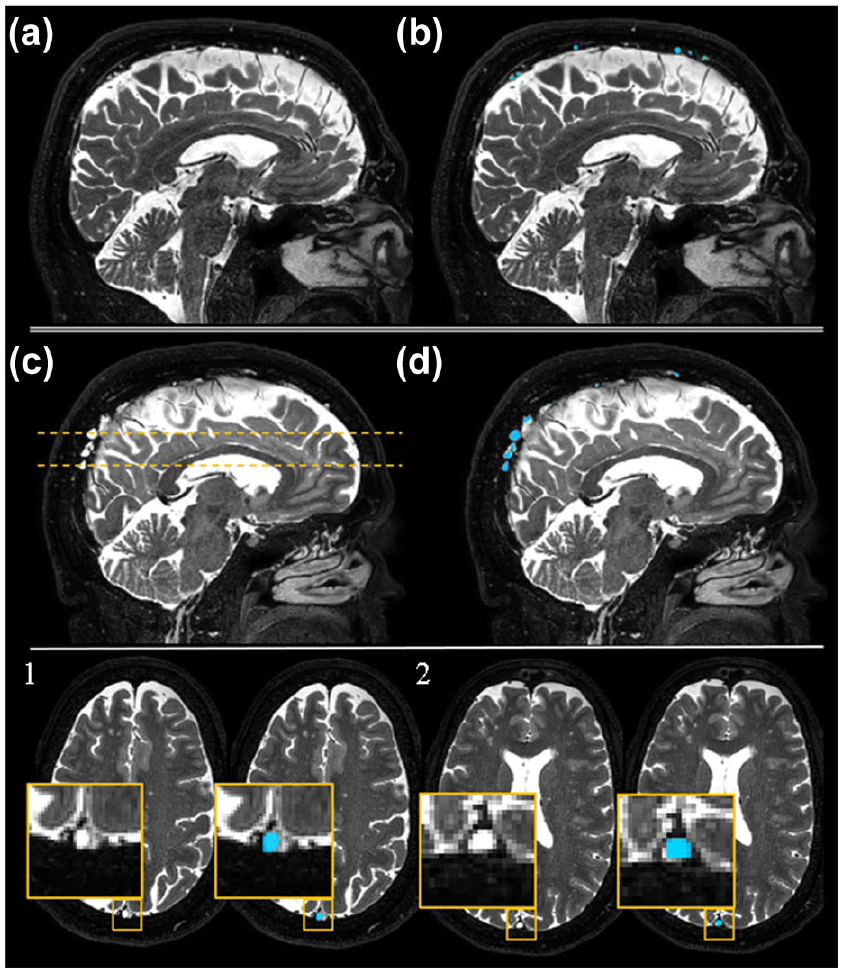
Arachnoid granulations segmentation. Case examples illustrating arachnoid granulations (AG) hypertrophy in a person with multiple sclerosis compared to a healthy control. Panels (a–d) show a sagittal view of a T2-w volumetric isotropic turbo-spin-echo acquisition image before (a and c) and after (b and d) overlying the AG segmentations. Panels (a and b) represent data collected from a healthy control; panels (c and d) represent data collected from person with multiple sclerosis. Panels (1 and 2) represent axial cuts of two AGs from (c and d). For each axial cut, we present a closer look at the AG using a yellow inset before and after overlying the AG segmentations.
Cerebral lobe and regional lesion segmentation
Brain lobe maps were produced in each subject’s native T2-FLAIR to investigate the regional distribution of lesion load (i.e. volume and number of lesions within the different lobes of the brain). The brain lobe map from the MNI ICBM152 non-linear symmetric 2009a atlas 33 was aligned to each individual scan using advanced normalization tools (ANTs). 34 First, a rigid and affine transformation was estimated; second, the symmetric-normalization method was computed to estimate non-rigid transformations. The final transformation parameters were applied to the lobe map, producing delineation of the lobes in the native T2-FLAIR space. The T2-lesion masks were overlaid on the brain lobe atlas, and the number and volume of the T2-lesion across the different lobes were quantified. If a T2-lesion spanned several lobar territories, it was counted in all of them, while the volume was divided between the lobes according to the T2-lesion location.
Statistical analyses
Group (patients and HCs) differences in demographic, clinical, and MRI characteristics were assessed using chi-square (χ2) and t-tests as appropriate. PSD and AG volumes were normalized to the intracranial volume and log-transformed to normally distribute the variables. Subsequently, an unpaired t-test was used to assess group differences in AG and PSD volumes. An unpaired t-test was also used to compare total PSD or AG PSR and R1f between patients and HCs. Mean differences (MDs) and 95% confidence intervals (CIs) are reported. A multivariate linear regression analysis was performed to assess the effect of age and sex on the variables that were found to be significantly different between patients and HCs, as both sex and age are known to impact the PSD and AG volumes.
Based on the distribution of the data, associations between PSD and AG volumes and other clinical or MRI measures of disease along with total PSD and AG PSR and R1f values were quantified using the Pearson correlation analysis. A subsequent linear regression analysis was performed on the correlated pairs to adjust for the potential effect of age and sex.
Paired t-tests were used to assess differences in T2-lesion number and volume between different lobes of the brain. For all these statistical analyses, a p-value < 0.050 was considered significant. Given the exploratory and hypothesis-generating nature of the study, no multiplicity corrections were applied. All the statistical analyses were performed using the Statistical Package for Social Sciences (SPSS) Statistics for Windows, Version 24.0 (IBM Corp, Armonk, NY, USA).
Results
We included 29 pwMS, 8 pwCIS, 6 pwRIS, and 26 HCs. Table 2 summarizes the demographic, clinical, and MRI characteristics of the study cohort, while Table 3 depicts scores measured at the MACFIMS battery.
Demographic, clinical, and MRI characteristics of the study cohort.
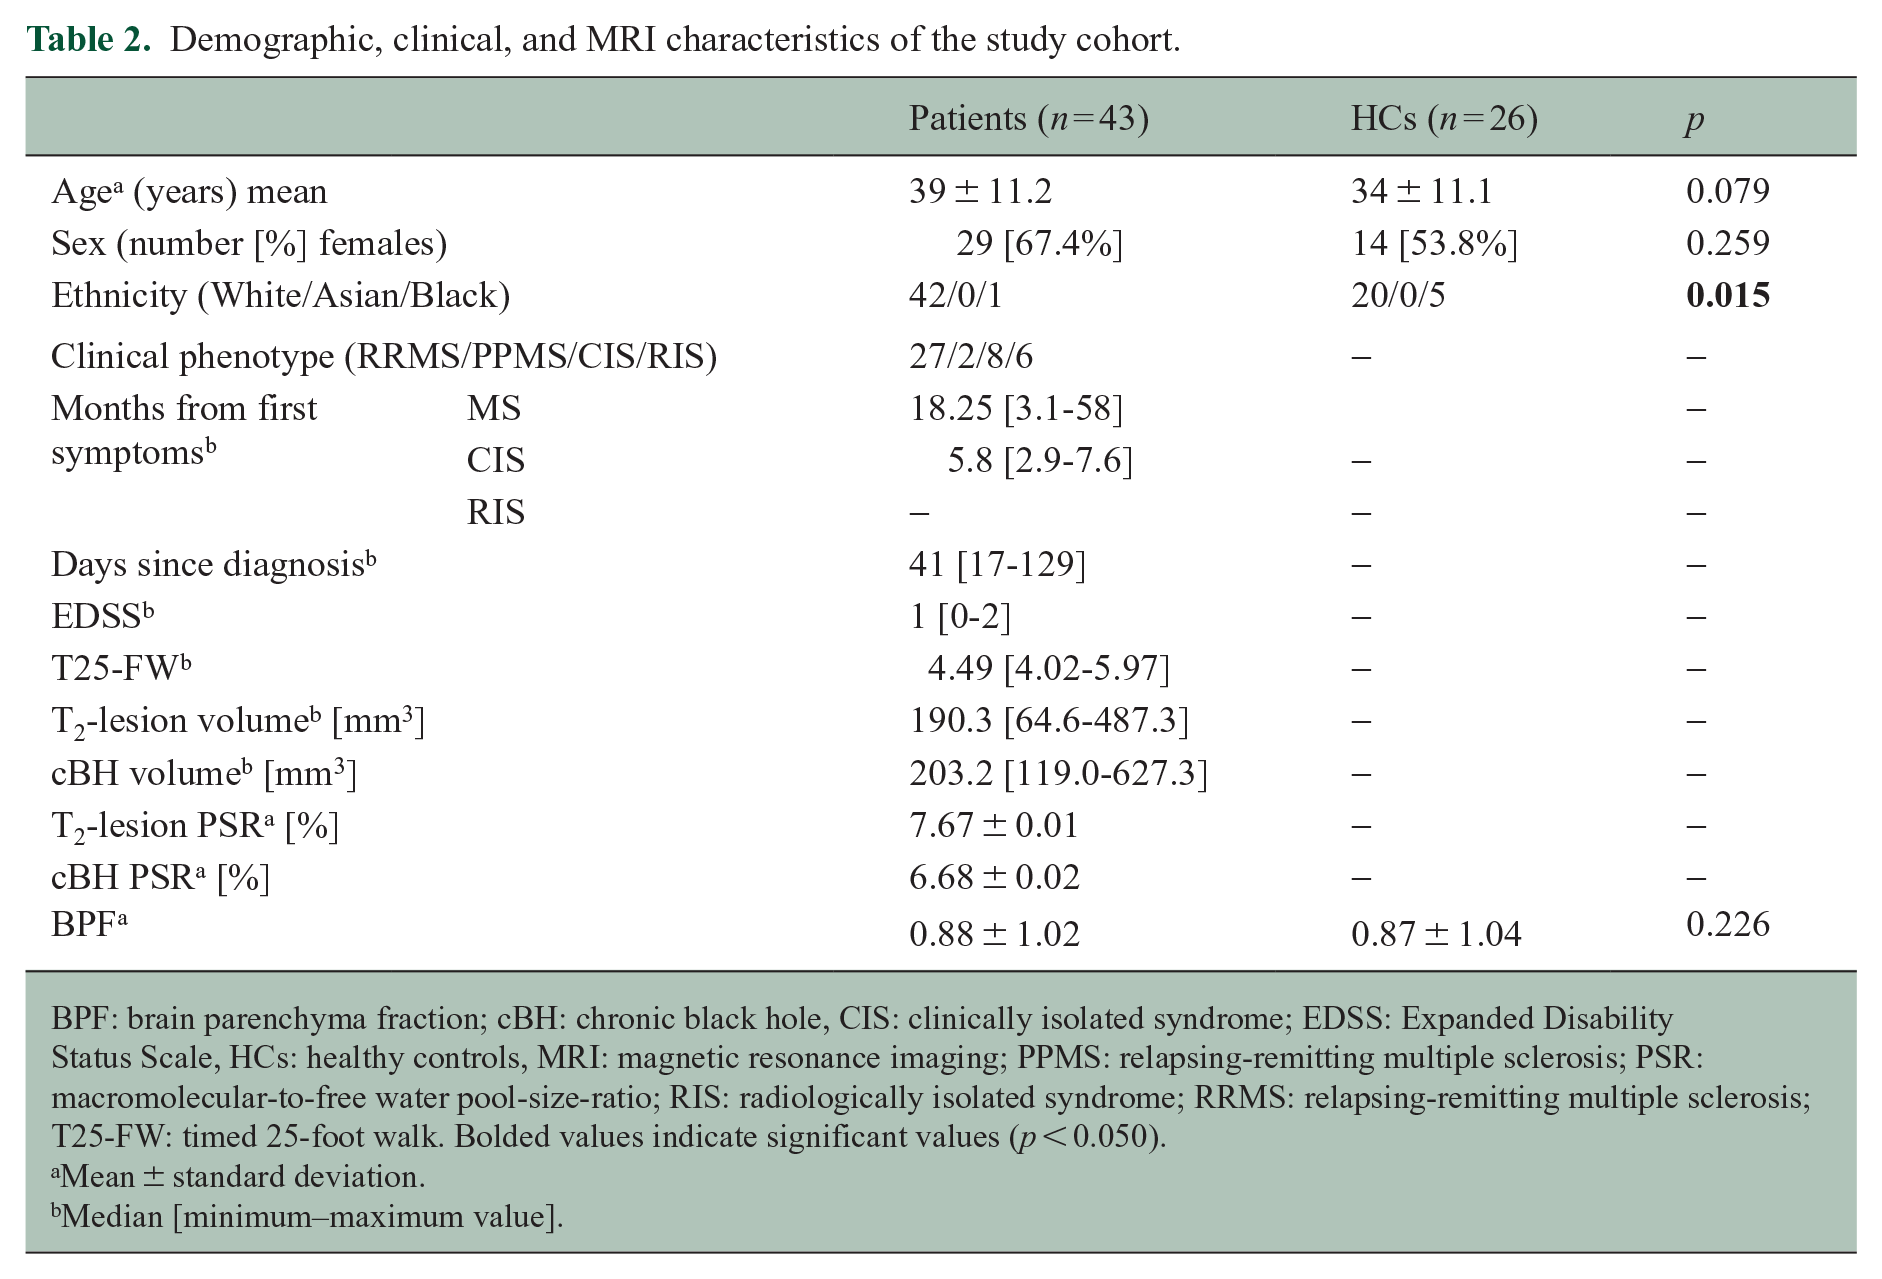
BPF: brain parenchyma fraction; cBH: chronic black hole, CIS: clinically isolated syndrome; EDSS: Expanded Disability Status Scale, HCs: healthy controls, MRI: magnetic resonance imaging; PPMS: relapsing-remitting multiple sclerosis; PSR: macromolecular-to-free water pool-size-ratio; RIS: radiologically isolated syndrome; RRMS: relapsing-remitting multiple sclerosis; T25-FW: timed 25-foot walk. Bolded values indicate significant values (p < 0.050).
Mean ± standard deviation.
Median [minimum–maximum value].
Cognitive scores.
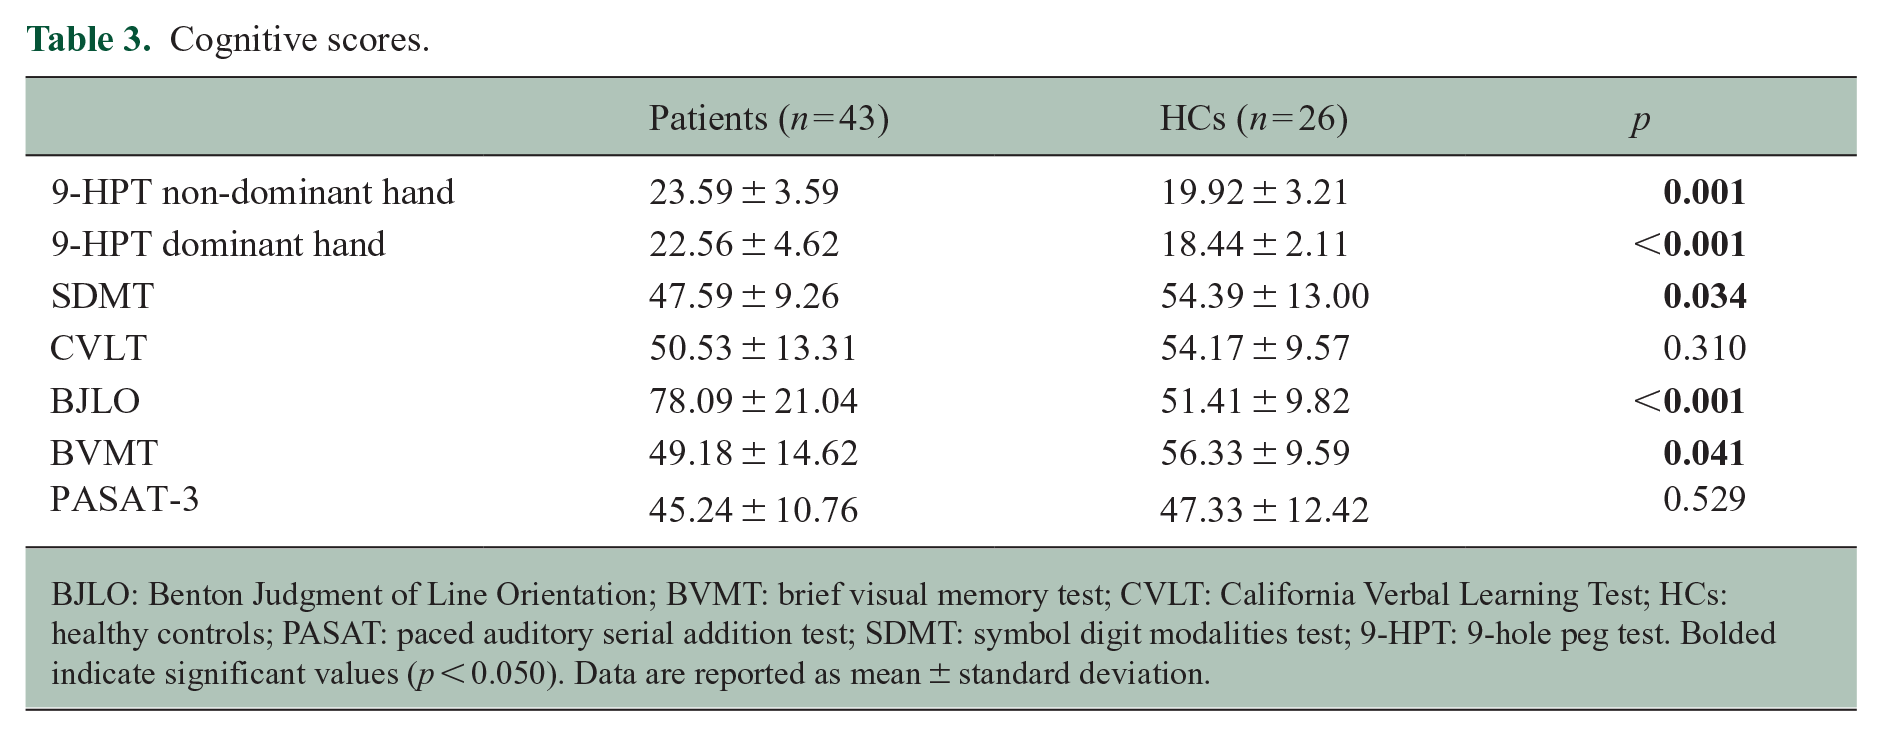
BJLO: Benton Judgment of Line Orientation; BVMT: brief visual memory test; CVLT: California Verbal Learning Test; HCs: healthy controls; PASAT: paced auditory serial addition test; SDMT: symbol digit modalities test; 9-HPT: 9-hole peg test. Bolded indicate significant values (p < 0.050). Data are reported as mean ± standard deviation.
We identified 1516 WM-lesions on the T2-w FLAIR of patients. Of these, 11 were CELs (identified on eight patients only), 407 were cBHs, and 1098 were T2-lesions only.
Differences in PSD, and AG volume and composition between patients and HCs
Frontal (MD = 0.12; 95% CI = 0.04 to 0.21; p = 0.004; Figure 3(a)) and parietal (MD = 0.11; 95% CI = 0.01 to 0.20; p = 0.023; Figure 3(b)) PSD volumes were larger in patients compared to HCs. These differences persisted upon adjusting for age and sex (β = 0.124; 95% CI = 0.037 to 0.212; p = 0.006 for the frontal PSD and β = 0.096; 95% CI = 0.001 to 0.191; p = 0.047 for the parietal PSD). On the contrary, there were no differences in the occipital and prefrontal PSD volumes (Table 4). Similarly, we did not find any group difference in PSR and R1f PSD values (Table 4).
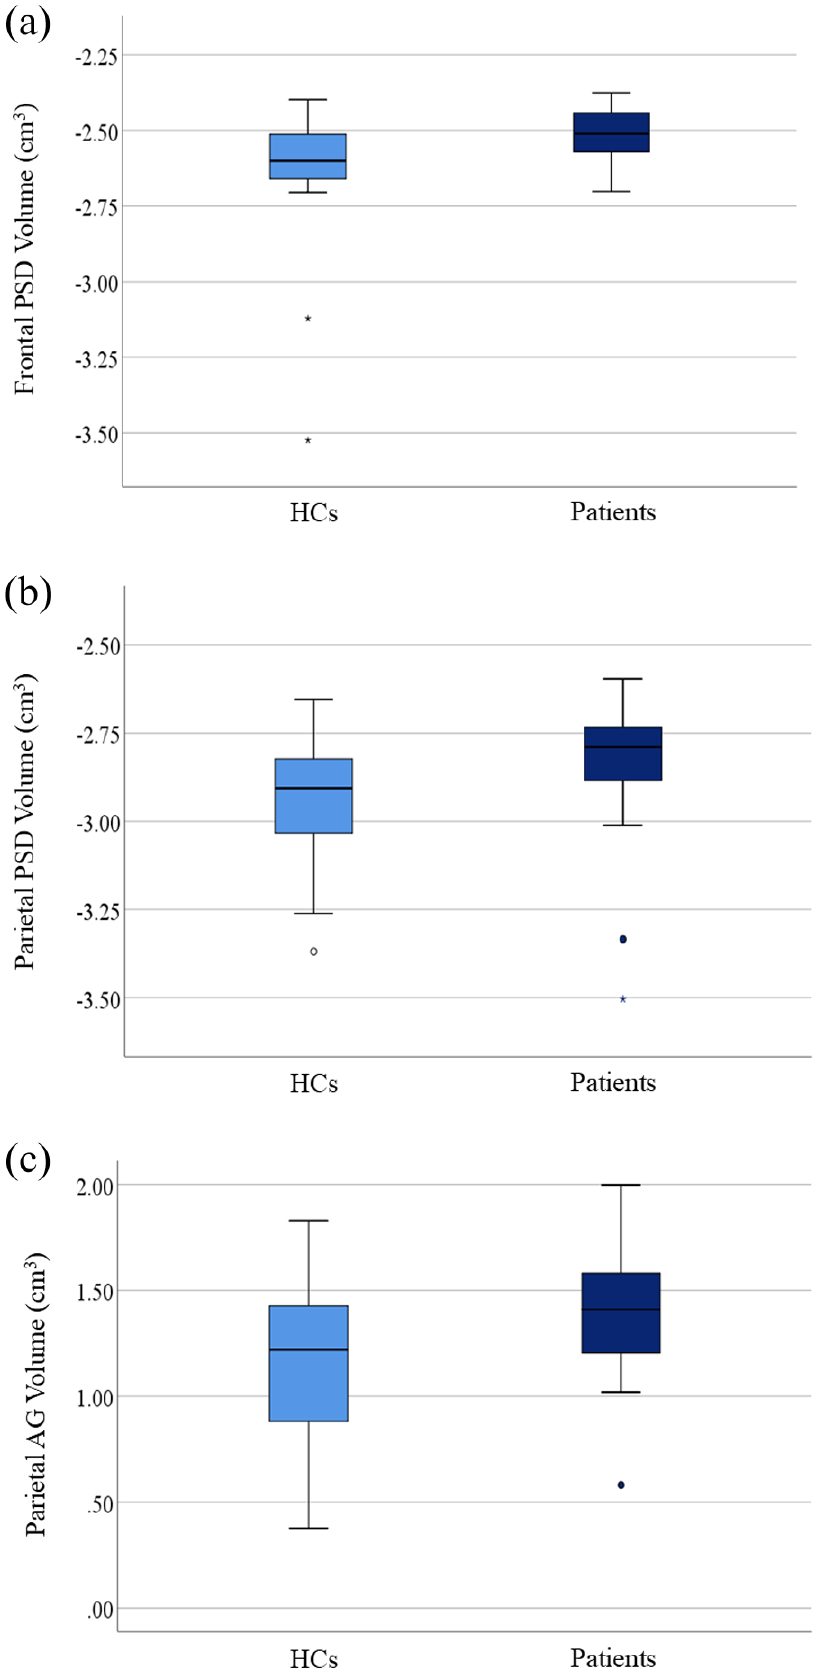
Group difference in parasagittal dural space and arachnoid granulation volumes. The dark blue boxes summarize values of people of multiple sclerosis, while the light blue boxes summarize those of healthy controls. In (a) and (b), the difference in frontal and parietal parasagittal dural space volumes, respectively is shown, while in (c), the difference in parietal arachnoid granulation volume is shown. The box represents the interquartile range, the horizontal line represents the median, and the whiskers represent the 95% confidence interval.
Differences in PSD and AG volumes, PSR, and R1f values.
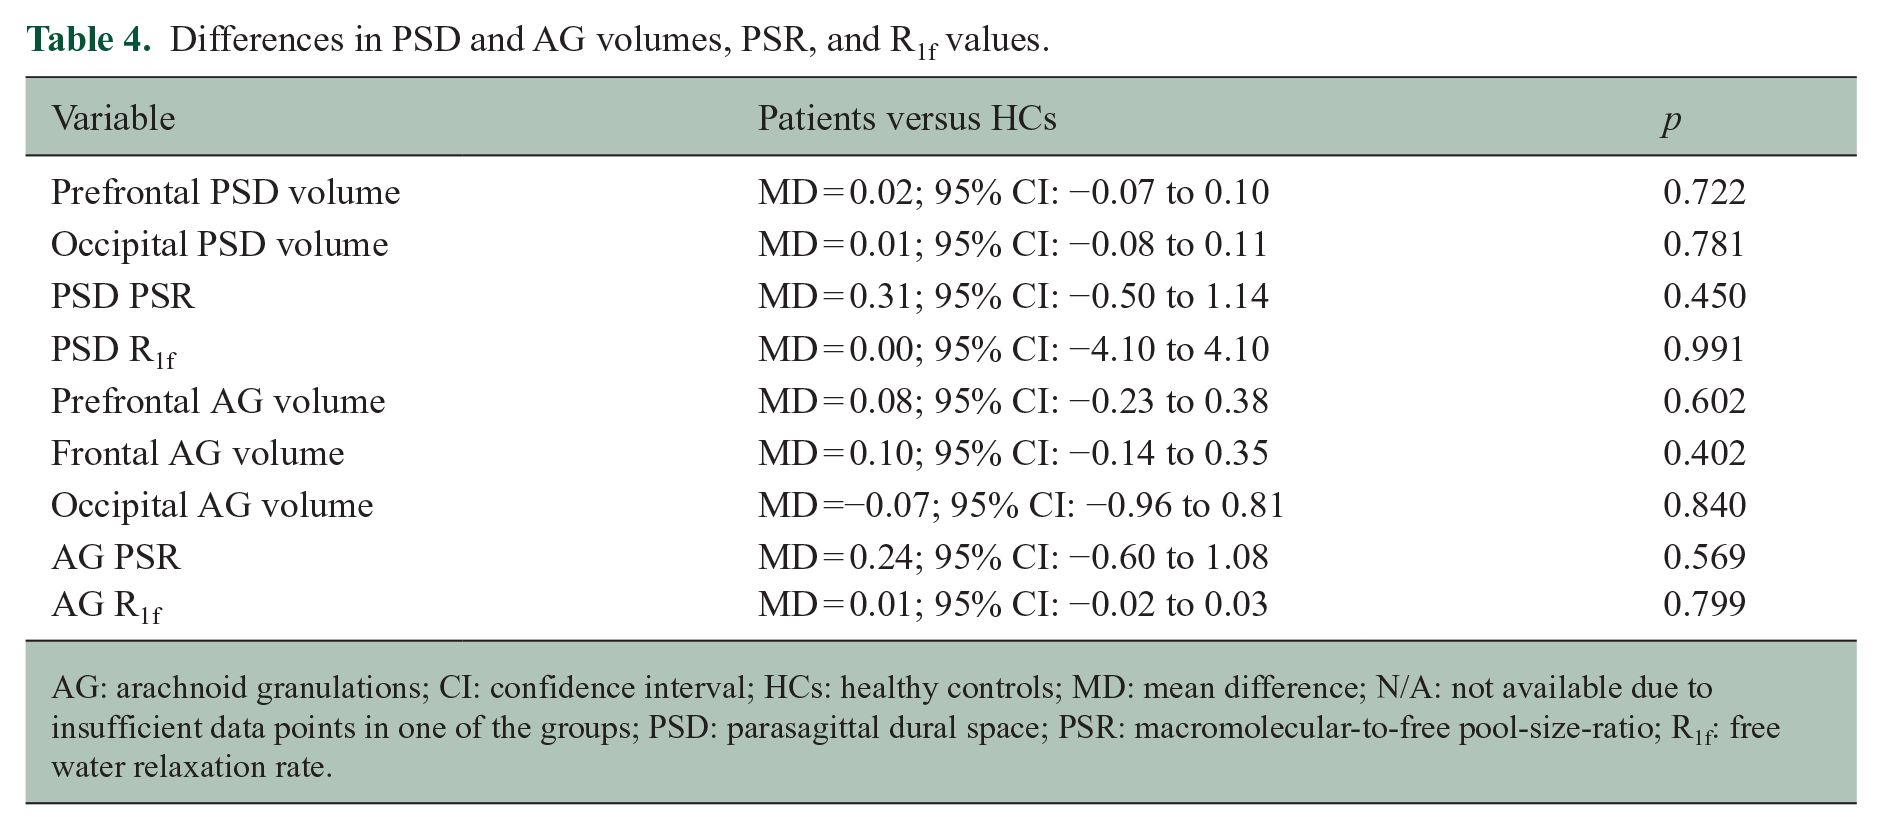
AG: arachnoid granulations; CI: confidence interval; HCs: healthy controls; MD: mean difference; N/A: not available due to insufficient data points in one of the groups; PSD: parasagittal dural space; PSR: macromolecular-to-free pool-size-ratio; R1f: free water relaxation rate.
Parietal AG volume was larger in patients relative to HCs (MD = 0.25; 95% CI = 0.04 to 0.46; p = 0.020; Figure 3(c)), also upon adjusting for age and sex (β = 0.201; 95% CI = 0.011 to 0.413; p = 0.033). On the contrary, prefrontal, frontal, and occipital AG volumes were not different between patients and HCs (Table 4). As seen for PSD, there were no group differences in PSR and R1f AG values (Table 4).
Lobar distribution of T2-lesions
Table 5 details WM-lesion (referred as T2-lesion) number and volume in each of the four cerebral lobes (i.e. frontal, parietal, temporal, and occipital), and we summarize here the significant findings. The frontal lobe had higher T2-lesion number (MD = 12.43; 95% CI = 7.81 to 17.05; p < 0.001) and volume (MD = 1.53; 95% CI = 0.36 to 2.70; p = 0.012) compared to the occipital lobe, as well as a higher T2-lesion number (MD = 8.45; 95% CI = 4.54 to 12.37; p < 0.001) compared to the temporal lobe. The parietal lobe had higher a T2-lesion number relative to the occipital (MD = 5.95; 95% CI = 3.23 to 8.67; p < 0.001) and temporal (MD = 1.98; 95% CI = 0.512 to 4.12; p < 0.001) lobes.
T2-lesion number and volumes across brain lobes.
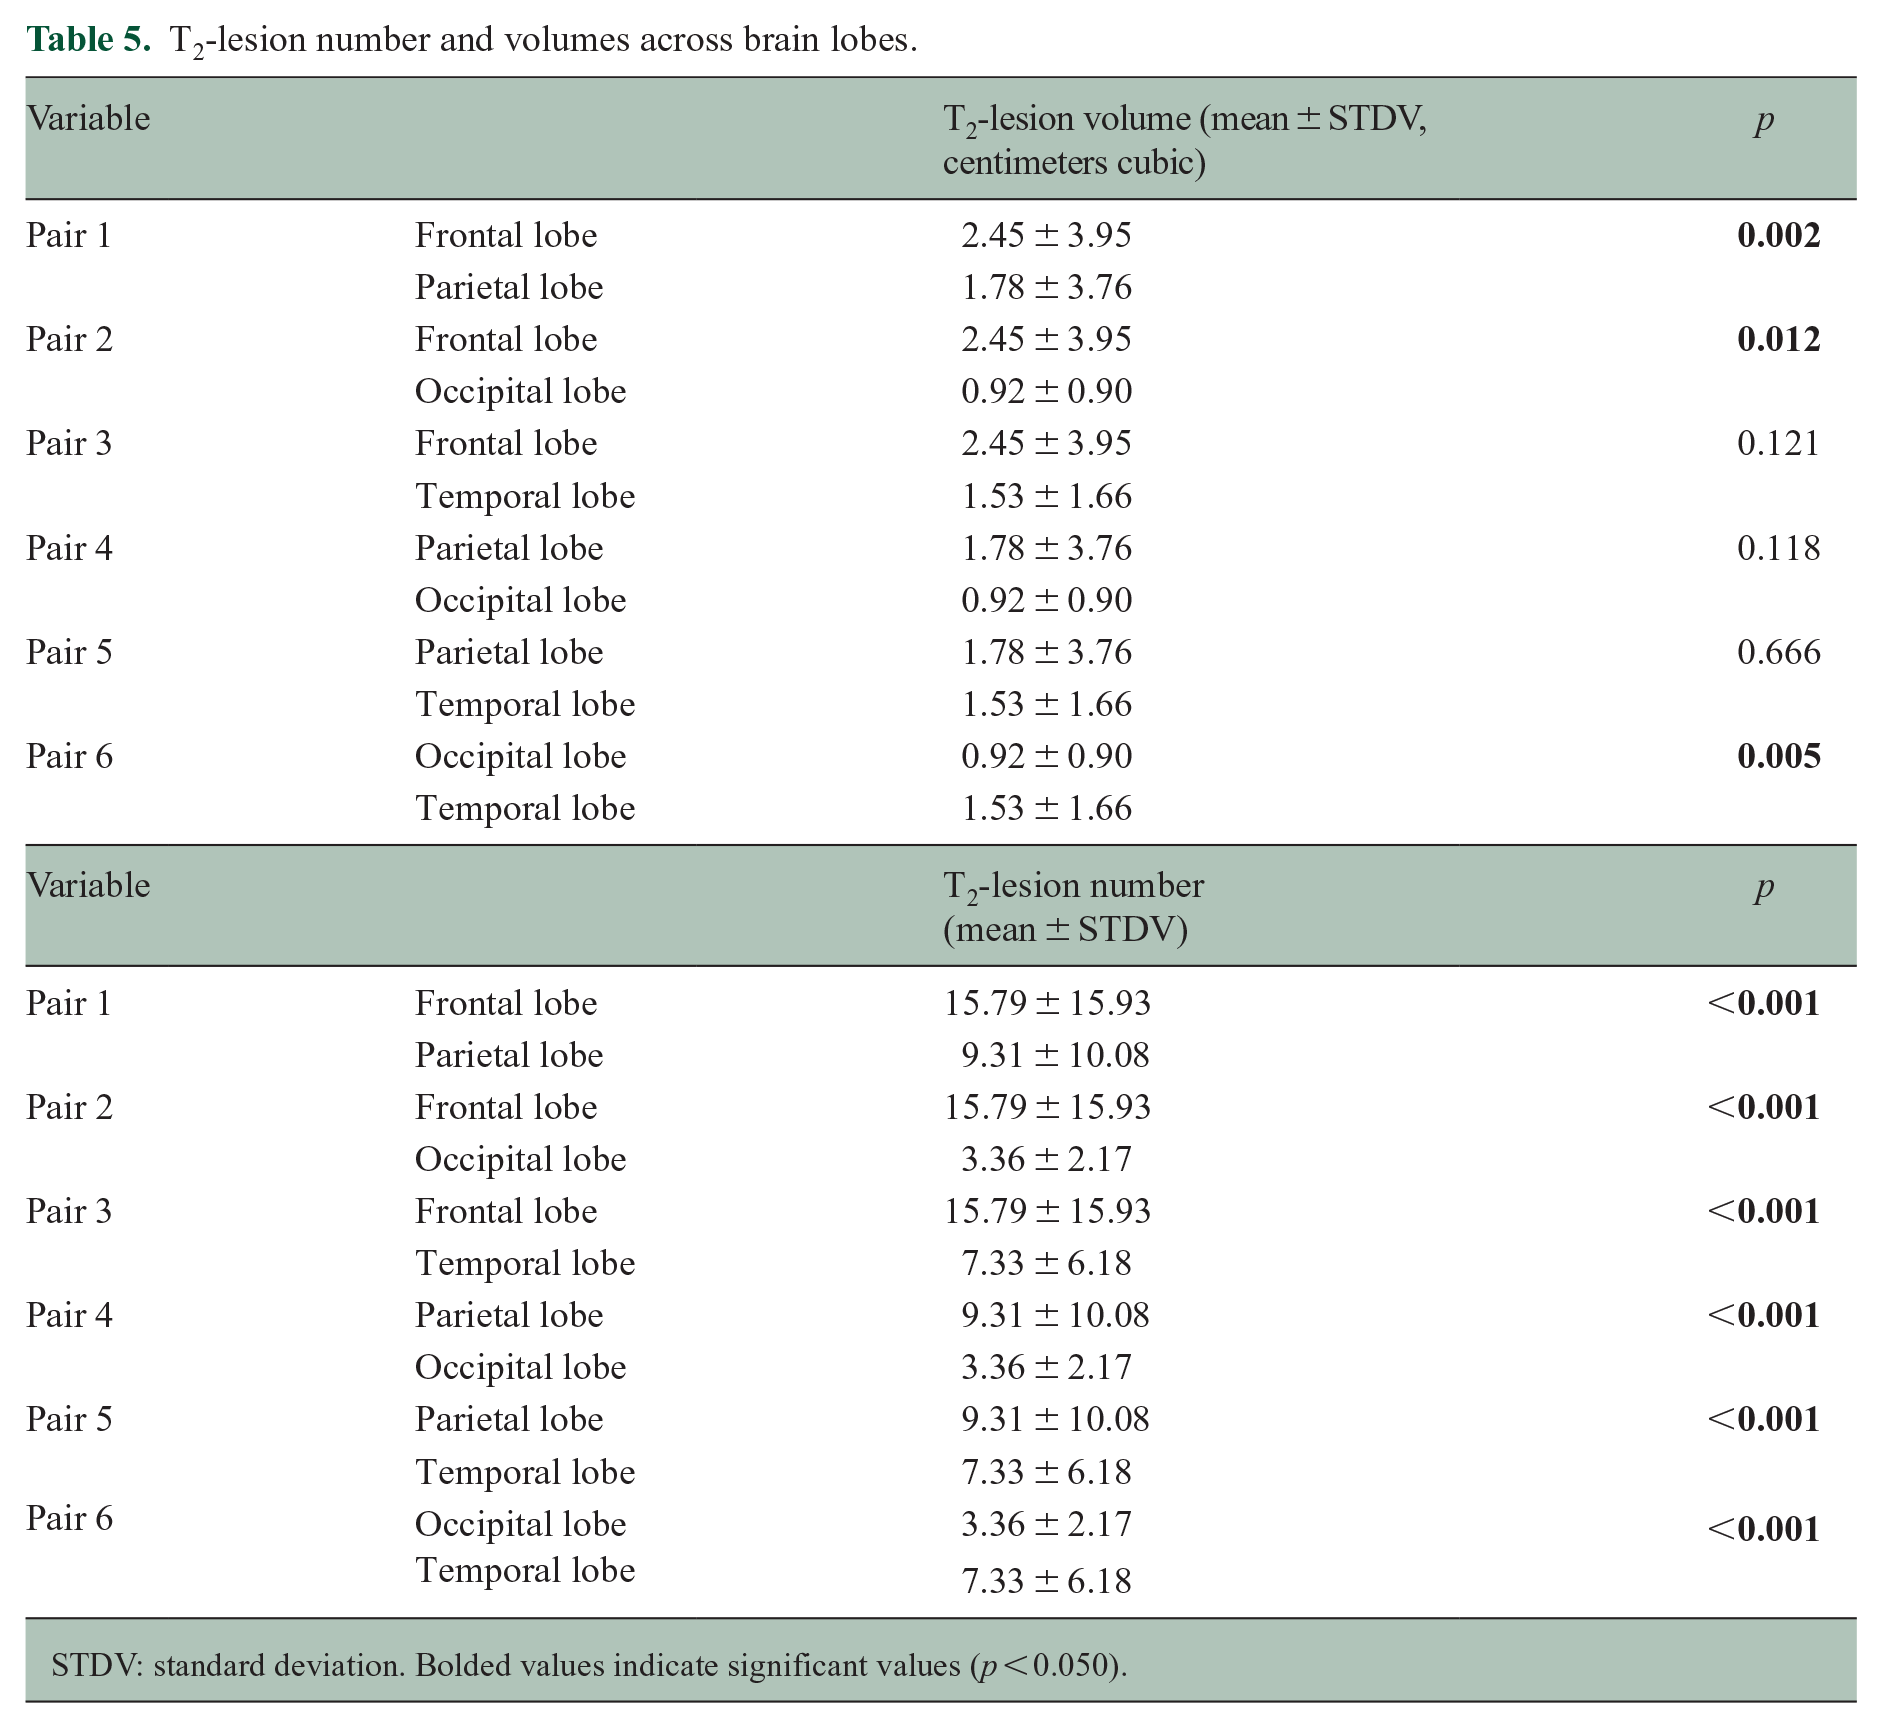
STDV: standard deviation. Bolded values indicate significant values (p < 0.050).
Associations between PSD/AG volumes and clinical/radiological measures of disease
Correlation tests were performed only within the patient cohort and focusing on the PSD and AG sites that were found to be significantly larger in patients compared to HCs.
Associations were seen between the parietal PSD volume and cBHs PSR (r = −0.430, p = 0.032; Figure 4(a)) and parietal PSD volume and PSD R1f (r = −0.286, p = 0.033; Figure 4(b)). Both associations remained significant after adjusting for age and sex (parietal PSD volume and cBHs PSR: β = −0.087; 95% CI: −0.167 to −0.01; p = 0.033; parietal PSD volume and PSD: R1f: β = −0.100; 95% CI: −0.180 to −0.01; p = 0.049). Statistical trends were also seen between the parietal AG volume and the EDSS scores (r = 0.439, p = 0.060) and parietal AG volume and cBHs volume (r = 0.481, p = 0.059). Furthermore, we note that the frontal PSD volume correlated with the 9-HPT scores of the dominant hand (r = −0.502, p = 0.003) in a paradoxical manner.

Correlation between parasagittal dural space or arachnoid granulation volumes and clinical and radiological metrics. The figures demonstrate the correlation between chronic black holes (cBHs) macromolecular-to-free water pool-size-ratio (PSR) and parietal PSD volume in (a); parietal PSD volume and PSD free water relaxation rate (R1f) in (b). The straight line represents the correlation line, while the curved lines represent the 95% confidence intervals.
Associations between other radiological and clinical metrics
We observed that cBH volume explained some of the variance of the Symbol Digit Modality Test scores (r = −0.371, p = 0.037), EDSS (r = −0.611, p = 0.010), and BPF (r = −0.438, p = 0.037). BPF was inversely associated with age (r = −0.672, p < 0.001) and EDSS score (r = −0.528, p = 0.004).
Discussion
Here, we assessed the volumetric changes of post-glymphatic structures hypothesized to be involved in the CSF flow circuits and neuroimmune surveillance, such as the PSD and the AG. We provide the novel demonstration that relative to HCs, frontal and parietal PSD as well as parietal AG volumes are larger in pwMS, pwCIS, and pwRIS as early as the time around disease diagnosis. We also demonstrate an association between parietal PSD volume and cBH PSR.
Cumulatively, our results highlight the potential relationship between alteration of crucial structures of the post-glymphatic pathways and MS. Our findings are in line with those on people with Alzheimer’s disease demonstrating increased volumes of the frontal and parietal PSD volumes 11 and associations between these volumes and increased beta amyloid deposition. 11
The reasons subtending our group (e.g. patients and HCs) differences are largely unknown at this time. We speculate that inflammatory and neurodegenerative processes associated with MS may result in acceleration of the fibrosis of the dural channels and consequential enlargement of the PSD. This finding was observed in people with Alzheimer’s disease who showed reduced visibility of intradural channels due to fibrosis. 35 Nonetheless, further mechanistic studies are needed to elucidate the meaning of our findings.
PSD and AG enlargements localized to the parietal and frontal regions only. Interestingly, those regions tended to have the largest WM-lesion burden relative to other regions. Whether enlargement of the PSD and AG volume is consequential to larger lobar disease burden or causative of it remains to be addressed. Interestingly, however, similar results were reported in people with Alzheimer’s disease. 11 In this patient population, the strongest accumulation of Aβ amyloid accumulation tends to occur in the frontal lobe, and only the parietal and frontal PSD volumes were described to correlate with global Aβ amyloid burden. 11 For both diseases, one must consider technical factors as potential explanators of our results. That is, frontal and parietal regions have the largest volumes compared to other PSD regions, making them more sensitive to disease- or age-induced changes or simply making these changes more measurable with currently available methods.
Corroborating the hypothesis of a possible relationship between the post-glymphatic structures and MS, we found an association between parietal PSD volumes and radiological measures of tissue injury such as cBHs PSR. cBHs are severe form of T2-lesions that are characterized by axonal loss. 36 These correlations, along with the ones seen on a regional level, highlight the possible association between the severity of disease damage, that is, axonal and myelin loss and post-glymphatic structures changes. No significant associations were instead seen between measures of clinical disability and PSD/AG-related metrics, aside from a trend seen between the parietal AG and the EDSS score. It is possible that the overall low levels of disability of our cohort affected this outcome. We found an association between frontal PSD volume and 9-HPT in an inverse direction of all other associations in our study. We think this finding was coincidental and mathematical in nature that does not carry clinical relevance.
It is also important to note that the radiological definition of AG still needs further validation. Intravenous AG (type I) can be visualized using high-resolution T2-w MRI. 3 In our work, we used commonly accepted anatomical descriptions of intravenous AGs as also described in Shah et al.’s 3 study combining histology and MRI methods. Furthermore, our group has previously trained the segmentation model used in this study on data manually annotated by an expert neuroradiologist. 10 Upon comparison with manual annotation, the automatic delineation demonstrated satisfactory accuracy, with Dice similarity and Pearson’s coefficients of 76.6% and 95%, respectivaly. 10 Therefore, while we acknowledge that the model could be further improved to enhance detection accuracy, we believe that the identified structures are indeed anatomical intravenous AGs and that the findings can be interpreted accordingly.
Study limitations and conclusions
A few limitations should be acknowledged before drawing definitive conclusions. First, the low sample size of our cohort with early MS, relatively homogeneous clinical features limited the array of the statistical analyses. Differences across MS phenotypes or between patients with and without CELs remain unknown, and so the overall longitudinal trajectory of the PSD and AG changes we observed. At the same time, one needs to consider that cohorts like ours represent a unique opportunity to evaluate the natural history of disease free from the effect of disease-modifying agents. Second, although all subjects were imaged within a limited and consistent time window of the day to minimize the impact of the circadian rhythm on the CSF dynamics, the circadian cycle is subjective and may also be dependent on the sleep quality, a factor that was not measured in our study. We note, however, that none of the study participants was a nightshift worker. Last, we only report results related to intravenous AG within the superior sagittal sinus, and it is unclear how generalizable to AG of other sites our data can be. These AG are located as dome-shaped structures within the superior sagittal sinus. Type 2 and 3 AGs are in the dural stroma and within the skull, respectively. Our automated software was solely trained to detect the projections within the superior sagittal sinus (type 1 AG). Furthermore, due to resolution limitation, only intravenous AG > 2 mm3 could be detected which is a limitation for small AG detection.
Notwithstanding these considerations, we believe our study based on non-invasive imaging techniques shows for the first time that as early as the time of disease diagnosis, PSD and AG are larger in pwMS compared to HCs. Future studies are warranted to explore these changes longitudinally in cohorts of patients with more heterogeneous MS phenotypes and associated tissue injury to evaluate whether this association represents causation, consequence or is rather an epiphenomenon. Future work is also warranted to validate the use of our methods and the generalizability of our results in independent cohorts of patients.
Footnotes
Acknowledgements
We are grateful to our patients and their families along with all the HCs who agreed to participate in this study. We thank Mr Reece Clarke and Mr Keejin Yoon for their invaluable help in setting up the study; the personnel of the Vanderbilt University Institute of Imaging Science for assistance with scanning; and Mrs Salma AshShareef and Pragnya Adapa for assistance with scanning and initial image analysis. This manuscript is dedicated to the sweet memory of Mr. Oscar Castro.
Author Contributions
F.B., M.J.D., K.H., and A.T. were involved in conceptualization. A.T., K.H., J.X., C.G., T.V., C.C., J.E.E., S.S., C.M., R.D.D., M.J.D., and F.B. were involved in data curation. A.T. was involved in formal analysis. M.J.D. and F.B. were involved in investigation and methodology. F.B. was involved in project administration, resources, and software. A.T. and F.B. were involved in writing the original draft. M.J.D. F.B. and K.H. were involved in supervision, and all the authors were involved in reviewing and editing the manuscript.
Data Availability Statement
The data is available from the corresponding author upon reasonable request.
Declaration of Conflicting Interests
The authors declared no potential conflicts of interest with respect to the research, authorship, and/or publication of this article.
Funding
The authors disclosed receipt of the following financial support for the research, authorship, and/or publication of this article: This study was primarily supported by the Veterans Health Administration (I01CX002160-01A1: A.T., J.X., and F.B.). Additional support includes the National MS Society (RG-1901-33190: A.T., C.G., F.B. and RG-2111-38720: R.D.D.) and the Voros Innovation and Impact Fund (F.B. and C.G.).