
Abstract
Background:
Macrophage migration inhibitory factor (MIF) is a cytokine linked to multiple sclerosis (MS) progression that is thought to be inhibited by ibudilast. SPRINT-MS was a phase 2 placebo-controlled trial of ibudilast in progressive multiple sclerosis (PMS).
Objective:
To determine whether baseline MIF levels predict imaging outcomes and assess the effects of ibudilast on serum and cerebrospinal fluid (CSF) MIF levels in people with PMS treated with ibudilast.
Methods:
Participants in the SPRINT-MS trial were treated with either ibudilast or placebo and underwent brain magnetic resonance imaging (MRI) every 24 weeks over a duration of 96 weeks. MIF was measured in serum and CSF.
Results:
MIF levels were compared with imaging outcomes in 223 participants from the SPRINT-MS study. In the primary progressive multiple sclerosis (PPMS) cohort, males had higher serum (p < 0.001) and CSF (p = 0.01) MIF levels, as compared with females. Higher baseline serum MIF levels in PPMS were associated with faster brain atrophy (beta = −0.113%, 95% confidence interval (CI): −0.204% to −0.021%; p = 0.016). These findings were not observed in secondary progressive multiple sclerosis (SPMS). Ibudilast did not affect either serum or CSF MIF levels.
Conclusions:
Serum MIF levels were associated with male sex and predicted brain atrophy in PPMS, but not SPMS. Ibudilast did not demonstrate an effect on MIF levels, as compared with placebo, although we cannot exclude a functional effect.
Introduction
Macrophage migration inhibitory factor (MIF) is a multifunctional molecule with roles throughout the periphery and central nervous system (CNS). In people with multiple sclerosis (MS), serum and cerebrospinal fluid (CSF) MIF levels were previously found to be higher than in healthy controls1,2 and have been correlated with clinical disability. 3 Extracellular MIF binds to transmembrane receptors, notably the major histocompatibility complex (MHC) class II invariant chain CD74, and activates cellular signaling pathways including PI3K/AKT and ERK/MAPK that promote cell proliferation and immune functions. CD74 has been identified at the rims of chronic active lesions in MS and is a marker of potentially pathogenic microglia in multiple sclerosis (MIMS). 4 In addition, CD74 expression is increased on subsets of oligodendrocyte precursor cells that fail to differentiate into myelinating oligodendrocytes but that can process and present antigen to CD4 and CD8 T cells further implicating extracellular MIF signaling in the immunopathogenesis of MS.5,6 However, MIF is also found in neurons and has intrinsic nuclease activity that mediates parthanatos, a novel form of caspase-independent cell death. 7 In mouse models of MS, poly-ADP-ribose (PAR) polymerase -1 (PARP-1) — an enzyme upstream of MIF in the parthanatos pathway — has been shown to be overactivated in lesions and associated with myelin and oligodendrocyte loss and MIF global knockout mice are protected from experimental autoimmune encephalomyelitis (EAE).8–10 Neurodegeneration in the alpha synuclein animal model of Parkinson’s disease occurs via parthanatos-associated apoptosis-inducing factor nuclease (PAAN)/MIF activity and can be inhibited with a brain-penetrant small molecule inhibitor (PAANIB), emphasizing the potential therapeutic benefits of MIF inhibition. 11
Ibudilast is a drug under clinical investigation for possible neuroprotective effects in MS. In addition to its known phosphodiesterase-4 inhibitory activity 12 and toll-like receptor 4 (TLR4) antagonism, 13 it has also been found to allosterically inhibit MIF. 14 Therefore, we sought to determine whether CSF and serum MIF levels might predict clinical or imaging outcomes or be reduced in people treated with ibudilast in the SPRINT-MS clinical trial. This was a 96-week, phase 2, placebo-controlled, randomized clinical trial of ibudilast in people with progressive multiple sclerosis (PMS). 15 In the SPRINT-MS trial, ibudilast was associated with a close to 50% reduction in brain parenchymal fraction (BPF) 15 and close to 80% reduction in retinal atrophy in people with PMS, 16 as compared with placebo. Since neurodegeneration is the principal substrate of disability in MS, these results suggest a promising effect of ibudilast in PMS. Interestingly, the effect of ibudilast on brain and retinal atrophy in the SPRINT-MS trial was only observed in those with primary progressive multiple sclerosis (PPMS), and not in secondary progressive multiple sclerosis (SPMS).16,17 These results imply that the effect in the PPMS cohort was mainly driving the results observed for the overall cohort.
In this post hoc study, we sought to explore any association between MIF levels and brain atrophy, as well as the effects of ibudilast on serum and CSF MIF levels in the participants of the SPRINT-MS trial.
Methods
Study cohort
This is comprised of the people with PMS who were recruited to the SPRINT-MS trial (https://www.clinicaltrials.gov/NCT01982942), the eligibility criteria, and the design of which are described in detail elsewhere. 18 Briefly, participants were randomized 1:1 to receive either ibudilast or placebo for a duration of 96 weeks. Brain magnetic resonance imaging (MRI) was conducted at baseline and every 24 weeks using Siemens (Trio/Prisma or Skyra) or GE (version 12× or higher) 3T systems. Images underwent quality control and the BPF was quantified as the proportion of brain parenchymal volume to the total volume within the contour that surrounds it, including the CSF. Blood samples were drawn at baseline, 8 weeks, and then annually, while CSF samples were available at baseline and at week 96 for a subset of the participants. The study protocol was approved by the NeuroNEXT central institutional review board, and the study was conducted in accordance with the International Council for Harmonization guidelines for Good Clinical Practice and the Declaration of Helsinki. Written informed consent was obtained from all participants.
Sample handling and MIF isolation
Samples were stored at −80°C until use. Samples were thawed and then centrifuged prior to dilution preparation. Serum samples were diluted 10-fold and CSF samples 2-fold by using the provided sample diluent buffer (SD13, Protein Simple). MIF was measured in serum and CSF samples with a commercial assay on the Ella instrument SimplePlex (Protein Simple, Inc., San Jose, CA, USA), an automated microfluidic immunoassay system (assay SPCKB-PS-000512, V5, Protein Simple, Inc.), according to the manufacturer’s instructions. High and low controls were included in all runs. The samples were run in triplicates, and the assay showed a good performance with an intra-assay median coefficient of variance of 2.4% (interquartile range (IQR): 1.6%–3.9%).
Serum neurofilament light chain
Serum neurofilament light chain (NfL) was measured using the Simoa assay (Quanterix) as previously described. 19 Age- and body mass index (BMI)-adjusted z-scores were calculated utilizing a publicly available formula (https://shiny.dkfbasel.ch/baselnflreference) based on healthy control normative data. 20
Statistical analysis
Continuous and categorical variables between the ibudilast and placebo groups were compared utilizing two samples t-test or Wilcoxon rank sum test and chi-square test or Fisher test, respectively. Serum MIF levels were log-transformed to approximate a normal distribution and subsequently scaled. Baseline MIF levels were compared between females and males using linear models adjusted for age. Generalized estimating equations (GEE) were used to compare the levels across the study and account for multiple samples/visits per subject. Spearman’s correlation was utilized to assess the relationship between serum and CSF MIF levels as well as between serum MIF and NfL levels.
For the longitudinal analyses, log-linear mixed-effects regression models with subject-specific random intercepts and slopes were used. Time in the models span up to five time points per subject (baseline, 24, 48, 72, and 96 weeks), was divided by 48 (so one time-unit approximates a year), and was treated as a continuous independent variable. Separate analyses for each MS subtype were performed to explore differential subtype effects of ibudilast. Similar analyses were performed according to sex, due to differences observed in baseline MIF levels between males and females. Analyses were also adjusted for age at baseline and the concurrent use of immunomodulatory therapy (interferon-beta or glatiramer acetate) and their interaction with time.
We utilized log-linear models to estimate the annualized percent change in BPF. The base model included a three-way interaction between time, treatment group, and PMS subtype and a three-way interaction between time, PMS subtype, and MIF levels. Additional models adjusting for age at baseline, sex, use of immunomodulatory treatment, and disease duration were tested. Subsequent sensitivity analyses were performed for the MS subtypes individually and linear models to calculate the effect on the annualized raw BPF change.
Unadjusted subject-specific annualized percent MIF rates of change and unadjusted subject-specific annualized percent BPF change were correlated using Spearman’s partial correlation, adjusting for age, sex, group, and PMS type. For sensitivity analyses, participants were categorized based on their annualized MIF rates of change (bottom 25% vs top 75%). The annualized percent BPF rates were compared between the two groups using linear models adjusted for the same covariates as above.
Finally, linear mixed-effect models with serum NfL z-score as the dependent variable and baseline MIF levels, treatment group, and PMS subtype and their interaction with time as the covariates were used to test for any association between baseline serum MIF values and NfL change.
All statistical analyses were performed in R software (version 4.2.0) (https://www.r-project.org/). Statistical significance was defined as p < 0.05.
Results
Cohort characteristics
Serum and CSF MIF levels were determined in 223 and 68 participants, respectively, from the SPRINT-MS trial. The demographics and clinical characteristics at baseline can be found in Table 1. Of those with serum MIF levels, 113 people were in the placebo arm (PPMS: N = 59 (52%); SPMS: N = 54 (48%)) and 110 people in the ibudilast arm (PPMS: N = 57 (52%); SPMS: N = 53 (48%)). The median disease duration was 10 years (IQR = 4–19 years), and the median Expanded Disability Status Scale (EDSS) score was 6 (IQR: 4.25–6). Demographics and clinical characteristics by PMS subtype (PPMS vs SPMS) are shown in Supplementary Table 1. The PPMS cohort had a higher proportion of males, less use of immunomodulatory treatments, shorter average disease duration, and lower EDSS scores, as compared with the SPMS cohort. There were 205 participants with serial serum MIF levels and 34 with serial CSF MIF levels.
Demographics and clinical characteristics at baseline by treatment group.
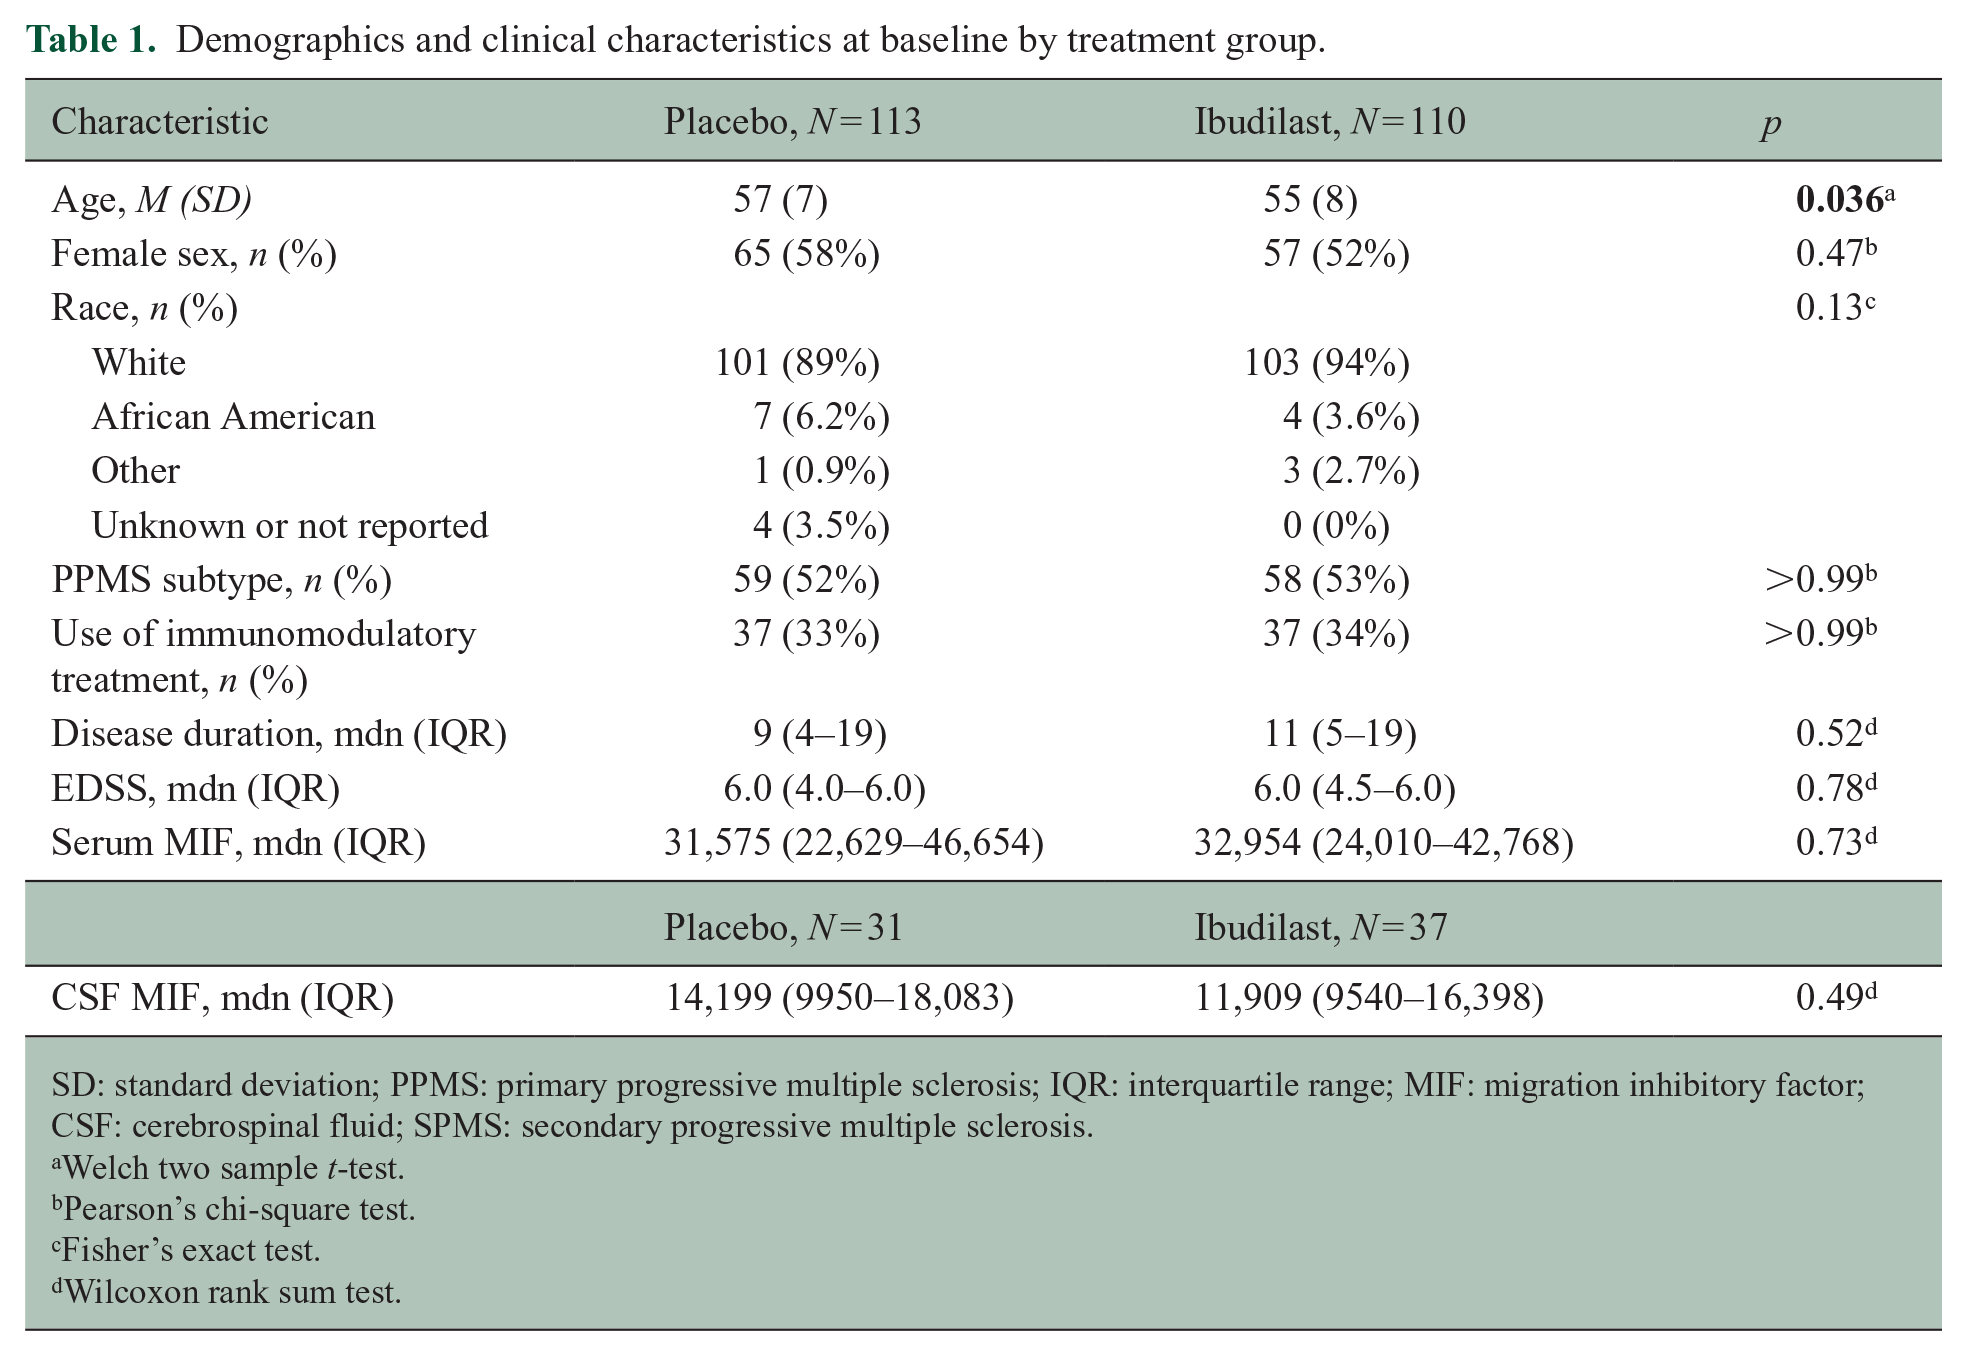
SD: standard deviation; PPMS: primary progressive multiple sclerosis; IQR: interquartile range; MIF: migration inhibitory factor; CSF: cerebrospinal fluid; SPMS: secondary progressive multiple sclerosis.
Welch two sample t-test.
Pearson’s chi-square test.
Fisher’s exact test.
Wilcoxon rank sum test.
Serum and CSF MIF levels are higher in males than females with PMS
When comparing baseline serum MIF levels between males and females, males trended toward having higher serum MIF levels across the cohort, as compared with females (difference = 0.25 standard deviation (SD), 95% confidence interval (CI): −0.01 to 0.51; p = 0.06). In subgroup analyses based on PMS (67 males and 50 females) subtype, MIF levels were significantly higher in males only in the PPMS cohort (difference = 0.59 SD, 95% CI: 0.29 to 0.89; p < 0.001), but not in the SPMS (34 males and 72 females) cohort (difference = −0.16 SD, 95% CI: −0.63 to 0.31; p = 0.5) (Figure 1), as compared with females. Similarly, CSF MIF levels were higher in males than females in the PPMS (15 males and 7 females) cohort (difference = 0.93 SD, 95% CI: 0.23 to 1.63; p = 0.01), but not the SPMS (5 males and 7 females) cohort (difference = −0.13 SD, 95% CI: −0.86 to 0.6; p = 0.71). Similar results were obtained using GEE models, considering all participant visits.
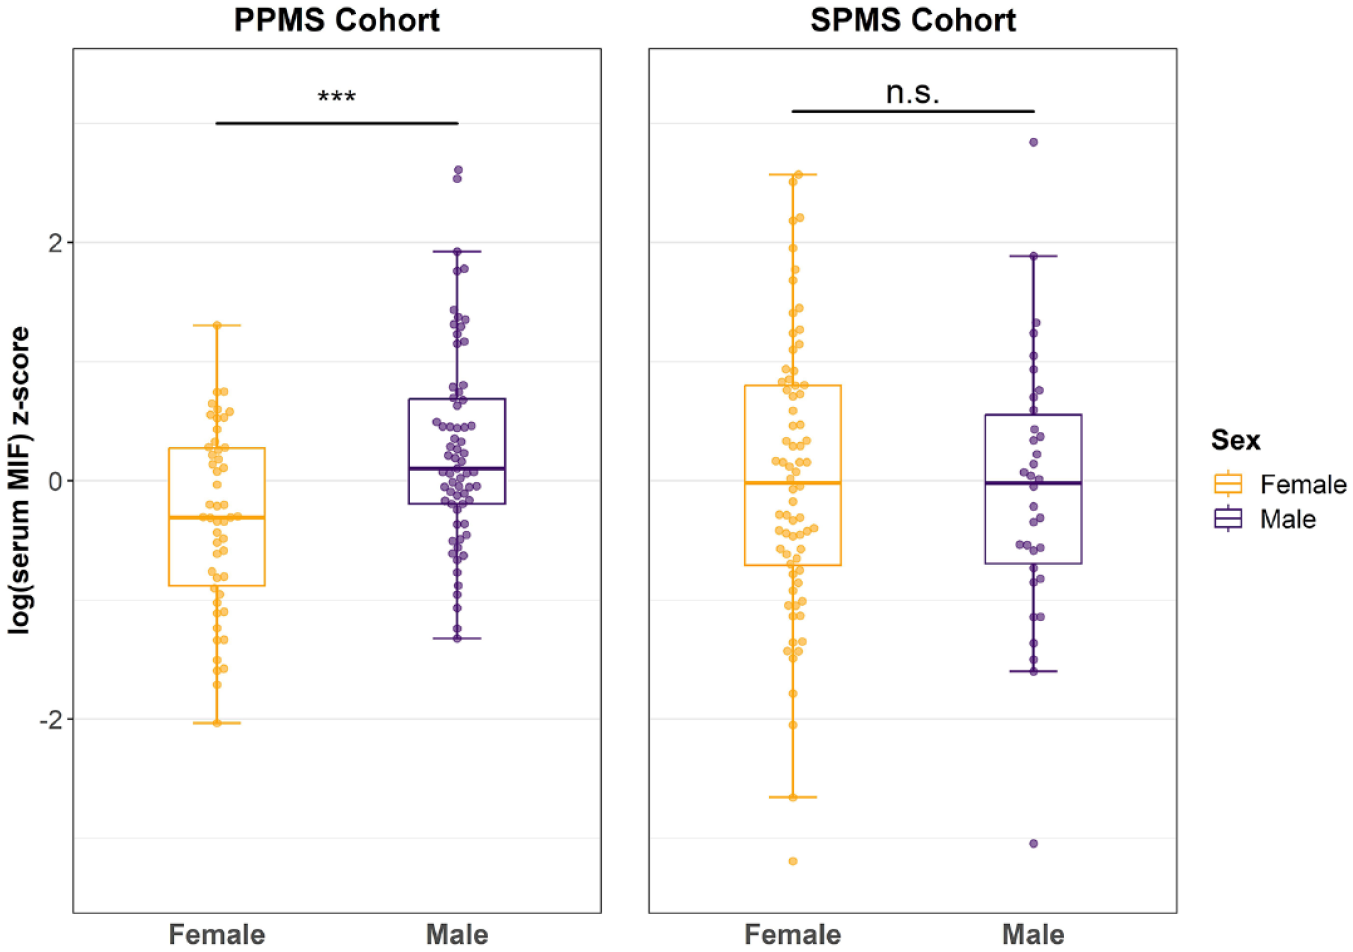
Serum MIF levels at baseline by sex and by PMS subtype. Boxplots overlapped by swarm plots of standardized log-transformed baseline serum MIF levels in PPMS (a) and SPMS (b) cohorts. Bounds of the box represent interquartile range (IQR), while horizontal central lines denote the median and minimum and maximum whiskers correspond to the Q1 − 1.5 × IQR (or the minimum value, if larger) and Q3 + 1.5 × IQR (or the maximum value, if smaller), respectively. ***p < 0.001.
Baseline serum MIF levels and brain atrophy
Baseline serum MIF levels were not associated with faster annualized brain atrophy in the overall cohort (per 1 SD increase in baseline serum MIF: −0.033; 95% CI: −0.091 to 0.026; p = 0.27). When PMS subtypes were analyzed separately, higher baseline serum MIF levels were associated with faster brain atrophy only in the PPMS cohort (per 1 SD increase in baseline serum MIF: −0.113; 95% CI: −0.204 to −0.021; p = 0.016), an effect which was not observed in the SPMS cohort (per 1 SD increase in baseline serum MIF: 0.018; 95% CI: −0.056 to 0.092; p = 0.63) (Figure 2). The three-way interaction term was also significant, suggesting a different association of MIF levels with brain atrophy between PPMS and SPMS (Table 2). Adjusting for other covariates including age, use of immunomodulatory treatment, or disease duration did not alter the results. When adjusting for sex, the three-way interaction term was not significant (Table 2). CSF MIF levels were not predictive of brain atrophy. Sensitivity analyses performed separately for the PPMS and SPMS cohorts, as well as utilizing the raw BPF change (instead of percent change) yielded similar results (results not shown). There was no correlation between serum and CSF MIF levels at baseline (Spearman’s rho = 0.04, p = 0.77; N = 67).
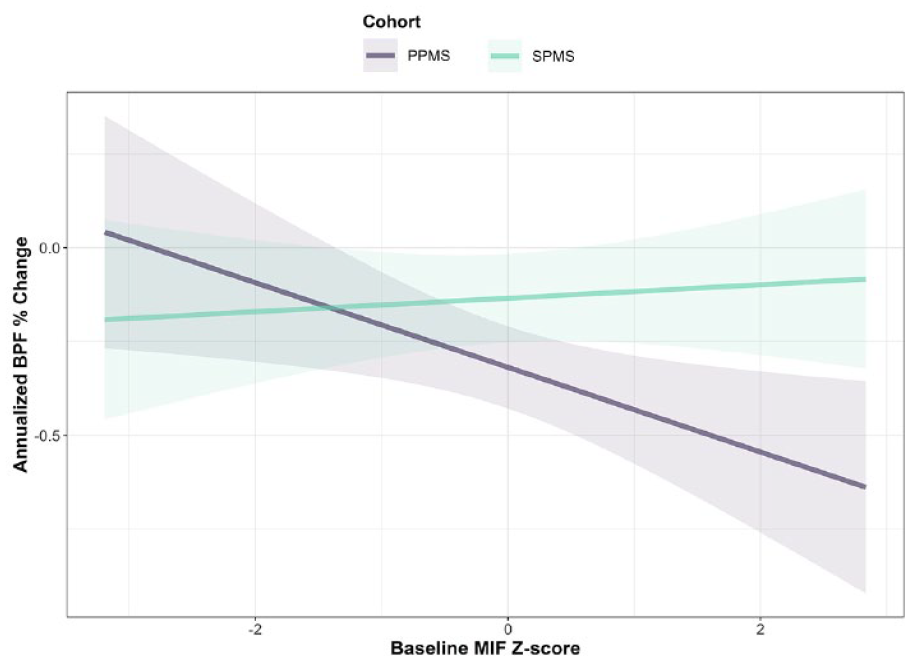
Association of baseline MIF levels with brain atrophy. Relationship between the annualized brain atrophy rate (y-axis) and scaled baseline MIF levels (x-axis) by PMS subtype. Solid lines are derived from linear mixed-effects model including a three-way interaction of time, PMS subtype, and baseline MIF levels and a three-way interaction between time, PMS subtype, and treatment group with BPF as the outcome variable. Shaded areas denote the 95% CI.
Baseline MIF as a predictor of brain atrophy.
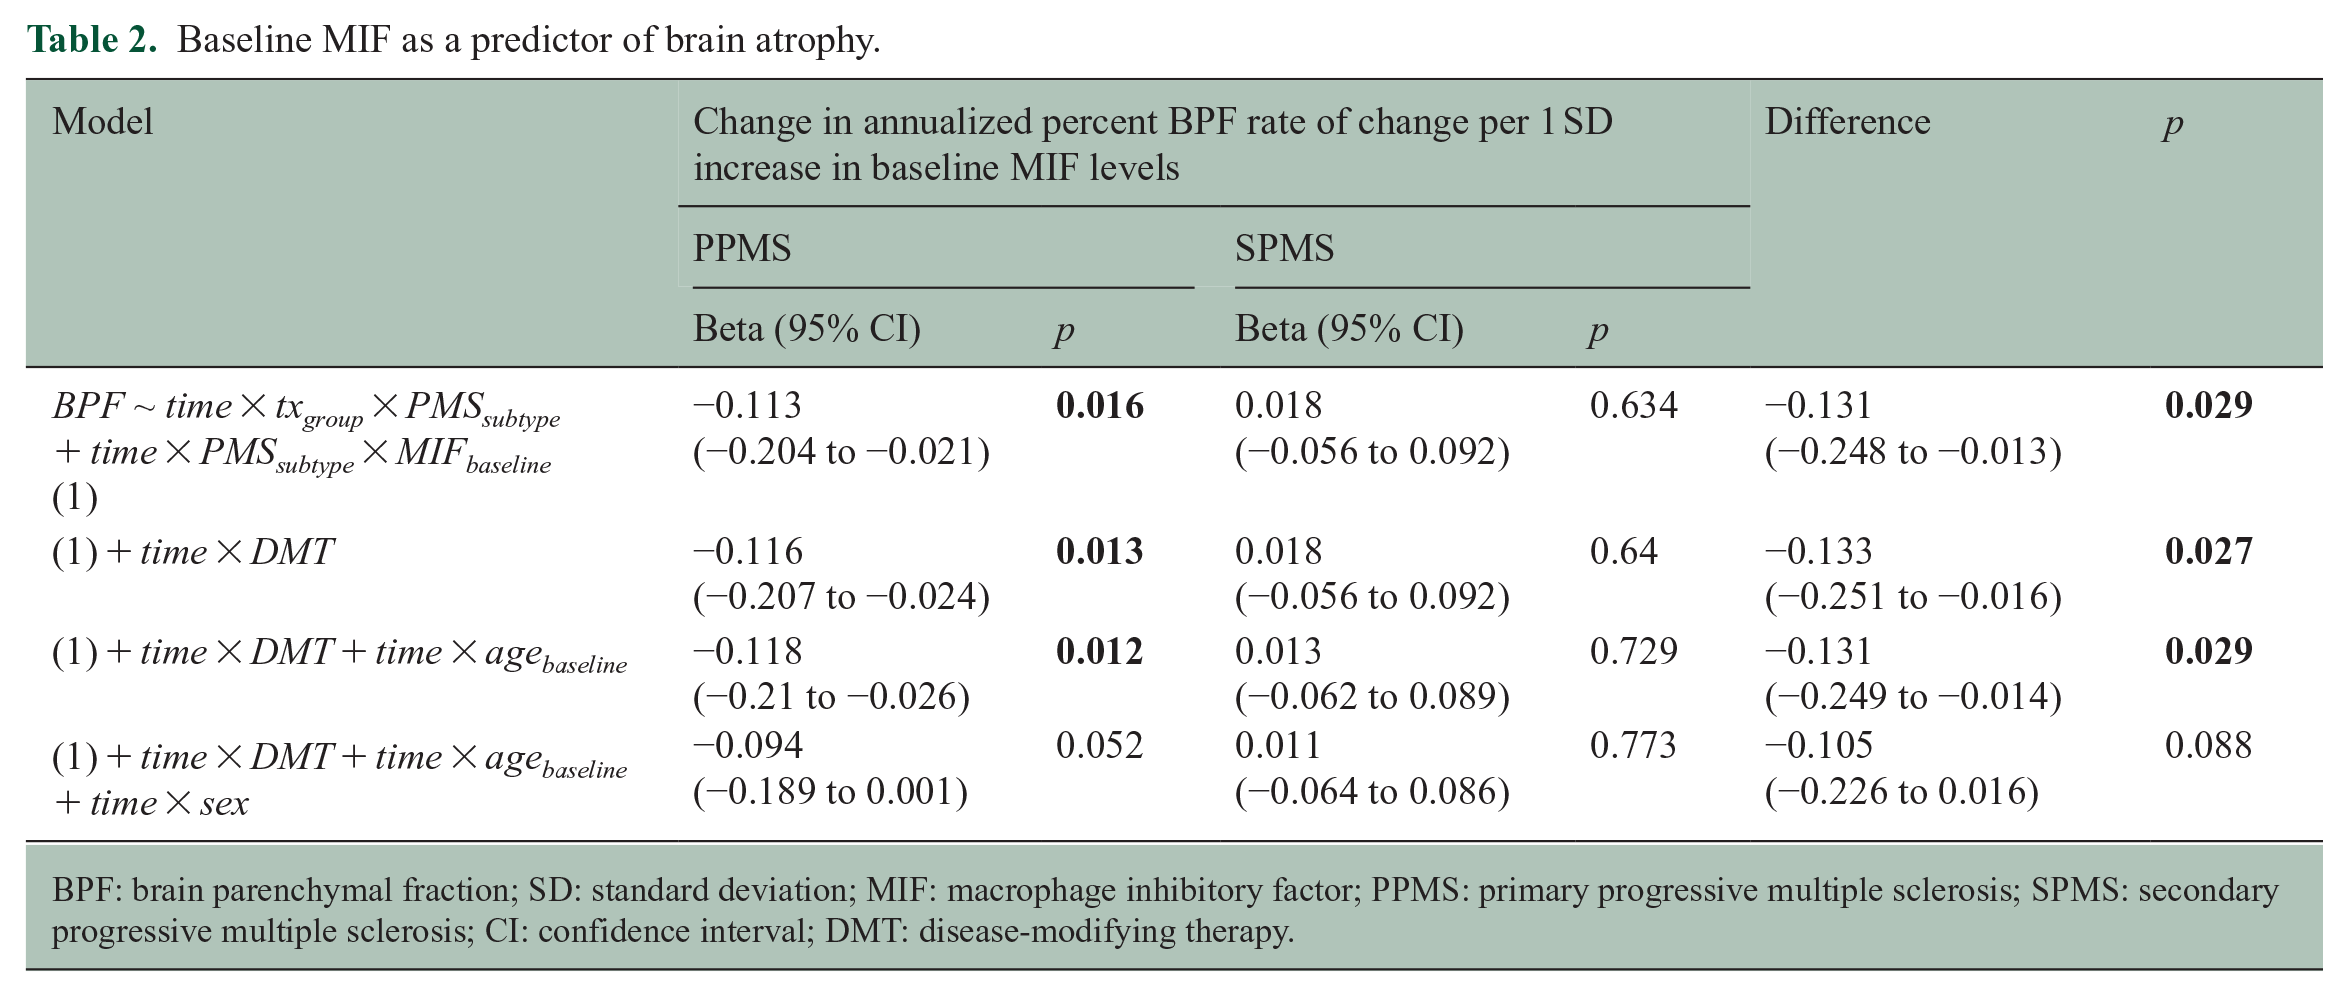
BPF: brain parenchymal fraction; SD: standard deviation; MIF: macrophage inhibitory factor; PPMS: primary progressive multiple sclerosis; SPMS: secondary progressive multiple sclerosis; CI: confidence interval; DMT: disease-modifying therapy.
Longitudinal relationship between MIF and brain atrophy
Partial correlation between the rates of change of serum MIF levels and brain atrophy revealed a significant negative association (N = 205; rho = −0.15, p < 0.001; Supplementary Figure). When we dichotomized the cohort based on the annualized MIF rate of change (bottom 25% (N = 51) vs top 75% (N = 154)), there was a trend for people with decreasing MIF levels to have slower brain atrophy (BPF rate of change in bottom 25%: −0.11%/year; BPF rate of change in top 75%: −0.18%/year; and adjusted difference = 0.07, 95% CI: −0.02 to 0.16, p = 0.12).
Ibudilast and MIF levels
The rate of change in serum MIF levels in the ibudilast and placebo-treated arms, as well as their adjusted differences, is demonstrated in Table 3. There was no effect of ibudilast on the MIF levels either overall or in the different PMS subtypes.
MIF rate of change.
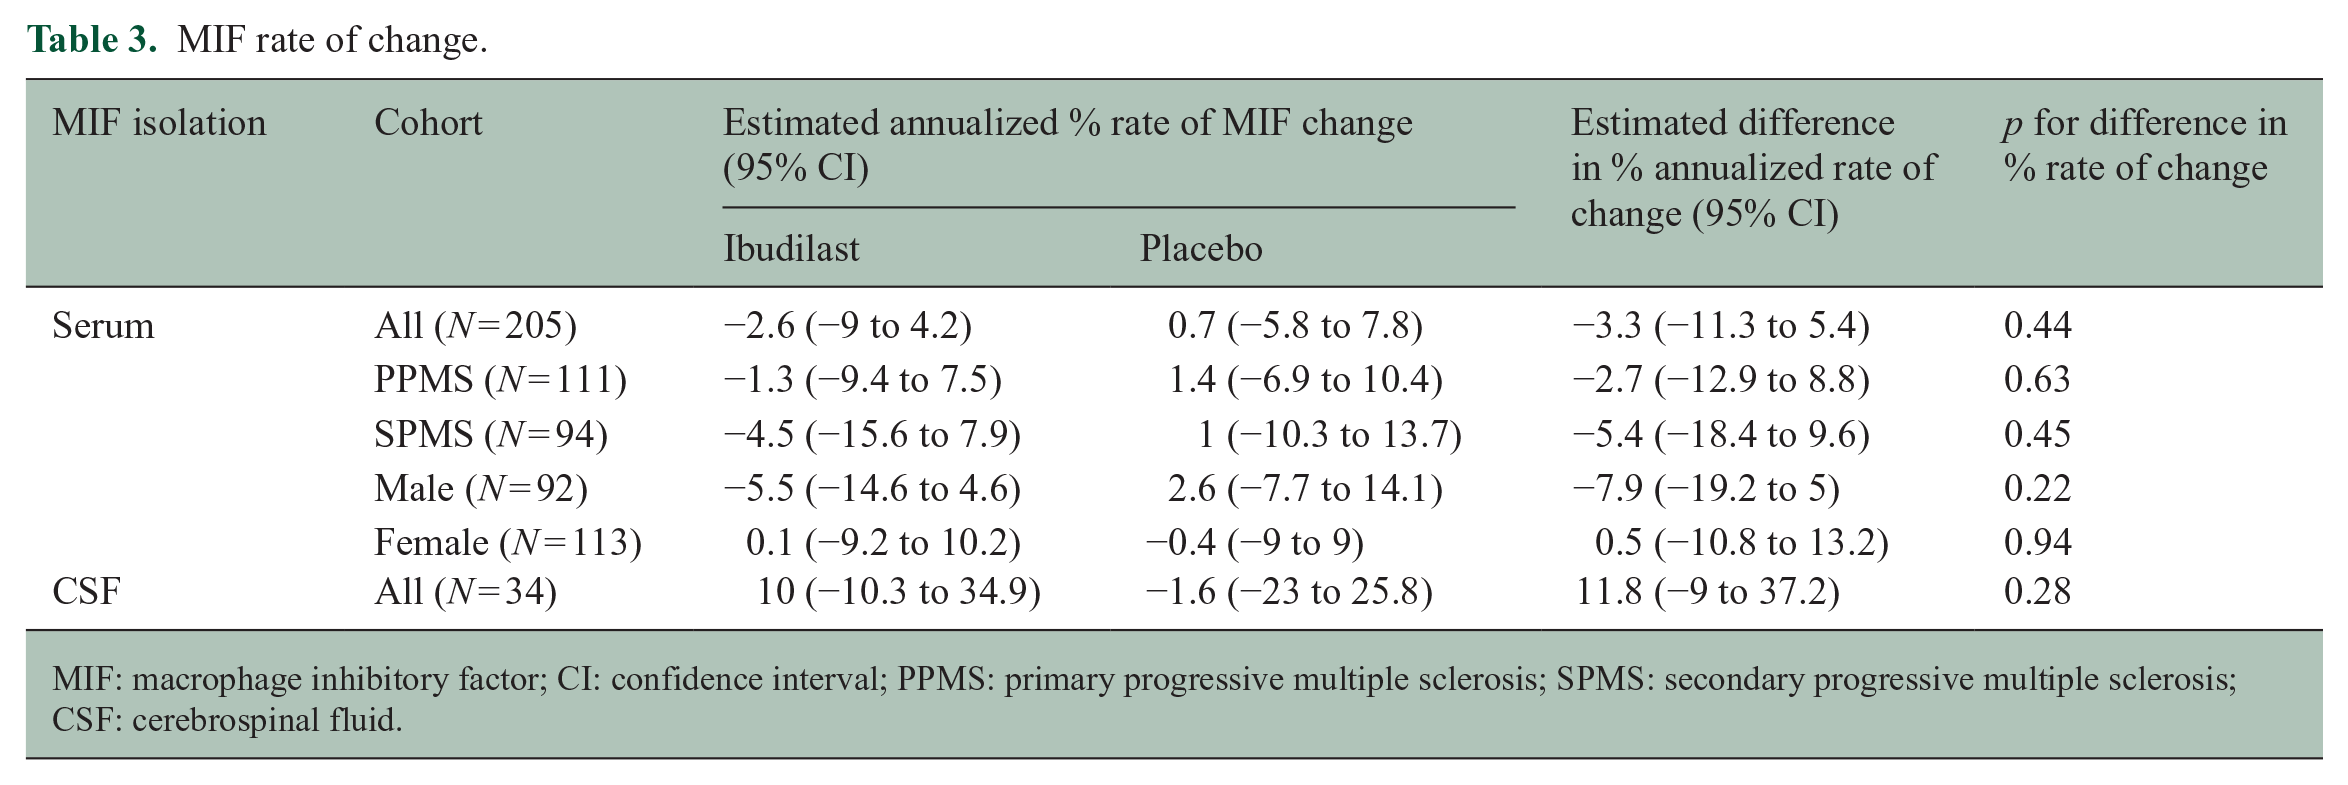
MIF: macrophage inhibitory factor; CI: confidence interval; PPMS: primary progressive multiple sclerosis; SPMS: secondary progressive multiple sclerosis; CSF: cerebrospinal fluid.
Serum NfL and MIF levels
There was no association between serum NfL and MIF levels (N = 223; Spearman’s rho = 0.06, p = 0.37). There was no significant association between baseline MIF and NfL change over time (for every 1 SD increase in baseline MIF: −0.02, 95% CI: −0.06 to 0.02; p = 0.3). That remained true for sensitivity analyses of MS subtypes and sexes separately (results not shown).
Discussion
In this study, we examined whether baseline MIF levels predicted imaging outcomes over the duration of two years in a cohort of PMS patients. In addition, because ibudilast has been reported to act, in part, as an inhibitor of MIF, we examined whether ibudilast treatment was associated with a reduction in serum MIF levels. At baseline, both serum and CSF MIF levels were significantly higher in males, as compared with females, in the PPMS cohort. Higher baseline serum MIF levels were associated with faster brain atrophy, also only in the PPMS cohort.
Interestingly, we observed higher serum and CSF MIF levels in PPMS males compared with PPMS females, which was not seen in the SPMS cohort. Another group previously reported that plasma MIF levels were higher in males with PMS compared with males with relapsing–remitting multiple sclerosis (RRMS), a trend that was not observed in females. 3 In the same study, MIF levels were positively correlated with clinical disability (measured by EDSS) only in the male cohort and increased MIF levels correlated with the presence of two high-expression promoter polymorphisms located in the MIF gene and risk of conversion to progressive MS in males. In a separate study, MIF levels were higher in neonatal blood spots from males as compared with females in a general population control group, 21 and MIF, which is a target of sex hormones, has been shown to be reduced by estrogens and elevated after ovariectomy.22,23 Collectively, these studies strongly implicate an interplay between sex-related differences and MIF levels and are consistent with our observations in this study. Furthermore, it suggests the possibility that postmenopausal women may be less able to suppress MIF and could partially explain the well-described worsening of MS after menopause. 24
In this study, higher baseline serum MIF levels were associated with faster brain atrophy rates only in the PPMS cohort. The coefficient of the three-way interaction between time, PMS subtype, and MIF levels was also significant, meaning that MIF levels are associated with brain atrophy in a different way between PPMS and SPMS. While this could implicate the involvement of MIF in the pathophysiology of PPMS and not SPMS, the higher prevalence of males with PPMS, who have higher MIF levels, is likely also contributing to this observation. In previous study results, the PPMS cohort was driving the neuroprotective effect of ibudilast both with respect to brain 17 and retinal atrophy. 16 The faster brain atrophy rate in the placebo PPMS cohort as compared with the SPMS cohort is consistent with a greater propensity for neurodegeneration, perhaps due to MIF, in PPMS, although the greater proportion of disease-modifying therapy (DMT)-treated SPMS patients could also be a factor. In addition, the fact that the PPMS cohort had proportionally more males than females, as compared with the SPMS cohort, supports the notion that high MIF levels, as is seen in males, play a role in the pathobiology of neurodegeneration, as estimated by brain atrophy. This is further supported by the negative correlation between the rates of change in MIF and brain atrophy in the overall cohort.
Ibudilast did not demonstrate an effect on serum or CSF MIF levels, including in the ibudilast arm of the PPMS cohort, although this does not exclude the possibility of functional inhibition of MIF-CD74 signaling. Ibudilast may act as an allosteric inhibitor 14 and thus may not alter levels of MIF measured in serum or CSF. Males had increased baseline MIF levels and faster brain atrophy compared with females.
Extracellularly released MIF signaling through CD74 could contribute to localized inflammation in CNS glia or increased peripheral immune infiltration into the CNS, which are drivers of brain atrophy. MIF can activate astrocytes and induce tumor necrosis factor α (TNF-α), interleukin (IL)-1b, and IL-6 all of which are elevated in MS brains, and may, in addition, affect chemotaxis through induction of chemokines.25–27 In addition to extracellular effects, MIF can positively or negatively regulate c-Jun, a protein implicated in neuronal death, and the activity of activator protein 1 (AP-1), a transcription factor that activates proinflammatory genes, depending on the cell type and c-Jun activation binding domain protein 1 (JAB1) binding partners.28–31 It is also possible that intracellular MIF nuclease activity could be contributing to autonomous and ongoing neurodegenerative gray matter lesions prevalent in PMS patients. 32 As neurons die through parthanatos, nuclear MIF could be released and endocytosed by neighboring cells or released in extracellular vesicles and in a paracrine manner could contribute to MIF nuclease-mediated cell death. Cytokine-mediated neurodegenerative pathways in the CNS may explain why disease progression ensues somewhat independently from RRMS peripheral immune cell-mediated flares and new T2 lesions on MRI.
In prior studies, Veto et al. 10 showed an increase in PAR and apoptosis-induced factor (AIF) expression in pathological studies of both acute MS lesions and slowly expanding lesions in PMS, as compared with control white matter. Similar results were replicated in mouse models of MS, with increased activation of PARP and elevated AIF in the corpus callosum of cuprizone-treated mice. 10 AIF elevation resulted in caspase-independent cell death, suggesting the involvement of the later discovered parthanatos pathway in this process. Pretreatment of cuprizone-fed mice with 4-hydroxyquinazoline, a PARP inhibitor, prevented AIF elevation, cell death, and demyelination highlighting the role of this pathway in demyelination and neurodegeneration. Similar work by Baud et al. 33 and Jurewicz et al. 34 described parthanatos hallmarks, such as AIF translocation to the nucleus, in MS-related contexts.
Finally, serum NfL levels were not correlated with serum MIF levels, and baseline MIF did not predict an NfL trend. This implicates that MIF might be involved in a different mechanism/pathway from that of axonal degeneration.
Our study has several limitations. CSF samples were limited to a small number of participants. There was no association between CSF and serum MIF levels which may reflect that many different cell types can produce MIF and/or reduced power to see an association. In addition, serum MIF half-life — an important characteristic for potential biomarkers — is not known yet. It has been studied in the context of prostate- or endometrial-derived MIF, and these results indicate that MIF half-life varies (from 9 to 36 h) based on the derivative cells and their state.35,36 Nonetheless, serum MIF levels could still be of use as an MS biomarker due to the well-characterized presence of systemic inflammation. 37 Finally, the complex nature of MIF acting as both a cytokine and an intracellular mediator of cell death potentially complicates the interpretation of serum MIF levels.
Larger, longitudinal studies in people with PPMS and further exploring the role of sex are required to validate the role and prognostic utility of serum MIF levels. In addition, the utilization of functional assays of MIF before and after treatment with ibudilast will help clarify whether ibudilast exerts a substantial effect through MIF inhibition. Basic science research can further inform clinical trials, discerning MIF various roles in contributing to neurodegenerative pathology that occurs in the CNS of people with PPMS and may thereby direct how best to measure the impact of a therapy on the MIF pathway.
Supplemental Material
sj-docx-1-msj-10.1177_13524585231213164 – Supplemental material for Serum macrophage migration inhibitory factor levels predict brain atrophy in people with primary progressive multiple sclerosis
Supplemental material, sj-docx-1-msj-10.1177_13524585231213164 for Serum macrophage migration inhibitory factor levels predict brain atrophy in people with primary progressive multiple sclerosis by Dimitrios C Ladakis, Maria I Reyes-Mantilla, Sachin P Gadani, Jackson W Mace, Susana C Dominguez-Penuela, Mayaa J Appiah, Matthew D Smith, Pavan Bhargava, Robert J Fox, Shiv Saidha and Peter A Calabresi in Multiple Sclerosis Journal
Supplemental Material
sj-docx-2-msj-10.1177_13524585231213164 – Supplemental material for Serum macrophage migration inhibitory factor levels predict brain atrophy in people with primary progressive multiple sclerosis
Supplemental material, sj-docx-2-msj-10.1177_13524585231213164 for Serum macrophage migration inhibitory factor levels predict brain atrophy in people with primary progressive multiple sclerosis by Dimitrios C Ladakis, Maria I Reyes-Mantilla, Sachin P Gadani, Jackson W Mace, Susana C Dominguez-Penuela, Mayaa J Appiah, Matthew D Smith, Pavan Bhargava, Robert J Fox, Shiv Saidha and Peter A Calabresi in Multiple Sclerosis Journal
Supplemental Material
sj-jpg-3-msj-10.1177_13524585231213164 – Supplemental material for Serum macrophage migration inhibitory factor levels predict brain atrophy in people with primary progressive multiple sclerosis
Supplemental material, sj-jpg-3-msj-10.1177_13524585231213164 for Serum macrophage migration inhibitory factor levels predict brain atrophy in people with primary progressive multiple sclerosis by Dimitrios C Ladakis, Maria I Reyes-Mantilla, Sachin P Gadani, Jackson W Mace, Susana C Dominguez-Penuela, Mayaa J Appiah, Matthew D Smith, Pavan Bhargava, Robert J Fox, Shiv Saidha and Peter A Calabresi in Multiple Sclerosis Journal
Footnotes
Acknowledgements
We would like to thank the participants in the ibudilast trial for donating samples for research and the NeuroNEXT network for collecting the clinical trial samples and data utilized in this analysis. We would also like to thank Dr Patrizio Caturegli who kindly allowed us to use the ELLA device at the Clinical Immunology Laboratory at Johns Hopkins Hospital.
Declaration of Conflicting Interests
The author(s) declared the following potential conflicts of interest with respect to the research, authorship, and/or publication of this article: D.C.L., S.C.D.-P., M.J.A., M.D.S., J.W.M., and S.P.G. declared no potential conflicts of interest. M.I.R.-M. has received consulting fees from Novartis. P.B. has received grant funding to JHU from Amylyx pharmaceuticals, Genentech, EMD-Serono, and GSK. R.J.F received personal consulting fees from AB Science, Biogen, Bristol Myers Squibb, EMD Serono, Genentech, Genzyme, Greenwich Biosciences, Immunic, INmune Bio, Janssen, Lily, Novartis, Sanofi, Siemens, and TG Therapeutics; served on advisory committees for AB Science, Biogen, Immunic, Janssen, Novartis, and Sanofi; and received clinical trial contract and research grant funding from Biogen, Novartis, and Sanofi. S.S. has received consulting fees from Medical Logix for the development of CME programs in neurology and has served on scientific advisory boards for Biogen, Novartis, Genentech Corporation, TG therapeutics, Clene Pharmaceuticals, and ReWind therapeutics. He has performed consulting for Novartis, Genentech Corporation, JuneBrain LLC, Innocare Pharma, Kiniksa pharmaceuticals, and Lapix therapeutics. He is the PI of investigator-initiated studies funded by Genentech Corporation, Biogen, and Novartis. He previously received support from the Race to Erase MS foundation. He has received equity compensation for consulting from JuneBrain LLC and Lapix therapeutics. He was also the site investigator of trials sponsored by MedDay Pharmaceuticals and Clene Pharmaceuticals, and is the site investigator of trials sponsored by Novartis, as well as Lapix therapeutics. P.A.C. received funding from MRF for this work and is PI on a grant from Genentech to JHU. He has received consulting fees from Lilly, Idorsia, and Novartis.
Funding
The author(s) disclosed receipt of the following financial support for the research, authorship, and/or publication of this article: This work was supported by a grant from the Myelin Repair Foundation to P.A.C.
ORCID iDs
Supplemental material
Supplemental material for this article is available online.
References
Supplementary Material
Please find the following supplemental material available below.
For Open Access articles published under a Creative Commons License, all supplemental material carries the same license as the article it is associated with.
For non-Open Access articles published, all supplemental material carries a non-exclusive license, and permission requests for re-use of supplemental material or any part of supplemental material shall be sent directly to the copyright owner as specified in the copyright notice associated with the article.