
Abstract
Background:
Magnetic resonance imaging (MRI) measurements of gray matter (GM) atrophy and magnetization transfer ratio (MTR; correlate of myelination) may provide better insights than conventional MRI regarding brain tissue integrity/myelination in multiple sclerosis (MS).
Objective:
To examine the effect of siponimod in the EXPAND trial on whole-brain and GM atrophy, newly formed normalized magnetization transfer ratio (nMTR) lesions, and nMTR-assessed integrity of normal-appearing brain tissue (NABT), cortical GM (cGM), and normal-appearing white matter (NAWM).
Methods:
Patients with secondary progressive multiple sclerosis (SPMS) received siponimod (2 mg/day; n =1037) or placebo (n = 523). Endpoints included percentage change from baseline to months 12/24 in whole-brain, cGM, and thalamic volumes; change in nMTR from baseline to months 12/24 in NABT, cGM, and NAWM; MTR recovery in newly formed lesions.
Results:
Compared with placebo, siponimod significantly reduced progression of whole-brain and GM atrophy over 12/24 months, and was associated with improvements in brain tissue integrity/myelination within newly formed nMTR lesions and across NABT, cGM, and NAWM over 24 months. Effects were consistent across age, disease duration, inflammatory activity subgroups, and disease severity.
Conclusion:
Siponimod reduced brain tissue damage in patients with SPMS as evidenced by objective measures of brain tissue integrity/myelination. This is consistent with central nervous system (CNS) effects observed in preclinical models. ClinicalTrials.gov number: NCT01665144.
Keywords
Introduction
Multiple sclerosis (MS) is a chronic, inflammatory, demyelinating, neurodegenerative disease of the central nervous system (CNS). At disease onset, most patients (~85%) receive a diagnosis of relapsing-remitting multiple sclerosis (RRMS) and 25%–40% advance to secondary progressive multiple sclerosis (SPMS) within 10 years.1,2
RRMS is characterized by relapses with full or partial recovery followed by periods of remission, with pathophysiology apparently driven primarily by peripherally mediated focal inflammation.3,4 SPMS is distinguished from RRMS by disability progression independent of relapses.1,2,5 In SPMS, relapses become less frequent over time; approximately 30% of patients experience relapses, most of which occur within 5 years of SPMS onset and/or before the age of 55 years. 5 SPMS pathophysiology is not fully characterized but is believed to involve chronic inflammation compartmentalized in the CNS and failure or exhaustion of myelin repair mechanisms.3,4 In addition to compartmentalized inflammation, a loss of compensatory reserve capacity may be relevant for the emergence of clinical progression in the absence of relapses. 6
Conventional T2- and T1-weighted magnetic resonance imaging (MRI) has been very revealing of the peripherally mediated focal inflammation that underlies relapses in MS, but less so of the compartmentalized inflammation more closely associated with progression. The latter requires quantitative analysis methods to detect accelerated rates of global and regional brain volume loss (e.g. gray matter (GM) volume loss), and changes within lesional and normal-appearing tissues, such as myelin loss and repair. However, MRI measurements of total brain volume loss do not provide specific information on disease pathophysiology because small changes may be caused by several processes, including neuronal/axonal loss, demyelination, and inflammation. 7 MRI measurements of GM atrophy and magnetization transfer ratio (MTR) may provide better insights into different pathological pathways involved in neurodegeneration in SPMS. Cortical gray matter (cGM) and thalamic volume loss are also associated with long-term disability accumulation and cognitive decline.8–10 GM atrophy is also linked to neurodegenerative worsening in progressive disease beyond the relapsing, inflammation-driven processes that occur earlier in MS.11–14 Since myelin is the primary target of inflammation in MS, the measurement of changes in myelin content is also of particular interest. This can be accomplished on clinical scanners using MTR imaging. Change in MTR has been shown to be a marker of myelin density in the brain. 15
Siponimod is an oral sphingosine 1-phosphate (S1P) receptor modulator that selectively binds to S1P1 and S1P5 receptors. 16 Indications for siponimod vary; it is approved in Europe in adults with active SPMS (i.e. with relapses or imaging features of disease activity), 16 in the United States in relapsing forms of MS, including clinically isolated syndrome, RRMS, and active SPMS, 17 and in some countries (e.g. Australia and Japan), in all patients with SPMS.
Clinical and preclinical evidence supports a dual mechanism of action for siponimod. Peripherally mediated anti-inflammatory effects through the S1P1 receptor reduce the egress of pathogenic lymphocytes from lymph nodes, limiting the number of circulating lymphocytes entering the CNS. 18 Preclinical data also suggest direct anti-inflammatory and promyelination effects of siponimod acting via the S1P1 and S1P5 receptors on CNS-resident cells, including astrocytes, microglia, and oligodendroglial cells.19–23
In the phase 3 EXPAND study, siponimod was investigated in a broad population with SPMS (Expanded Disability Status Scale (EDSS) score of 3.0−6.5), including patients with advanced disease (>50% required walking aids at study entry (EDSS ⩾6.0)). 24 Compared with placebo, siponimod significantly reduced: the risk of 3-month confirmed disability progression (assessed by EDSS) by 21% and of 6-month progression by 26%; 24 the risk of meaningful worsening in cognitive processing speed (determined as a ⩾4-point decline in the Symbol Digit Modalities Test (SDMT) score);16,24,25 and total brain volume loss. 24 In addition, a significant effect was also observed on measures of inflammatory disease activity, including reduction in annualized relapse rate by 55%, MRI T2 and T1 gadolinium lesion activity by 81% and 86%, respectively, and a significant reduction in T2 lesion volume. 24
Given the efficacy of siponimod on clinical measures of progression, any effects on GM atrophy and MTR may give further insights into its dual mechanisms of action. Currently, little evidence exists on the impact of disease-modifying therapies (DMTs) on regional atrophy and MTR outcomes in populations with SPMS. One previous study observed no overall effect of interferon β1b on the worsening of MTR measures. 26 Some evidence also exists in populations with RRMS, with previous studies having shown effects of dimethyl fumarate and alemtuzumab.27,28 Overall, more information is needed from large-scale studies to assess the impact of specific DMTs on these MRI measures, especially in patients with progressive MS.
Using data from EXPAND, we assessed the effect of siponimod versus placebo on cortical and thalamic GM atrophy, as well as changes in normalized magnetization transfer ratio (nMTR) measurements in normal-appearing brain tissue (NABT), cGM, and normal-appearing white matter (NAWM), and newly formed nMTR lesions in a population with SPMS.
Methods
Trial design and patients
The EXPAND (NCT01665144) study methodology was reported. 24 In brief, EXPAND was a phase 3, randomized, double-blind, placebo-controlled, event- and exposure-driven study of up to 37 months’ duration (median [interquartile range] = 21.3 [15.5–27.0] months) investigating the efficacy and safety of siponimod in patients with SPMS. Patients were randomized (2:1) to once-daily oral siponimod 2 mg or placebo. Key eligibility criteria included age 18–60 years, a diagnosis of SPMS, EDSS score of 3.0–6.5 at screening, a history of RRMS, documented EDSS score progression in the past 2 years, and no evidence of relapses in the previous 3 months. The protocol was approved by the relevant institutional review board or ethics committee at each trial site; all patients provided written informed consent.
Procedures
At all sites, standard-resolution MRI scans (1 mm × 1 mm × 3 mm) were scheduled at screening, at months 12, 24, and 36, and at the end of the controlled treatment phase (end of study (EOS) scan; if different from annual visits). MRI scans were also conducted in patients who discontinued prematurely from the double-blind study period and/or study treatment (end of treatment (EOT) scan).
Either MTR (1 mm × 1 mm × 3 mm) or high-resolution (1 mm isotropic) T1-weighted MRI sequences were added to conventional MRI scans at centers meeting prespecified technical requirements. MRI data were analyzed independently at a central site (NeuroRx Research, Montreal, QC, Canada) by staff blinded to treatment assignment.
Percentage brain volume change, percentage cGM volume change, and thalamic volume change were measured from baseline to each follow-up time point (i.e. at month 12, month 24, EOT, and EOS) using the paired Jacobian integration. 29 GM atrophy was initially measured in the cohort of patients with high-resolution MRI scanning. This was because of theoretical concerns about partial volume effects when assessing smaller and more complex brain structures, such as the thalamus and hippocampus. However, review of the results from the standard- and high-resolution MRI scans showed that the effects of the different scanning protocol were small. All patients underwent standard-resolution MRI scans; however, for those patients who also underwent high-resolution MRI scans, GM atrophy measures were only processed from high-resolution MRI scans to avoid double-counting. The combined MRI set comprised both the standard- and high-resolution sets. Full details on the acquisition methodologies and scanners are provided in the Supplementary Appendix and MRI Appendix documents.
Objectives and endpoints
The objectives of the EXPAND analysis described here were to evaluate the effect of siponimod versus placebo on total brain volume (secondary objective), cGM and thalamic volume, and nMTR (exploratory objectives).
The following endpoints were assessed: percentage change from baseline to months 12 and 24 in total brain volume, cGM volume, and thalamic volume; change in nMTR from baseline to months 12 and 24 in NABT, cGM, and NAWM; and nMTR recovery in newly formed MTR lesions (i.e. new areas of decreased MTR defined on MTR images at month 12 in most cases, or at month 24 if a subsequent scan was available at month 36), which may reflect remyelination, assessed by the change in stable nMTR from pre- to post-lesion time points.
Statistical analyses
Analyses were performed for both the full analysis set (FAS) and per-protocol set (PPS). The FAS included all randomized patients with assigned treatments who received ⩾1 dose of study drug; the PPS included all patients in the FAS, except those with major protocol deviations or with efficacy data collected after permanent study drug discontinuation. A greater focus was placed on analyses in the PPS because potentially confounding data from patients who switched from placebo to open-label siponimod as rescue medication were not included in the PPS. 24 FAS analyses are included in the Supplementary Appendix.
In these analyses, the EOT and EOS scans, which are not time point-specific, were remapped to one of the scheduled time points (i.e. month 12, 24, or 36). Percentage change in total brain, cGM, and thalamic volumes were analyzed using a repeated-measures model adjusted for treatment, visit, normalized brain volume, number of baseline gadolinium-enhancing lesions, baseline T2 lesion volume, and visit-by-treatment and visit-by-baseline brain volume interactions. An unstructured covariance matrix was used in the repeated-measures model to account for the variance in percent volume change at each time point and covariance between time points. These analyses were performed in patients with high-resolution scans and in patients with standard-resolution scans. Analyses for the combined MRI cohort were also conducted. The consistency of the treatment effect in patients with high- versus standard-resolution scans was further evaluated using subgroup- (high vs standard) by-treatment interaction tests. This analysis did not evidence heterogeneity between subgroups (Supplemental Table S1).
In the combined MRI cohort, cGM volume and thalamic volume were analyzed in subgroups stratified by baseline age (⩽45 years or >45 years), disease duration (⩽15 years or >15 years), EDSS score (<6.0 or ⩾6.0), SDMT score (⩽43 or >43), and SPMS activity (active SPMS was defined as ⩾1 relapse in the 2 years before screening and/or ⩾1 gadolinium-enhancing lesion at baseline).
MTR was analyzed in the MTR patient cohort. Variations in MTR acquired on different scanners were reduced by MTR normalization, by setting the MTRs of high-confidence cGM to 0 and of high-confidence white matter to 1 on the MTR scan of a healthy control individual on the same scanner. A repeated-measures model, accounting for within-patient correlation, was used to obtain nMTR estimates in NABT, cGM, and NAWM. The model was adjusted for treatment, visit, baseline median nMTR of respective brain tissue, baseline number of gadolinium-enhancing lesions, baseline T2 lesion volume, and visit-by-treatment and visit-by-baseline interactions.
Lesional nMTR recovery was assessed in new nMTR lesions 11 by comparing nMTR decrease from post-lesion to pre-lesion time points for siponimod versus placebo. Of note, at least three nMTR scans were required to assess lesional nMTR recovery (pre-lesion, peri-lesion, and post-lesion). Considering the duration of the study, the majority of peri-lesional scans were obtained at the month 12 visit (or remapped month 12 visit). The latest available measurements before and after the formation of a new lesion were considered. Given the yearly scans, these measurements represented stable pre- and post-lesion MTR values because the period of acute lesion recovery lasts approximately 4 months. Results were analyzed in the FAS by a multilevel model that accounted for within-lesion and within-patient correlations. The model was adjusted for treatment, lesion time points, age, and treatment-by-time point interaction. Lesion volume was used as a weighting factor, and estimates were derived for pre-lesional and post-lesional time points. A model including all possible measurements at any time point (i.e. pre-lesional, new lesion, and post-lesional) was also derived.
Results
Patient characteristics
In total, GM volume measurements were analyzed from 546 patients (siponimod, n = 376; placebo, n = 170) who underwent high-resolution MRI scans and from 1007 patients (siponimod, n = 656; placebo, n = 351) with standard-resolution MRI scans. The subset for MTR analyses included 606 patients (siponimod, n = 388; placebo, n = 218). Baseline demographic and disease characteristics were broadly similar across all subsets of patients and the overall EXPAND population (Table 1).
Demographics and baseline characteristics (PPS a ).
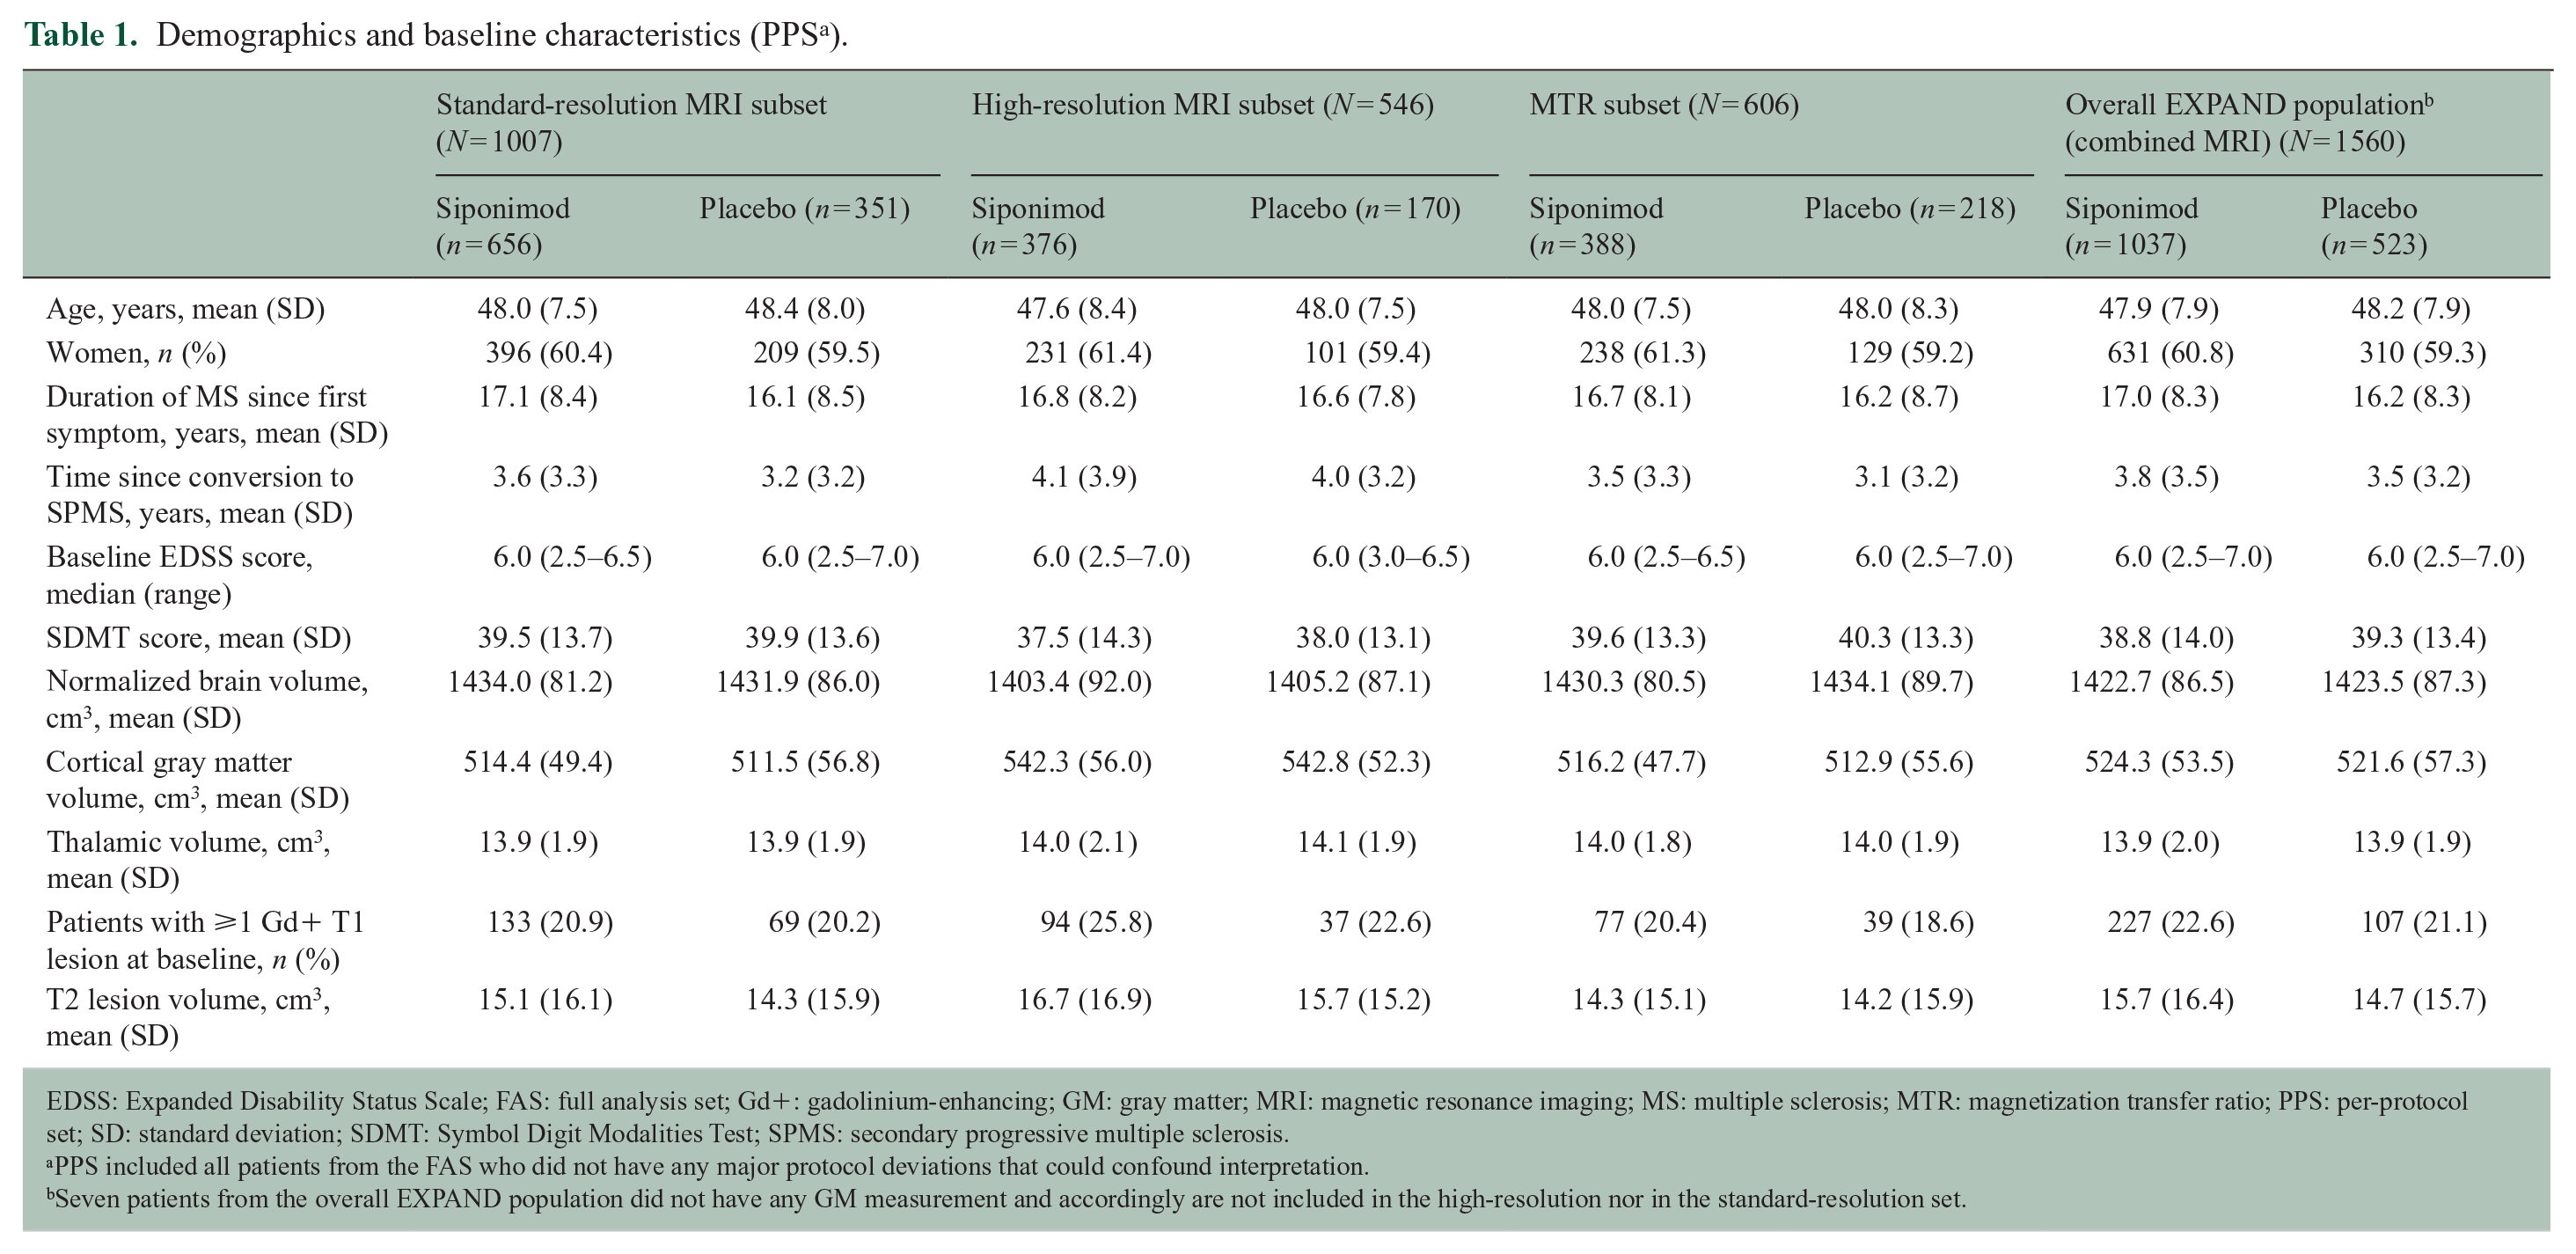
EDSS: Expanded Disability Status Scale; FAS: full analysis set; Gd+: gadolinium-enhancing; GM: gray matter; MRI: magnetic resonance imaging; MS: multiple sclerosis; MTR: magnetization transfer ratio; PPS: per-protocol set; SD: standard deviation; SDMT: Symbol Digit Modalities Test; SPMS: secondary progressive multiple sclerosis.
PPS included all patients from the FAS who did not have any major protocol deviations that could confound interpretation.
Seven patients from the overall EXPAND population did not have any GM measurement and accordingly are not included in the high-resolution nor in the standard-resolution set.
GM atrophy analyses
In the combined MRI cohort, siponimod slowed cGM (with consistent effects in the high- and standard-resolution MRI patient subsets (Supplemental Table S2)), thalamic, and total brain volume loss versus placebo after 12 and 24 months of treatment (PPS; Figure 1).
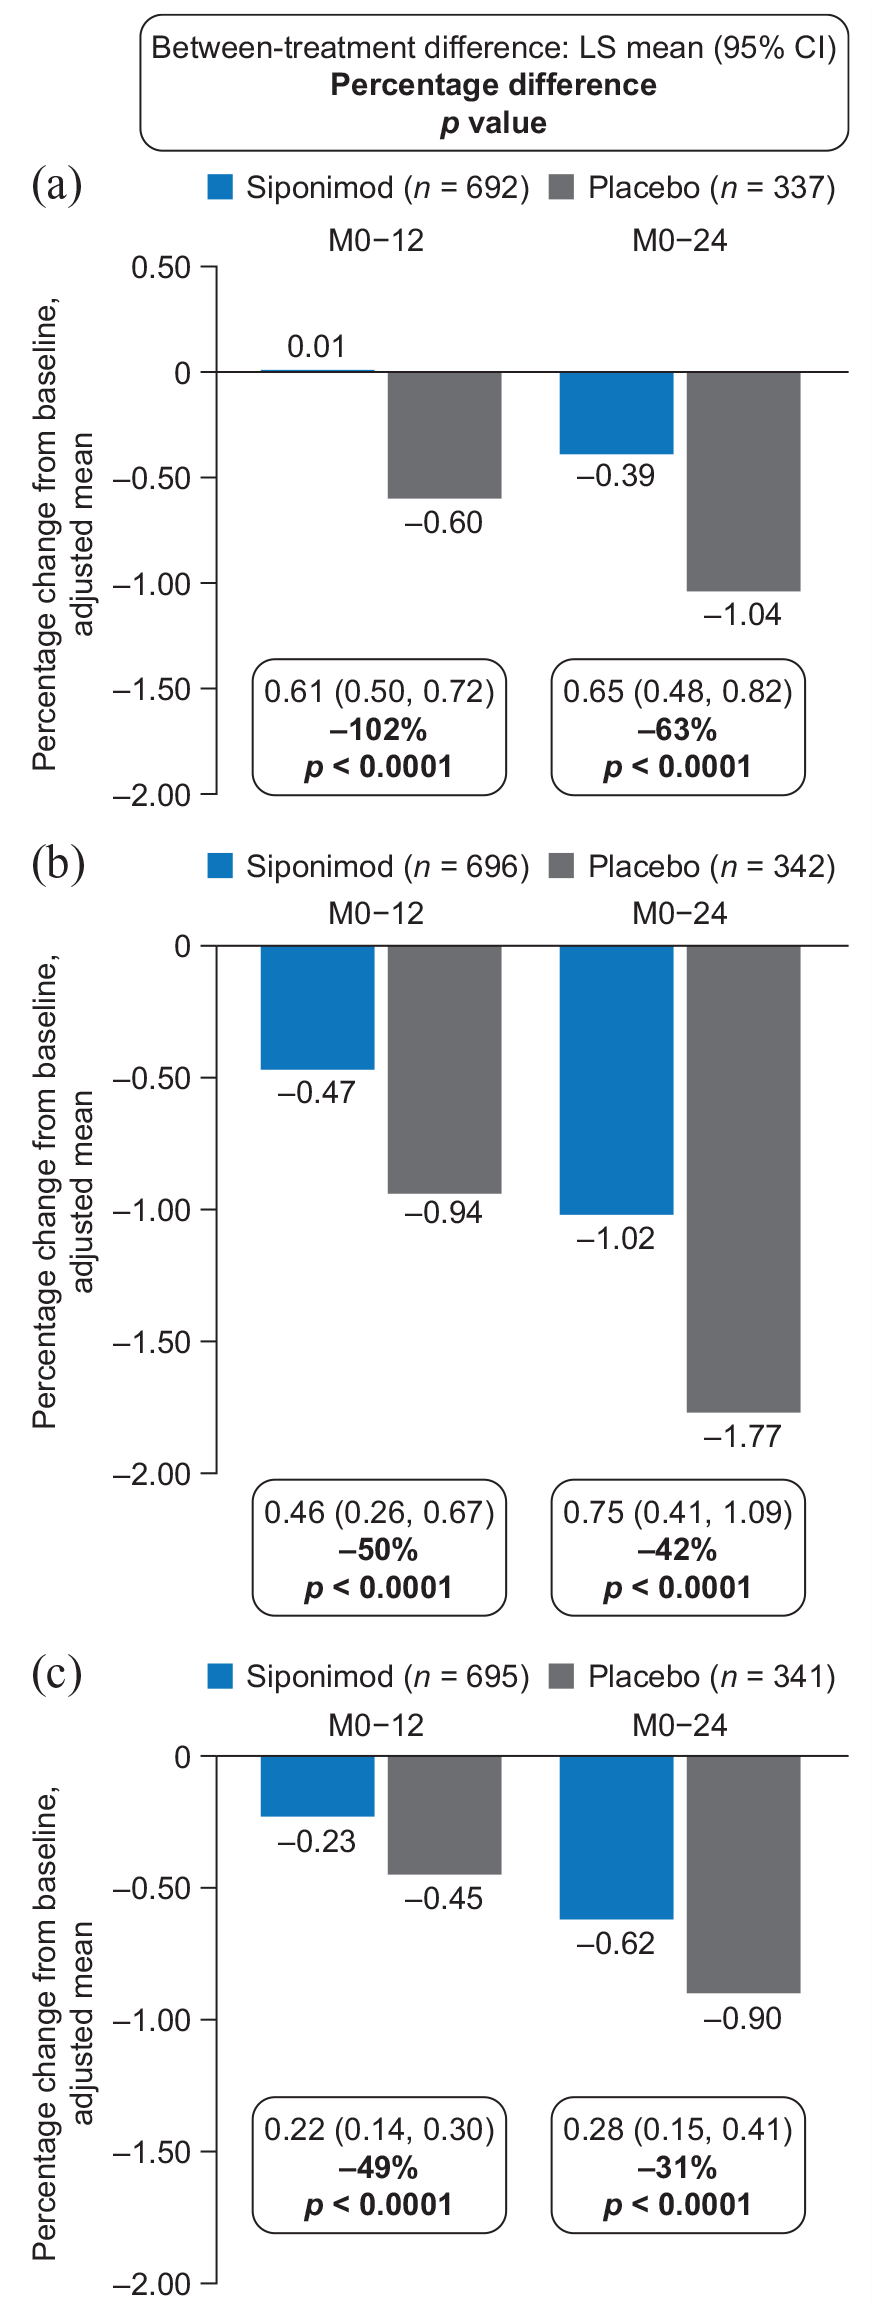
Percentage change in volume of (a) cGM, (b) thalamus, and (c) total brain in the combined MRI cohort (PPSa).
Adjusted mean percentage changes in cGM volume from baseline to month 12 were 0.01 for siponimod and −0.60 for placebo (102% relative reduction in volume loss; p < 0.0001); corresponding changes from baseline to month 24 were −0.39 for siponimod and −1.04 for placebo (63% relative reduction in volume loss; p < 0.0001; Figure 1(a)). Adjusted mean percentage changes in thalamic volume from baseline to month 12 were −0.47 for siponimod and −0.94 for placebo (50% relative reduction in volume loss; p < 0.0001); corresponding changes from baseline to month 24 were −1.02 for siponimod and −1.77 for placebo (42% relative reduction in volume loss; p < 0.0001; Figure 1(b)). Adjusted mean percentage changes in total brain volume from baseline to month 12 were −0.23 for siponimod and −0.45 for placebo (49% relative reduction in volume loss; p < 0.0001); corresponding changes from baseline to month 24 were −0.62 for siponimod and −0.90 for placebo (31% relative reduction in volume loss; p < 0.0001; Figure 1(c)). The effects of siponimod versus placebo on cGM, thalamic, and total brain atrophy were consistent in the FAS (Supplemental Figure S1).
Although the rate of cGM atrophy was constant/similar across subgroups, the rate of thalamic atrophy was more pronounced in the group of patients with inflammatory disease activity (i.e. gadolinium-enhancing lesions). Nevertheless, reductions from baseline to months 12 and 24 in cGM and thalamic atrophy with siponimod versus placebo were consistent across patient subgroups, regardless of baseline age, disease duration, activity, or severity (based on EDSS and SDMT baseline scores) in both the PPS (Figures 2 and 3) and the FAS (data not shown).
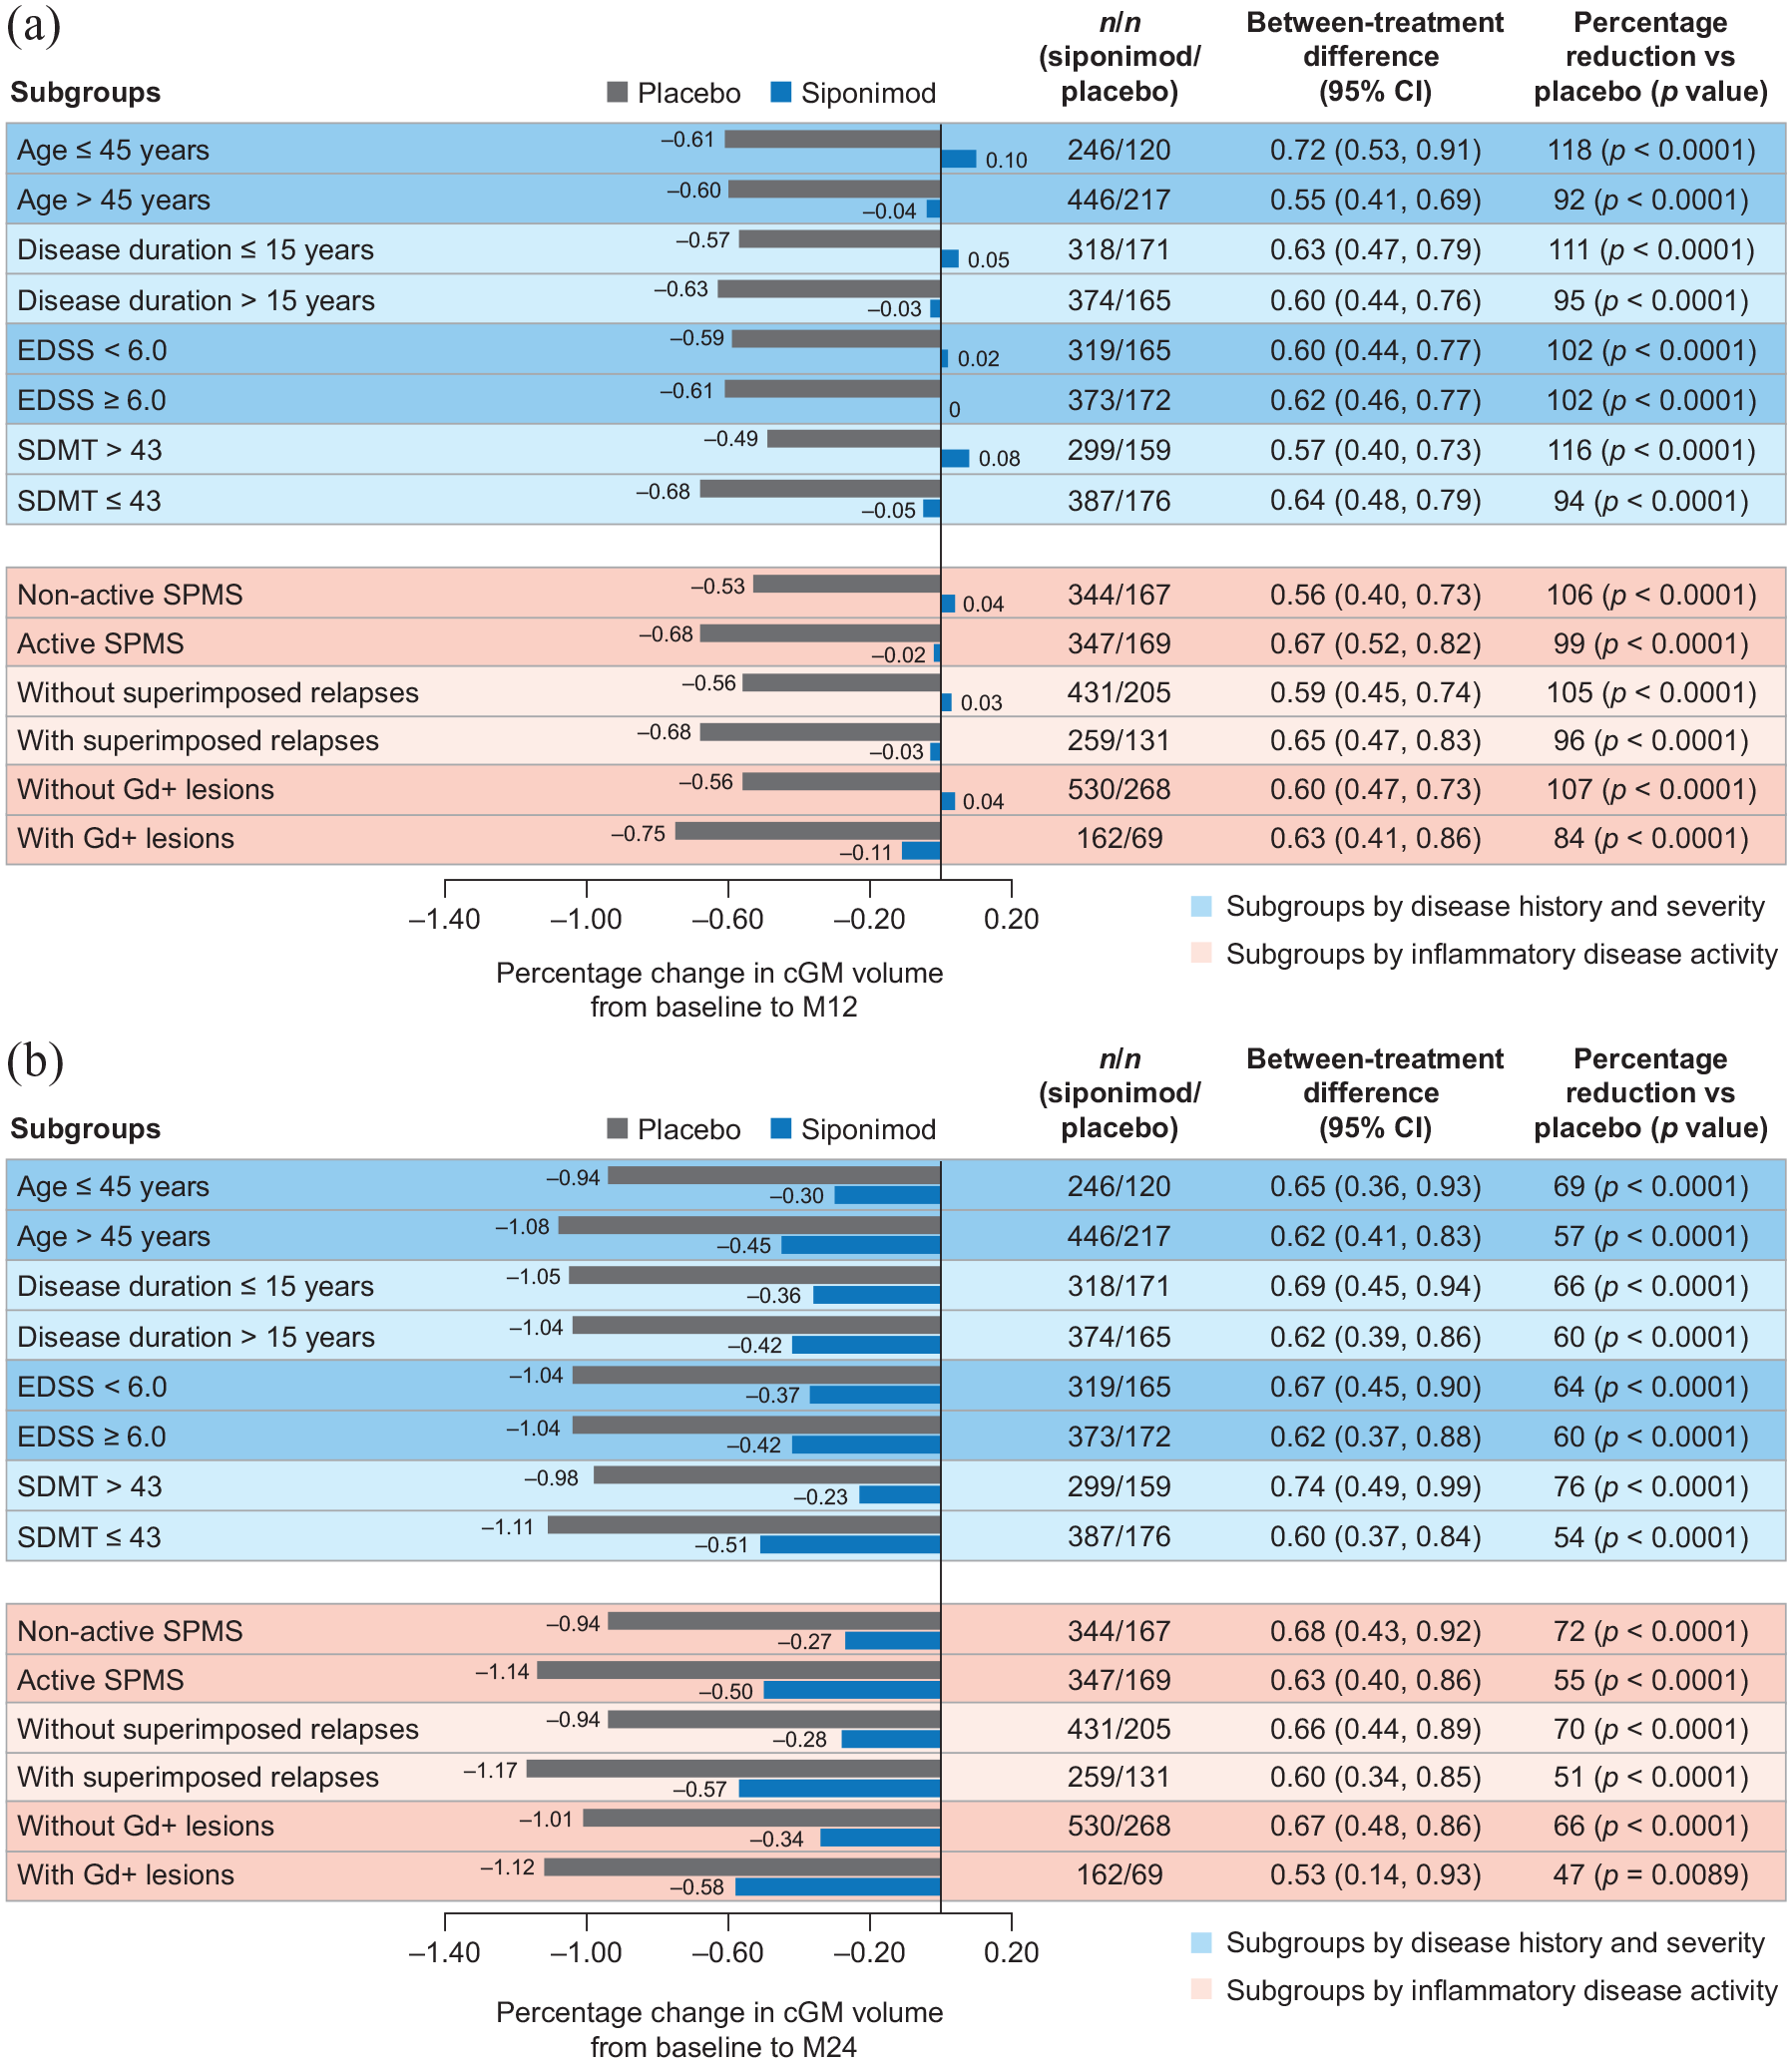
Percentage change in cGM volume (a) from baseline to month 12 and (b) from baseline to month 24 by subgroups according to baseline age, disease duration, severity, or activitya in the combined MRI cohort (PPSb).
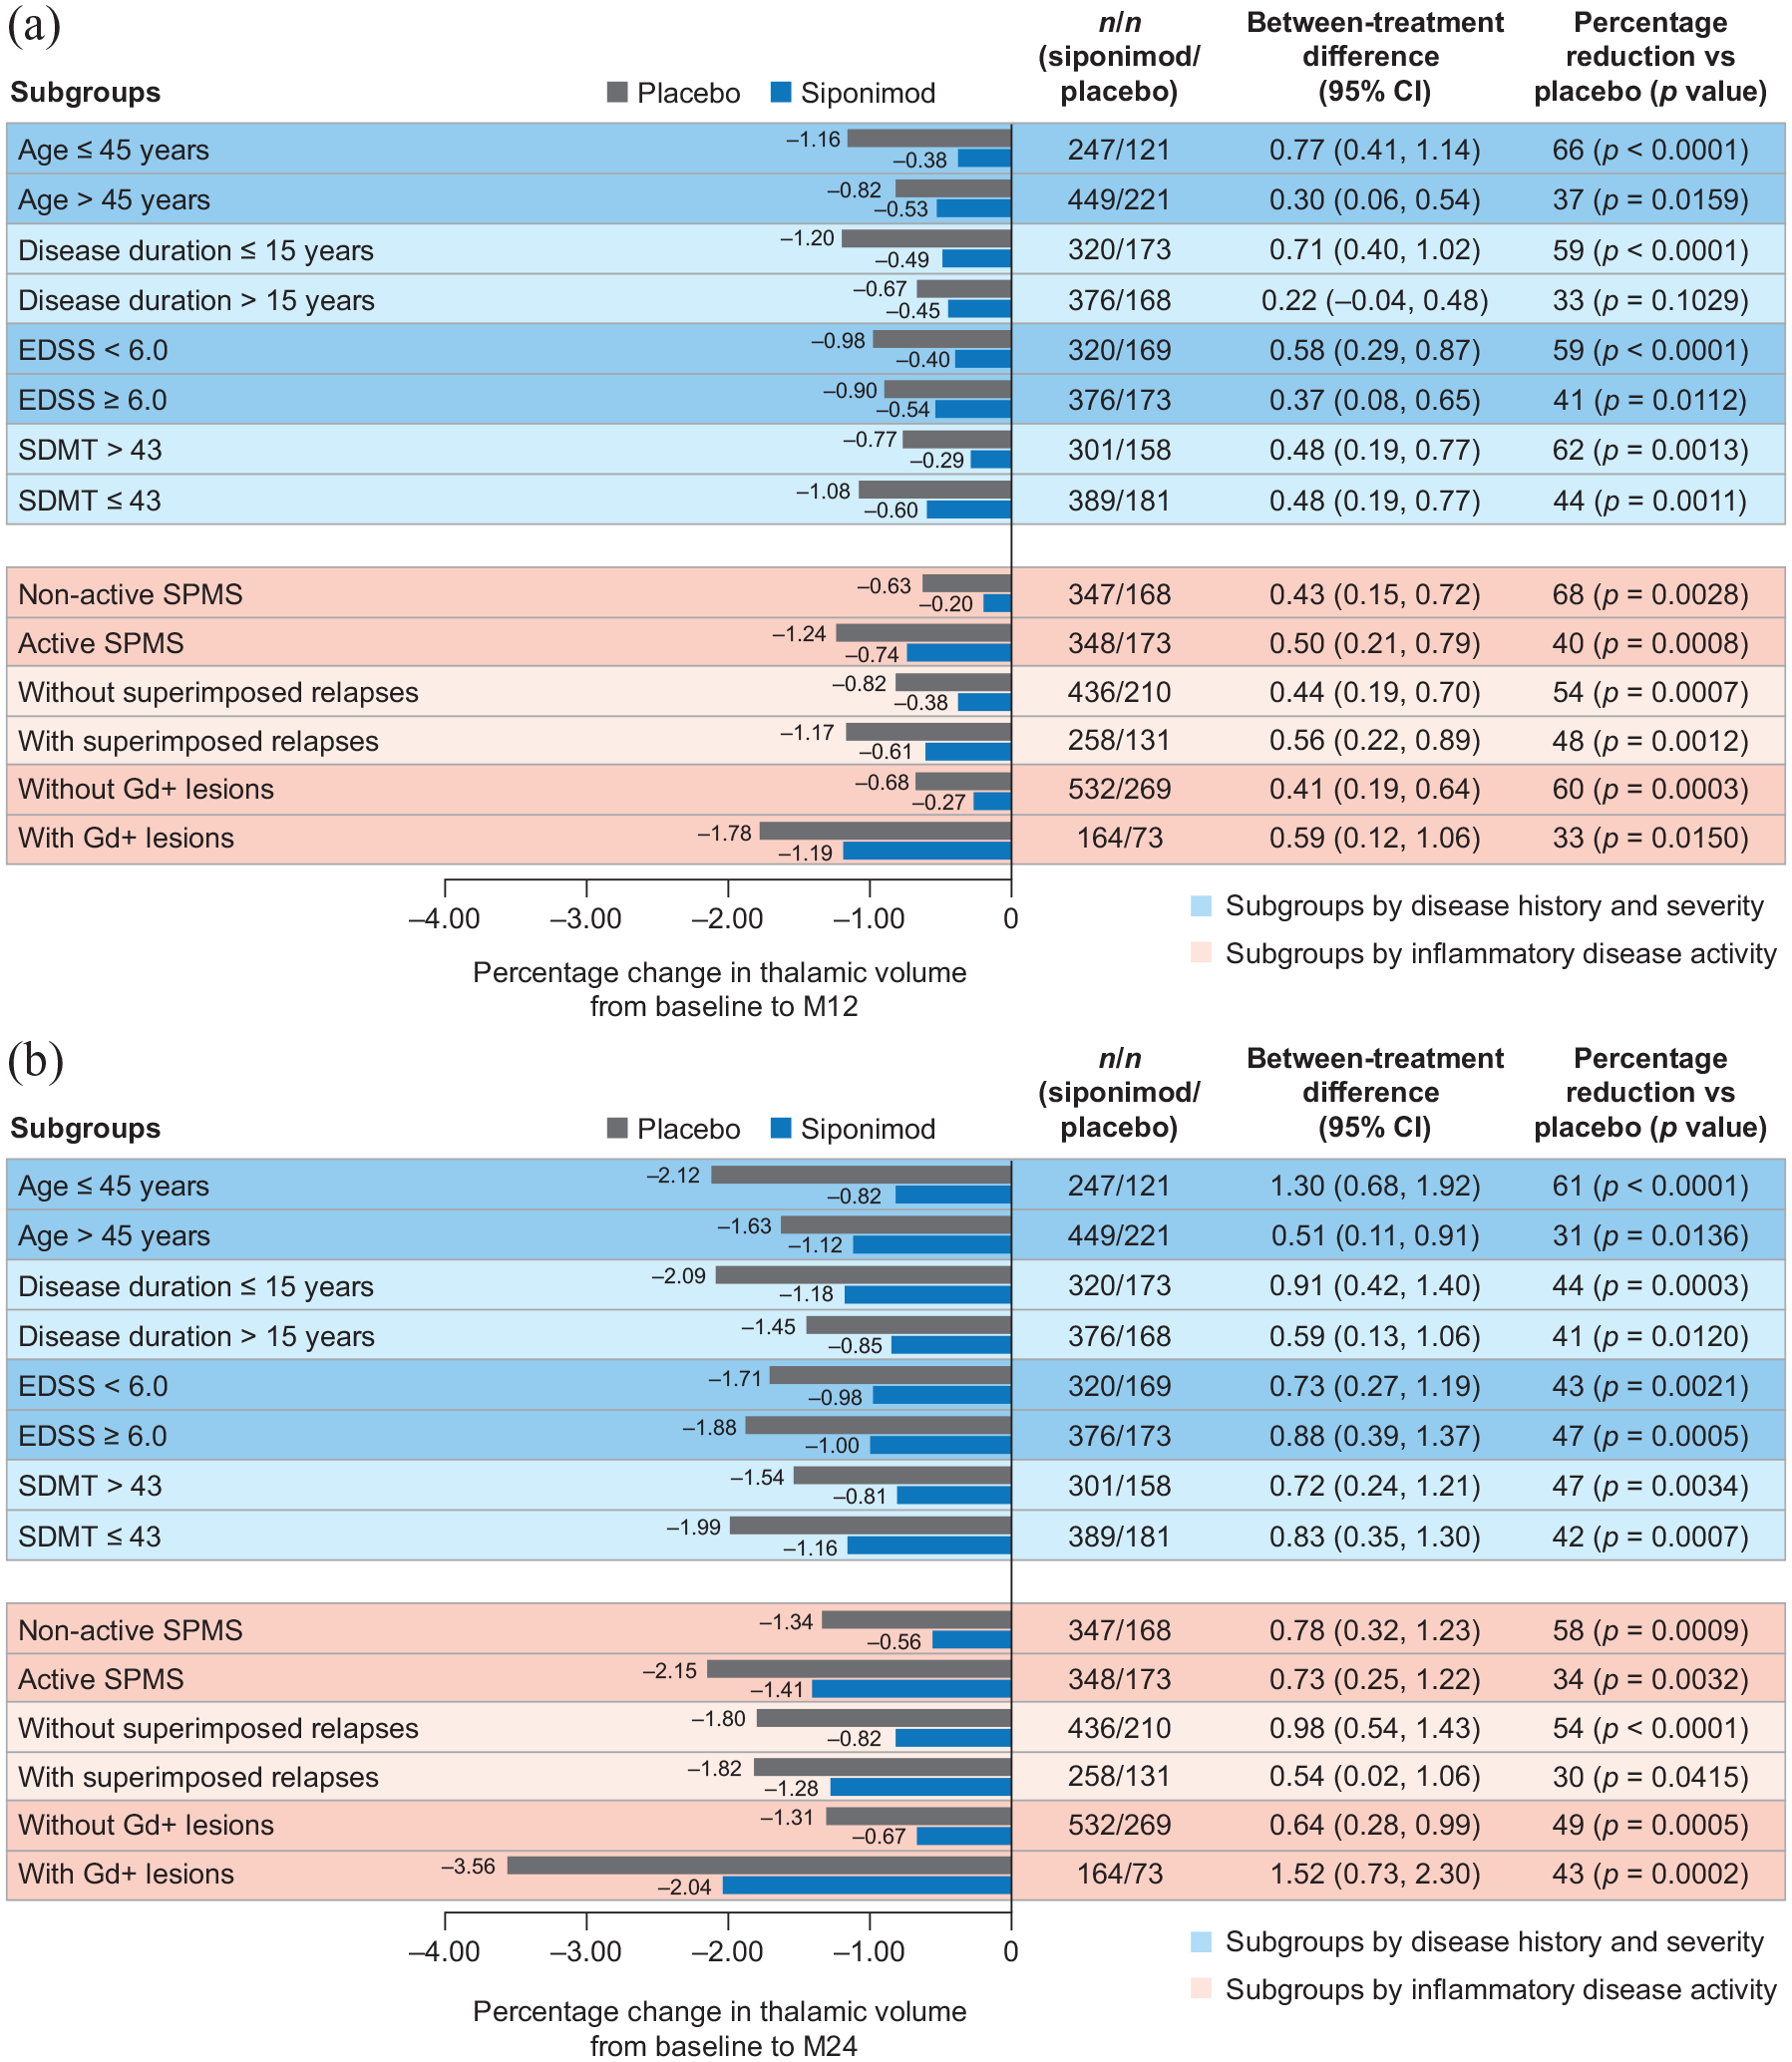
Percentage change in thalamic volume (a) from baseline to month 12 and (b) from baseline to month 24 by subgroups according to baseline age, disease duration, severity, or activitya in the combined standard-resolution and high-resolution MRI cohorts (PPSb).
MTR analyses
In the MTR subset, siponimod was associated with an increase in nMTR from baseline or return to baseline levels in all brain tissues evaluated. These effects were evident at month 24 (PPS; Figure 4).
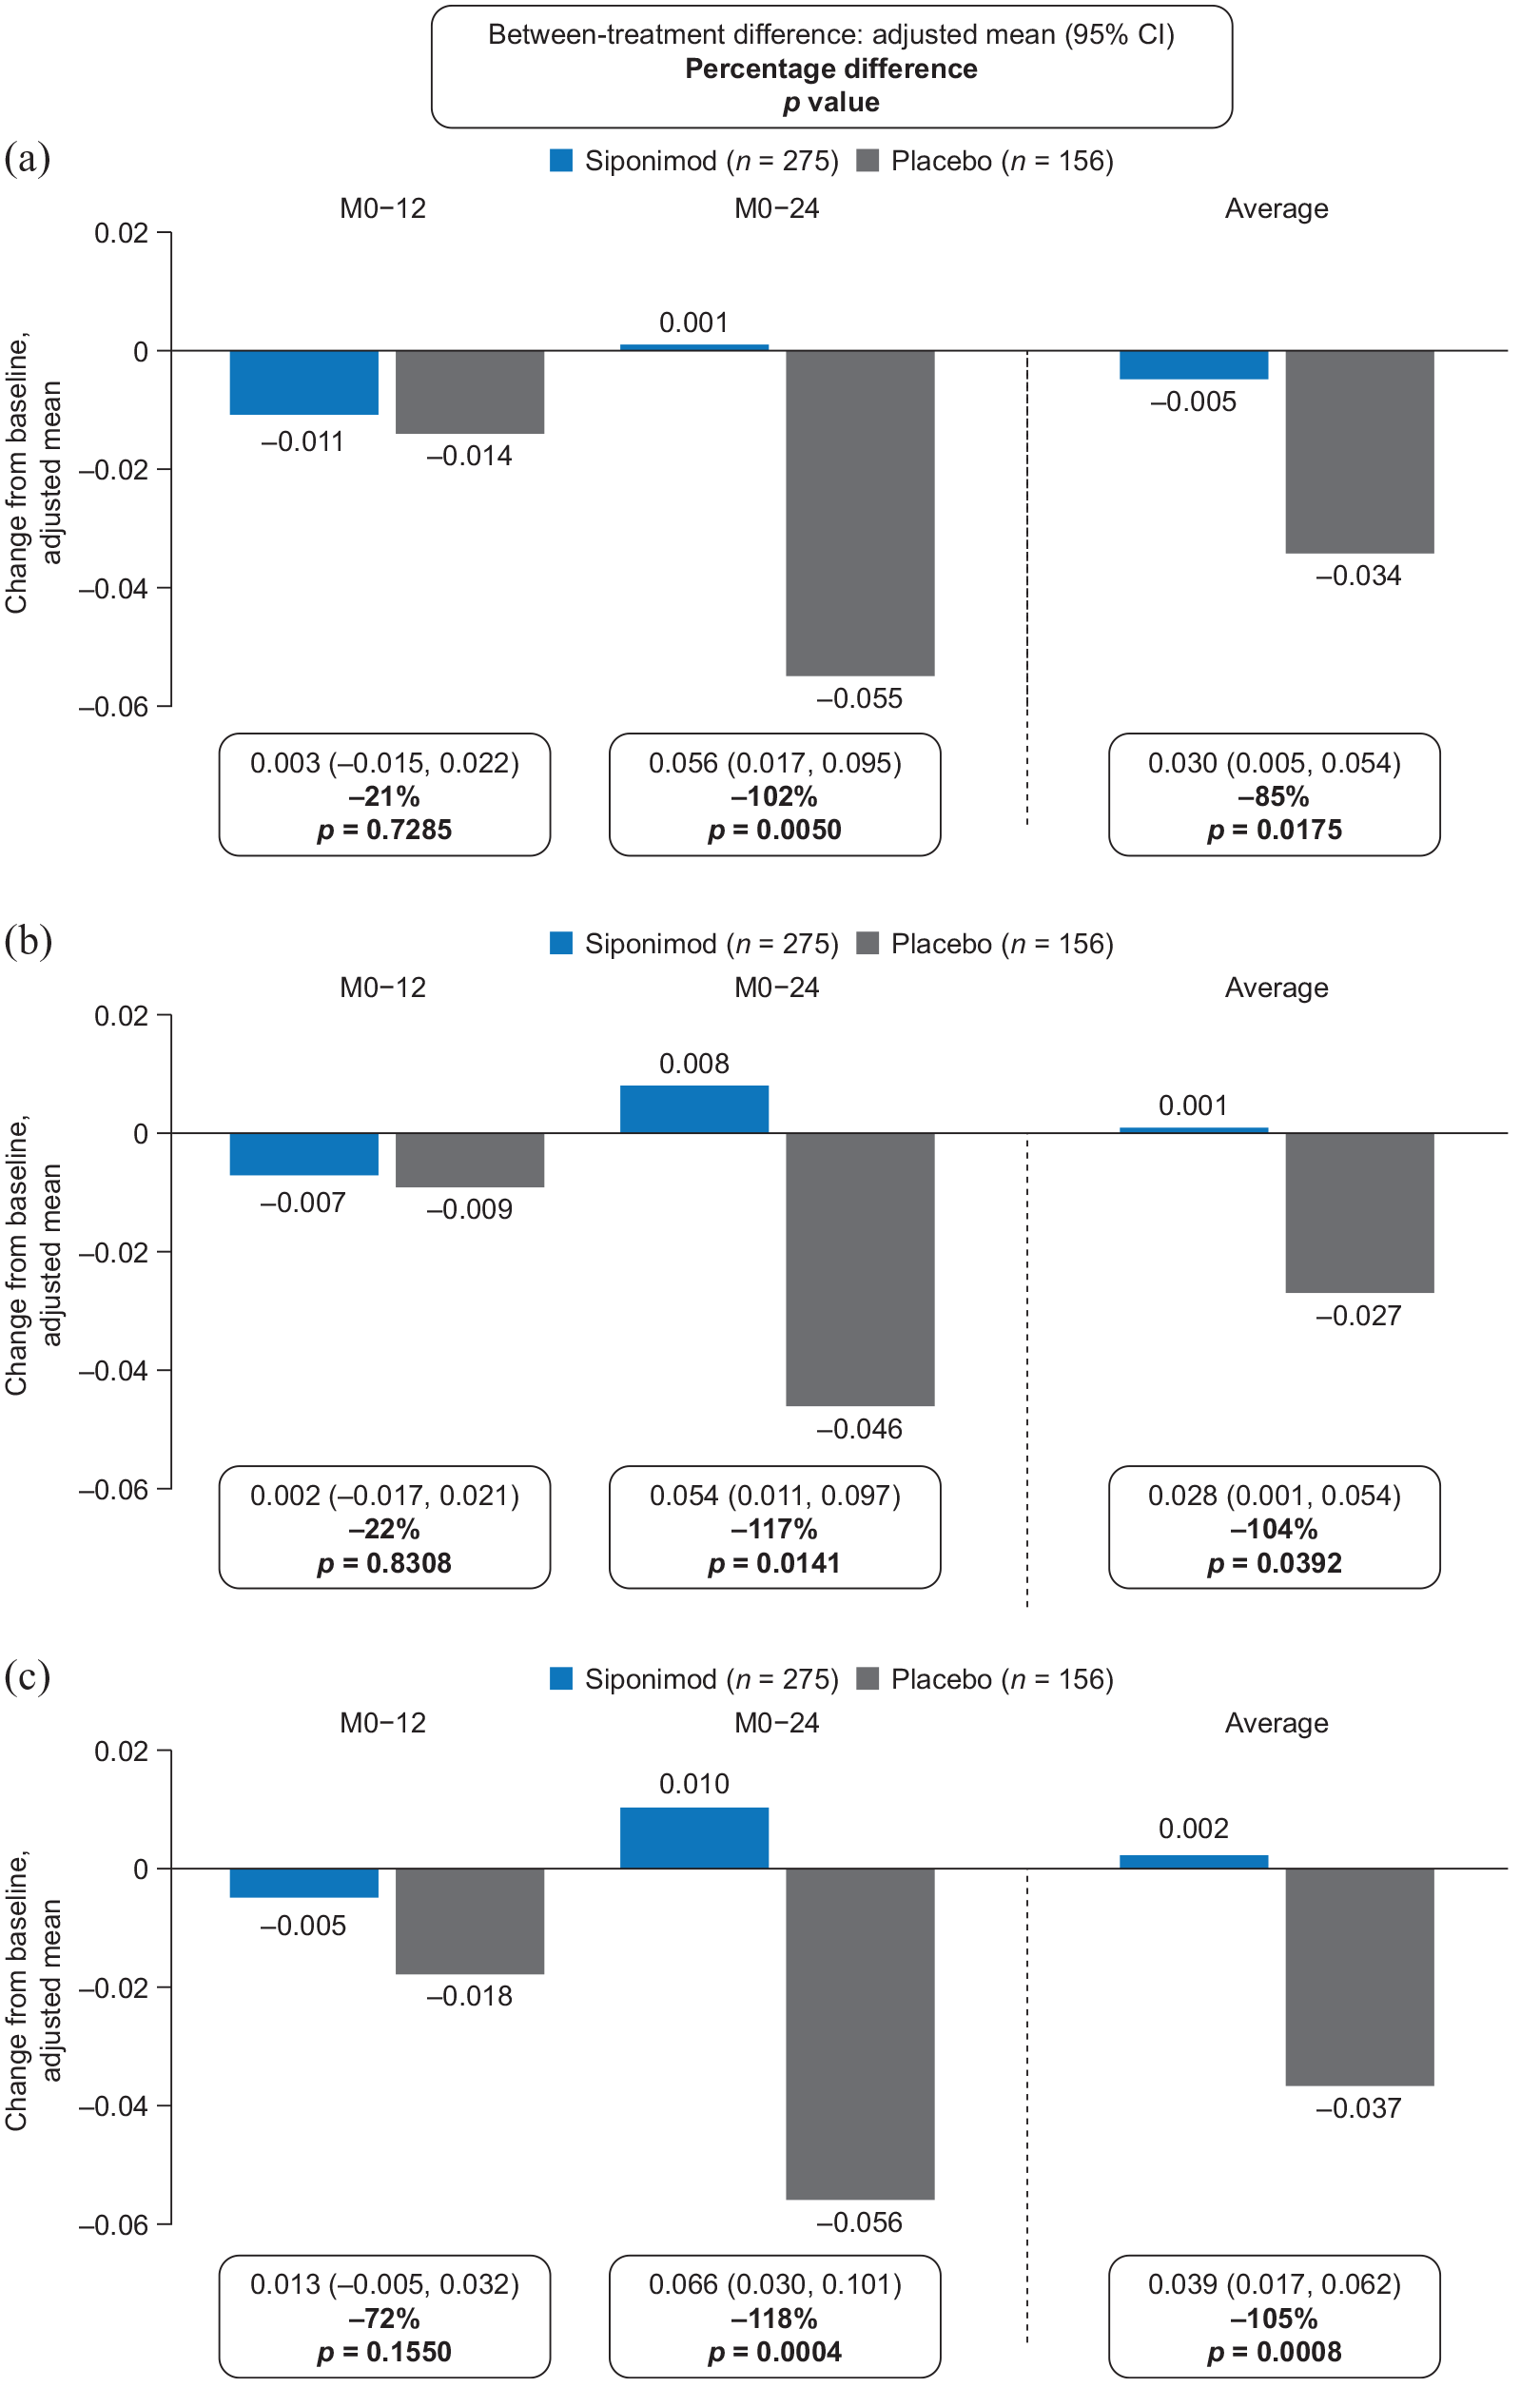
Change from baseline to months 12 and 24 in median nMTRa in (a) NABT, (b) cGM, and (c) NAWM in the MTR subset (PPSb).
There were no significant differences in mean nMTR change from baseline to month 12 with siponimod versus placebo in NABT (−0.011 vs −0.014; between-treatment difference: 21%; p = 0.7285), cGM (−0.007 vs −0.009; between-treatment difference: 22%; p = 0.8308), or NAWM (−0.005 vs −0.018; between-treatment difference: 72%; p = 0.1550). However, by month 24, mean nMTR had increased above baseline levels with siponimod, but had continued to decrease in all tissues with placebo (mean nMTR changes for siponimod vs placebo: NABT, 0.001 vs −0.055; between-treatment difference: 102%; p = 0.0050; cGM, 0.008 vs −0.046; between-treatment difference: 117%; p = 0.0141; NAWM, 0.010 vs −0.056; between-treatment difference: 118%; p = 0.0004); the average of the between-treatment differences at months 12 and 24 for NABT, cGM, and NAWM was in the range 85%–105% (Figure 4). The effect of siponimod versus placebo on reduction or suppression of nMTR decrease over time was consistent in the PPS and the FAS (Supplemental Figure S2).
Compared with placebo, siponimod reduced or suppressed nMTR decrease over time across all patient subgroups (baseline age, disease duration, severity, or activity) in both the PPS (Figure 5) and FAS (data not shown), although the differences did not always reach nominal statistical significance. The magnitude of the between-treatment differences varied across subgroups: from 70% to 170% for NABT (Figure 5(a)); from 59% to 188% for cGM (Figure 5(b)); and from 81% to 195% for NAWM (Figure 5(c)).
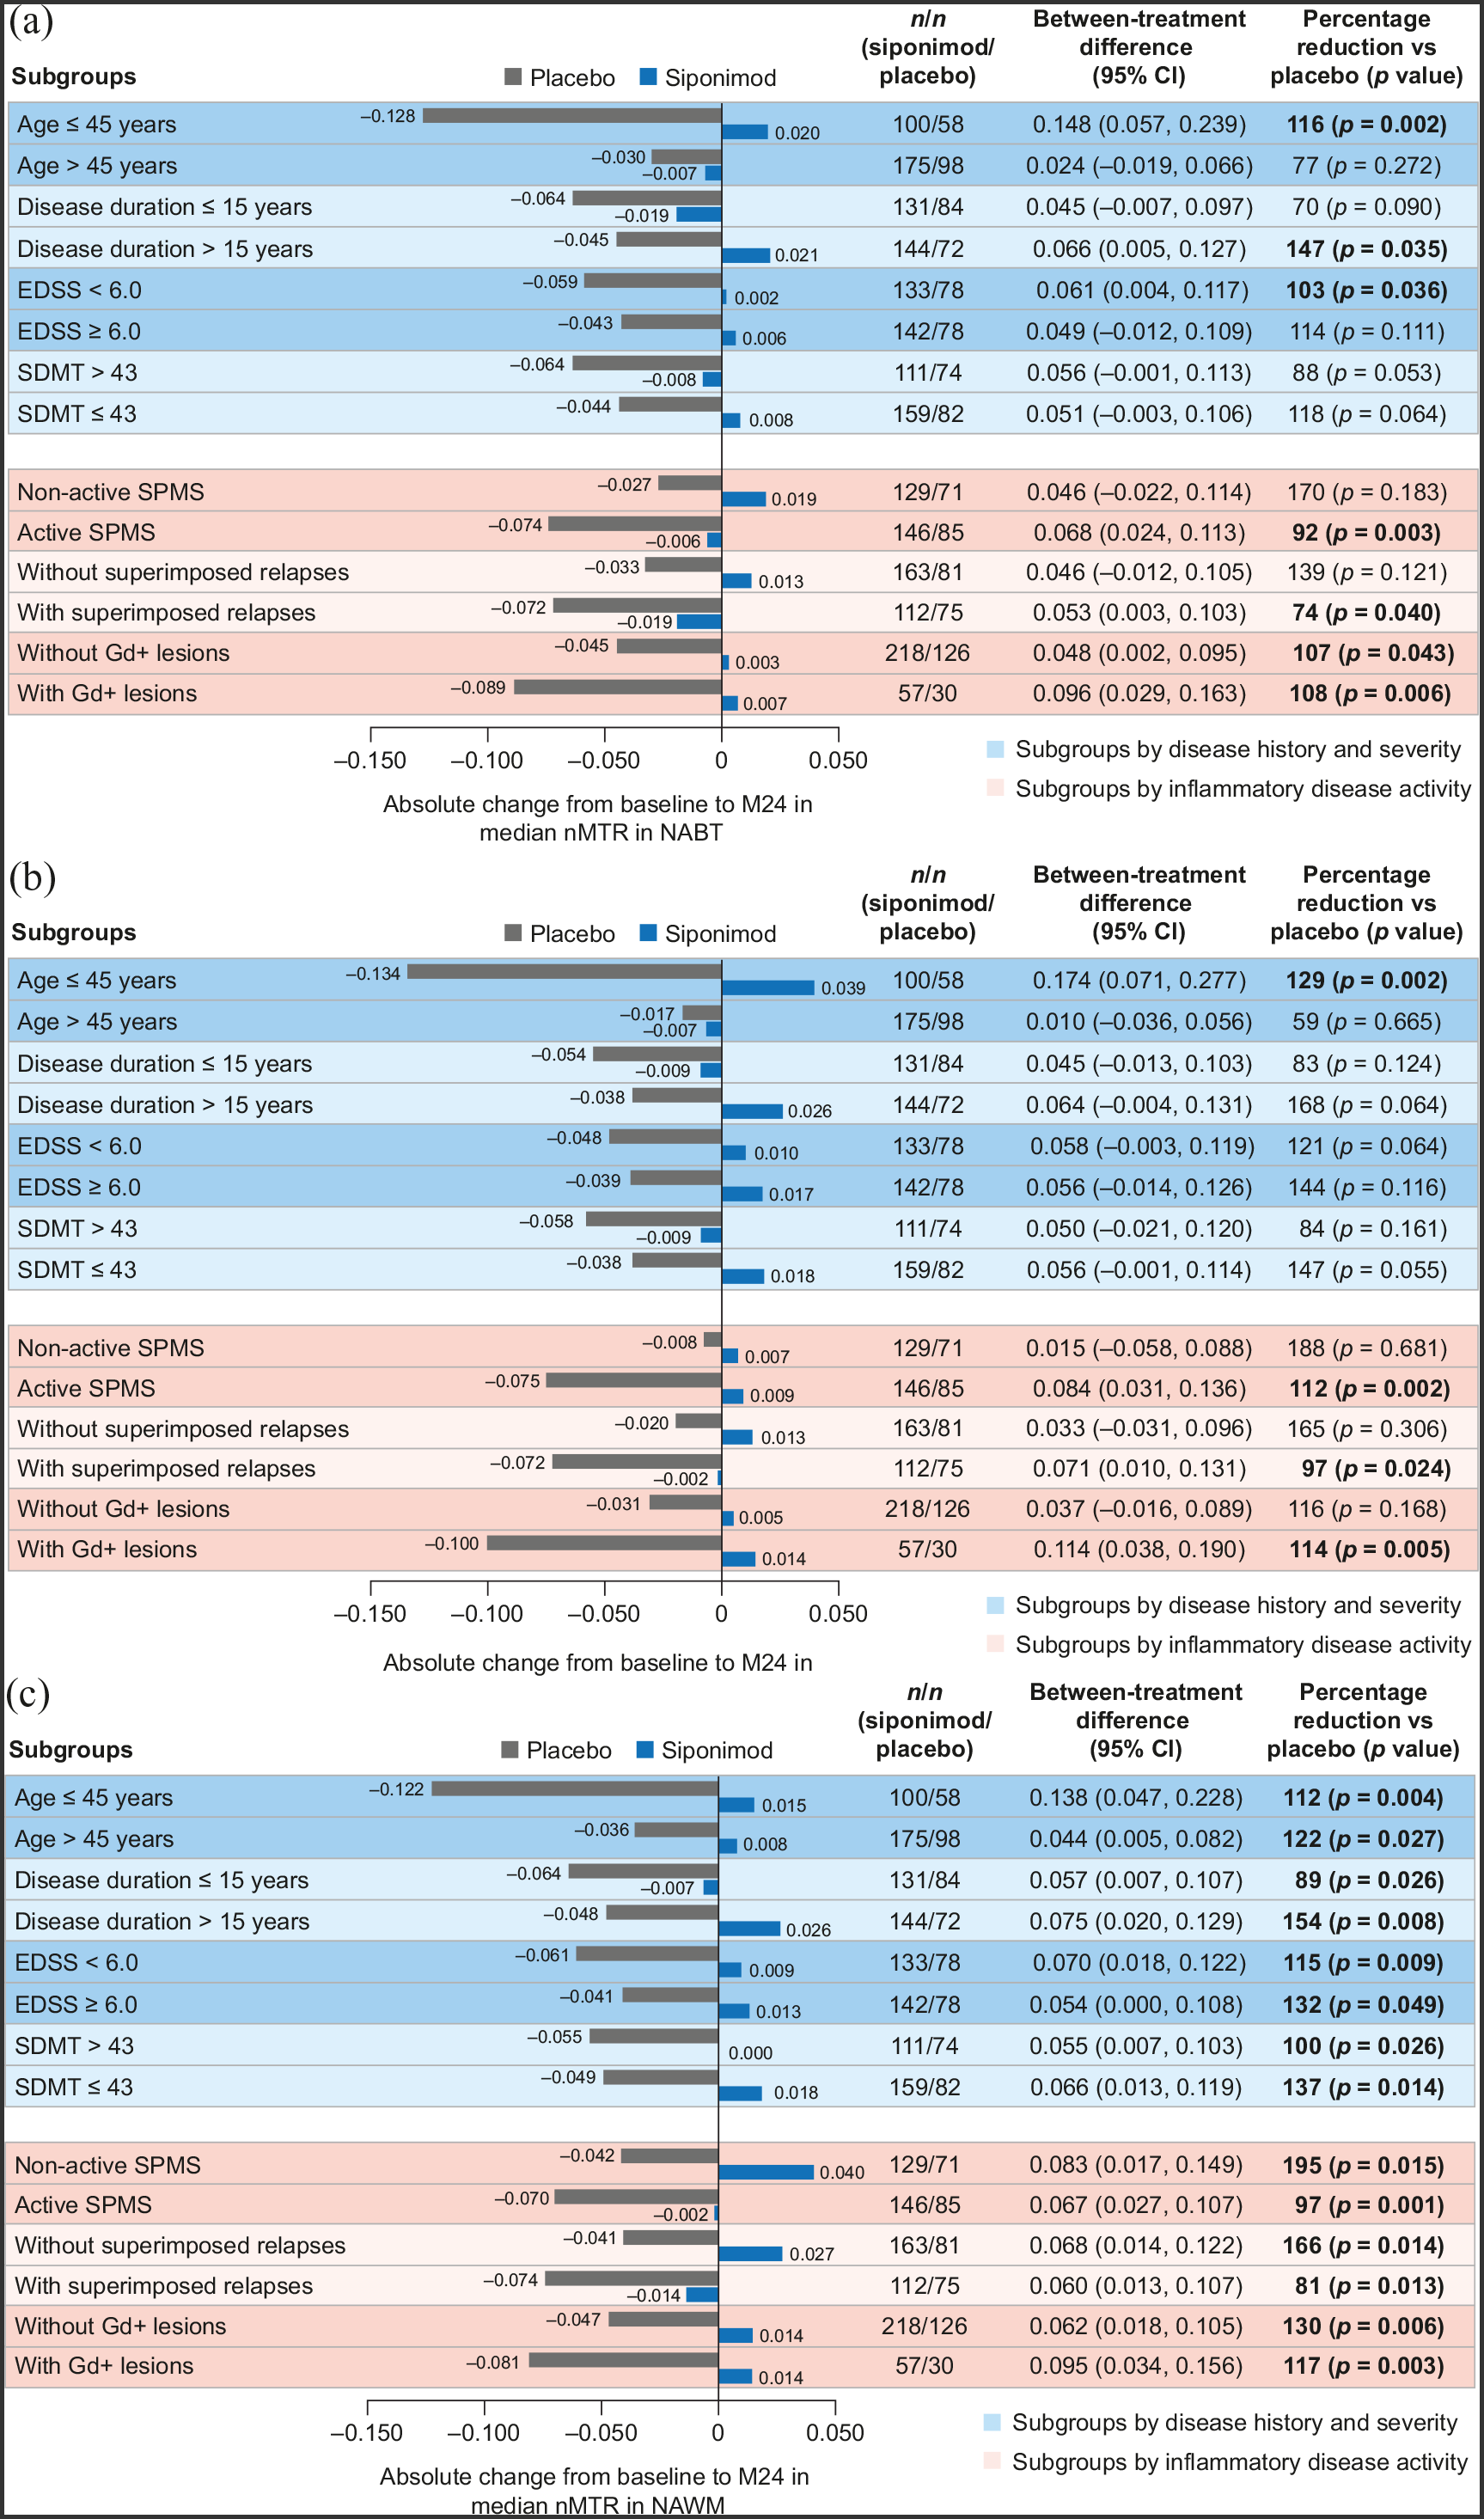
Change in median nMTR from baseline to 24 months in (a) NABT, (b) cGM, and (c) NAWM by subgroups according to baseline age, disease duration, severity, or activitya (PPSb).
In newly formed nMTR lesions, siponimod was associated with improved nMTR recovery versus placebo. Total decrease in nMTR from stable pre-lesion to stable post-lesion values was less with siponimod than placebo (−1.35 vs −1.71; between-treatment difference: 0.36; p < 0.0001) (Table 2). This model was based on the latest pre-lesion and latest post-lesion measurements. Similar results were obtained using a multilevel model with all pre-lesion, new lesion, and post-lesion time points included (Figure 6).
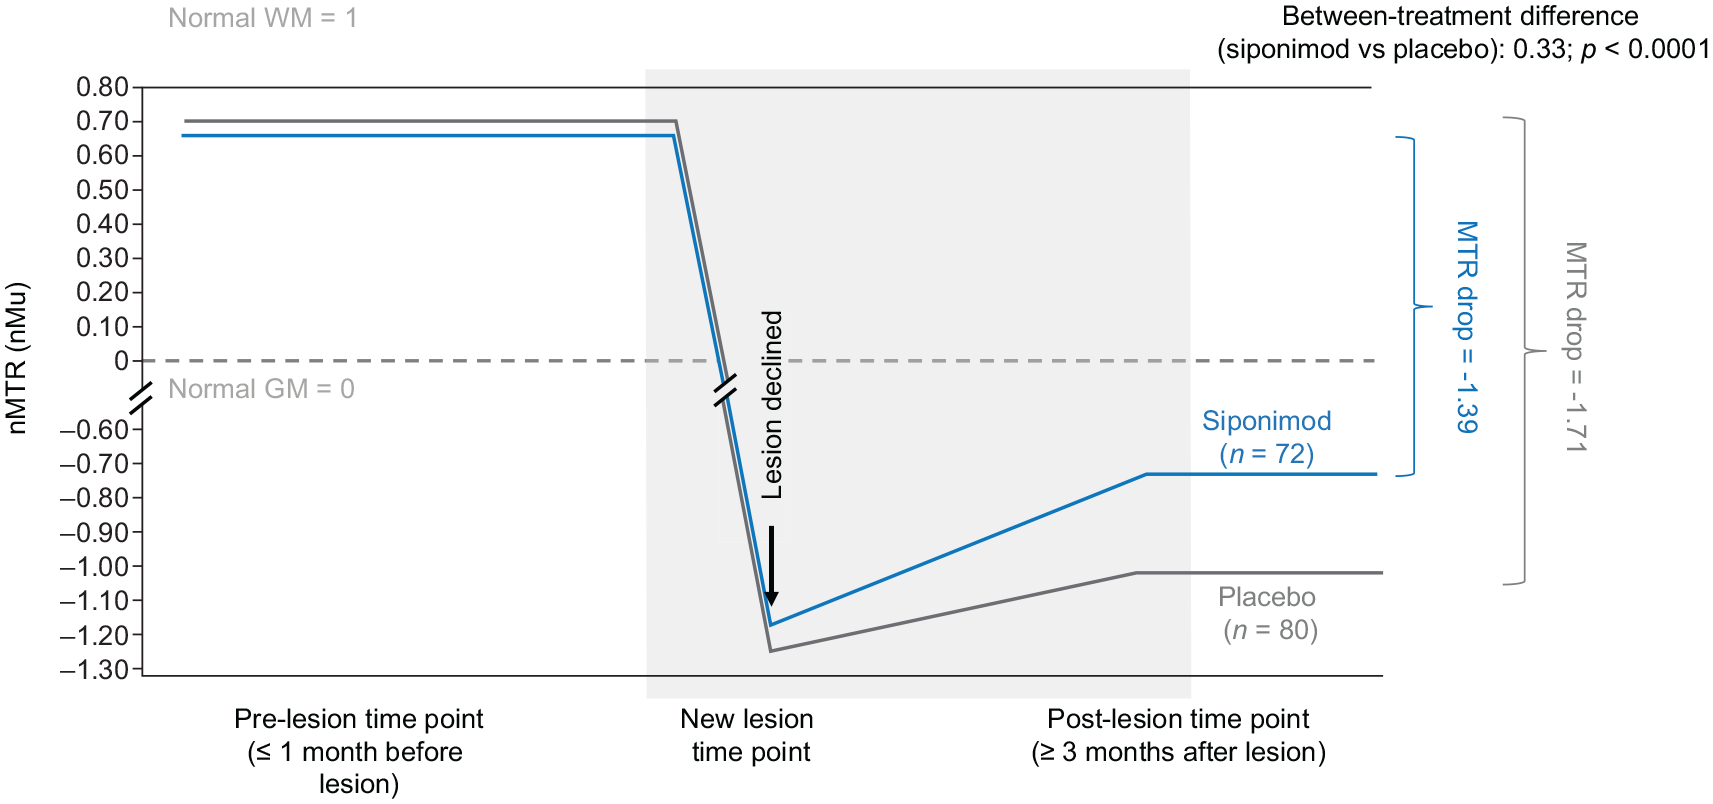
nMTR recovery metrics in nMTR lesions using a model that included all pre-lesional, new lesion, and post-lesional measurements (FASa).
nMTR recovery in nMTR lesions (FAS a ).
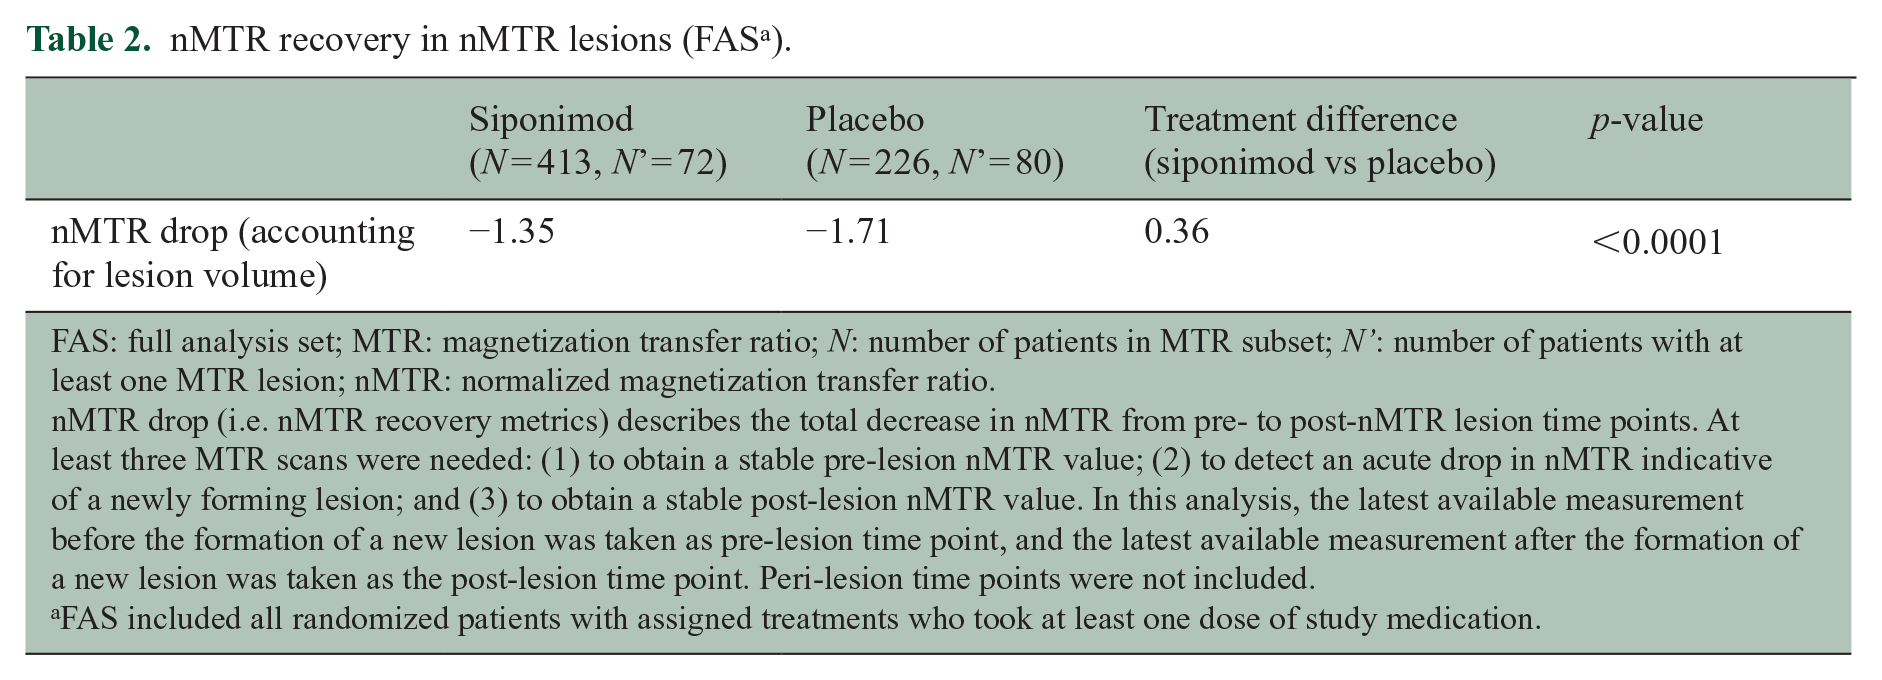
FAS: full analysis set; MTR: magnetization transfer ratio; N: number of patients in MTR subset; N’: number of patients with at least one MTR lesion; nMTR: normalized magnetization transfer ratio.
nMTR drop (i.e. nMTR recovery metrics) describes the total decrease in nMTR from pre- to post-nMTR lesion time points. At least three MTR scans were needed: (1) to obtain a stable pre-lesion nMTR value; (2) to detect an acute drop in nMTR indicative of a newly forming lesion; and (3) to obtain a stable post-lesion nMTR value. In this analysis, the latest available measurement before the formation of a new lesion was taken as pre-lesion time point, and the latest available measurement after the formation of a new lesion was taken as the post-lesion time point. Peri-lesion time points were not included.
FAS included all randomized patients with assigned treatments who took at least one dose of study medication.
Discussion
MRI measures of GM atrophy and brain tissue integrity/myelination provide important insights into changes occurring in brain tissue and may be seen as indicators of chronic, compartmentalized CNS inflammation and neurodegeneration, the primary drivers of progression in patients with SPMS. 30 Treatment response on these MRI markers may therefore represent a therapeutic impact on these chronic inflammatory and neurodegenerative pathways. This analysis from EXPAND showed that, compared with placebo, siponimod is associated with slowing of both cortical and thalamic volume loss, improvement in brain tissue integrity/myelination (assessed by nMTR), and improvement in nMTR recovery in newly formed lesions in patients with SPMS. These findings are compatible with, although not proof of, a direct effect of siponimod on neurodegenerative processes beyond suppression of peripheral inflammation.
Siponimod consistently slowed the progression of cGM atrophy (by 46%–76%) and thalamic atrophy (by 30%–61%) across subgroups stratified by age, disease duration, disease severity (both cognitive and physical), and inflammatory disease activity. A pronounced difference in the dynamics of volume loss was seen between cGM and the thalamus. The presence of gadolinium-enhancing lesions accelerated volume loss in the thalamus but had little impact on cGM atrophy. This observation suggests that different dynamics drive cGM atrophy (less affected by acute inflammatory activity) and thalamic atrophy (substantially affected by acute inflammatory activity). Nevertheless, the effect of siponimod was consistent in patients with or without inflammatory disease activity (i.e. gadolinium-enhancing lesions). Thus, these findings all together suggest that the action of siponimod is being mediated (at least in part) independently of effects on acute inflammation. Reductions in GM atrophy have been associated with positive effects on long-term clinical outcomes, including disability progression and cognitive decline.8–10 The reduced GM atrophy observed here contributes to the previous reported delays in progression of physical disability and cognitive impairment observed with siponimod versus placebo in EXPAND.24,25 Interestingly, other potent anti-inflammatory DMTs such as natalizumab did not show conclusive effects on these measures in patients with SPMS. 31 Ocrelizumab reported significant effects on thalamic atrophy but no significant effects in reducing cGM atrophy in patients with progressive MS. 32
Siponimod positively affected brain tissue integrity/myelination (assessed by nMTR), consistently slowing nMTR decrease over 24 months in NABT (by 70%–170%), cGM (by 59%–188%), and NAWM (by 81%–195%). This effect was most pronounced in NAWM, in which a significant increase in nMTR relative to placebo was observed in most subgroups. Importantly, diffuse injury in NAWM is closely associated with cortical lesion volume. 3 Effects on nMTR became more pronounced over time, with nMTR returning to or surpassing baseline in patients treated with siponimod. Although MTR increases may be associated with resolution of edema, the changes reported here were made in normal-appearing tissues, which are not subject to large changes in water content, and in acute lesions with reference to stable pre-lesion and post-lesion levels. Under these circumstances, the recovery of inflammatory edema associated with acute lesions is not relevant, and these changes could be interpreted as reflecting improvements in myelin density and tissue integrity. This is supported by the fact that nMTR recovered to a greater extent with siponimod than with placebo even in patients without inflammatory disease activity. The fact that the treatment effect on nMTR only became apparent during the second year of treatment suggests that measures of neurodegeneration and neuroprotective mechanisms may need to be monitored over a relatively long time before becoming detectable. The fact that siponimod improved nMTR recovery in newly formed nMTR lesions is consistent with observations from preclinical studies showing that siponimod promotes remyelination.22,33
There is little precedence in the clinical trial literature of currently approved DMTs for the observations reported here with siponimod in patients with SPMS. Other DMTs have been reported to slow cortical and thalamic GM atrophy mainly in relapsing MS.32,34 Reports of increased MTR levels have been made in relapsing MS, where dimethyl fumarate has been shown to increase MTR in normal-appearing tissues 27 but not in newly formed lesions, and not in SPMS. Observations from preclinical models support a promyelinating effect of siponimod.22,33 Taken together with the findings from this study, siponimod may have an impact on the neurodegenerative component of SPMS (in addition to anti-inflammatory effects) that may have contributed to the reduced risk of disability progression and of cognitive worsening observed with siponimod versus placebo in EXPAND. Most DMTs approved for relapsing MS, including highly effective anti-inflammatory drugs such as natalizumab, 31 failed to slow disability progression when studied in SPMS or primary progressive multiple sclerosis (PPMS). Conversely, ibudilast, a DMT in development, was associated with benefits on markers of neurodegeneration but not on markers of acute inflammation in a phase 2 trial in patients with progressive MS. 35 Thus, therapeutic action on inflammation and neurodegeneration is de-coupled in other DMTs. As shown in clinical and preclinical studies, siponimod appears to affect both neurodegeneration/demyelination and inflammation, consistent with a dual mode of action.
A few limitations to this study are important to appreciate. Brain volume changes on the order of a fraction of a percent can result from causes other than irreversible neurodegeneration, and the subtle increases in brain volume observed here could reflect increases in the volume of glial cells, and not necessarily neuronal cells (although this may still be an important neuroprotective effect). Similarly, the changes in MTR, although relatively specific for myelin, are associated with changes in other tissue components, which tend to change in a correlated fashion. Changes in tissue water can be associated with small changes in brain volume or MTR simply because of dilution or concentration. However, for this effect to be responsible for the observations reported here, increases in MTR would have to have been associated with increased atrophy, which was not the case. Considering that MRI scans in this study were scheduled annually, it was not possible to determine the exact time of onset of lesion formation for all MTR lesions. This analysis also relied on the assumption that MTR values were stable outside the period of acute lesion formation and recovery.
In summary, these beneficial effects of siponimod on regional brain atrophy and tissue integrity/myelination are consistent with previous preclinical findings and highlight possible direct CNS effects of siponimod, which may be relevant to its effects on disability progression and cognitive processing speed in patients with SPMS.
Supplemental Material
sj-doc-1-msj-10.1177_13524585221076717 – Supplemental material for Effect of siponimod on magnetic resonance imaging measures of neurodegeneration and myelination in secondary progressive multiple sclerosis: Gray matter atrophy and magnetization transfer ratio analyses from the EXPAND phase 3 trial
Supplemental material, sj-doc-1-msj-10.1177_13524585221076717 for Effect of siponimod on magnetic resonance imaging measures of neurodegeneration and myelination in secondary progressive multiple sclerosis: Gray matter atrophy and magnetization transfer ratio analyses from the EXPAND phase 3 trial by Douglas L Arnold, Daniela Piani-Meier, Amit Bar-Or, Ralph HB Benedict, Bruce AC Cree, Gavin Giovannoni, Ralf Gold, Patrick Vermersch, Sophie Arnould, Frank Dahlke, Thomas Hach, Shannon Ritter, Göril Karlsson, Ludwig Kappos and Robert J Fox in Multiple Sclerosis Journal
Supplemental Material
sj-docx-1-msj-10.1177_13524585221076717 – Supplemental material for Effect of siponimod on magnetic resonance imaging measures of neurodegeneration and myelination in secondary progressive multiple sclerosis: Gray matter atrophy and magnetization transfer ratio analyses from the EXPAND phase 3 trial
Supplemental material, sj-docx-1-msj-10.1177_13524585221076717 for Effect of siponimod on magnetic resonance imaging measures of neurodegeneration and myelination in secondary progressive multiple sclerosis: Gray matter atrophy and magnetization transfer ratio analyses from the EXPAND phase 3 trial by Douglas L Arnold, Daniela Piani-Meier, Amit Bar-Or, Ralph HB Benedict, Bruce AC Cree, Gavin Giovannoni, Ralf Gold, Patrick Vermersch, Sophie Arnould, Frank Dahlke, Thomas Hach, Shannon Ritter, Göril Karlsson, Ludwig Kappos and Robert J Fox in Multiple Sclerosis Journal
Footnotes
Acknowledgements
The authors are grateful to Angela Pozo Ramajo (Oxford PharmaGenesis, Oxford, UK) for providing medical writing support, and to Jenny Thorp and Allie Gonzato (Oxford PharmaGenesis) for providing editorial support. These services were sponsored by Novartis Pharma AG (Basel, Switzerland).
Declaration of Conflicting Interests
The author(s) declared the following potential conflicts of interest with respect to the research, authorship, and/or publication of this article: D.L.A. has received personal fees from Acorda, Albert Charitable Trust, Biogen, Celgene, Frequency Therapeutics, GeNeuro, MedDay, Merck Serono, Novartis, Roche, Sanofi Aventis, and Wave Life Sciences; grants from Biogen, Immunotec, and Novartis; and has equity interest in NeuroRx, outside the submitted work. A. B.-O. has participated as a speaker in meetings sponsored by and received consulting fees and/or grant support from Accure, Atara Biotherapeutics, Biogen, BMS/Celgene/Receptos, GlaxoSmithKline, Gossamer, Janssen/Actelion, MedImmune, Merck/EMD Serono, Novartis, Roche/Genentech, and Sanofi Genzyme. R.H.B.B. has received honoraria, speaking, or consulting fees from Biogen, Celgene, EMD Serono, Genentech, MedDay, Novartis, and Roche; research support from Biogen, Genentech, and Novartis; and royalties from Psychological Assessment Resources. B.A.C.C. has received personal compensation for consulting from Alexion, Atara, Autobahn, Avotres, EMD Serono, Novartis, Sanofi, TG Therapeutics, and Therini; and research support from Genentech. G.G. has received compensation for serving as a consultant or speaker for or has received research support from AbbVie, Aslan, Atara Bio, Biogen, BMS-Celgene, GlaxoSmithKline, GW Pharma, Janssen/Actelion, Japanese Tobacco, Jazz Pharmaceuticals, LifNano, Merck & Co., Merck KGaA/EMD Serono, Novartis, Sanofi Genzyme, Roche/Genentech, and Teva. R.G. has received compensation for serving as a consultant or speaker from Bayer HealthCare, Biogen Idec, Merck Serono, Novartis, and Teva Neuroscience; and he or the institution he works for has received research support from Bayer HealthCare, Biogen Idec, Merck Serono, Novartis, and Teva Neuroscience; he has also received fees for service as a journal editor from SAGE and Thieme Verlag. P.V. has received fees for service and consulting fees from AB Science, Biogen, Celgene, Imcyse, Merck, Novartis, Roche, Sanofi Genzyme, and Teva, and research support from Novartis, Roche and Sanofi Genzyme. L.K.’s institution (University Hospital Basel) has received steering committee, advisory board and consultancy fees used exclusively for research support in the department, as well as support of educational activities, from Actelion, Allergan, Almirall, Baxalta, Bayer, Biogen, Celgene/Receptos, CSL-Behring, Desitin, Eisai, Excemed, F. Hoffmann-La Roche Ltd., Genzyme, Japan Tobacco, Merck, Minoryx, Novartis, Pfizer, Sanofi Aventis, Santhera, and Teva; and license fees for Neurostatus-UHB products. Research at the MS Center in Basel has been supported by grants from Bayer, Biogen, the European Union, Innosuisse, Novartis, Roche, the Swiss MS Society, and the Swiss National Research Foundation. R.J.F. has received personal fees from Actelion, Biogen, Celgene, EMD Serono, Genentech, Immunic, Novartis, and Teva; grants from Novartis; and other support from Biogen and Novartis (clinical trial contracts). D.P.-M., S.A., T.H., S.R., and G.K. are the employees of Novartis Pharma AG. F.D. was an employee of Novartis Pharma AG, at the time of writing.
Funding
The author(s) disclosed receipt of the following financial support for the research, authorship, and/or publication of this article: The EXPAND trial was funded by Novartis Pharma AG (Basel, Switzerland). Novartis Pharma AG supported the development of this manuscript, provided data analyses according to the direction of the authors and paid for medical writing support.
Supplemental material
Supplemental material for this article is available online.
References
Supplementary Material
Please find the following supplemental material available below.
For Open Access articles published under a Creative Commons License, all supplemental material carries the same license as the article it is associated with.
For non-Open Access articles published, all supplemental material carries a non-exclusive license, and permission requests for re-use of supplemental material or any part of supplemental material shall be sent directly to the copyright owner as specified in the copyright notice associated with the article.