
Abstract
Acoustic comfort has been used in engineering to refer to conditions of low noise levels or annoyance, while current standardized methods for airborne and impact sound reduction are used to assess acoustic comfort in dwellings. However, the results and descriptors acquired from acoustic measurements do not represent the human perception of sound or comfort levels. This article is a review of laboratory studies concerning airborne sound in dwellings. Specifically, this review presents studies that approach acoustic comfort via the association of objective and subjective data in laboratory listening tests, combining airborne sound acoustic data, and subjective ratings. The presented studies are tabulated and evaluated using Bradford Hill’s criteria. Many of them attempt to predict subjective noise annoyance and find the best single number quantity for that reason. The results indicate that subjective response to airborne sound is complicated and varies according to different sound stimuli. It can be associated sufficiently with airborne sound in general but different descriptors relate best to music sounds or speech stimuli. The inclusion of low frequencies down to 50 Hz in the measurements seems to weaken the association of self-reported responses to airborne sound types except for the cases of music stimuli.
Introduction
This is the third and final part of a review of acoustic comfort evaluation in dwellings. It is accompanying part I, which reviewed subjective responses to field data from building surveys 1 and part II, which reviewed subjective responses to impact sound data in laboratory tests. 2 This article is focused on subjective responses relevant to airborne sound data used in laboratory tests.
The presented studies of this review approach acoustic comfort through the association of acoustic data and subjective responses: they analyze laboratory listening tests that utilize airborne sound reduction data from measurements and sometimes involve recorded sounds of various noise types. The acoustic data are utilized in controlled listening experiments where the subjects (participants) provide their self-reported responses.3–13 In some cases, the acoustic data come from in situ measurements or sound recordings in test buildings. However, the data are still processed and used for listening experiments within a laboratory setup under controlled conditions in some reviewed studies.
The laboratory studies of airborne sound concern mainly the perception of annoyance or loudness of noise within living environments, the evaluation of existing standardized indicators, and the rating of building elements. Fewer studies were found concerning airborne sound reduction than the ones concerning impact sound. That is mainly because impact sound types have been reported as the most disturbing in residential environments. 14
The concept of acoustic comfort is hardly defined in the literature, despite being an important concept in engineering. It is typically used to consider a state of low or no noise and therefore lack of annoyance for the residents. A complete definition is provided in Rasmussen and Rindel, 14 as: “a concept that can be characterized by absence of unwanted sound, desired sounds with the right level and quality, opportunities for acoustic activities without annoying other people.”
Standardized measurements and indicators are used to assess acoustic conditions in buildings; 14 they are also used as a measure of acoustic comfort. But they do not always represent the perception of people in living sound environments. For instance, there are different types of building components, such as walls that offer various insulation and acoustic conditions in residencies.3–6 In some other cases the characteristics of noise types might influence in various ways the perception of subjects: thus different standardized descriptors work better for various sound sources.10–13
Therefore, the relation of the measured acoustic data to self-reported responses is important to study. The level of association is explored with statistical analyses comparing objective and subjective data. If a strong association is found between a descriptor and the subjective responses, then that descriptor could be used to predict the response of residents to a living environment based on acoustic data. Alternative versions of standardized descriptors with new adaptation terms are introduced many times in order to achieve stronger association of acoustic data with subjective responses.10–13 Consequently, the study of acoustic comfort and the development of prediction models constitute an essential tool for building design with proper acoustic conditions.
Methods
A wide search for peer-reviewed publications and conference proceedings, which include examination between acoustic data and subjective responses relevant to airborne sound, has been done in the following databases: ScienceDirect, AIP Scitation, Ingenta Connect, ResearchGate, PubMed, Scopus, and Google Scholar. The search method included numerous searches in the databases using relevant keywords, such as objective, subjective, acoustic, psychoacoustic, self-report, rating, score, comfort, quality, airborne, sound, insulation, noise, annoyance, assessment, association, correlation. Several publications were subsequently found as references of the first selected papers.
This review article includes 11 studies: eight European studies,3–8,12,13 one Asian study, 9 and two Canadian studies.10,11 In overall, 37 papers were found during the search in databases or relevant references and were evaluated by title name, abstract reading, and full reading. Only 11 papers met the requirements of this review: they offered comparison of results between airborne sound data and subjective responses, which is the subject of focus in this review. The other papers found were excluded because they concerned impact sound laboratory studies15–30 or field studies.31–40 Other exclusion criteria were the year of publication and language: only articles published after 1980 in English were included. The bibliographic research took place between April 2015 and September 2017.
Summary of methods, metrics and quantities in the reviewed studies
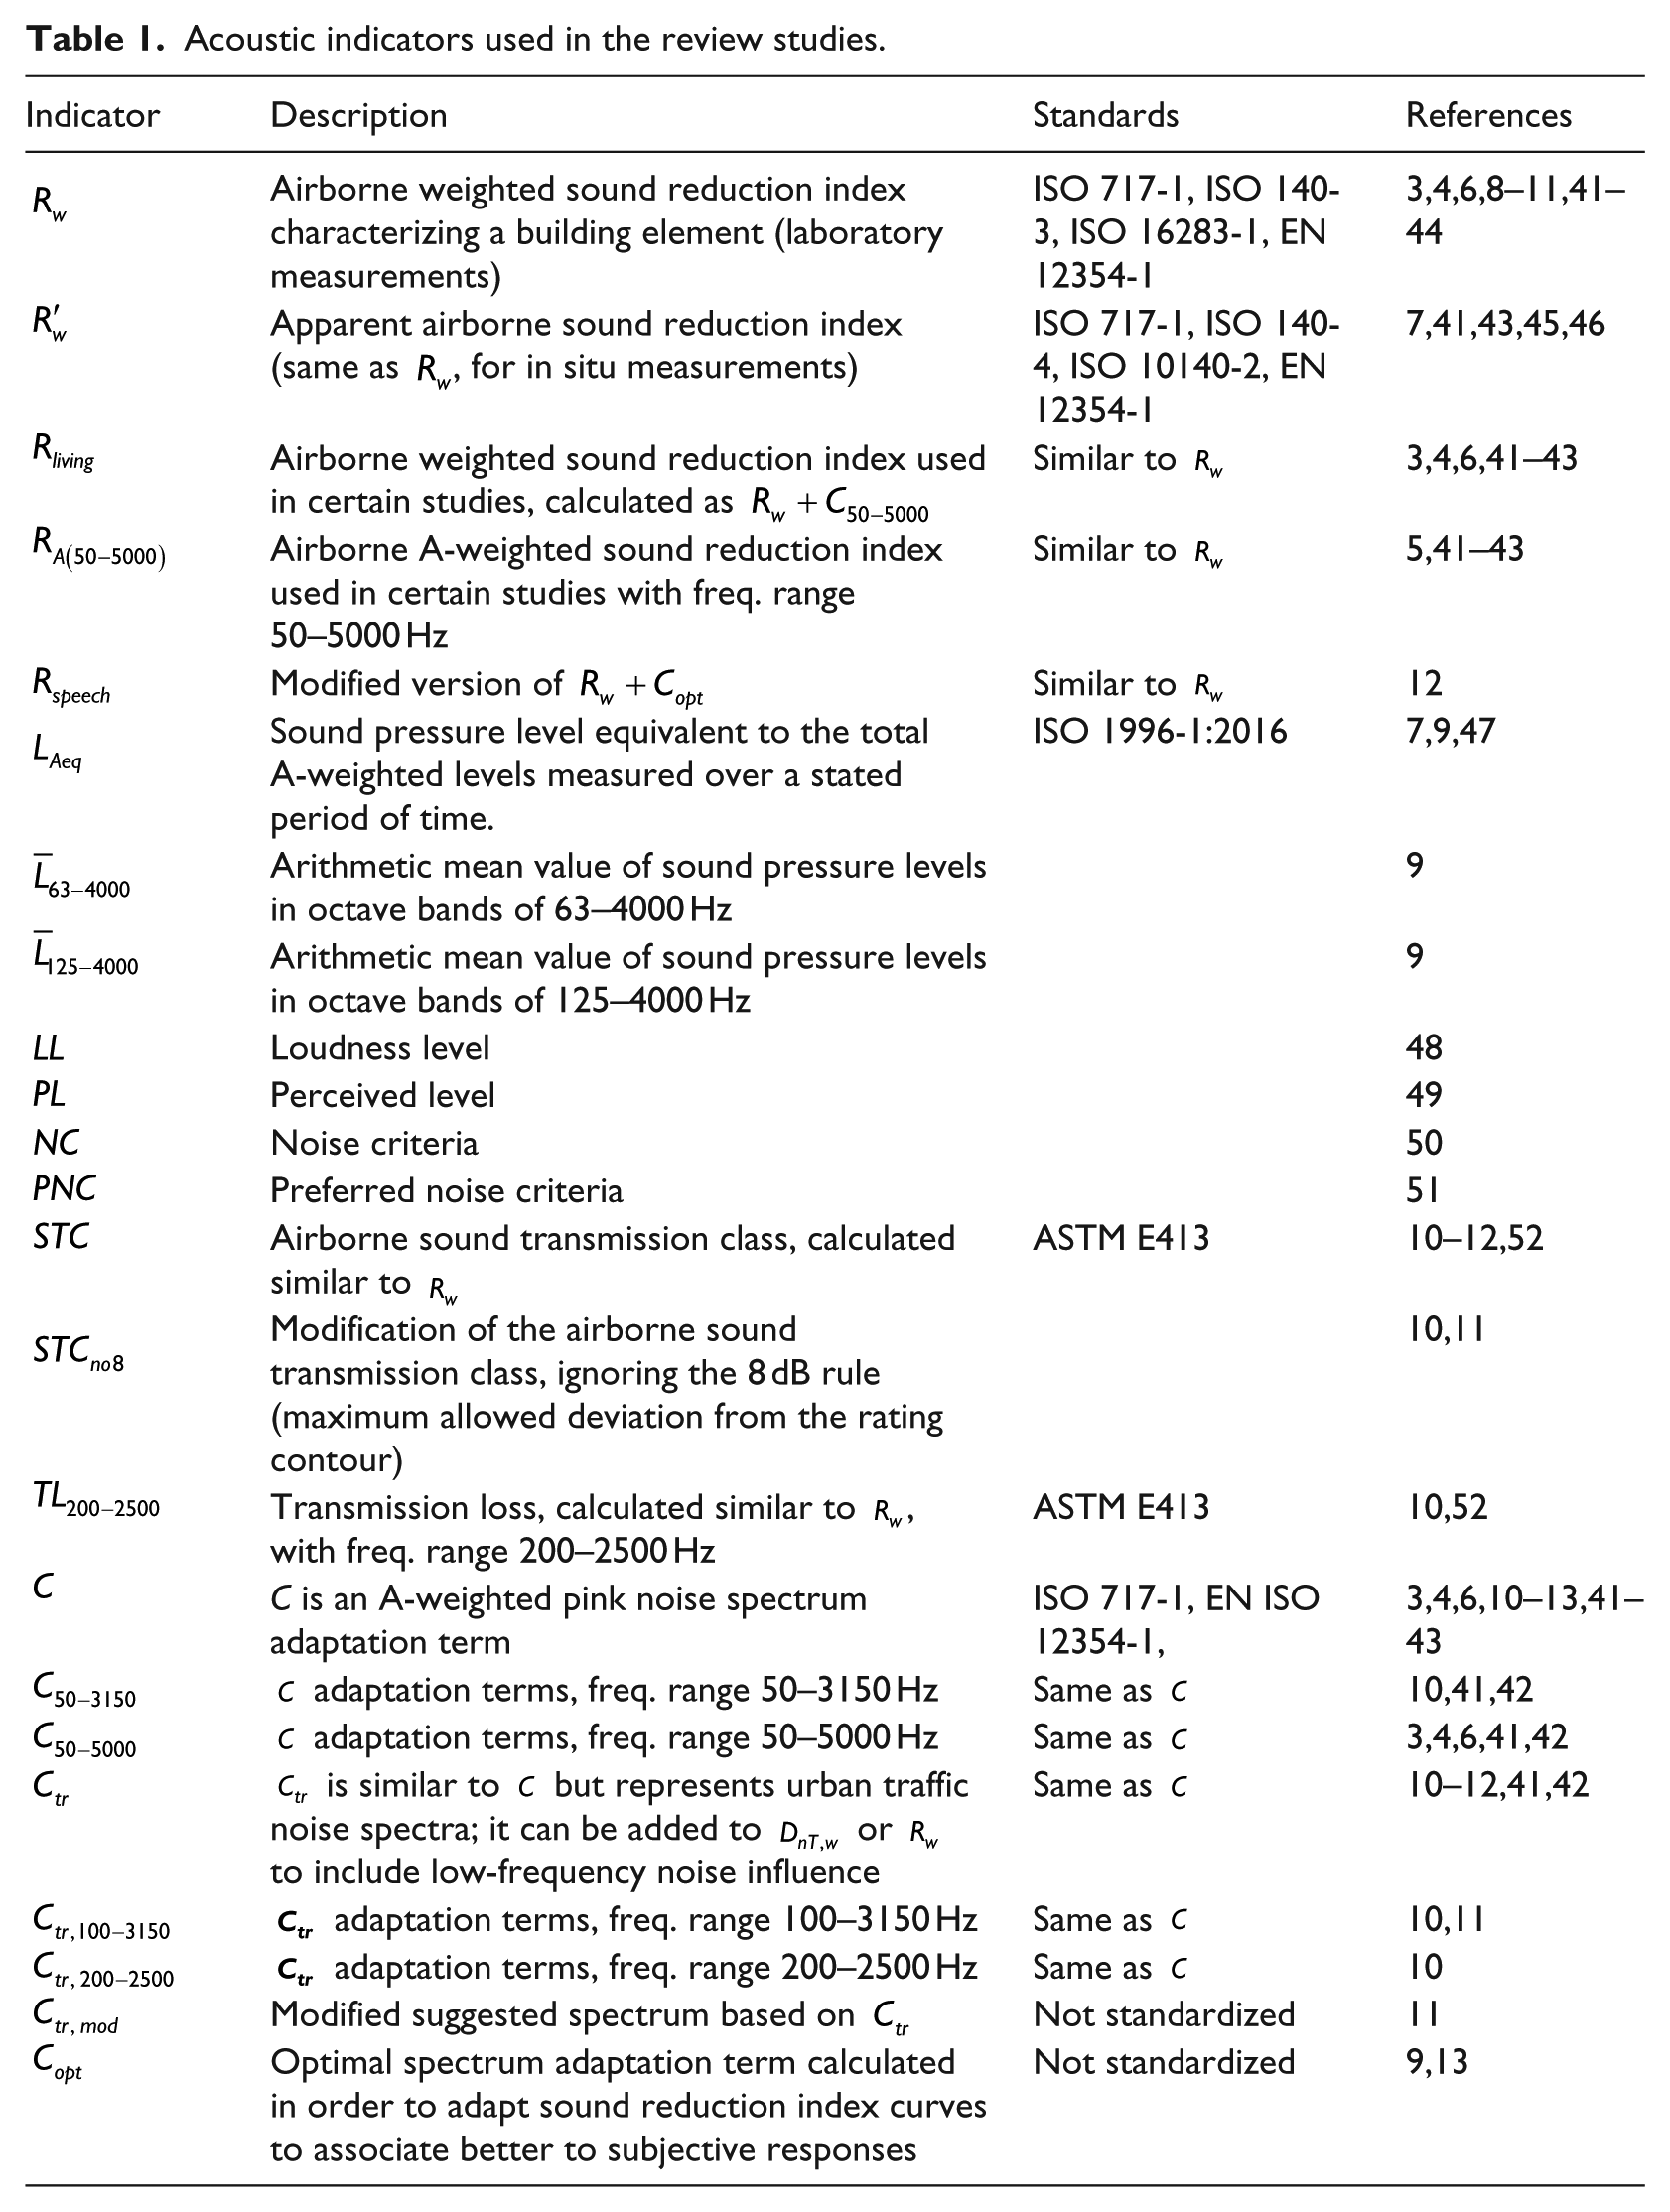
Many different indicators (or descriptors) are used to represent different quantities in acoustic measurements. They are all standardized in international ISO standards or other compliable national standards. Many variations of them exist as well, since experimental research has been done to acquire better indicators than the standardized ones. A description of all indicators involved in this review is presented in Table 1. For the detailed methods to acquire and calculate the indicators, please see the relevant standards.41–48
Acoustic indicators used in the review studies.
Several statistical methods are also applied such as analysis of variance (ANOVA) and regression analysis which associate airborne sound data to subjective responses. The quality of statistical association is usually described with typical parameters such as the correlation coefficient, denoted as
Some acronyms are used in this manuscript as abbreviations, namely SPL for sound pressure level, SNQ for single number quantity, SRI for sound reduction index (measured frequency spectra), STC for sound transmission class, and TL for transmission loss. The latter two terms are defined in the US standards:
52
they are similar to the airborne SRI
Evaluation of included studies
The quality of evidence for studies in this review was evaluated by means of Bradford Hill’s criteria54,55 which is an evidence classification method often used in epidemiology and health review studies. The fulfillment of the criteria is rated in this review in a scale of high (+++), moderate (++), low (+), as happened in the previous parts.1,2 The results are tabulated in Table 3 while the Bradford Hill’s criteria are as follows:
Strength of association. It refers to the causality proven by the association between the studied variables (cause, effect size, confounding factors).
Consistency. It indicates the degree of certainty when similar results are observed by different studies in different tests.
Specificity. Specific factors and effects on a specific population lead to a more likely causal relationship.
Temporality. It is based on temporal relations between effects, and used as an indicator for causality, meaning one effect happening after an exposure.
Biological gradient. It refers to the relation between exposure and effect; usually bigger exposure leads to greater effect, but not always, while the opposite outcome can happen as well.
Plausibility. It means that a biological explanation of why a cause leads to a certain effect supports a reasonable causality.
Coherence. It is a condition meaning that a stated causal relationship should not contradict with other accepted results or knowledge.
Experiment. It refers to the study design parameters that guarantee a reasonable causation, like randomization.
Analogy. The possibility of having or predicting analogous effects from similar factors without total evidence.
Publication type. An additional criterion was used to rank the reviewed studies. Scientific journal papers are thoroughly peer reviewed, while conference papers are usually less well reviewed. There are study reports from research organizations that may be scientifically well conducted but not reviewed at all. There are others, for example, unofficial reports, which are excluded. Thus, publications were evaluated as scientific journal (+++), conference paper (++), and report (+).
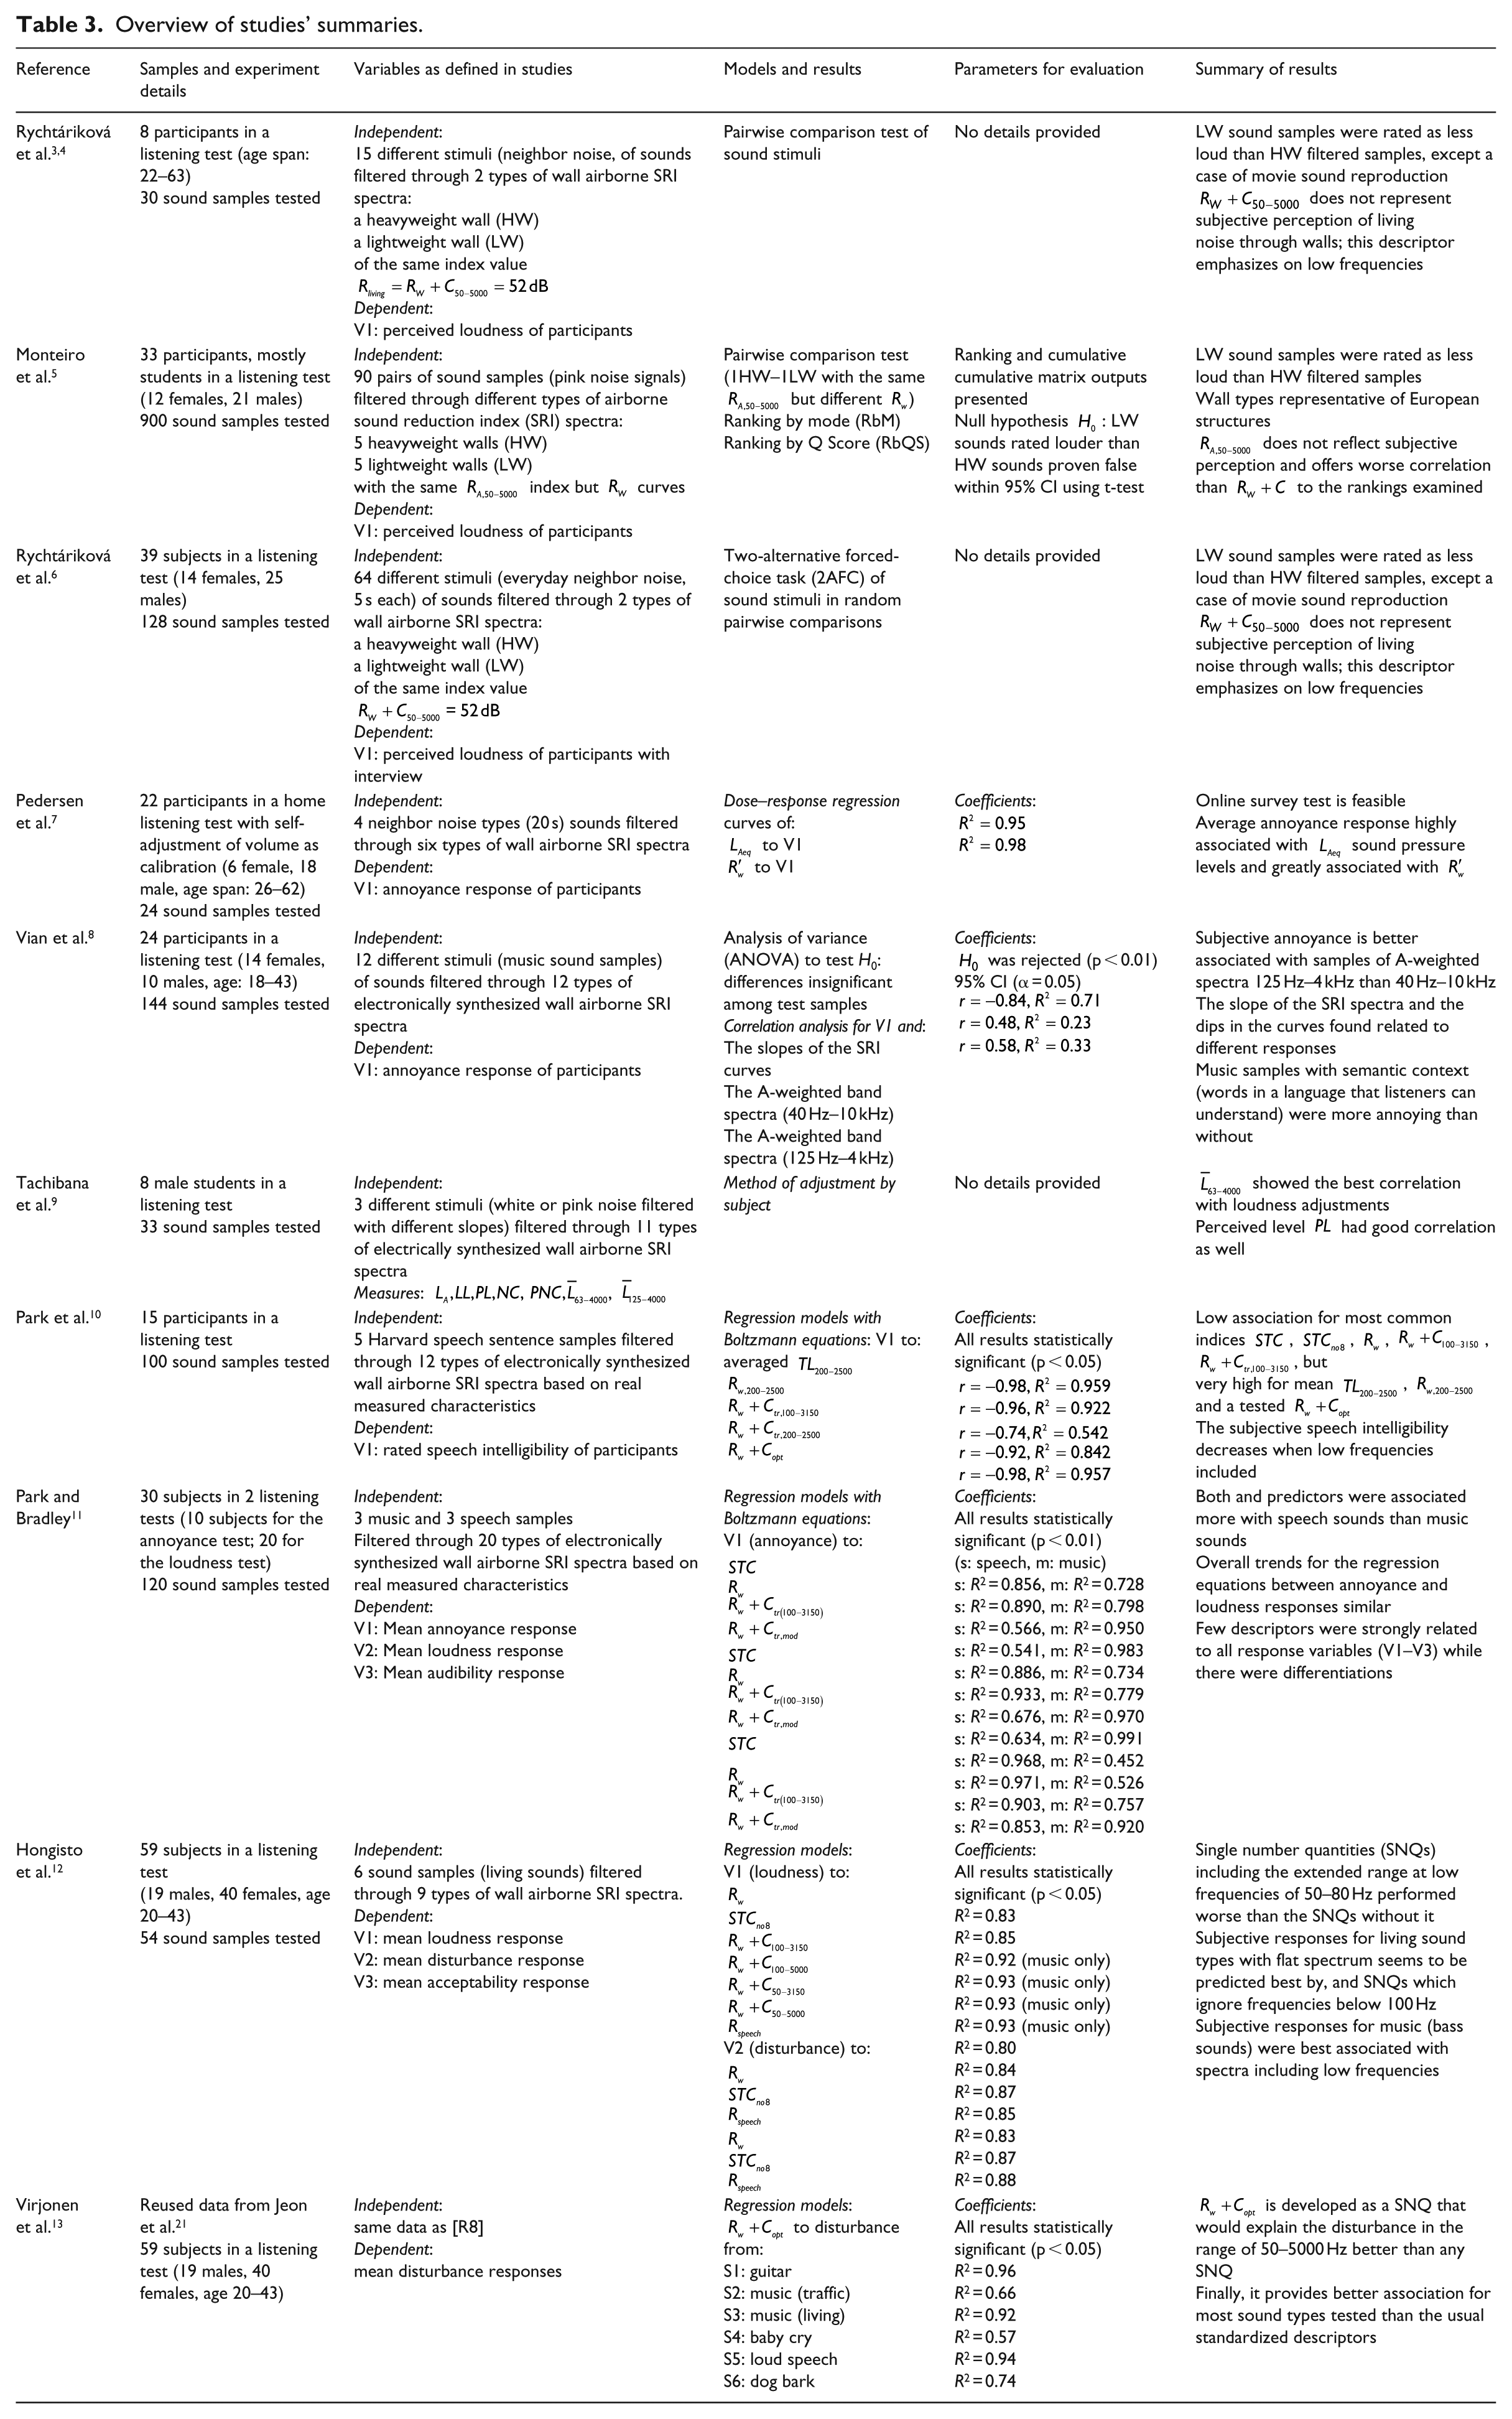
The included studies were evaluated by the authors of this article. In Table 2, the evidence evaluation rating of the studies is presented according to the criteria analyzed above. In Table 3, an overview of all the selected studies can be found, which are tabulated with summary of results, study design, methods, and conclusion. Readers who require a deeper insight in specific study results or conclusions may use the references and read the original publications. Sometimes, essential information are missing from this review article if they are not reported in the publications.
Evaluation of the presented studies according to selected criteria.
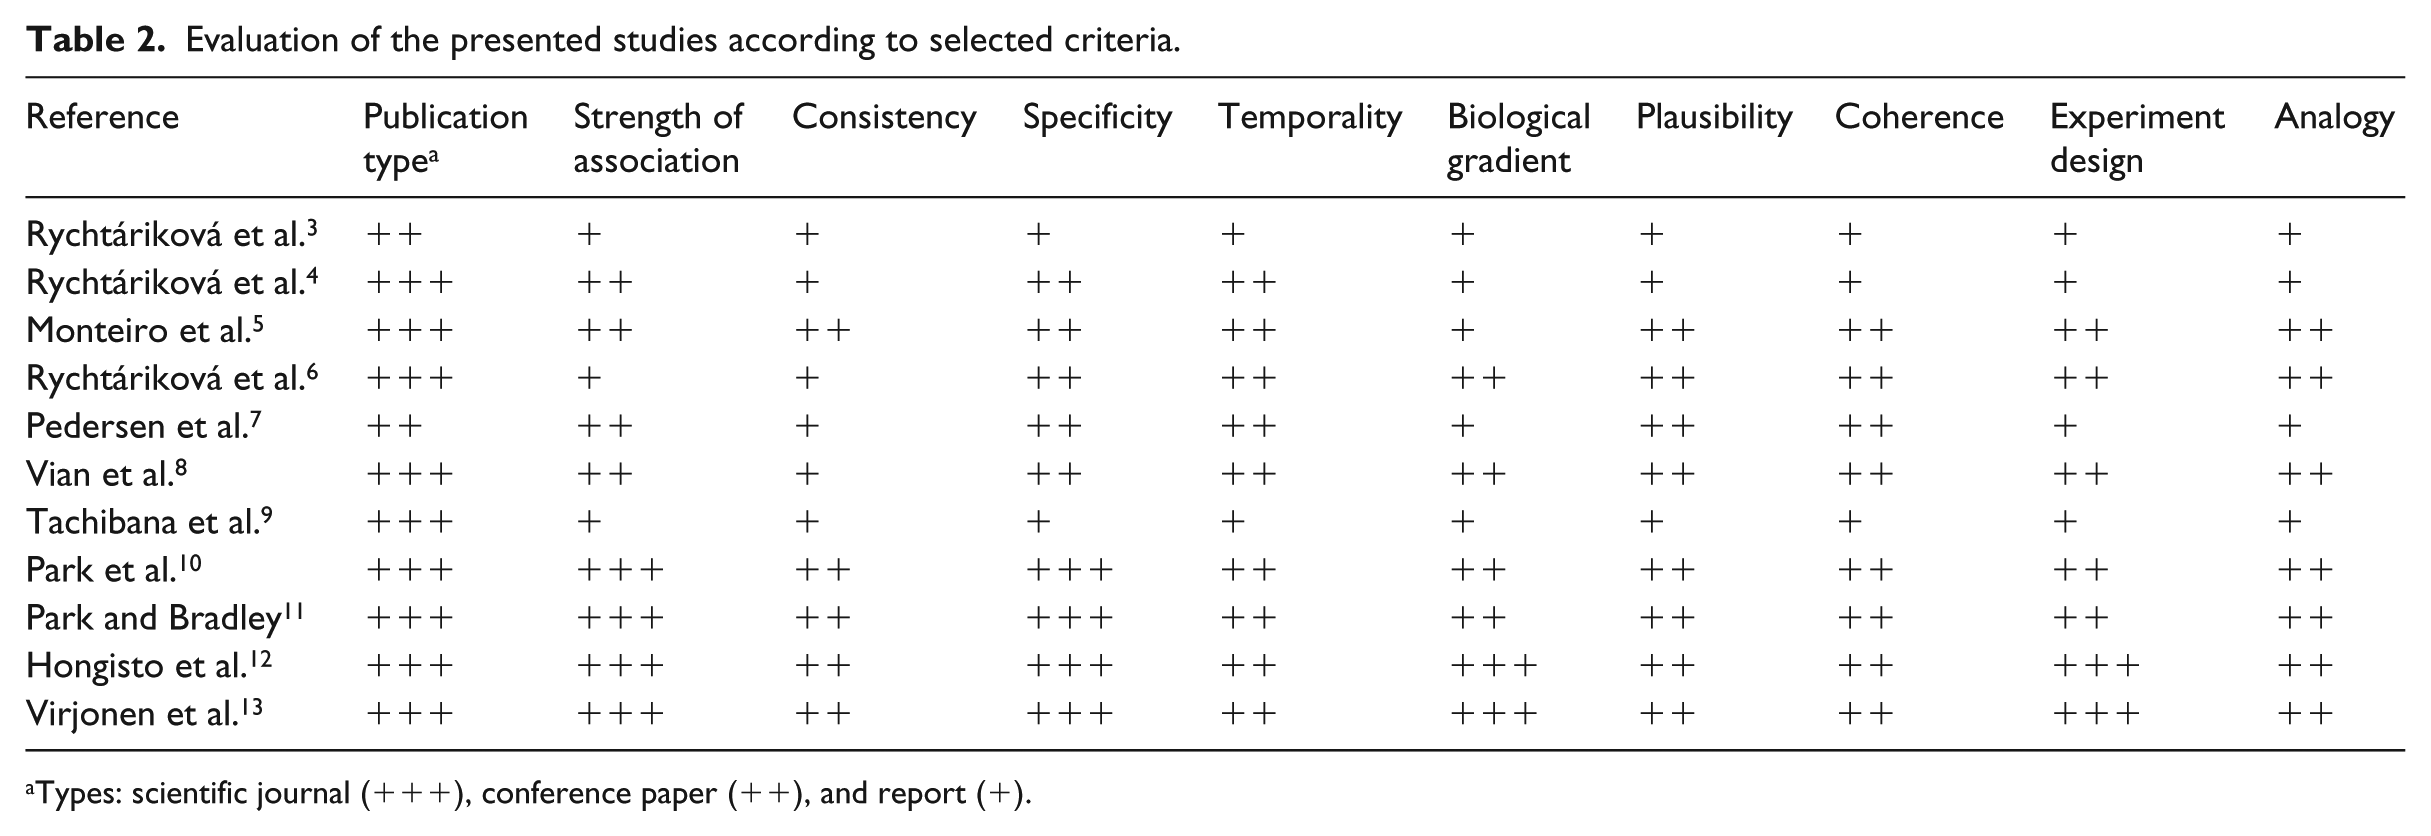
Types: scientific journal (+++), conference paper (++), and report (+).
Overview of studies’ summaries.
Results: associations of airborne sound data to self-reported responses in laboratory tests
In Rychtáriková et al.,3–6 a group of studies regarding the subjective perception of loudness in living environments are presented. The studies are based on rating noise types transmitted through lightweight and heavyweight wall structures, from now on denoted as LW and HW, respectively. Several wall structures were measured according to ISO 717-1, ISO 717-2 and the acquired airborne SRI spectra were used to filter different recorded noise types. Then the created samples were used in listening tests and they were randomly sorted in pairs of a heavyweight and lightweight wall case, both having the same single value but different spectra for their SRI. The test samples were presented in random order for pairwise comparisons. The participants were asked in all cases to rate the sound that was perceived as the loudest but without knowing that they actually rate noise transmission through different types of walls. In some cases, the participants reported that they would probably reply differently if the question of the test was to address the most annoying sound instead of the loudest one. 4
Specifically, in Rychtáriková et al.,3,4 a small sample of eight people rated 15 different sound stimuli of typical neighbor noise types (5 s each) filtered through a heavyweight wall (masonry) spectrum and a lightweight wall spectrum (gypsum boards on metal studs). Both cases of wall structures had the same single value for
In Monteiro et al.,
5
a bigger listening test was conducted in Belgium and Spain with 33 participants (21 females, 12 males) where 90 pairs of sound samples were used to test the descriptor
Then, in Rychtáriková et al.,
6
another listening test was performed using 64 typical everyday sounds, recorded live during 2 weeks in 10 selected living rooms of apartments in Austrian buildings. The sounds were again filtered through a heavyweight and a lightweight wall sound reduction spectrum, forming pairwise comparisons for 39 participants (14 women and 25 men). Most responses considered louder the transmission through the heavyweight wall type as before in Rychtáriková et al.
3
In few cases, where sounds through lightweight wall types were considered louder, they included low-frequency content extremely amplified by electronic devices as reported. The LW sound reduction was better than the HW in the middle frequency range of 100–3150 Hz. Then 12 of the participants were deployed, to test the hypothesis whether A-weighting in SPL is adequate when evaluating everyday living noise types, due to low weighted sound levels. The subjects reported to perceive low frequencies less loud in low SPL compared to high SPL. Calibration and background noise levels are reported as crucial parameters for the reliability of a listening test. Temporal amplitude modulations in the test sounds are stressed as important as well. Summing up, it is indicated in all the above studies3–6 that
In Pedersen et al.,
7
22 persons from the COST TU0901 action took part in an online listening test, testing 24 sound stimuli at their home computer setup with headphones. Four typical neighbor noise types filtered through the airborne SRI curves of six usual various types of walls were assessed. The results indicated a high association (R2 = 0.95) between the average annoyance response and the
In Vian et al., 8 a listening experiment for the evaluation of French regulation toward airborne sound insulation levels was conducted. Twenty-four participants took part in a laboratory test (14 females, 10 males, age span: 18–43). They reported their annoyance on 12 music sound stimuli which were filtered through 12 electronically synthesized wall SRI curves. The experiment was based on an incomplete factorial design, so from the whole 144 test samples, 1/3 was assessed by every subject. ANOVA was used to test the distinguishability between the samples (significant differences with p < 0.01). Newman–Keuls multiple-means comparison was used for grouping and ranking the annoyance responses. That comparison showed that slope and dips in the SRI curves, as well as the bandwidth and character of the sounds, have statistically important effects on the self-reported annoyance. It is concluded that an increasing slope of the insulation curve (i.e. more reduction in higher frequencies) leads to less annoyance. Then, a correlation analysis proved that there is a strong relation between the slopes of the SRI curves and the reported annoyance (r = –0.85, R2 = 0.72, 95% CI). It is reported that subjective annoyance is better associated with samples with A-weighted spectra of 125 Hz–4 kHz (r = 0.58, R2 = 0.33) instead of 40 Hz–10 kHz (r = 0.48, R2 = 0.23) within 95% CI. In addition, noise from neighbors’ speech in both French and English was assessed by French subjects in this test: the intelligibility of the sounds was found important, meaning that when there is a semantic context in the noise, the annoyance is bigger.
In Tachibana et al.,
9
a listening test took place for setting up a method for the evaluation of airborne sound insulation testing different measures. A limited sample of eight university students tested three different types of artificial noise sounds. Specifically, white or pink noise was filtered through various artificial frequency spectra of walls, based on real frequency spectra. The sound stimuli were evaluated by self-adjustment, meaning that the subjects used reference sounds to adjust the amplitude of test stimuli until they perceived every test sample as equally loud to the reference. The point of subjective equality (PSE) was used in that test for the adjustments. Many loudness measures were mentioned to have been tested such as the A-weighted SPL
In Park et al.,
10
a listening experiment for the evaluation of airborne sound insulation SNQs regarding speech intelligibility was conducted with 15 subjects (participants). A total of 100 sound samples was tested consisting of five Harvard speech test sentences filtered through 20 different types of wall airborne sound reduction spectra; the spectra were synthesized but based on real measured characteristics. Different measures were explored in terms of best-fitting regression curves (using Boltzmann’s equations) to the self-reported speech intelligibility. The comparison is a bit different in this study: good speech intelligibility corresponds to bad sound insulation performance and vice versa. Thus, a low intelligibility in the test would predict a sufficient airborne sound reduction of the test walls. The statistical associations of the most common standardized measures:
It was concluded that the examined descriptors are influenced plenty by the frequency range. Thus when low frequencies are included in the calculations correlation with speech intelligibility decreases because they do not contain useful information on the transmitted speech; the low frequencies do not contain information on the transmitted speech. In a parametric analysis included, the authors demonstrate that the highest correlation can be acquired when using the arithmetic average TL with the restricted frequency range of 200–2500 Hz:
A continuation of this research is presented in Park and Bradley
11
for the evaluation of the existing standardized airborne sound insulation measures for annoyance, loudness, and audibility. Another listening test was conducted with the same methodology as Park et al.,
10
this time using three speech samples and three music samples, filtered through 20 various wall SRI spectra. The measured walls had a spectrum of
The associations observed for self-reported mean annoyance were strong in relation to
Finally, for the audibility test, the previous values of loudness responses equal to 0 were used to define the state of “not audible.” The association of audibility to
A similar study was conducted in Finland
12
regarding the subjective evaluation of standardized SNQs characterizing airborne sound insulation of building elements, as stated in ISO 717-1
41
and ASTM E413.
52
A listening test took place including 59 subjects (19 males, 40 females, age 20–43; mean age: 27 years) who rated a set of six recorded sounds of typical noise types found in residential buildings: guitar sound, two music samples, speech, baby cry and barking dog. The music samples were modified to correspond to the traffic and the living spectrum of the relevant adaptation terms according to ISO 717-1. The test sound samples were filtered according to airborne SRI spectra of nine different wall structures measured in laboratory conditions (54 test samples in total,
An initial conclusion was that SNQs including the extended frequency range at low frequencies of 50–80 Hz performed worse than the SNQs without it, which was derived in previously presented studies as well.10,11 The SNQ of
Additionally, in Virjonen et al.
13
which is a continuation of the previous study,
12
the same data of the six sound samples and the subjective ratings were utilized in order to create a SNQ measure which would predict and explain the disturbance in the frequency range of 50–5000 Hz better than all other standardized SNQs. A certain algorithm was developed for optimal fit between mean subjective ratings and the optimized averaged reference spectra. The outcome was another descriptor with a new adaptation spectrum:
Discussion
There can be strong associations between airborne sound data and self-reported responses of annoyance and loudness10–13 in general. However, the statistical associations were weak in overall when intelligibility was used as a measure of perception. 10 The measures of self-reported audibility and acceptability were also used once, in Park and Bradley 11 and Virjonen et al., 13 respectively. It is also highlighted in a study that few differences were found between loudness and annoyance in the subjective responses. 11
Most laboratory studies based on airborne sound data examine the horizontal sound transmission, that is, the
The airborne sound studies testing transmission through walls conclude that subjects perceive noise through heavyweight walls as louder than the ones transmitted through lightweight walls.3–6 The airborne sound reduction frequency spectra of lightweight walls are usually better than heavyweight ones, except the low-frequency range. The effect of frequency and time variations in subjective perception was also highlighted in Rychtáriková et al.: 6 it was indicated that modulation and semantic context (e.g. speech) affect loudness perception. The latter observation is also supported in Vian et al. 8 where the intelligibility of the sounds was found important: annoyance perception is affected by semantic context in the noise sounds.
The inclusion of low frequencies (down to 50 Hz) in the measurements and derivation of descriptors seems to be an important issue in some of the reviewed studies. In the studies,3–6 the descriptors with extended spectrum adaptation terms like
The previous conclusions from studies3–6,8–12 are contradictory to the general trend in impact sound measurements and descriptors: inclusion of low-frequency spectra down to 50 Hz (even down to 20–25 Hz) in impact sound data is considered necessary to achieve sufficient association with self-reported responses.27–35 However, sometimes the same is stated in studies for airborne sound: in Park and Bradley,
11
many associations were very good between subjective annoyance or loudness and SRI descriptors for various stimuli with low-frequency content too. In addition, in Hongisto et al.,
12
descriptors such as
Furthermore, the different types of sound stimuli are highlighted as an important parameter in some studies10,13 because speech sounds have more high-frequency content while low frequencies are dominant in music sound stimuli. There are variations of course, for the cases of different sounds tested and responses. Therefore, in many studies, some of the descriptors work for certain types of sounds only, for example, in Park and Bradley 11 and Virjonen et al., 13 the descriptors with extended spectra to low frequencies associate very well with music but not with speech in most cases. In Virjonen et al. 13 the descriptors that relate well to speech do not relate that well for music or other living sounds.
In overall, many studies attempt to find a descriptor for airborne sound that would predict well the general noise annoyance perception. But there is not a certain descriptor that seems to associate great with every type of sound. This review demonstrates that different descriptors work better for various stimuli. However, in Virjonen et al.
13
and Rasmussen and Rindel,
14
a spectrum adaptation term is suggested to formulate the measure:
In some cases, the study design parameters are problematic: the sample size of listening tests can be small as in Pedersen et al. 7 and Vian et al. 8 or extremely small as in literature.3,4,9,10 However more subjects would be essential for a sufficient sample size and thus further inference of the results from such experiments; conclusions are weak when they are based on a small sample. Most of the studies have a good level of presentation and evaluation of evidence as can be seen in Table 2. Many statistical evaluations took place to compare and relate results between objective and subjective data, some were incomplete with missing parameters, and tests of significance or some study details were not reported at all.3,4,9 It would be essential for every study to have a method presentation, study design, and sufficient tabulation of relevant parameters.
Conclusion
This review shows that subjective response to airborne sound in dwellings is complicated: it can be predicted well in some cases but not always. Standardized SNQs and alternative descriptors for airborne sound have been evaluated and associated sufficiently with subjective responses collected in laboratory listening tests. The type of sound stimulus is significant because different stimuli with various frequency spectra correspond better to different descriptors. Inclusion of low frequencies down to 50 Hz in airborne sound measurements seems to be problematic: it leads only certain metrics to associate better with self-reported responses.
Consequently, all descriptors do not associate well with all kinds of airborne sound stimuli in living environments. The descriptors with low-frequency adaptation spectra relate better to music sound sources with dominant low-frequency content while the opposite applies to sound stimuli of speech. Finally, there is no overall indicator to work best for all kinds of airborne sound types in dwellings, but few suggestions of frequency adaptation spectra work very well for that reason. Additional properties of noise signals such as frequency and time modulation and semantic context are indicated to play a role in subjective perception of annoyance or loudness.
Footnotes
Declaration of conflicting interests
The author(s) declared no potential conflicts of interest with respect to the research, authorship, and/or publication of this article.
Funding
The author(s) disclosed receipt of the following financial support for the research, authorship, and/or publication of this article: This article was written within the research project “Acoustic Comfort in Building Apartments” funded by Saint-Gobain Weber.