
Abstract
The concept of acoustic comfort is hardly defined and used to refer to conditions of low noise levels or annoyance based on standardized descriptors. Airborne and impact sound measurements are used to rate acoustic comfort in dwellings, but they often do not express human perception of noise or comfort. If the descriptors are statistically associated with self-reported responses, they can be used as prediction models and considered sufficient for acoustic comfort assessment. This review article presents studies that approach acoustic comfort in dwellings via the association of acoustic data and subjective responses in laboratory tests. Specifically, we investigate the cases of impact sound, since it is usually reported as the most disturbing noise source in dwellings. We also evaluated the reviewed studies with the Bradford Hill’s criteria. The reviewed studies indicate that self-reported annoyance to impact sound is an important issue and it can be predicted well in overall. Various standardized descriptors are studied and associate sufficiently with subjective responses. Inclusion of low frequencies down to 50 Hz in measurements improves the association of impact sound descriptors to subjective responses. Some impact noise stimuli associate only with some descriptors but not all. From the standardized impact sources, the tapping machine is the most efficient to predict overall annoyance and the impact ball for human walking or typical impact sounds in dwellings.
Introduction
This article concerns a review of acoustic comfort evaluation for dwellings in laboratory tests. The reviewed publications present studies which were conducted in laboratory conditions and evaluate the association of acoustic data with subjective responses and thus approach acoustic comfort perception. Since impact sound has been reported in the literature as the most important noise source in dwellings, 1 this review is focused only on impact sound studies and results. The examined laboratory tests usually include acoustic data of measured sound insulation or recorded noise sounds of various types, which are deployed in controlled listening experiments where the subjects, that is, the participants, offer their self-reported responses.2–15 In some of the presented cases, the acoustic data of the reviewed studies originate from field measurements or sound recordings in real buildings and not laboratory measurements. However, those data are still processed and used for listening experiments within a laboratory setup under controlled conditions in the reviewed studies.
Acoustic comfort is vaguely defined in the literature, despite being an important concept in engineering. It is typically used to denote a state of low or no noise and therefore lack of annoyance for the residents. A complete definition is provided in Rasmussen and Rindel 1 as “a concept that can be characterized by absence of unwanted sound, desired sounds with the right level and quality, opportunities for acoustic activities without annoying other people.”
Standardized measurements and relevant descriptors are used to assess building acoustic conditions. They do not always represent well how people perceive the living sound environment as occupants in their flats. Previous studies have shown that residents suffer from impact noise types: such noise types have dominant low-frequency characteristics which are usually neglected in a standardized measurement with a typical frequency range of 100–3150 Hz. Also, the impact sound sources used during measurements might offer different types of excitation than the real-life impact sounds. Then, there are various types of building constructions and components, which provide different structural and acoustical conditions to the tenants.3–15
Therefore, it is important to test the association of the acoustic data from measured results to self-report responses; that association is tested with statistical analyses comparing objective and subjective data in many studies in this review. Sometimes, alternative versions of standardized descriptors are suggested in order to achieve better agreement of acoustic data with subjective responses. If a strong association can be established, then it is possible to formulate models for prediction of annoyance and comfort for the residents.
The understanding of acoustic comfort and development of prediction models would be essential for the design of proper acoustic conditions in buildings. For all the above reasons, comparing measured data to human perception is essential for the characterization of acoustic comfort in overall. In this review article, a set of selected studies are presented dealing with impact sound data compared and associated with subjective responses collected in laboratory tests.
Methods
A wide search for peer-reviewed publications and conference proceedings, which include examination between acoustic data and self-reported responses relevant to impact sound, has been done in the following databases: ScienceDirect, AIP Scitation, Ingenta Connect, ResearchGate, PubMed, Scopus, and Google Scholar. The search strategy included numerous searches in the databases using relevant keywords, such as objective, subjective, acoustic, psychoacoustic, self-report, rating, score, comfort, quality, impact, sound, insulation, noise, annoyance, assessment, association, and correlation. Several publications were subsequently found as references of the first selected papers.
Finally, this review article includes 10 Asian studies,2–11 1 Canadian study,12,13 and 4 European studies.14–17 Requirements for inclusion of papers in this review were the comparison of results between impact sound measured data and subjective responses collected from tests in laboratory experiments. Overall, 37 papers were found during the search in databases or relevant references and were evaluated by title name, abstract reading full reading; 17 of them were included in this review. The selection was based on their relevance to this review: some publications did not offer statistical comparisons or did not consider impact sound laboratory tests and thus were excluded.18–37 Other exclusion criteria were the year of publication and language: only articles published after 2000 in English were included. The bibliographic research took place between April 2015 and September 2017.
Summary of methods, metrics, and quantities in the reviewed studies
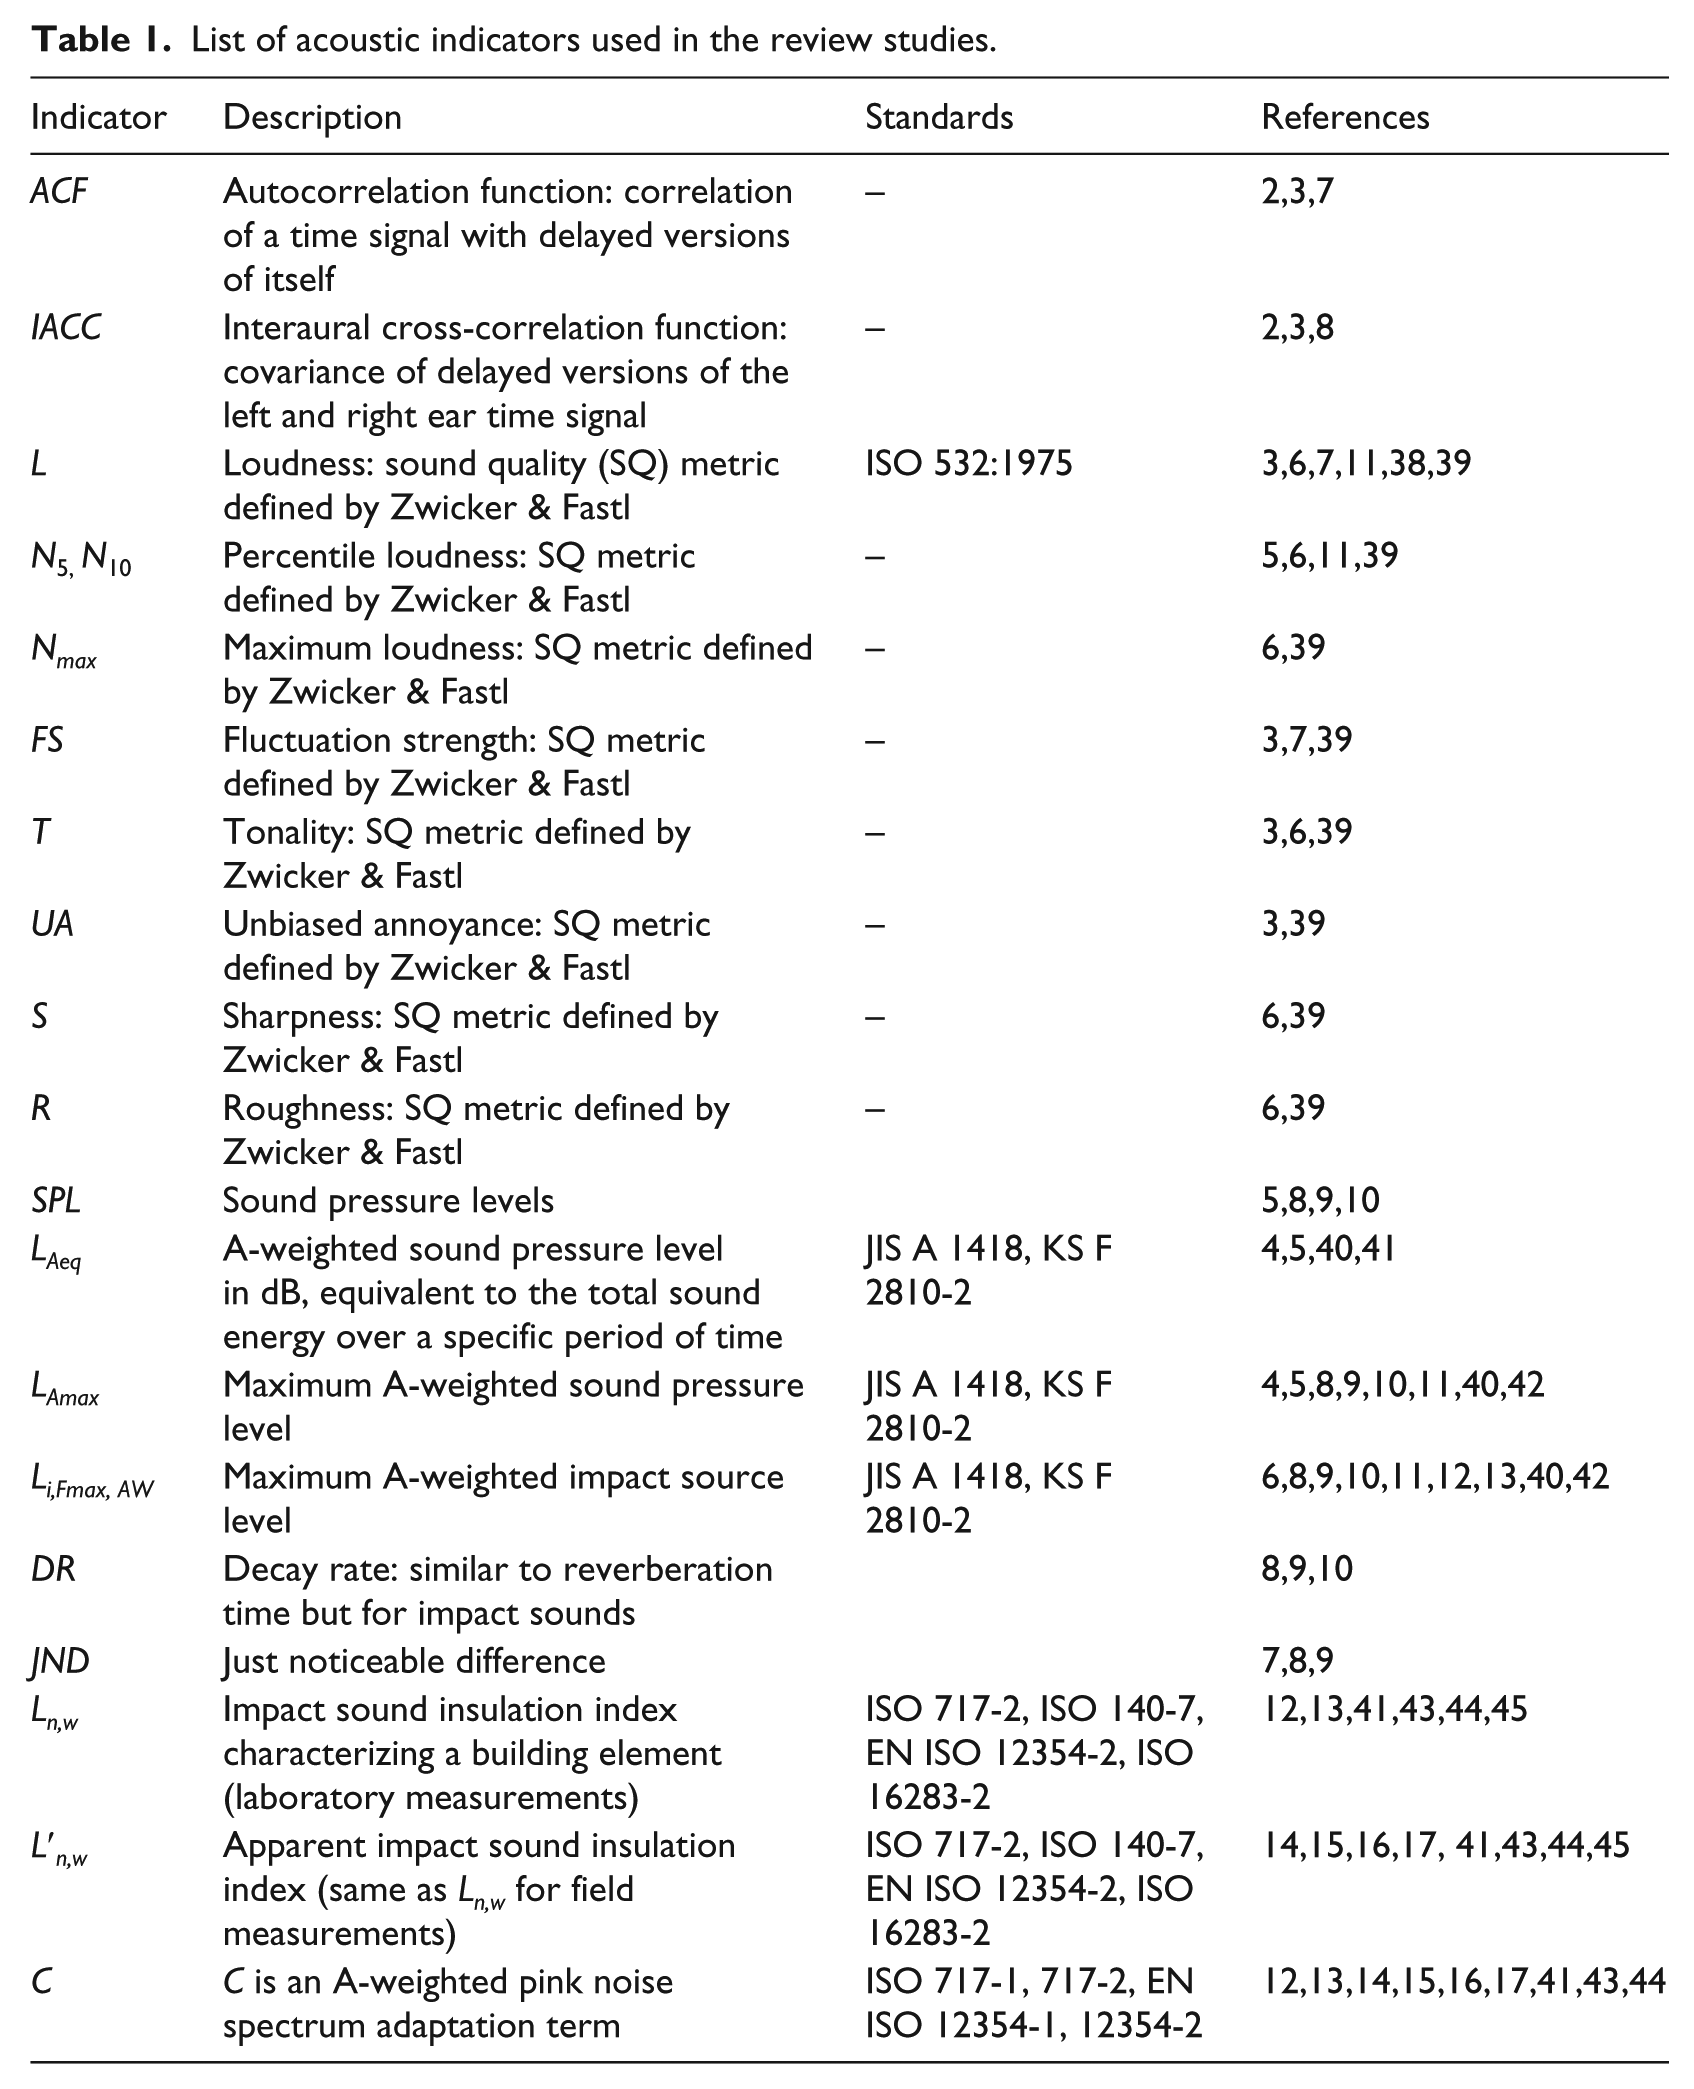
Many different indicators (or descriptors) have been used to represent different quantities in acoustic measurements. They are all standardized in international ISO standards or other compliable national standards. Many variations of them exist as well, since experimental research has been done to acquire better indicators than the standardized ones. A description of all indicators involved in this review is presented in Table 1. For the full methods used to acquire and calculate the indicators, please see the relevant standards.
List of acoustic indicators used in the review studies.
Several statistical methods such as analysis of variance (ANOVA), regression analysis, and principal component analysis (PCA) associate acoustic data to subjective responses. Details on the statistical methods can be found in relevant literature. The quality of statistical association is usually described with typical parameters such as the correlation coefficient, denoted as
Evaluation of included studies
The quality of evidence for studies in this review was evaluated Bradford Hill’s criteria 26 which is an evidence classification method often used in epidemiology and health review studies. The fulfilled criteria are rated in a scale of High (+++), Moderate (++), and Low (+). The evaluations are tabulated in Table 2, while the criteria are as follows.
Strength of association: it refers to the causality proven by the association between the studied variables (cause, effect size, and confounding factors).
Consistency: it indicates the degree of certainty when similar results are observed by different studies in different tests.
Specificity: specific factors and effects on a specific population lead to a more likely causal relationship.
Temporality: it is based on temporal relations between effects and used as an indicator for causality, meaning one effect happening after an exposure.
Biological gradient: it refers to the relation between exposure and effect; usually bigger exposure leads to greater effect, but not always, while the opposite outcome can happen as well.
Plausibility: it means that a biological explanation of why a cause leads to a certain effect supports a reasonable causality.
Coherence: it is a condition meaning that a stated causal relationship should not contradict with other accepted results or knowledge.
Experiment: it refers to the study design parameters that guarantee a reasonable causation, like randomization.
Analogy: the possibility of having or predicting analogous effects from similar factors without total evidence.
Publication type: an additional criterion in order to rank the reviewed studies. Scientific journal papers are thoroughly peer reviewed, while conference papers are usually less well reviewed. There are study reports from research organizations that may be scientifically well conducted but not reviewed at all. There are others, for example, unofficial reports, which are excluded. Thus, publications were evaluated as scientific journal (+++), conference paper (++), and report (+).
Evaluation of the presented studies according to selected criteria.
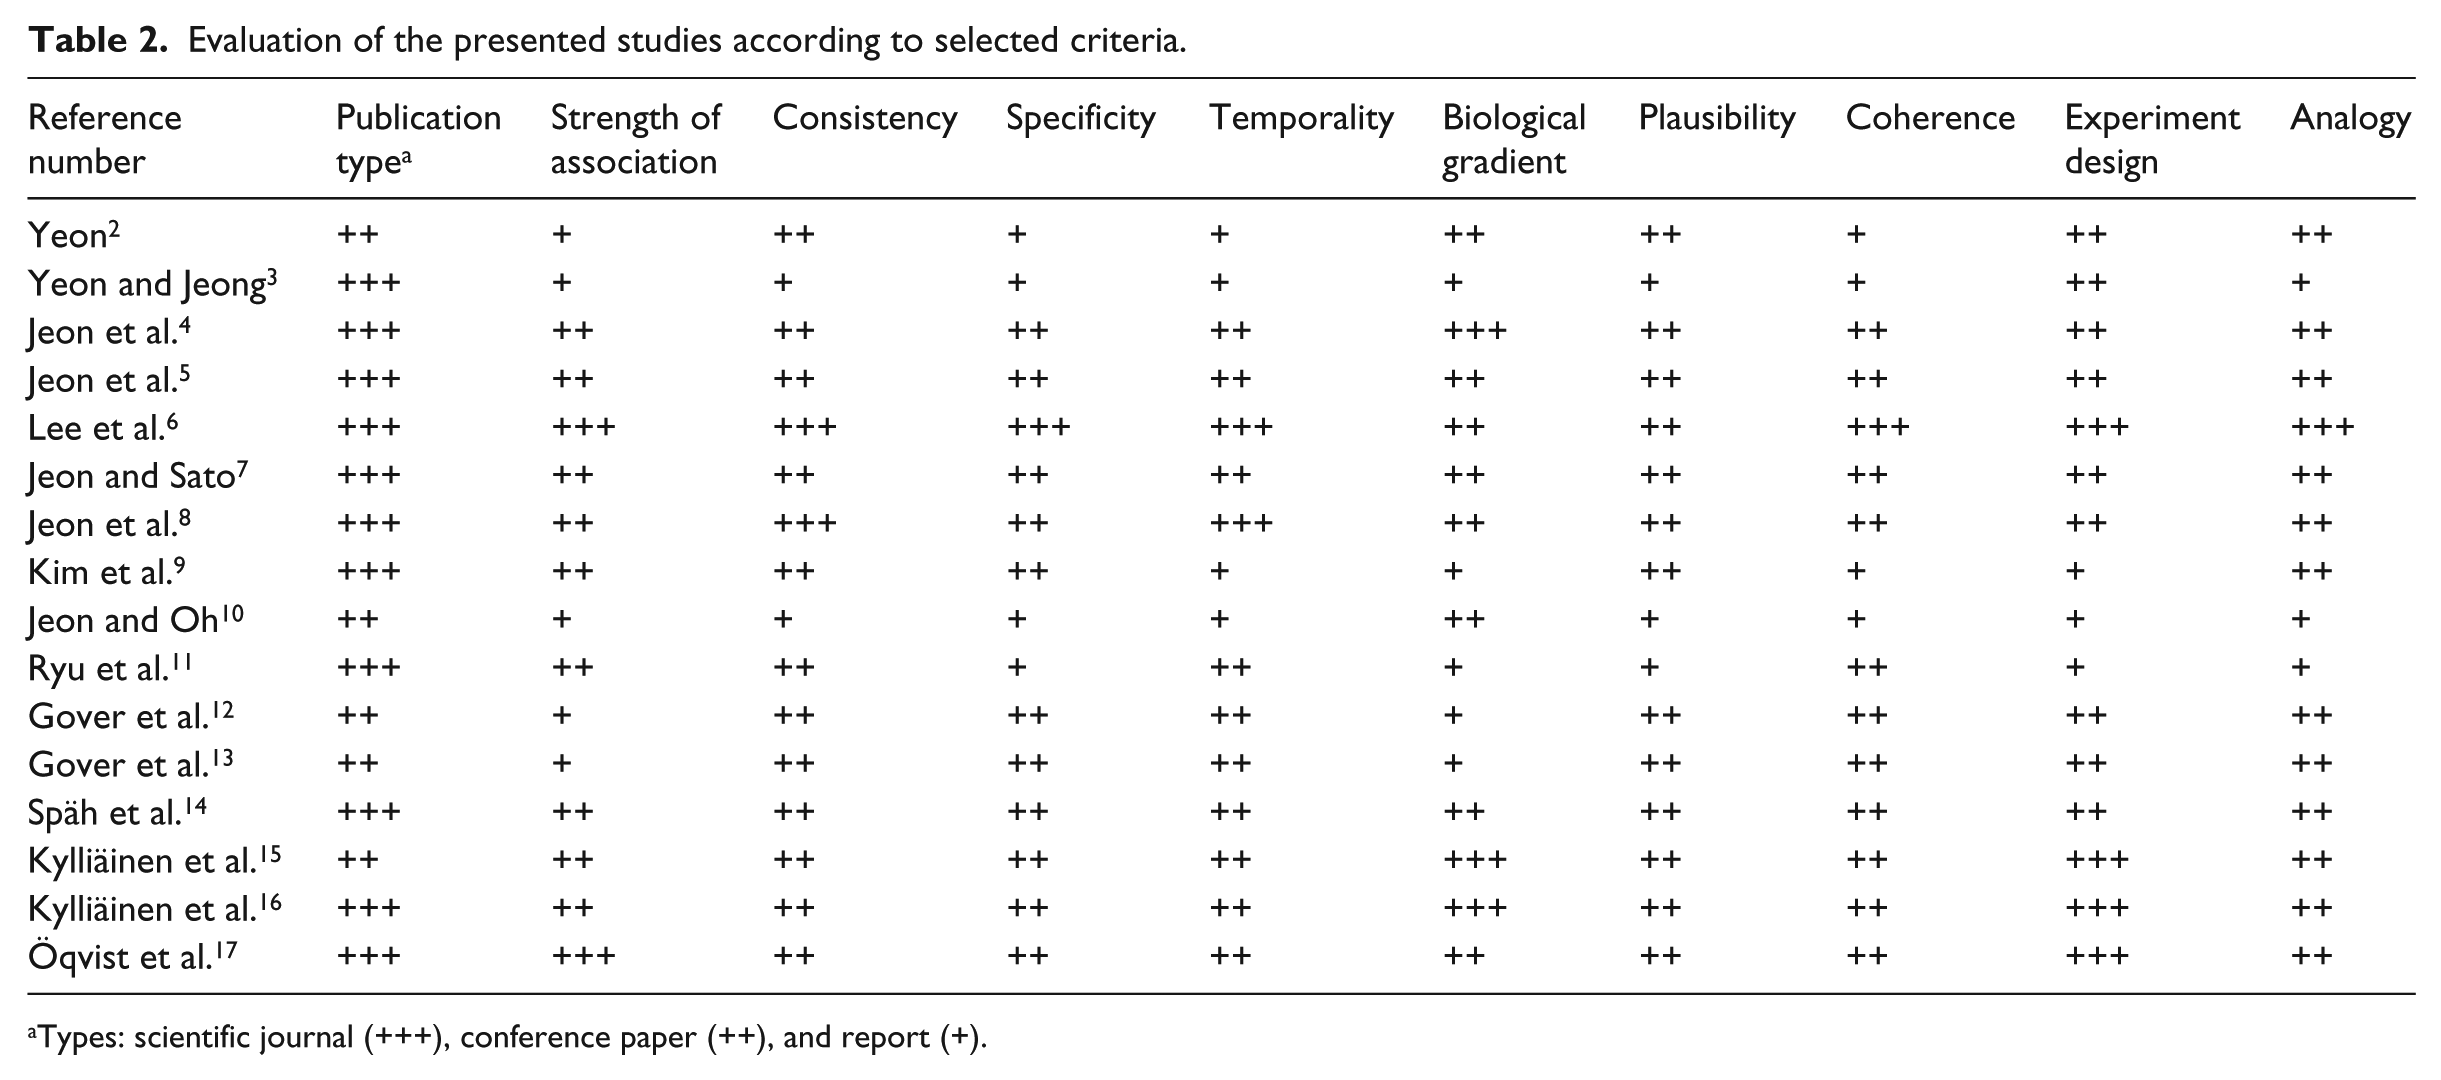
Types: scientific journal (+++), conference paper (++), and report (+).
The included studies were evaluated by the authors of this article, while the presented data were chosen according to their relation and importance for this review’s context. In Table 3, an overview of all the selected studies can be found, which are tabulated with summary of results, study design, methods, and conclusions. In Table 2, the evidence evaluation rating of the studies is presented according to the above criteria. Readers who would like to have a deeper insight into any specific study results or conclusions may read the original publications using the references. Essential information might also be missing from this review if they are not reported in the papers. The studies are presented in chronological order and analyzed in the next chapter.
Overview of studies’ summaries.
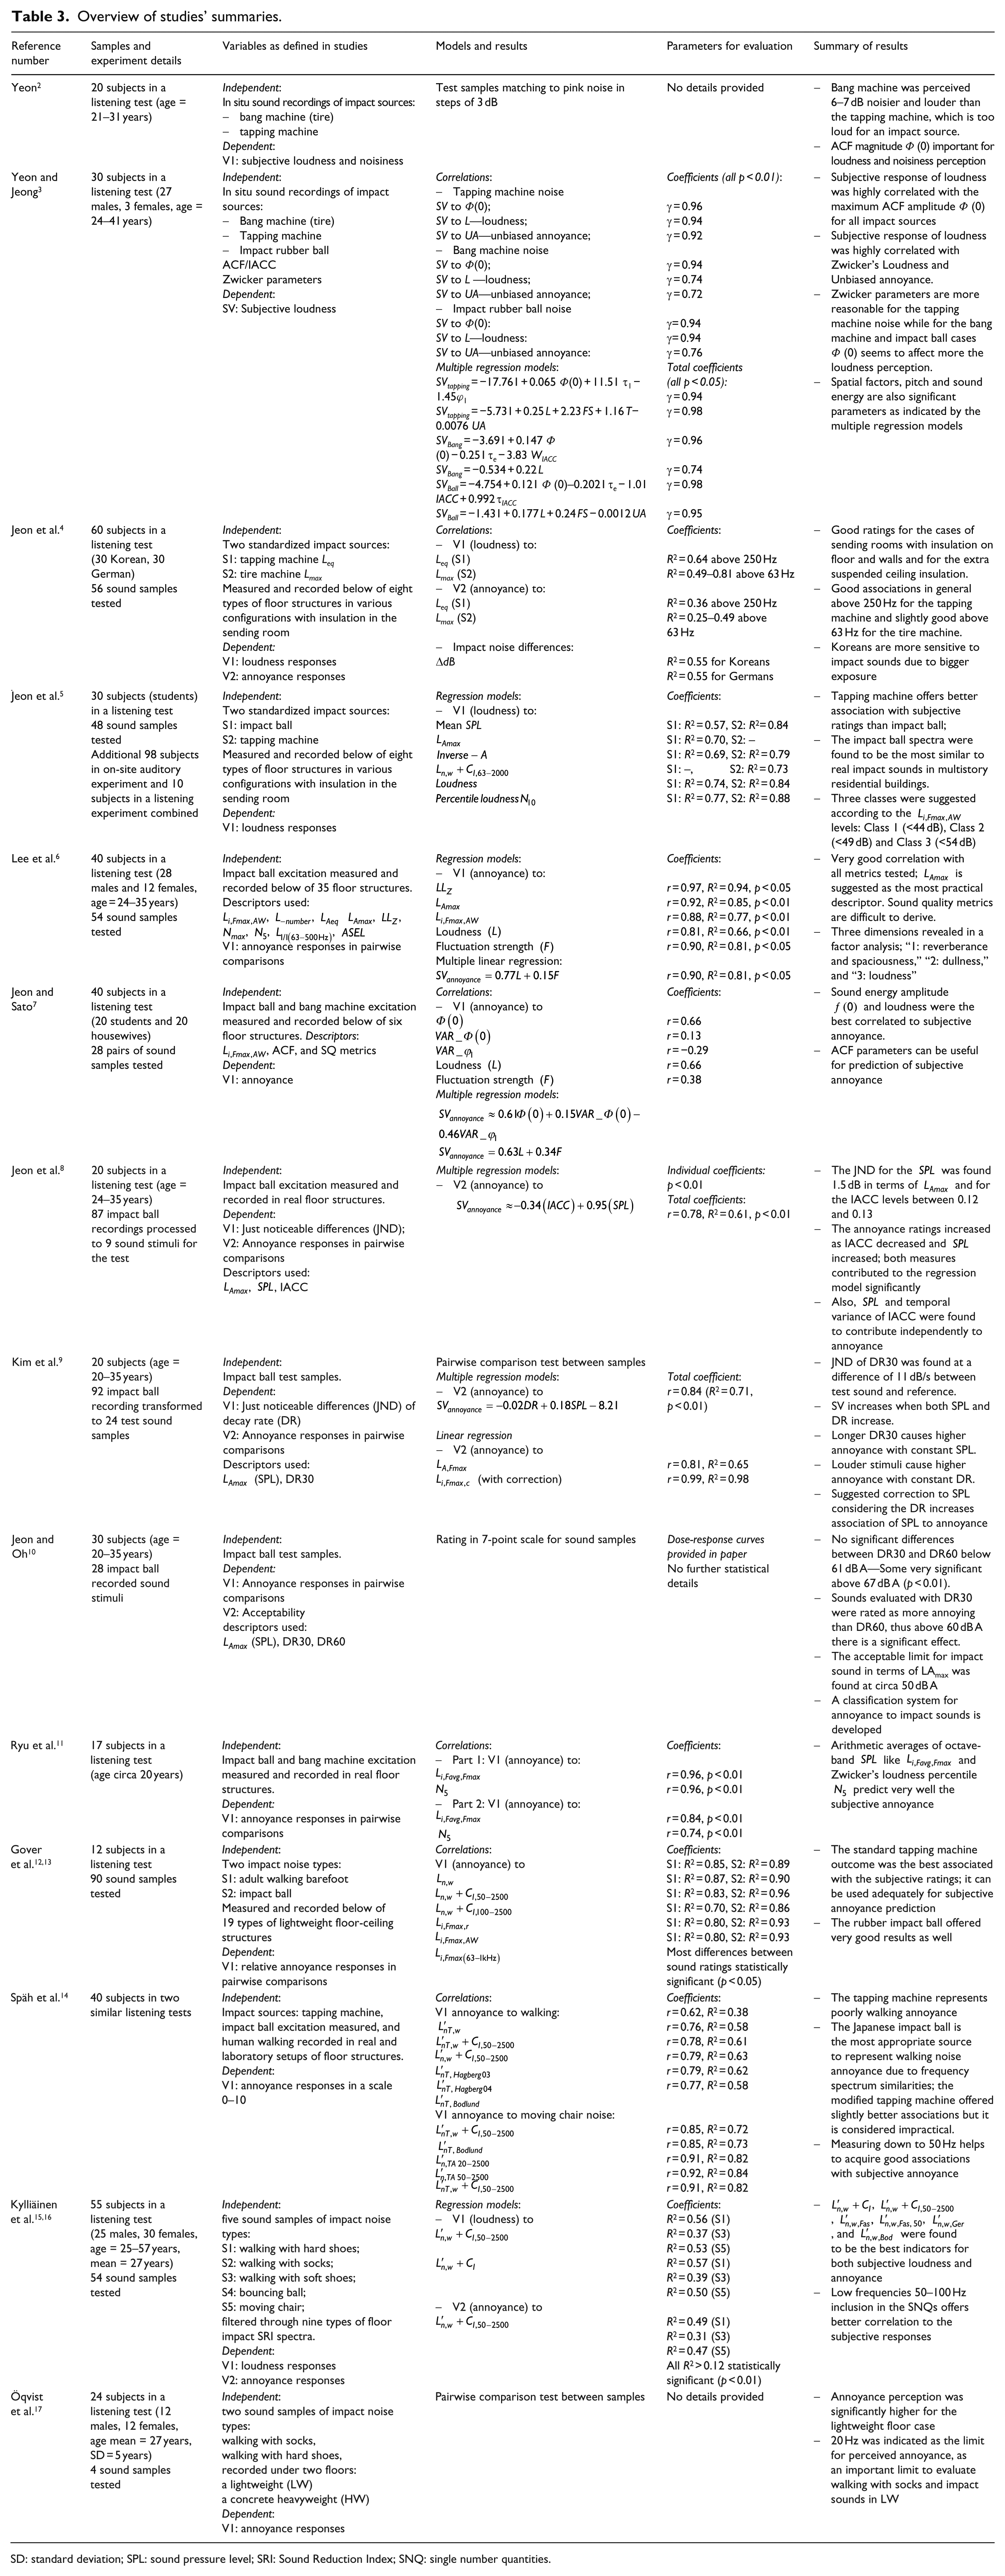
SD: standard deviation; SPL: sound pressure level; SRI: Sound Reduction Index; SNQ: single number quantities.
Results: associations of impact sound acoustic data with self-reported responses in laboratory tests
In Yeon,
2
a laboratory listening test with 20 participants (aged 21–31 years) to investigate the differences in perception of impact noise sounds was recorded in apartments. The standardized sources were a bang machine (tire) and a tapping machine. The subjects listened to the samples and had to adjust them to pink noise levels according to their perception of loudness and noisiness. First, the results of loudness and noisiness matching were highly and significantly correlated (r = 0.916, p < 0.01). The subjects raised the pink noise 2–3 dB higher to match the levels of the bang machine, while they lowered the pink noise 3–4 dB to match the tapping machine sound: subjects perceived bang machine 6–7 dB noisier and louder than the tapping machine as the author comments. Also, parameter values of the autocorrelation function (ACF) and the interaural cross-correlation function (IACC) were analyzed for both sources. The maximum amplitude
In Yeon and Jeong,
3
a continuation of the previous study is presented as the evaluation of loudness. A typical concrete floor structure in a Korean residential building and nine different configurations with treatments of that structure were measured according to JIS A 1418.
18
Recordings were made for the impact excitation sources: tapping, bang machine, rubber impact ball, and human jumping. A listening test with 30 subjects (27 males, 3 females, aged 24–41 years) was conducted where the test samples were evaluated in a pair of comparison test (108 comparisons) using a 5-point scale (−1, −0.5, 0, 0.5, and 1). Subjective responses of loudness were highly correlated with the maximum ACF amplitude
Furthermore, a multiple regression analysis was done which resulted in the following optimal models for the loudness perception, denoted as
For the case of bang machine noise, the derived models were SVBang = −3.691 + 0.147 Φ(0) − 0.251 τe −3.83
Similar studies regarding floor impact sound and self-reported loudness and annoyance were continued in study.
4
Eight floors in different apartments (same floorplan) of an unoccupied multi-story building in Seoul were measured following the standard JIS A 1418. Different configurations in the sending rooms including insulation for the floor, walls, and ceiling were tested with two different impactors, the tapping machine and the tire machine measured in
Lower levels of subjective loudness and annoyance were reported for the cases of sending rooms with insulated floor and walls or the same setup with an extra suspended ceiling insulation. These conclusions were made for both cases of impact noise sources. In this study, the parameter of different culture is featured as well. A comparison of impact noise level differences and subjective data offered determination coefficient values
A continuation of the same study in Korea is presented in Jeon et al.
5
Further measurements in the test building and floor structure configurations were conducted for another comparison of two impact sources: impact ball and tapping machine. A total of 30 students took part in a similar listening experiment rating 48 sound samples in the same loudness scale (–2 to 2). Several descriptors were tested for the association with subjective ratings. For the impact ball case, the results were sufficient with coefficients acquired by
Two additional listening experiments were conducted in this study 5 with few details provided:
An on-site auditory experiment with 98 subjects in a living room of the test building to rate annoyance (scale 1–9) to impact ball sounds dropped from various heights. Three categories were suggested for classification using this scale: “Audibility” (1–3), “Disturbance” (4–6), and “Amenity” (7–9). The level of
A listening test with 10 students was conducted to investigate the just noticeable differences (JND) for the perception of impact ball noise in SPL. The JND level was recognized at about 2 dB for both the tapping machine and the impact ball cases, as indicated by 86% and 89% of the participants in each case, respectively.
In a further study in South Korea,
6
impact ball sounds were again recorded in 35 different typical apartments (100–120 m2), which were box-frame-type reinforced concrete constructions with slab thickness 150–180 mm. They were clustered in three groups based on their frequency characteristics and they were then used for two auditory experiments with 40 participants (28 males, 12 females, age span 24–35 years). The first experiment concerned successful indicators of perceived annoyance; 87 impact ball sound samples (
In a second test, 36 stimuli sounds were evaluated by the same participants in pair comparisons to explore the effects of the psychoacoustic metrics as variables: loudness
In addition, a semantic differential test took place for a set of 12 adjective pairs for evaluating floor impact sound after a selection process. The same 40 people participated and used a bipolar scale (with an adjective and its opposite) to characterize the given sound stimuli. Their responses were processed using the method of factor analysis, revealing three dimension groups, entitled by the authors as “1: reverberance and spaciousness,” “2: dullness,” and “3: loudness.” The first dimension was well correlated with roughness (r = 0.69, R2 = 0.48, p < 0.05), the second with fluctuation strength (r = 0.71, R2 = 0.50, p < 0.05), as well as the third (r = 0.73, R2 = 0.53, p < 0.01), which was also associated with loudness with r = 0.75 (R2 = 0.56, p < 0.05). The authors conclude that several frequency characteristics can be described by those three reported categories.
In Jeon and Sato, 7 the annoyance of floor impact sounds was evaluated using the ACF and SQ metrics. Two impact sources were used, the bang machine and the impact ball for measurements in six apartments with different insulation configurations. Binaural recordings were taken also with a dummy head to create 28 pairs of sound stimuli for a pairwise comparison. The stimuli were classified into three groups according to their spectral behavior. Then, 40 subjects (20 students and 20 housewives) took part in a laboratory listening test; 35 of them distinguished various levels of annoyance (p < 0.05) and the agreement among all responses was significant (p < 0.05).
Single and multiple regression analyses were performed. Three ACF parameters were selected for a regression model:
In Jeon et al.,
8
the interaural cross-correlation (IACC) function was used in the evaluation of floor impact annoyance. Impact ball measurements inside Korean apartments and 87 binaural recordings took place: they were used in a laboratory listening test with 20 participants (aged 24–35 years). In the first part, random pairs of stimuli were presented to the subjects who were asked to choose the stronger sound. The JND of the
Then, nine of the stimuli were chosen for the second part where the subjects rated relative annoyance in pair comparisons again. The effects of
A continuation study of Jeon et al. 8 is presented in Kim et al. 9 that deals with the temporal decay of impact sounds and how that affects subjective perception. For that investigation, the JND of decay rate (DR) was used for impact ball sound samples. The test samples were created after processing of 92 field recordings in apartments of concrete box-framed buildings; they were classified in three spectrum groups according to Jeon and Sato. 7 In addition, the authors mention that the effects of floor and room conditions on the recordings were investigated with ANOVA and found statistically significant, specifically factors such as floor thickness, area, room volume, and type. However, no details are provided for those variables. The metric DR is similar to reverberation time (RT) and corresponds to the decay of a signal (normalized to 0 dB): for example, from −5 to −35 dB for DR30. The subjects rated the sounds using pairwise comparisons in a laboratory listening test. If more than 75% of the subjects distinguish the reference sound and the test sample, JND is valid according to this study.
In the first test, 15 test sound stimuli were judged by the participants if they sound similar; the JND was determined when the DR difference of the stimuli was 11 dB/s between test sounds and reference. That means the subjects started to decide that the tested stimuli were different sounds when their actual difference in DR was more than 11 dB/s (slope of 11 dB drop per second). In the second test, the participants offered annoyance ratings of nine test sounds. It was found that the annoyance values increase when both
In another continuation study,
10
the classification of annoyance and acceptability of SPL and temporal decay levels (DR) was explored. Similar sound stimuli as in Jeon et al.
8
were used and 30 subjects in a listening test rated their annoyance in a 7-point-scale and acceptability (yes/no). Both DR30 and DR60 were tested for decays of 30 and 60 dB, respectively. No significant differences were reported between DR30 and DR60 below impact level differences of
In Ryu et al.,
11
a study for the relation between subjective annoyance and single number quantities (SNQs) for impact sounds in wooden buildings in Japan is reported. Excitation by bang machine and impact ball was used for measurements and mono-aural recordings on 26 floors of 12 real buildings; 2 typical spectra were defined for the study, SP-1 and SP-2 to be used as reference, and another 11 stimuli for each typical spectrum were created with manipulation of the frequency responses. In all, 17 subjects (aged circa 20 years) took part in a listening experiment where they rated the 24 sound stimuli in a pair comparison test (55 pairs) using a relative annoyance scale from −3 to 3 (0 for equal annoyance between stimuli). The various impact sound levels (with different types of weighting) were defined in the Japanese standard:
A second experiment took part in the same study with 31 subjects (aged circa 20 years) where impact sounds dependent on the
A wide research study took place in the National Research Council of Canada in Ottawa,12,13 specifically for the ranking of lightweight (LW) wood framed floor-ceiling structures based on the subjective response of participants. First, a wide set of 19 various bare floor assemblies was measured in laboratory conditions (two vertically adjacent reverberation rooms with a specimen opening). All standardized excitation sources were used; the standardized tapping machine, the modified tapping machine (i.e. the standardized one on a resilient layer), the heavy/soft rubber ball dropped from the heights of 10, 50, and 100 cm, and additionally the tire machine was used as well. Sound recordings were taken for the rubber ball cases and additionally with a human source: an adult walking barefoot on the test floors. A total of 90 samples were used in a pairwise comparison test; 12 participants took part in the laboratory test and rated the sounds in a relative annoyance scale from 1 to 9 (1—‘Sound 2 much less annoying,’ 5—‘equally annoying sounds,’ and 9—‘Sound 2 much more annoying’). Sound 1 was always the same reference and Sound 2 was the tested sample.
A correlation analysis was performed to investigate the relationship between the subjective annoyance and the acoustic data collected in the measurements. The highest association was reported between the annoyance levels and the metrics derived with the standard tapping machine;
In Späh et al., 14 the European research program AcuWood is presented, which concerns impact noise annoyance in wooden buildings. Measurements of timber floor structures and binaural recordings took place in real buildings and in laboratories following the same methods. Different coverings on the floors were tested during laboratory measurements too. Several impact sources were explored: the standardized tapping machine and the modified one (according to ISO 10140-5), the Japanese impact ball, and “real” impact sources (male walkers with socks and shoes and a female walker with hard heeled shoes and a chair which was drawn). Two separate listening tests took place using the stimuli created from all floors, while a field measurement was common in both tests as a reference. The tests involved 18 and 22 subjects, which provided ratings of annoyance (scale 0–10) according to ISO 15666. 27
The results indicate that the typically used
Another study in Finland took place15,16 exploring the associations of descriptors derived from impact sound on concrete floors and subjective annoyance; the relation of eight impact noise descriptors to subjective ratings was studied. A listening test was conducted with 55 subjects (25 males and 30 females, age 25–57 years, mean 27 years) who offered their ratings on a set of five recorded impact sounds through nine floor configurations in a psychoacoustic listening experiment at the Finish Institute of Occupational Health. A floor construction was measured in a laboratory, being bare concrete or with eight different floor covering types, according to ISO 140-7. The eight SNQs explored were
For three sound types S1, S3, and S5 (walking with hard shoes, soft shoes, and moving chair), the correlations were considered sufficient and statistically significant (p < 0.01) for most SNQs, with determination coefficient
For the other sound types (S2: walking with socks and S4: bouncing ball), the associations were weak with
In Öqvist et al.,
17
a study is presented where the authors investigate the effect of the frequency range 20–50 Hz in the perception of walking sound annoyance. A listening experiment with 24 Swedish subjects (12 males and 12 females, age mean 27 years, standard deviation (SD) = 5 years) took place, where walking sound samples were evaluated. The latter concerned recordings of a male walker with socks or shoes through two construction cases: a wooden LW and a concrete heavyweight (HW). They were tested in a pairwise comparison test which showed that the percentage of subjects perceiving a difference in annoyance was significantly higher for the LW floor case; 20 Hz was indicated as the limit for perceived annoyance and as an important limit to evaluate walking with socks. It is highlighted that existing impact sound SNQs are not sufficient in terms of correlation to subjective responses. It was confirmed that frequencies down to 20 Hz are necessary to evaluate impact sounds in LW, while 40 Hz was the lowest limit for walking with socks in HW and 100 Hz for shoes in HW. In addition, the highest correlation between annoyance responses and standardized descriptors is reported for
Discussion
In the presented studies, various descriptors have been used to associate to self-reported responses, mostly for annoyance or loudness. However, the lack of a proper SNQ that could work efficiently for all types of impact noise is apparent or directly concluded in many studies.14–16
The inclusion of low frequencies (down to 50 Hz) seems to be an important concern. Many of the reviewed studies indicate that extended frequency spectra which include low frequencies down to 50 Hz correlate better with subjective responses of annoyance.14–17 Variations exist as well regarding several types of impact sources tested in different studies, but the overall associations of subjective responses to impact sound are sufficiently good and become better with extended spectra. That is a general issue discussed in the field of building acoustics.1,14
The indicators for the standardized tapping machine seem to predict well the overall subjective noise annoyance in many studies,4,5,12–16 but do not associate well enough with walking noise.12,13 The Japanese impact ball seems to represent better impact sounds induced by human walking as demonstrated in many Korean and Japanese studies;5–11 it is summarized that impact ball as an impact source corresponds better to the usual impact noise spectra found in residential multistory buildings, especially human walking and kids jumping. It is also noticeable that Korean researchers differentiate between HW (impact ball and bang machine) and LW impact sounds (tapping machine) in their publications.
In some studies, both loudness and annoyance ratings were included for the self-reported assessment of the participants,4,16 and loudness scale only was used in one study. 5 Some similar results have been between loudness and annoyance ratings, 16 but overall no final conclusion has been done on the differences and similarities for the case of impact sound perception related to loudness or annoyance.
In some studies, SQ metrics are examined for the subjective annoyance assessment.3,5–7 In Lee et al.,
6
the authors highlight the significance of Zwicker loudness level,
Many multiple regression models have been presented for the prediction of self-reported annoyance.3,6,7 The most successful regression models are presented in Yeon and Jeong, 3 and they both have total correlation coefficient r = 0.98 (p < 0.05) and concern annoyance prediction based on acoustic measurements from the following:
Tapping machine data: SVtapping = −5.731 + 0.25 L + 2.23 FS + 1.16 T − 0.0076 UA.
Impact ball: SVBall = −4.754 + 0.121 Φ(0) − 0.2021 τe − 1.01 IACC + 0.992 τIACC.
The variability of impact noise sensitivity due to different culture is featured in only one study, 4 where subjects from Germany and Korea took part in the presented experiment. A big difference was revealed; therefore, intercultural responses to impact noise might be an interesting issue for further studies.
Classification took place in two studies only. In Jeon et al., 5 98 subjects evaluated impact ball noise and the following three categories were proposed using an annoyance scale from 1 to 9: “Audibility” (1–3), “Disturbance” (4–6), and “Amenity” (7–9). In addition, in Jeon and Oh, 10 four classes were developed based on self-reported annoyance percentages (Class A–B, %A), and minimum SPL levels of the DR for every class were defined.
Most of the studies have a good level of presentation and evaluation of research evidence as can be seen in Table 2. Many statistical evaluations took place; some were incomplete with missing important parameters or some details were not reported at all.2,7 In some listening tests, very small amounts of subject have participated.11–13 This fact weakens the strength of association, the consistency, the biological gradient, and the analogy of the acquired results, as demonstrated also in Table 2.
Conclusion
This review shows that annoyance perception due to impact sound is an important issue and can be associated well in overall to acoustic measurements. Many standardized SNQs and alternative descriptors have been evaluated and associate well with subjective responses collected in laboratory listening tests. The standardized descriptors based on the tapping machine measurements are considered sufficient, but the highest correlations have been found between SQ metrics and subjective ratings. Inclusion of low frequencies down to 50 Hz in measurements helps impact sound descriptors to relate better to subjective responses. Furthermore, all descriptors do not relate well to all kinds of impact sound related. The impact sources suggested as efficient are the standardized tapping machine for overall annoyance, the Japanese impact ball for human walking annoyance, or typical impact sounds in dwellings. Additional properties of noise signal such as modulation, decay, and other temporal characteristics evaluated by the ACF, the IACC, the DR, or SQ metrics are indicated to play an important role in annoyance rating and perception.
Footnotes
Declaration of conflicting interests
The author(s) declared no potential conflicts of interest with respect to the research, authorship, and/or publication of this article.
Funding
The author(s) disclosed receipt of the following financial support of the research, authorship, and/or publication of this article: This article was written within the research project “Acoustic Comfort in Building Apartments” funded by Saint-Gobain Weber.