
Abstract
Acoustic comfort is a concept hardly described in the literature. But it has been used in engineering typically to refer to low noise or annoyance in order to invoke no discomfort. Current standardized methods for airborne and impact sound reduction are deployed to assess acoustic comfort in dwellings. However, the measured sound pressure levels do not represent comfort. The latter should include further the human perception of the acoustic environment. Therefore, this article reviews studies that approached acoustic comfort through the association of objective and subjective field data, combining in situ acoustic measurements and survey responses from residents. We evaluated the studies using Bradford Hill’s criteria. Most researches focus on self-reported noise annoyance while some others on satisfaction responses. Many studies were found incomprehensibly described: often vital data of statistical evaluation or study design are lacking. The results indicate that noise is a significant issue in living environments, especially certain impact noise types. The use of extended low-frequency spectra down to 50 Hz was suggested for impact measurements in order to predict better self-reported noise response. Greater problems with low-frequency transmission are displayed in lightweight structures which perform inefficiently compared to heavyweight components. Harmonization of presented results and study design details should be taken into account for future articles.
Introduction
This article concerns a review of acoustic comfort evaluation during field studies in residencies, which include acoustic measurements of building structures and surveys or interviews with residents in their actual living environment. The scope of this review is to collect and examine those studies which combine acoustic data and subjective responses in order to approach acoustic comfort.
Despite being an important concept in engineering, acoustic comfort is vaguely defined and explored in the literature. So far, the term has been used in a general sense by engineers and designers, usually to refer to conditions with little noise and disturbances in a certain space. However, most publications do not offer a concept description, even when they use the term “acoustic comfort” or quality in their title. 1
A first definition in the literature is provided by Rindel 2 and then repeated in some following articles.3–5 The description offered for acoustic comfort is “a concept that can be characterized by absence of unwanted sound and opportunities for acoustic activities without annoying other people.” This definition offers a user’s perspective rather than a relation to merely acoustic measured data: acoustic comfort, for a certain person, is a combination of the person as a receiver of sound as well as a source. This means that a person can be disturbed by his or her own sounds because the sounds are truly disturbing or just because others might be disturbed, and dissatisfaction or conflicts might arise.
Past research has shown that measurements and metrics that acousticians use in order to assess building acoustic conditions may not always be representative of how residents perceive acoustics in their living environment. For example, tenants might have problems with impact noise types or vibration transmission from neighboring flats in the low-frequency range that is partially omitted from measurement spectra. 6
Developments in the construction industry, such as the use of wood as a building material, create a demand for higher standards to be met in dwellings. Various regulations exist in several countries to assess sound insulation issues from noise inside or outside a building. 5 Residents still report complaints about noise from neighbors, outside road traffic, indoor technical installations, or other sources.6–15 A central concern is thus how well the perception of residents corresponds to the results acquired by acoustic measurements and the descriptors of sound insulation in buildings. The latter are defined in a list of related standards, and variations of these are sometimes proposed in order to achieve better levels of agreement. Statistical methods have been used to examine how well building acoustic descriptors correlate to the subjective ratings of tenants, in field or laboratory studies. If they do, it is possible to formulate models for prediction of satisfaction and comfort for the building users.
For all the above reasons, sound perception and noise annoyance issues remain popular. However, the available research results usually come from small studies and remain insufficient (small samples) suggesting a demand for further research. Consequently, the idea of associating and comparing data of human sound perception to technical acoustic data seems essential. This article provides a systematic review in the association of subjective responses and acoustic data, in field studies in buildings. The overall purpose for examining this association is to evaluate, simulate, and maybe predict the response of residents and approach the concept of acoustic comfort.
Methods
The following databases were used to search for peer-reviewed publications and conference proceedings, offering investigation or comparisons between acoustic field data and subjective responses relevant to building acoustic studies: ScienceDirect, AIP Scitation, Ingenta Connect, ResearchGate, PubMed, Scopus, and Google Scholar. Several keywords in different orders and combinations were used, such as objective, subjective, acoustic, psychoacoustic, self-report, rating, score, comfort, quality, airborne, impact, sound, insulation, noise, annoyance, assessment, association, correlation, evaluation, comparison, building, and dwellings. Many times, the searches did not return a useful outcome for the scope of this review. Then, some studies were found in the references of the relevant publications, which were found initially.
Review criteria
Requirements for inclusion of articles in this review were the comparison of results between field acoustic data and subjective responses in the actual living environments as well as the use of statistical methods for the association of those data. The subjective data are obtained from residents with questionnaire surveys or interviews. In the end, 50 articles were found during the search in databases or relevant references; 24 of them were decided to be included in this review,1–24 which correspond to 10 complete studies. The excluded studies25–51 concerned mostly laboratory studies and not field studies.
The exclusion criteria, besides article context, were the year of publication and language. A threshold was set to 1985, because the earlier research studies found were few and very limited in results. Also, few of them were national publications, written not in English but in German, for example, so we could not translate and analyze them properly. The review search took place from April 2015 until September 2017.
Summary of methods, metrics, and quantities in the reviewed studies
Many different indicators (or descriptors) have been used to represent different quantities in acoustic measurements. They are all standardized in international ISO or other national standards, which usually comply with ISO. Many variations of them exist as well, since experimental research has been done to acquire better indicators than the standardized ones. A tabulation of all indicators presented in this review as well as the standards in which they are defined is presented in Table 1.
Descriptions of the acoustic indicators used in the reviewed studies.
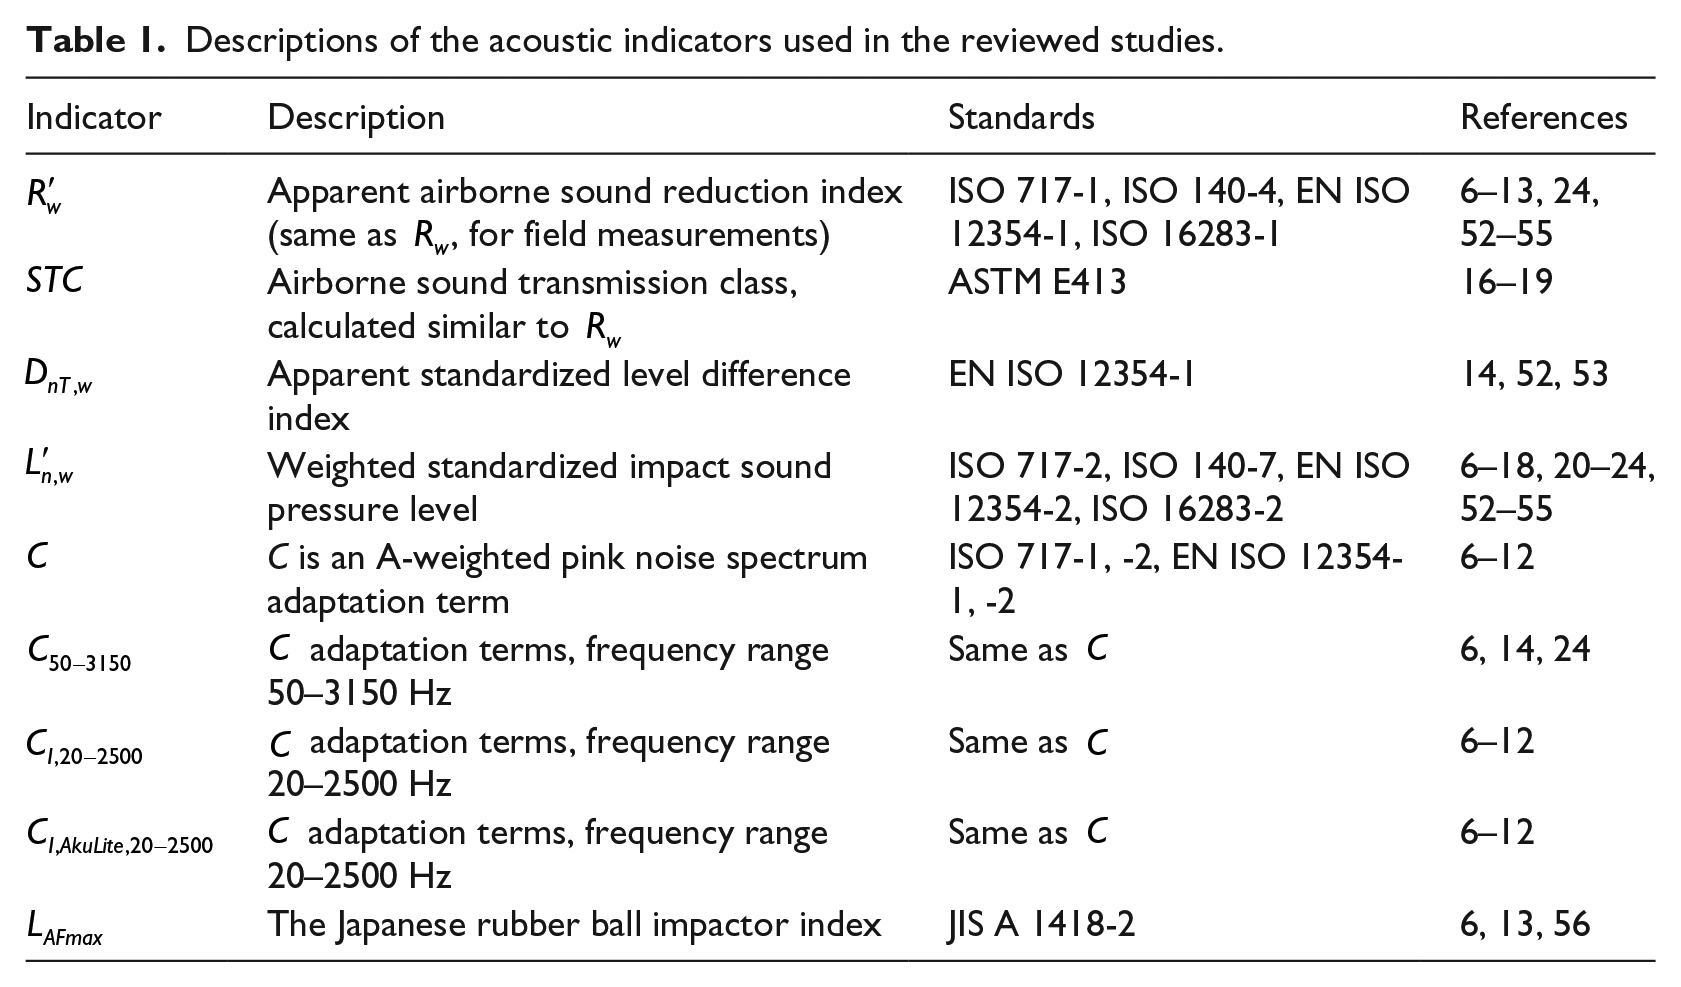
For the calculation of indicators such as
Several statistical methods are used in the studies, by means of statistical correlations and regression analyses, which associate acoustic data and subjective responses. The quality of statistical association is described with typical parameters:
The correlation coefficient, denoted as
The coefficient of determination, denoted as
The p-value and the confidence intervals (CIs) are measures of statistical significance, meaning the probability for the real result (which we approach with statistical methods) to be different than the observed, that is, the outcome of the statistics.
Evaluation of included studies
The quality of evidence for studies in this review was evaluated using Bradford Hill’s criteria, 61 which is an evidence classification method often used in epidemiology and health studies. The fulfilled criteria are rated in a scale of high (+++), moderate (++), and low (+). The results are tabulated in Table 2, while the criteria used for evaluation are as follows:
Strength of association: it refers to the causality proven by the association between the studied variables (cause, effect size, and confounding factors).
Consistency: indicates the degree of certainty when similar results are observed by different studies in different tests.
Specificity: specific factors and effects on a specific population lead to a more likely causal relationship.
Temporality: it is based on temporal relations between effects and used as an indicator for causality, meaning one effect occurring after an exposure.
Biological gradient: it refers to the relation between exposure and effect; usually bigger exposure leads to greater effect, but not always, while the opposite outcome can occur as well.
Plausibility: it means that a biological explanation of why a cause leads to a certain effect supports a reasonable causality.
Coherence: it is a condition meaning that a stated causal relationship should not contradict with other accepted results or knowledge.
Experiment: it refers to the study design parameters that guarantee a reasonable causation, such as randomization.
Analogy: the possibility of having or predicting analogous effects from similar factors without total evidence.
Publication type: an additional criterion that we added in order to rank the reviewed studies. Scientific journal articles are thoroughly peer reviewed, while conference articles are usually less well reviewed. There are also study reports from research organizations that may be scientifically conducted but not reviewed. Thus, publications were evaluated as follows: scientific journal, +++; conference article, ++; and technical report, +.
Evaluation of the presented studies according to selected criteria.
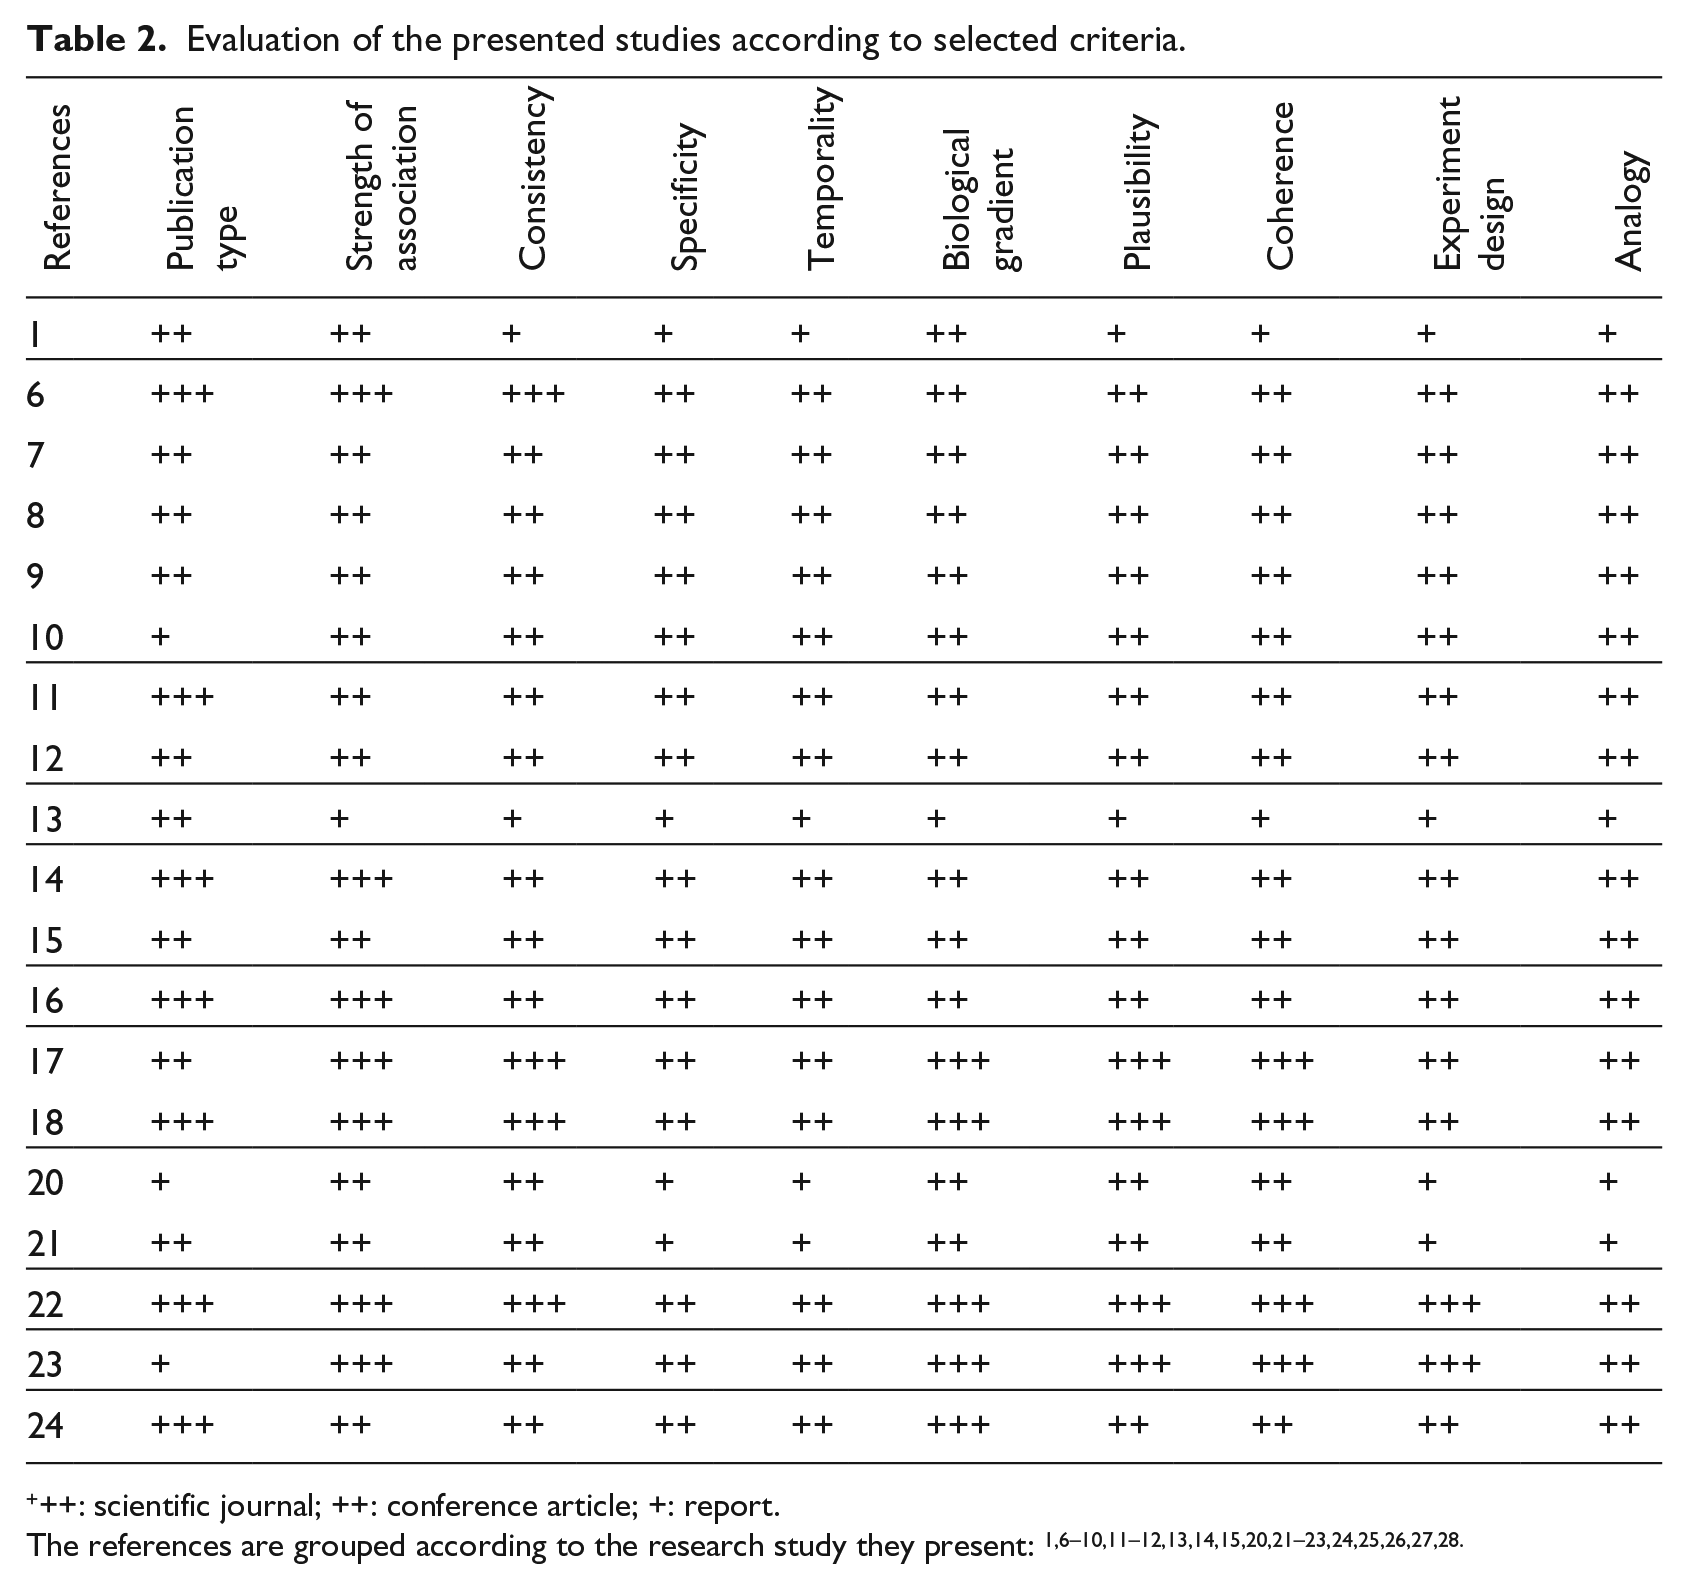
++: scientific journal; ++: conference article; +: report.
The evaluation of the included studies was conducted by the authors. The presented data were chosen according to their relation and importance for this review’s context. In Table 3, an overview is presented for all the selected studies, which are tabulated with important details on study design, variables, and summary of results. The studies are analyzed in the next section. In Table 2, the evidence evaluation rating of the studies is presented according to Bradford Hill’s criteria, 61 which were chosen because they focus on causation between exposure and effects. Other evaluation such as the GRADE approach 62 was not preferred as it focuses a lot on the study design; in building acoustics, most studies are cross-sectional or experimental, so they would be rated very low in such a case. Readers who would like to have a deeper insight in any specific study results, and conclusions may read the original publications using the references.
Overview of the selected studies.
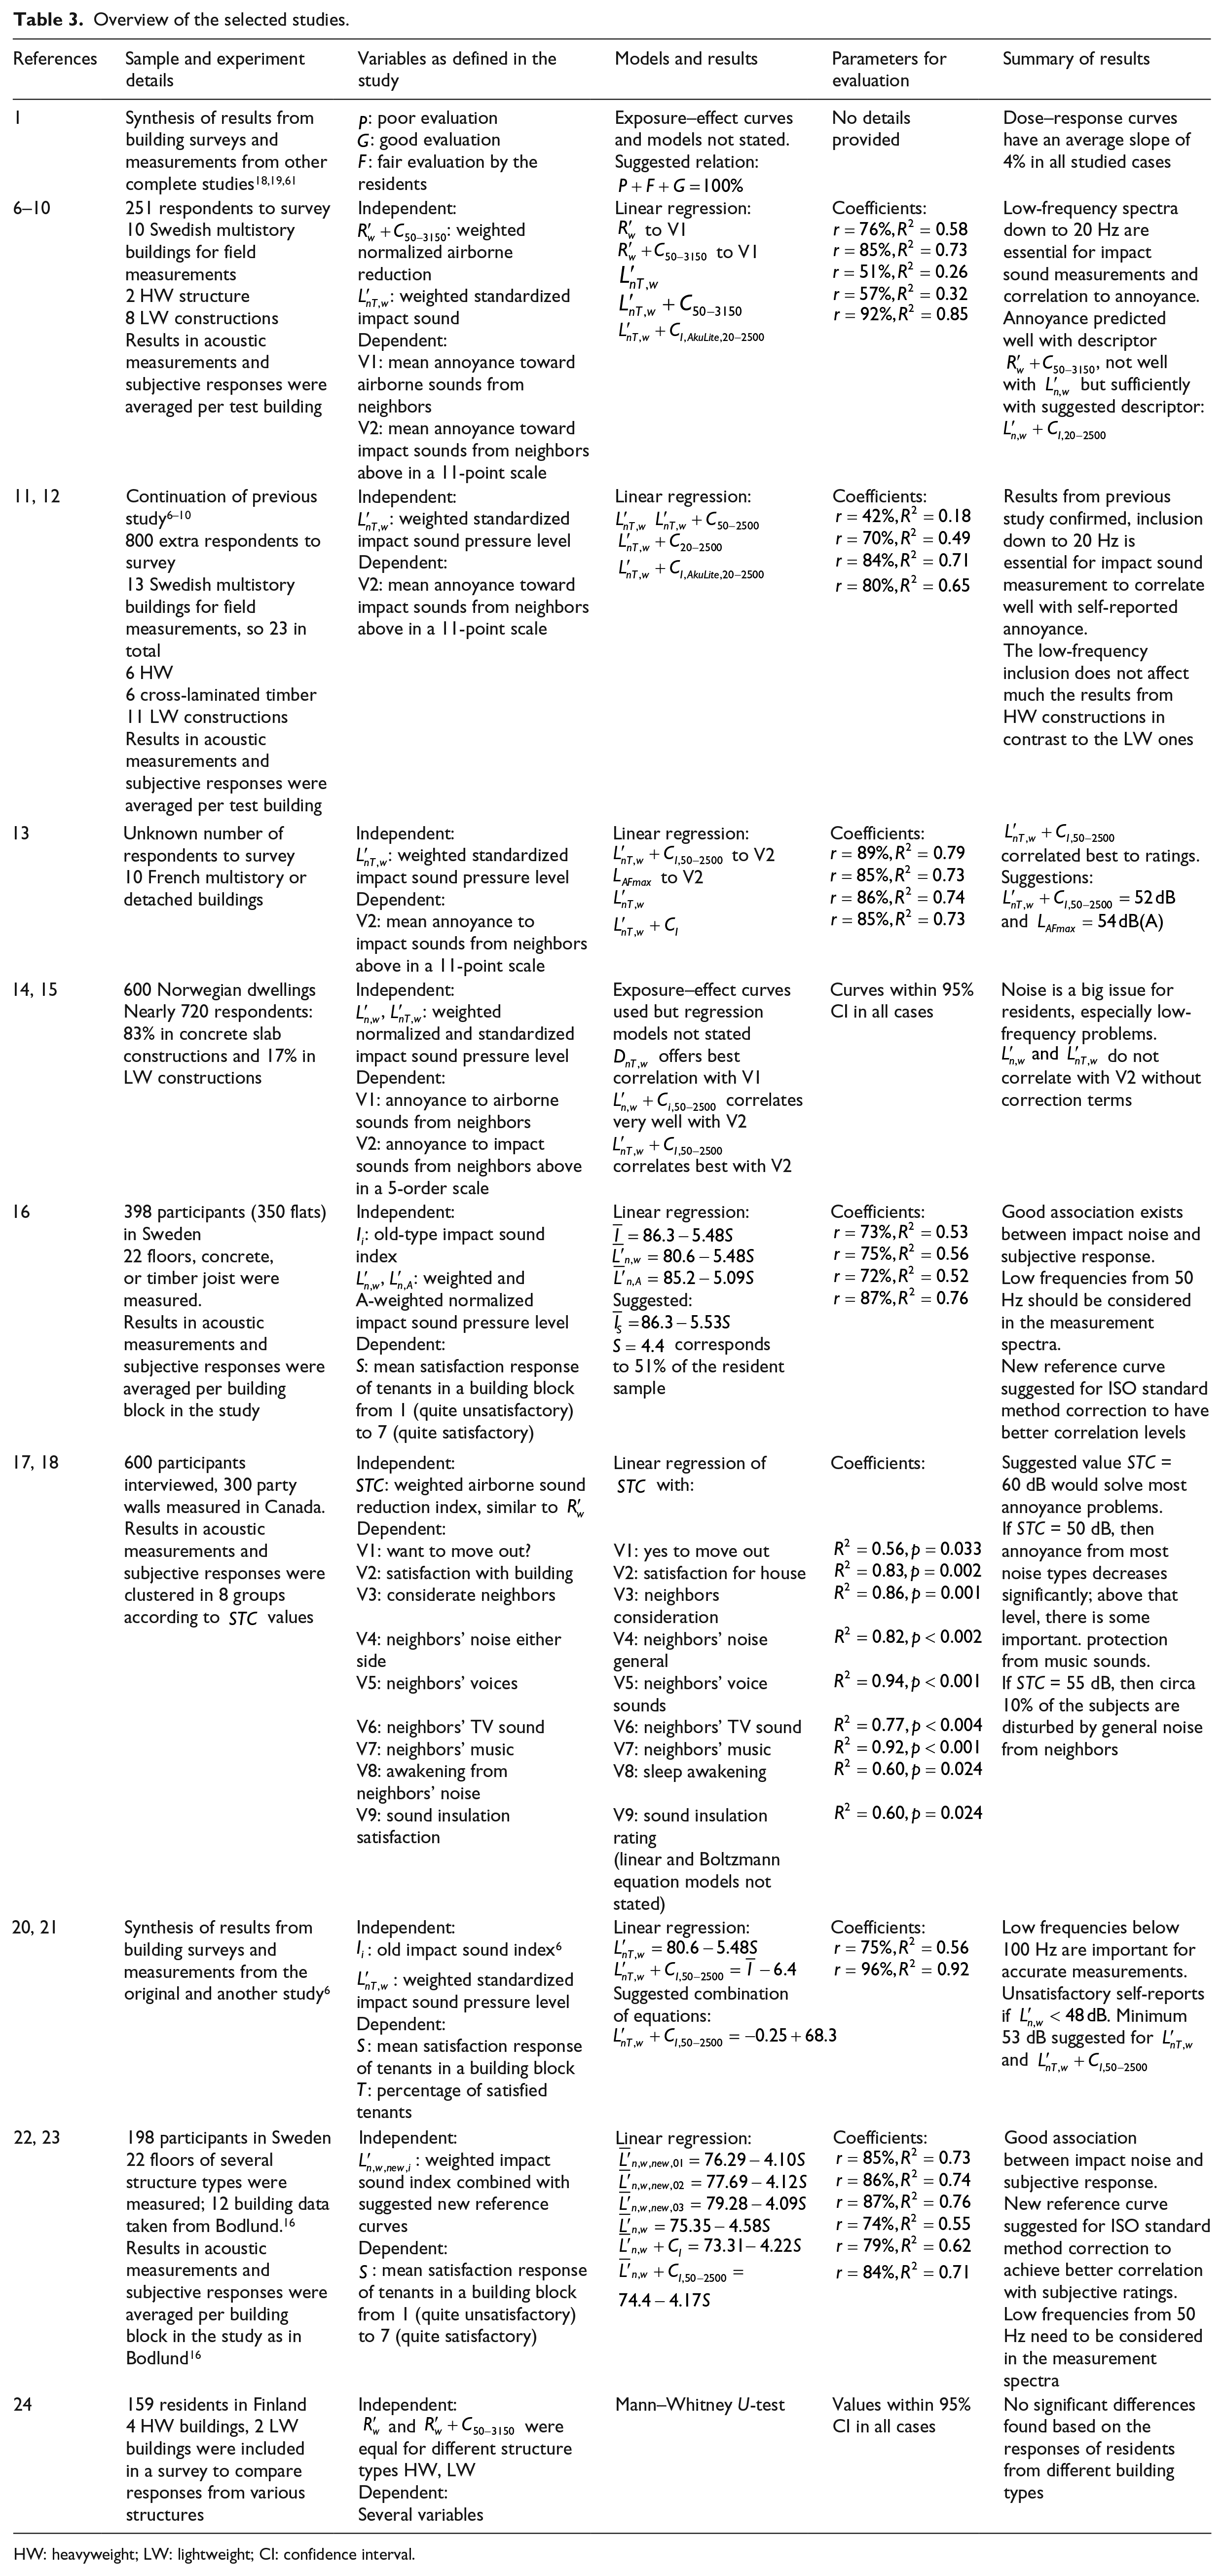
HW: heavyweight; LW: lightweight; CI: confidence interval.
Reviewed results
The first extensive research took place in Europe in 1985, and it is reported by Bodlund. 16 It concerns the evaluation of the sound conditions in Swedish buildings, specifically for impact sound insulation. That study proposed a basic method set for further research in building acoustics, using objective and subjective assessment of noise, and it was cited in many following publications. A wide sample of 350 Swedish dwellings was used, and acoustic measurements of impact sound transmission took place in building blocks of houses. The residents were interviewed in order to provide their ratings on acoustic behavior of their home using a satisfaction scale ranging from 1 (quite unsatisfactory) to 7 (quite satisfactory). About 464 scores were collected from 398 participants. The constructions tested were 22 floors, concrete, or timber joist floors in a sample of both attached houses and multistory residencies. All the data were grouped and averaged according to the actual urban building blocks, which consisted of similar constructions. There were at least 6 different floor measurements and about 20 interviews per block.
The average impact sound index
Bodlund mentions that the tapping machine spectrum is different than the one excited by a person running; the tapping machine gives significantly higher amplitudes in middle and high frequencies, while walking excites mostly low frequencies on the floor structures. Furthermore, this effect is more intense in wooden structures, an argument which is supported in other following studies. 6
Finally, Bodlund suggested that a new reference curve for the ISO 717 corrections with an emphasis on the low and middle frequencies would correlate better to subjective ratings. He used the study’s results to calculate a new curve, that being a straight line from 50 Hz to 1 kHz with a slope of 1 dB/octave. In this case, the regression model for the average suggested index was
In the same time with the previous studies, a similar study took place in Canada by Bradley17,18 for investigation of airborne sound insulation in a wide sample of 300 constructions, row housing and multifloor buildings, in three cities. Acoustic measurements were performed in the party walls between houses, and interviews were taken face to face with 600 tenants. Responses to questions were given using a 7-point scale. The association of airborne sound reduction index and personal responses was analyzed by fitting linear regression models or sigmoidal Boltzmann equations. However, the models are not stated but only their
When the residents were asked if they want to move out of their home due to noise, more than 94% replied positive, indicating that neighbor noise is a serious issue (fitted line slopes down with increasing
In the previous studies,1–2,20–22 the conclusions presented deal with a synthesis of results of previous studies in different countries which took place between the years 1972 and 1997. A short review of those studies is included in Hveem et al. 20 and Rindel and Rasmussen. 21 Sound insulation data from buildings and self-reported noise annoyance data were compared in order to assess the satisfaction perception of building tenants.
Some further analyzed results from Bodlund
16
are used in Hveem et al.
20
and Rindel and Rasmussen
21
where another regression model was developed which was finally expressed as
In Hveem et al.,
20
another self-report assessment is published where 17 floor structures in multistory buildings were rated as satisfactory/good, barely satisfactory, or unsatisfactory. The observations indicated that the overall subjective response is satisfactory or good when the
In the study of Rindel,
1
a subjective satisfaction model is suggested, after observations from the studies examined before,
20
which is
Additional conclusions by Rindel and Rasmussen
21
stress the need for low-frequency adaptation terms for improved correlation between airborne and impact sound insulation and subjective responses of tenants. This problem concerns mostly timber structures due to their poor performance in low frequencies down to 20 Hz. There is also an ad hoc suggestion mentioned for airborne sound insulation to be satisfactory, at least 2/3 of the tenants should consider it good which corresponds to a minimum of
In a following study by Hagberg,22,23 the results from Bodlund 16 were enriched with new data, and they were reprocessed. Another 10 Swedish buildings of various structures were tested with impact sound measurements; 198 new participants were interviewed with the same method. The new data were combined with previous measurements from 12 buildings from a previous study 16 to make up a total sample of 22 buildings. Linear regression models were performed again to test the data association between residents’ satisfaction and impact sound index values. All data were averaged again per building block as before in Bodlund. 16 New reference contours were tested too, as well as the previous suggested Bodlund’s reference curve, which was found insufficient to associate well with the new sample data.
The apparent airborne sound reduction index
Previous studies6–15 have many aspects in common; since they are contemporary, they follow the same methodology and occurred about the same period. First, they all deal with the subject of evaluation of acoustic comfort in multistory family dwellings, based on the combination of objective and subjective data. They use standardized procedures of airborne and impact sound (standardized tapping machine and Japanese rubber ball) following the relevant standards (ISO 717-1 and -2,57,58 ISO 140-4 and -7,59,60 EN 12354-1 and -2,52,53 and JIS A 1418-256), for the characterization of sound insulation of building elements. The acoustic measurements took place in selected living rooms or bedrooms in the study buildings in every case. Questionnaires were developed, for the rating of noise assessment into the participants’ apartments based on a common methodology described in Simmons 63 and following ISO 15666. 64 In all cases, the question formulations included annoyance due to noise and vibration from neighboring apartments, noise from neighbors in common or collective spaces, noise from technical installations or equipment, outdoor noise, and noise inside the tenant’s apartment. Then, the results between acoustic measurements and perceived noise annoyance were compared, and the degree of association among the collected data was investigated.
In previous articles,6–10 the AkuLite research program is presented, a study with a sample of 10 Swedish multistory buildings: a typical heavy concrete building and 9 lightweight (LW) structures (4 wooden, 4 made of cross-laminated timber, and 1 of steel framework). A total of two typical rooms one above another were measured acoustically in each test building. A total of 251 responses were collected from participating tenants (reported response rate circa 30%) of the test buildings. The AkuLite questionnaire consisted of 15 questions concerning noise annoyance inside apartments. The measurement data and subjective responses, grouped in mean values for every building, were evaluated statistically using linear regression analysis within 95% CI.
The apparent airborne sound reduction index
The results of the AkuLite project were enriched in a continuation study presented by Ljunggren et al.11,12 Acoustic measurements and surveys in another 13 Swedish buildings took place, since the previous sample of buildings was limited according to the authors. The same methodology was followed, and about 800 responses were collected; the associations of standardized impact noise levels measured with tapping machine to self-report annoyance were explored from the total sample number of 23 buildings. Again, the standardized impact sound index
Summing up for the AkuLite project, the perception outcome of the tenants’ responses indicates that the noise annoyance due to airborne sound transmission is generally low, and the correlation of objective and subjective data is sufficient. In contrast to that, low-frequency noise induced by impact sound was found to be the highest recorded source in both acoustic measurements and self-reported noise annoyance. The indicators
In Guigou-Carter et al., 13 10 various construction buildings were measured for the French study project Acoubois, some multistory ones and some attached houses. The survey included questions about annoyance from several noise types, similar to Ljunggren et al. 6 The sample size and response rate are not stated in the publication (reported only 57% females, age span 26–59 years), as well as other essential data about the study design. In the study results, 85% of the tenants reported sound insulation to be very important. Overall, more than 50% did not report any annoyance, which is considered as a satisfactory result for the French regulations according the authors.
The correlation coefficients were calculated for some questions corresponding to the measurements of airborne and impact sounds. According to that study, the best correlation found for the impact sound index
In the articles of Milford et al. 14 and Høsøien et al., 15 another study is presented, which took place in Norway for the evaluation of subjective sound quality ratings in newly built dwellings (2002–2015). Field measurements in 600 buildings were done alongside a socio-acoustic survey with a questionnaire sent to the occupants of the buildings. In total, 702 residents answered to 35 questions, similar to the ones developed in JIS A 1418-2. 56 The articles elaborate on the responses from questions regarding annoyance due to airborne and impact sounds coming from neighbors from the above floor in a slightly differentiated scale from 1 (not annoyed) to 5 (extremely annoyed).
The results indicate that 65% of the occupants are at least slightly disturbed, and the authors emphasize on the wide problem of low-frequency noise; 33% report worried about their own TV, music, or speech annoying other occupants; 20% of the occupants report at least moderately annoyed by traffic noise or impact sounds from neighbors above. The articles mention that impact sound annoyance from neighbors above, especially footfall noise, is reported as stressing as road traffic annoyance. Bad correlation is reported between subjective ratings and the weighted impact sound indices
Another building survey was setup in Finland
24
to compare acoustic satisfaction in different multistory building structures with similar airborne sound insulation of walls. Specifically, four HW concrete buildings with measured
Discussion
This review article concerns studies which include acoustic data from in situ measurements and self-reported responses from the residents, collected with surveys or interviews in test buildings. The selected field studies explore acoustic comfort in buildings through the association of objective and subjective data. Few researches were found to fulfill the aims of this review, namely, 10 separate studies reported in 24 articles. Noticeably eight of the analyzed field studies are Scandinavian, then one is French, and one is Canadian.
Most of the studies found during our search were conducted in laboratory tests, and subjective assessment was evaluated with listening experiments. The laboratory tests are easier to set up, but laboratory measurements ignore the interaction of the whole building structure during sound propagation. In contrast, field measurements capture the real acoustic behavior of structures. The mental state of a participant can be also different in a laboratory than being in the actual living environment and offering spontaneous judgments. Therefore, only results from field studies were chosen to be investigated in this review article.
From all the articles dealing with acoustic comfort and even including the term “comfort” or “quality” in their title, only two of them provide an actual definition of those concepts.2,5 More definitions could be reported, and the writers should generally elaborate more on the concept of comfort.
The review revealed that noise issues in residential buildings are significant for acoustic comfort, especially impact noise sounds produced by neighbors that include many low-frequency components.6–15 An overview of the noise types reported (and which ones were found most important) in the different studies is given in Table 4. Many studies report that specifically impact noise leads to high disturbance according to human perception results, mostly cases of impact sound from neighbors walking, either barefoot or not. Neighbors’ steps from the above floor are reported as the most annoying noise source for residents.6–13,16 Some study results are even more specific for noise types, such as in Ljunggren et al. 12 where footfall walking is stressed to be the biggest disturbance due to the excitation of many low frequencies that propagate through flanking transmission paths too, that is, through connected floors and walls.
Noise types reported in the different case studies.
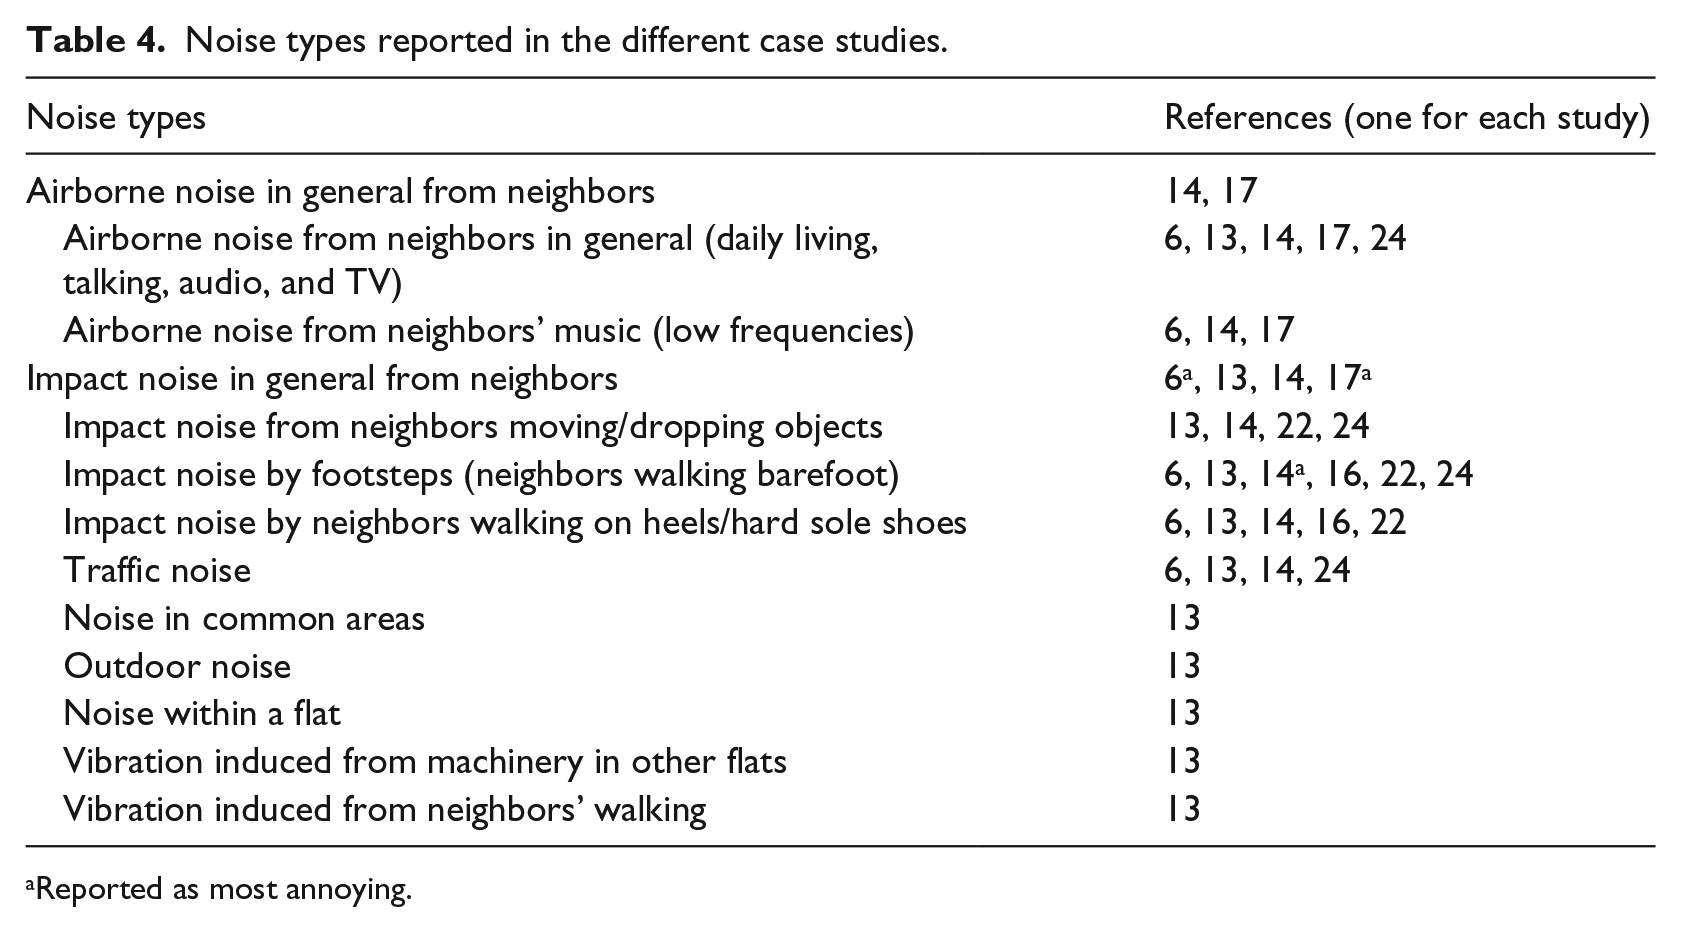
Reported as most annoying.
Many studies also conclude that extended frequency spectra which include frequencies below 100 Hz correlate better with self-reported responses on noise annoyance, especially for the impact sound cases.1,6–14,16,17 This finding further underlines the observation that low frequencies could offer results for better prediction of human perception in living environments. Besides being an overall suggestion, it is considered a necessity for LW structures, where the most problematic noise propagation occurs in low frequencies, due to resonances of structural elements and coupling among them.
6
In LW building structures, the impact sound insulation standards can be met, and the
Noise content with intense low-frequency characteristics can be more disturbing while propagating through LW building components. LW structures offer better sound reduction than HW ones but not in the low-frequency range.6–10 Below around 100 Hz, the performance is expected to change, with poorer insulation of LW walls as indicated by the in situ studies.
In some articles, the authors suggest specific values for building acoustic indicators, which came up as efficient to represent a good level of acoustic conditions in every case study. The suggested values usually correspond to 50% satisfaction of residents, and they are presented in Table 5. The most important suggestions are as follows:
Suggested acoustic indicator values corresponding to satisfaction.
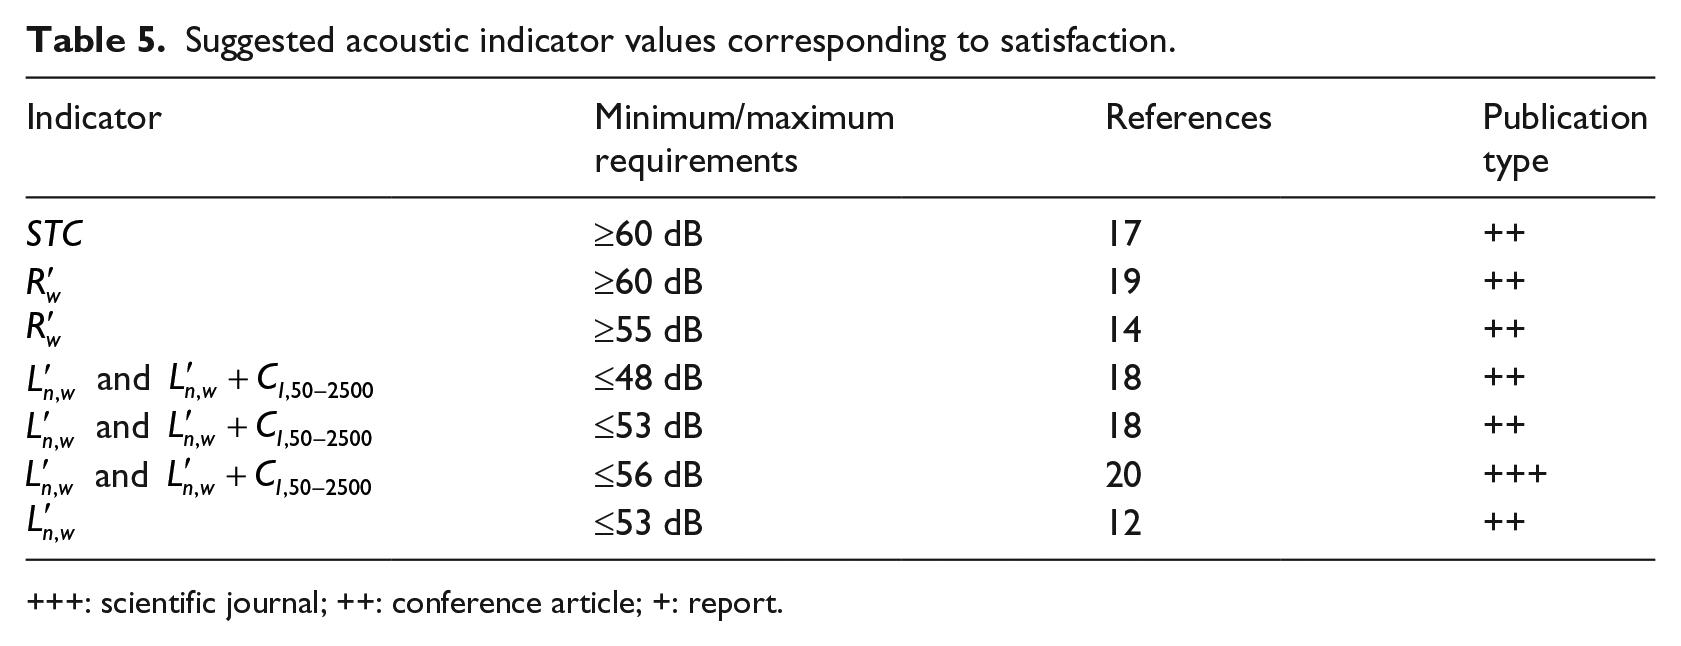
++: scientific journal; ++: conference article; +: report.
Concerning prediction models developed from the results, some of them are good with high determination coefficients, that is, high
Although statistical methods are used to compare and associate results from objective and subjective data, in the examined literature, many shortcomings take place in the study designs and reporting methods and results. First, the biggest problem observed in many studies is the lack or misuse of basic statistic indicators; some of them do not even mention the sample size of participants 13 or other parameters such as p-values. Furthermore, the presentation of the outcome is not always successful, even if it is important. In many studies, the regression models are presented with the independent variable (usually airborne or impact sound levels) on the y-axis and the dependent on the x-axis, while the opposite is the usual way for statistical data representation. In few cases, the regression models and parameters represent the opposite relationship between dependent and independent variables.16,22 That makes the comparison or regression models and their parameters cumbersome. For most studies, there is no assumptions analyzed for the used methods and any tests of statistical significance; few of them provide sufficient information on the test design and mention parameters such as p-values on their results. The insufficient statistical background of the studies can be clearly seen in the evaluation criteria fulfillment in Table 2.
Conclusion
The study review highly indicates that there are serious annoyance issues which affect acoustic comfort in dwellings. There exist especially problems with impact noise types from neighbors, which include a high degree of low-frequency content. Specifically, walking noise has been reported as the most disturbing noise source. Also, the lack of very low-frequency content in the impact sound measurements leads to weak statistical association with subjective response of residents. Therefore, most studies suggest that measurements should include extended frequencies down to 50 Hz (or even down to 20 Hz), instead of 100 Hz which is the present lowest limit in the ISO standards. The greatest problems with impact noise and related low-frequency transmission are found in LW structures, while concrete buildings have better overall insulation against noise transmission, airborne or impact.
Many studies included in this review lending data to these suggestions lack rigorous scientific presentation of results and statistical methods leading to a risk of misinterpretation. We suggest a harmonized description of methods and results using common acoustic and statistical indicators, sufficient reporting of statistical evaluation parameters, and the testing for statistical significance.
Footnotes
Declaration of conflicting interests
The author(s) declared no potential conflicts of interest with respect to the research, authorship, and/or publication of this article.
Funding
The author(s) disclosed receipt of the following financial support for the research, authorship, and/or publication of this article: This article was written within the research project “Acoustic Comfort in Building Apartments” funded by Saint-Gobain Weber.