
Abstract
During operation, the mating surfaces of a metal-to-metal seal typically undergo significant plastic deformation, which in turn can have beneficial effect on its performance. In previous studies, it has, for instance, been shown that plastic deformation can provide for better sealing during unloading. Those studies did, however, only consider flow through unrealistically small domains. Therefore, it is possible that this might be a size effect, which would not be apparent in a real situation with a much larger domain. In this paper, we develop a model which can handle real-sized seal domains at the same time as fine details of the surface topography. More precisely, we construct a two-scale model, in which the global scale represents the seal domain and where the influence of the fine details at the local scale are represented by a stochastic element. By means of this stochastic two-scale model, we show that the beneficial effect associated with the plastic deformation persists also when real-sized seal domains are considered.
Introduction
The metal-to-metal seal is an example of an application in which the performance is highly influenced by the evolution of the surface topography and, in particular, by the plastic deformation occurring during loading cycles. Kadin et al. 1 presented numerical simulation results showing that plastic deformation leads to a more intimate contact between the surfaces and this may improve the sealing performance. Experimental evidence supporting this can be found in the results by Murtagian et al. 2 Despite this, little is known about the mechanism through which plastic deformation affects the leakage. Therefore, a study of the effect of plastic deformation on sealing performance was undertaken by the present authors in Pérez-Ràfols et al. 3 That study lead to an interesting observation: after loading the seal up to a certain applied load, one could reduce substantially the applied load without observing any significant increase in leakage. This is relevant to the robustness of the metal-to-metal seal, as it gives an indication of the amount of load a seal can lose before it fails. The main limitation of the work in Pérez-Ràfols et al. 3 is that it considers unrealistically small domains.
In this work, we attempt to answer the question: will this behaviour still be prevalent when a domain large enough to cover the size of a realistic seal is considered? To this end, we extend the model presented by Pérez-Ràfols et al. 4 to allow for studying the contact mechanics and leakage of seals during unloading as well. As in Pérez-Ràfols et al., 4 the present model couples a classical two-scale type of formulation with an explicit consideration to the stochastic nature of the roughness at the local scale. A novelty is a stochastic construction for the permeability, which considers the complete loading–unloading cycle.
The rest of the paper is organised as follows. First, a fully deterministic model (in opposition to a two-scale model) is introduced to serve as a reference. Then, the two-scale model is presented in the following section and its accuracy is evaluated in the Appendix. In ‘The two-scale stochastic model’ section, the two-scale stochastic model is presented and, in ‘Results and discussion’ section, the model is used to answer the question posed.
The deterministic model
A deterministic model is used to assess the accuracy and validity of the outcome of the stochastic two-scale model, which is the main development in this paper. This deterministic model is based on the one presented in Sahlin et al. 5 and later in Pérez-Ràfols et al. 3 It is, therefore, only briefly summarised here.
In this work, we assume that the deformation caused by fluid-structure interaction is small as compared to the deformation caused by direct mechanical contact between the two surfaces. It follows from this assumption that it is possible to separate the model into two distinct physics, i.e.
A contact mechanics model to determine the elasto-plastic deformation due to a total applied load W, and the elastic spring back when releasing the load. A fluid flow model to compute the amount of fluid that flows through the rough aperture between the two deformed surfaces obtained from the contact mechanics model for a given a pressure drop driving the flow.
In what follows in this section, we present the contact mechanics model, then we explain how unloading is modelled and finally we present the fluid flow model. The same rectangular solution domain, Ω, defined as

The contact mechanics model
The contact mechanics model utilised here is the same as the one presented in Sahlin et al.
5
Therefore, only a summary of the model will be given. The model assumes that the behaviour of the surface can be described by a half-space in which friction is neglected. We can thus utilise the Boussinesq solution to model the relation between the contact pressure and the elastic deformation. Moreover, a linear elastic perfectly plastic material model is adopted. More precisely, when the contact pressure at a certain point exceeds the hardness of the softer material, H, the point floats at the surface and the pressure remains equal to the hardness. The hardness of the material is taken as 2.8 times the yield limit, see Johnson.
6
The desired output for the contact mechanics model (in the context of this work) is the gap between the deformed surfaces, h, defined as


Here E1, E2, ν1 and ν2 are the elastic modulus and Poisson ratios of the contacting surfaces. Since contact is defined by h = 0 and


As in Sahlin et al., 5 the complementarity problem, (5), is numerically solved employing the variational principle, formulated for the total complementary potential energy and by using DC-FFT method to accelerate the computation of the convolution in (3).
Loading and unloading
From the way plasticity is implemented, it follows that the predicted unloading of the seal is equal to any subsequent reloading, all the way up to the load where the unloading previously started. This is obvious from the fact that
The fluid flow model
In this section, we present the model for the flow through the rough aperture between the deformed surfaces (h). This is a Reynolds equation based model that can be applied to study the flow situations for which the classical thin film assumptions are valid. If the fluid is Newtonian, incompressible and iso-viscous, it can be expressed as


Note that the unitary pressure drop comes from the non-dimensionalisation of p
f
. In order to obtain the solution for a particular case, one simply needs to scale the non-dimensional pressure, p
f
with
Once (7) has been solved for the fluid pressure, p
f
, the leakage, Q
d
, can be computed. In general, the leakage equals the mass flow integrated over the outlet boundary. However, due to the periodicity imposed in x2-direction, the leakage can also be evaluated as the mass flow integrated over the whole domain, i.e.

This turns out to be a better option for the numerical evaluation since the pressure gradient at the boundary is close to zero and the numerical error would thus be greater if the integration would be carried out over the outlet boundary only. In (11), η is the (constant) dynamic viscosity of the fluid.
The two-scale model
The two-scale model presented in this work is based on the same ideas as the model presented in Pérez-Ràfols et al. 4 Therefore, detailed explanations will only be given when the two models differ from each other.
When presenting the two-scale model, we will follow the same structure we used to present the deterministic model. This means that we will first present the two-scale formulation of the contact mechanics model, then we will discuss the particularities of the modelling of loading and unloading when two scales are considered and finally we will present the two-scale formulation of the flow model. A schematic illustration of the outcome of a numerical simulation, obtained by means of the suggested two-scale model, the two-scale model is shown in Figure 1.
A schematic presentation of the flow situation (left) and the contact pressure variation (right) at both the global scale and the local scale, depicted in the inserts. In the left figure, the red arrows represent the direction and magnitude of the flow and the yellow to blue colormap represents the fluid pressure (p
f
) at each node of the global domain. Similarly, the pattern coloured in red in the insert depicts the local scale flow, whilst the corresponding fluid pressure distribution is represented by the colormap in yellow and blue. In the right figure, the nominal contact pressure (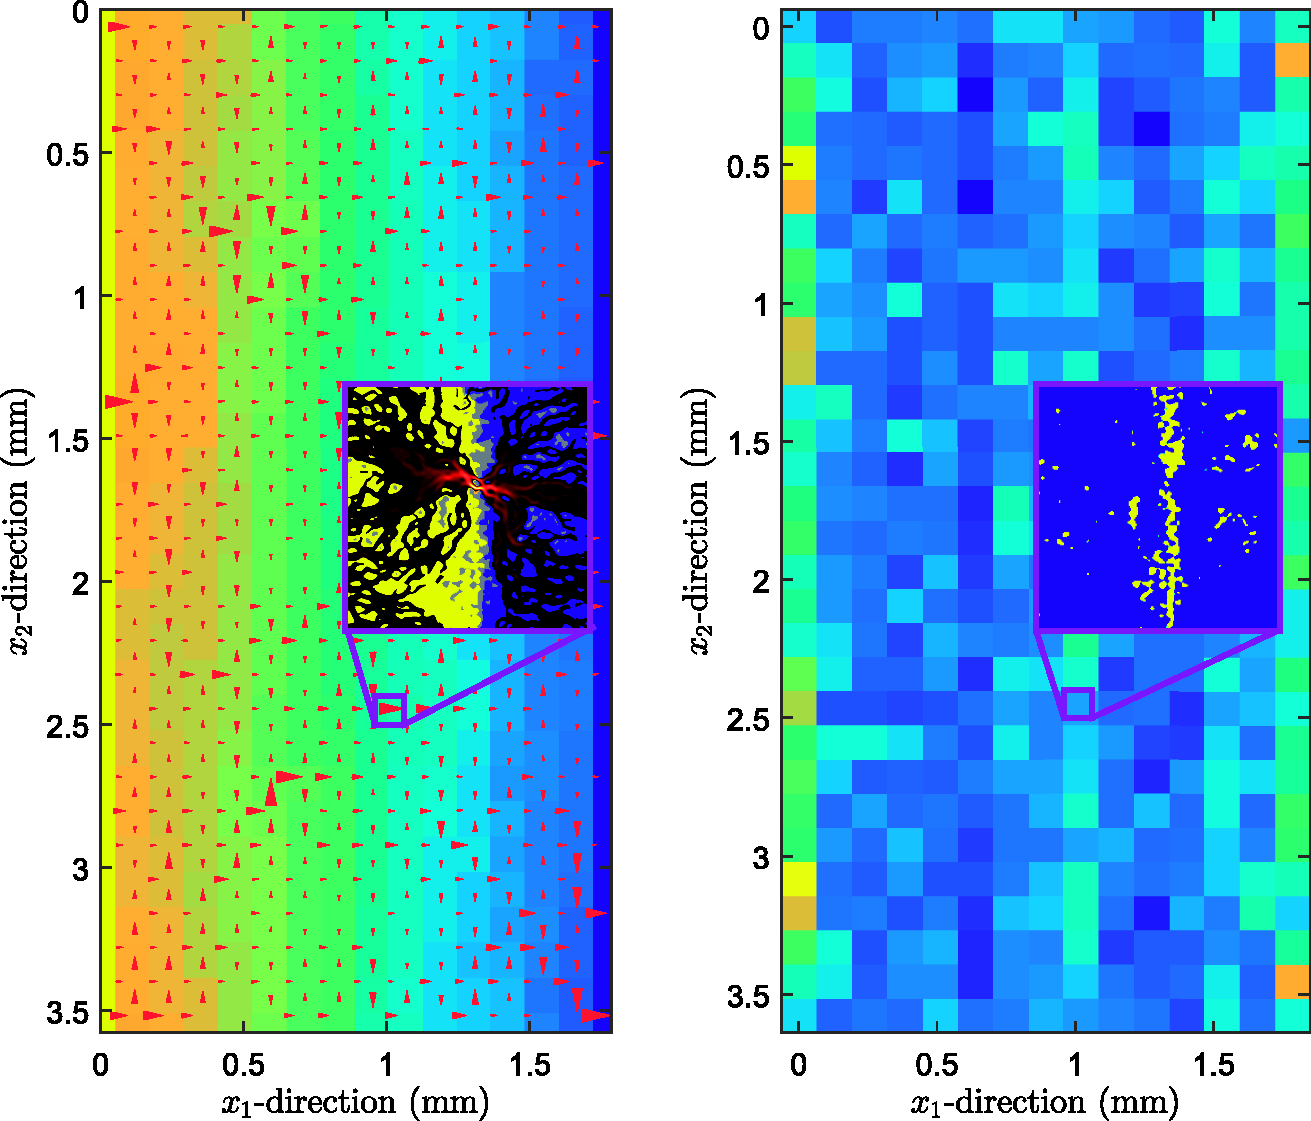
The two-scale contact mechanics model
The two-scale contact mechanics model is built upon two main assumptions, i.e. (i) using a low-pass filtered surface as an input for the deterministic contact mechanics model permits obtaining a (sufficiently accurate) coarse representation of the global-scale distributions of contact pressure and average separation, and (ii) the local and global scales can be coupled by approximating the nominal contact pressure and average separation at the local-scale by the global scale pressure
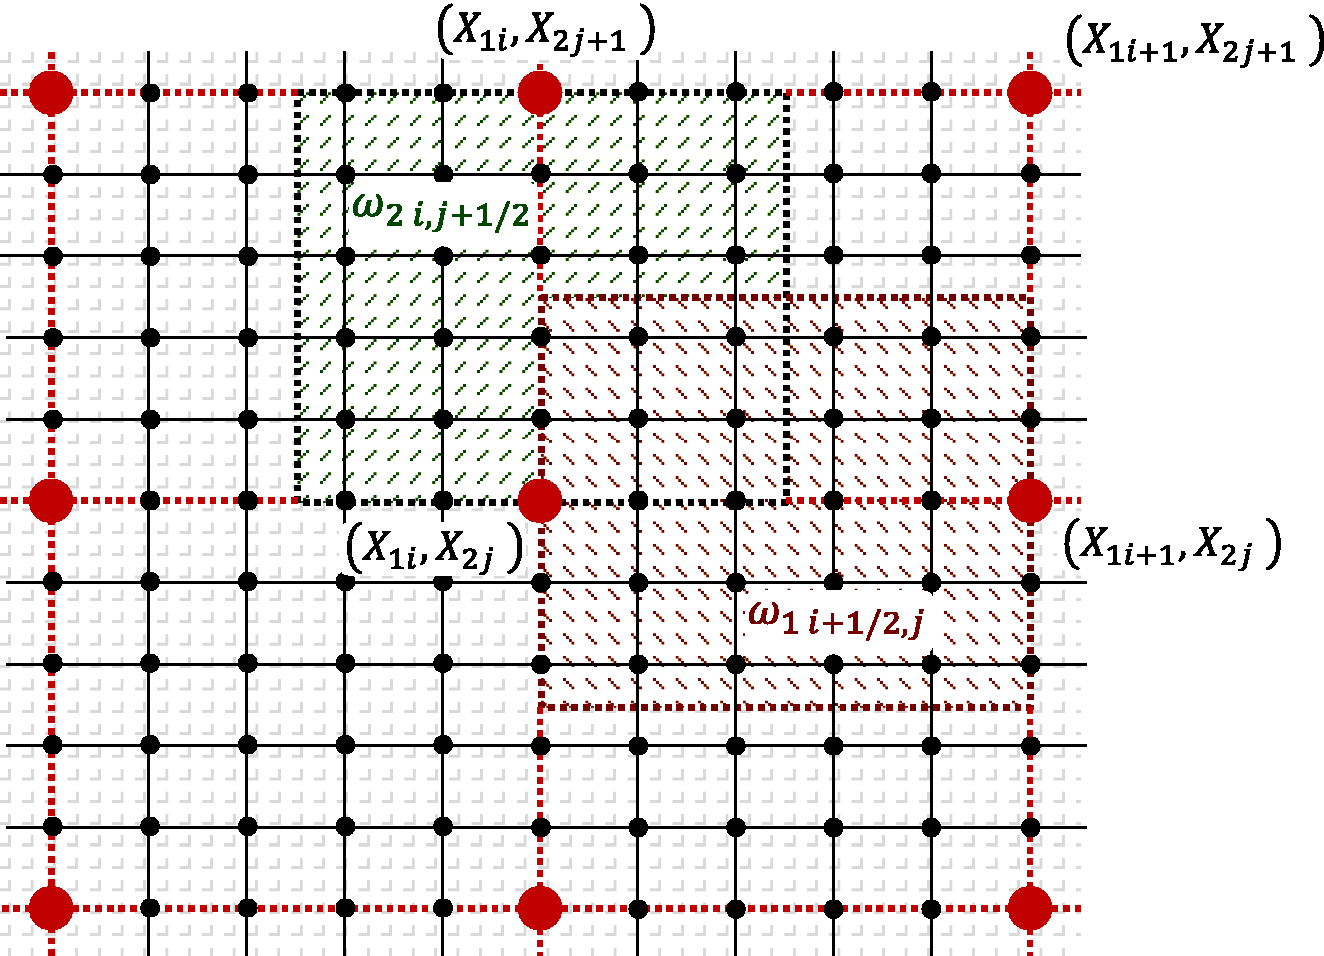
Based on the two previous assumptions, the two-scale contact mechanics model can be built following the steps, summarised in Figure 2. We start with a large measurement, which has been processed to avoid any artefact coming from the measurement. The height data are represented on a fine grid with Flow chart of the algorithm. On the left, the part corresponding to the computations on the local scale. On the right, the global scale contact mechanics part, described in ‘The two-scale contact mechanics model’ section. The yellow boxes correspond to intermediate outputs. Representation of the different domains and grids used in the contact mechanics model. The grey lines with nodes 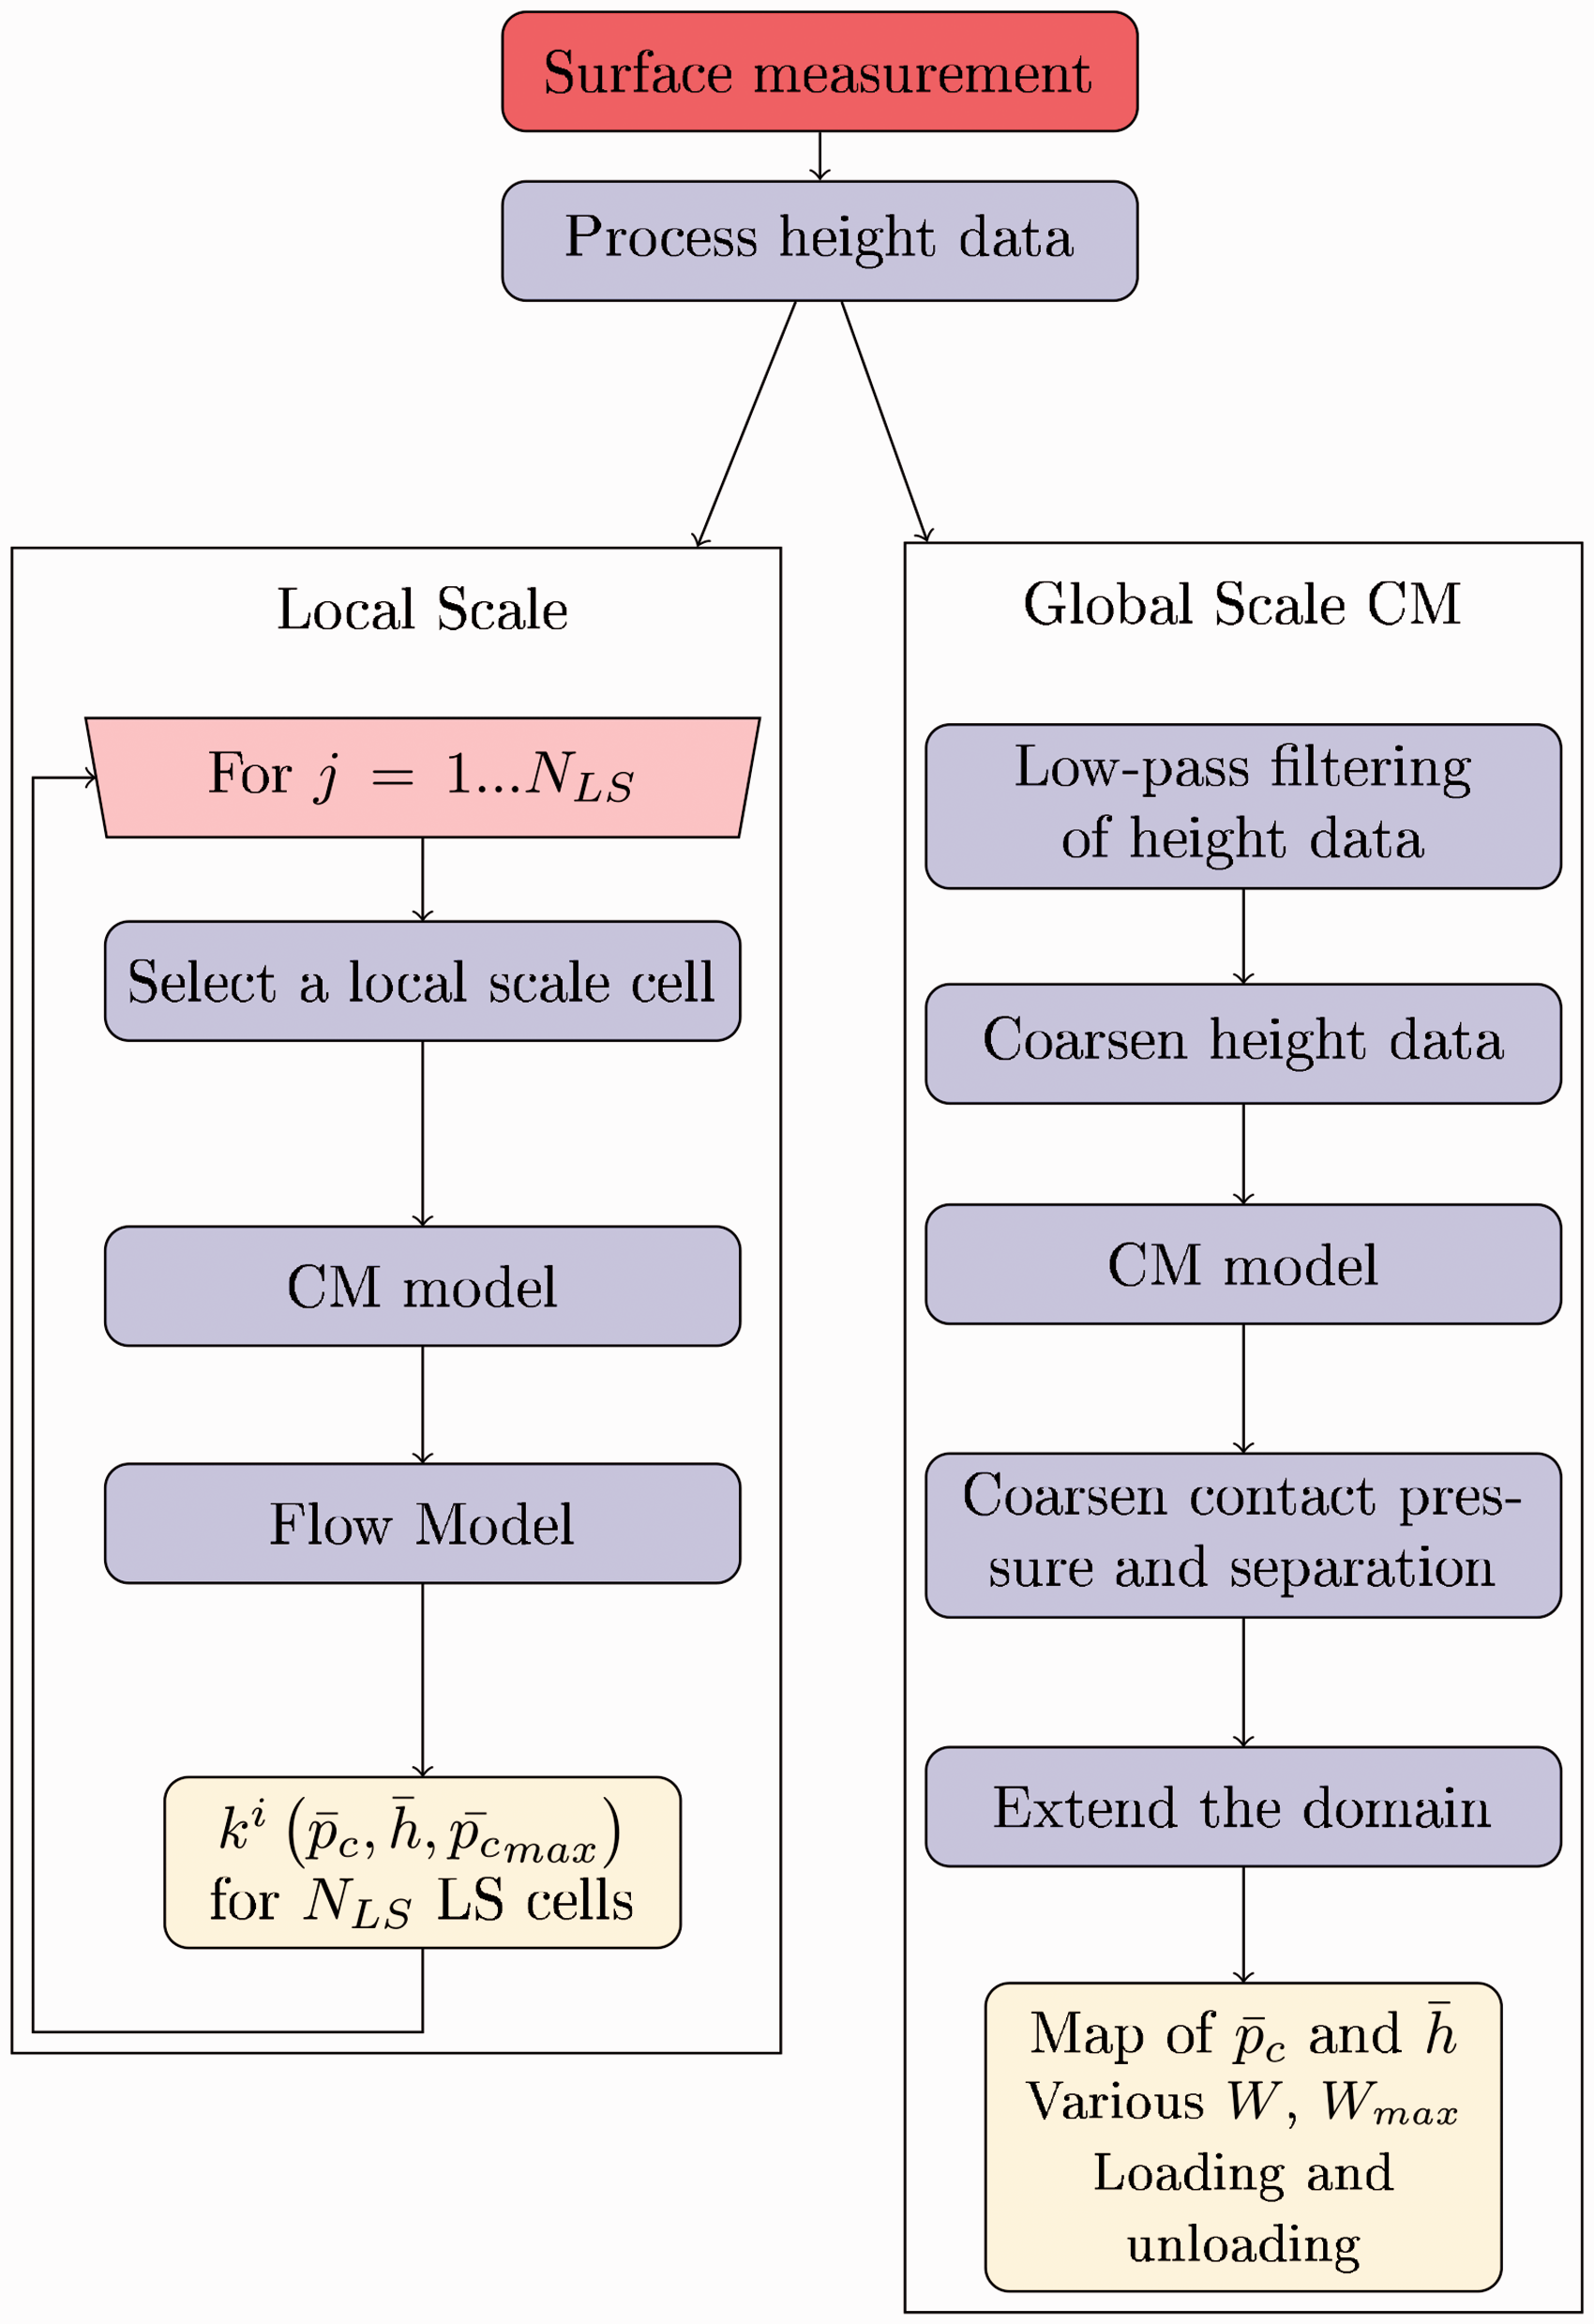
The deterministic contact mechanics model is used to obtain coarse grid representation of the contact pressure

For clarity, these two domains are depicted in Figure 3. The reason for the particular choice of domains will be apparent in ‘The two-scale flow model’ section when discussing the two-scale flow model.
We can now solve the problem at the local scale using these domains following the procedure summarised in Figure 2. The contact mechanics model can be used to obtain the local-scale distributions of h and p
c
on the local-scale domains
Loading and unloading in the two-scales model
The plastic deformation at both the local and global scales is accounted for in the same way as in the deterministic model (i.e. as described in ‘Loading and unloading’ section). However, since the plastic deformation is considered only point-wise, i.e. by assuming that for each point for which
The two-scale flow model
The two-scale flow model is constructed following the Heterogeneous Multi-scale Method (HMM) approach. In Engquist et al.,
9
a comprehensive review of the method is given and in de Boer et al.,10,11 it is applied to a related fluid flow problem including fluid structure interaction. The construction is based on the fundamental fact that the Reynolds equation is a mass flow continuity equation. Accordingly, in a discrete form, the global scale flow is described by imposing mass balance at each global-scale point

According to Darcy's law, the flow


Now, in order to obtain the permeability, we use the fluid flow model at the corresponding local-scale domain. Therefore, we solve Reynolds equation (7) imposing a unitary pressure drop in the direction in which the permeability is computed and periodic boundaries in the direction perpendicular to it. This requires mirroring the local-scale representation of h. The choice of boundary conditions is not trivial, as it must be consistent with the definition of the global-scale model. For a more detailed discussion of the actual choice, the reader is referred to Pérez-Ràfols et al.
4
Once the Reynolds equation is solved, the permeability,

Those readers more familiar with porous media literature will probably notice that the permeability presented here has units of m3 instead of m2. This is because of the use of Reynolds equation, which simplifies the problem by integrating over the thin dimension. Once permeability is computed for all global-scale points, (13) can be solved for

Note here that we have neglected the leakage in x1-direction caused by a pressure drop in x2-direction. For the specific surfaces studied in this work, this addition to the leakage is known to be small and this is an acceptable approximation.
The two-scale stochastic model
Once the two-scale model has been defined, we can use it to build a two-scale stochastic model that can be used to cover larger domains. Conceptually, the model is the same as the one presented in Pérez-Ràfols et al. 4 In this work, we extend it to be able to asses seal performance during unloading.
In the two-scale model presented previously, the global domain is discretised into cells and the local-scale model is used to compute the permeability for each of those cells. However, as any other roughness related parameter, the permeability exhibits the properties of a random variable, following a given distribution. In principle, this implies that any value of permeability is possible. However, in reality only a certain range of values have a reasonably high probability of occurring and we can make use of this fact when constructing a random permeability map based on data from a limited number of local-scale cells.
We will now describe the procedure followed here to obtain the total flow
In Pérez-Ràfols et al.,
4
the permeability maps were constructed by describing the permeability, k, as a log-normal distributed random variable, with the parameters of the distribution being dependent on
In the rest of this section, we will describe the behaviour of local-scale cells and how we apply this description to the construction of the permeability maps.
Local-scale behaviour and permeability map
Figure 4 depicts loading–unloading cycles computed for four different local-scale cells, selected at random. The results presented in the figure show the variability of the local-scale cells' loading–unloading behaviour. For instance, if we compare the blue (solid) and the purple (dotted) curves, we see a similar response at the initial stage of unloading but that the difference become larger as the unloading proceeds. The yellow (dashed) and orange (dot-dashed) depict a behaviour conceptually different than the blue and the purple, as they both exhibit zero permeability before the loading reaches 900 MPa.
Loading (rightmost part of each curve) and unloading cycles for four local-scale cells selected at random. All cells have been loaded to a maximum nominal pressure of 900 MPa and subsequently unloaded. The absence of line indicates zero permeability.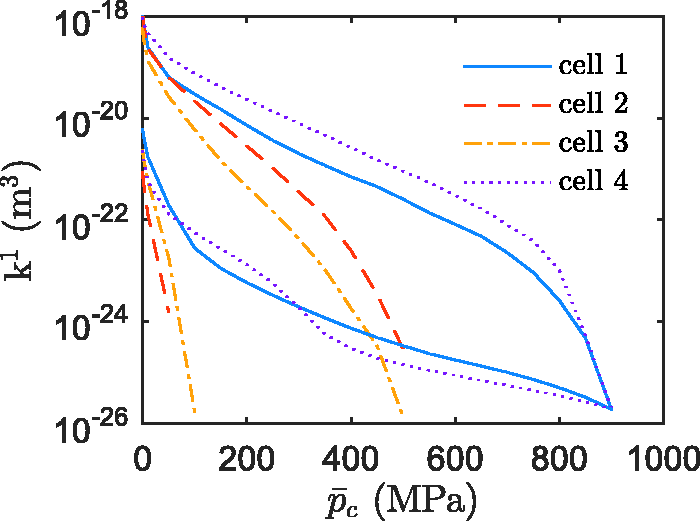
Given the large variability of the local-scale cells' loading–unloading behaviour, it is clear that the permeability for every load in the loading–unloading cycle must be correlated with the permeability associated with all the other loads in the cycle. Otherwise, the resulting realisation would not show a physically representative behaviour.
In order to achieve the desired correlation, one would ideally describe the loading–unloading cycle at a local-scale level by means of a mathematical expression, and include the random variability of the parameters included in that expression. Unfortunately, there is no such expression available for the surfaces considered in this work, and developing one with physical meaning would be a matter of another study. Instead, the authors suggest a methodology related to the derivative of k
i
with respect to Flow chart of the algorithm for the stochastic realisations described in ‘The two-scale stochastic model’ section. The yellow boxes correspond to intermediate outputs.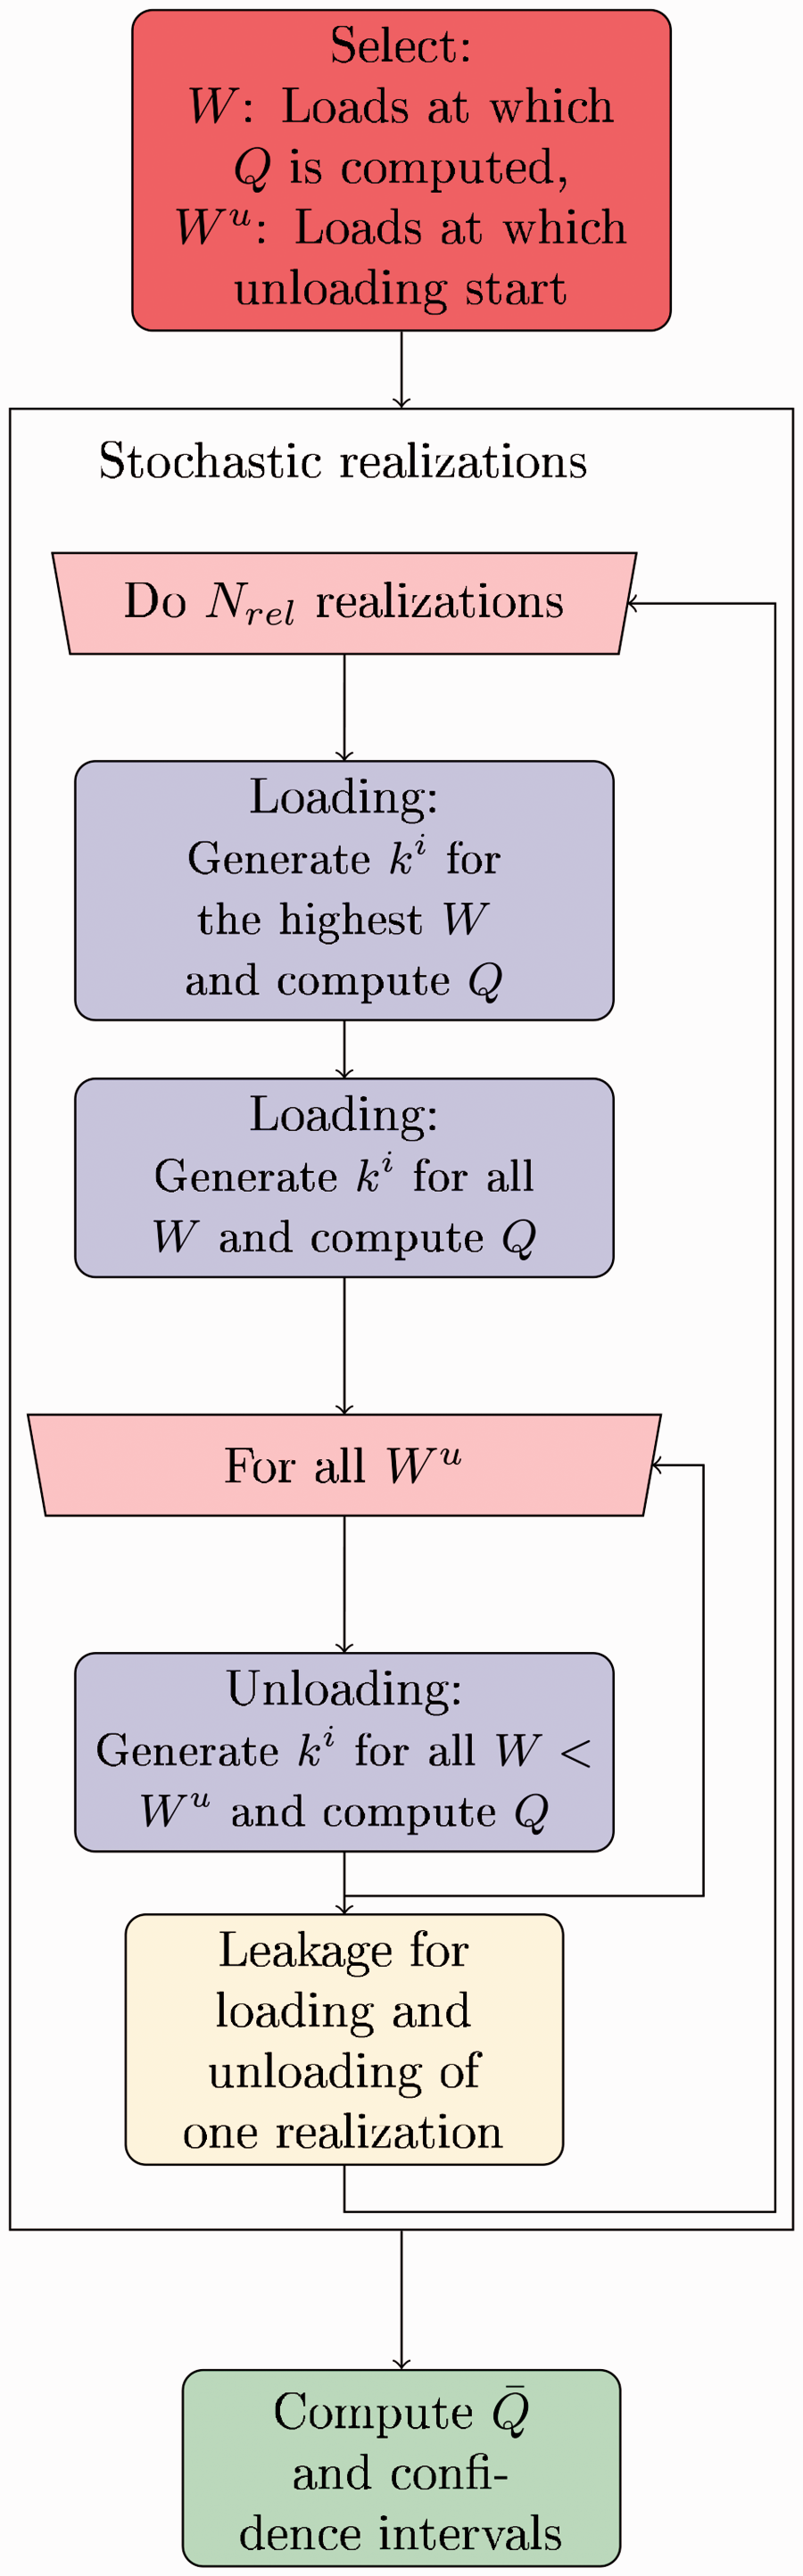
In the following, the process for constructing the permeability maps for the loading part of the cycle will be detailed. The permeability map for the highest load in the loading cycle is randomised from an empirical cumulative density function, obtained from the local-scale results for different values of Permeability in x1-direction as a function of the average separation (left) and nominal contact pressure (right). The orange color corresponds to loading and the blue one to unloading. The solid black line in the left represents the asymptote 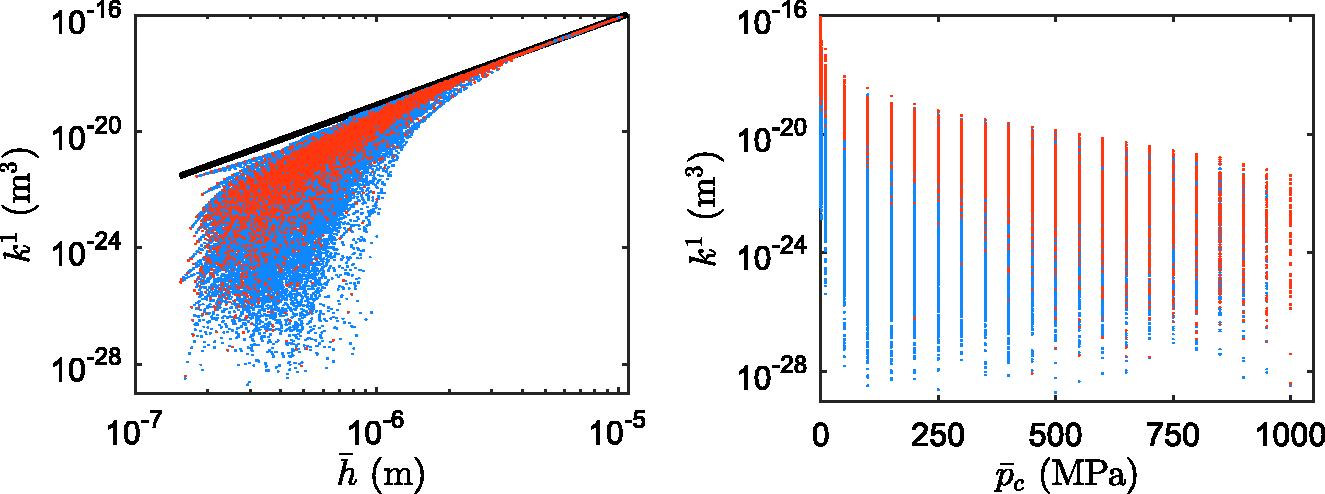
The permeability maps for the unloading part of the cycle are computed following the same procedure. When computing the unloading starting at a load W
u
, we start from the permeability map computed during the loading part at the load
A final comment is made for when the separation is large. In such a case, the permeability approaches the asymptote
Results and discussion
The main goal of this work is to assess whether the beneficial effect associated with the plastic deformation, observed in Pérez-Ràfols et al.,
3
persists also when real-sized seal domains are considered. That is, the zone of more or less constant leakage, from the point when the unloading started, can be maintained during the release of a substantial part of the applied load. To test this hypothesis, we consider two different combinations of surfaces resulting in the two undeformed gaps (h1), depicted in Figure 7. The topography depicted on the left is the gap between a measured turned surface contacting a flat one, and the topography to the right is a computer generated self-affine fractal surface, also contacting a flat one. After measuring the turned surface, a sample consisting of 2000 × 2000 points is selected. It is then low-passed filtered by truncation in the frequency domain. The reason to impose this low-pass filter is to ensure that even the shortest wavelength components are well resolved numerically. More precisely, as in Yastrebov et al.,
8
we truncate frequencies higher than The unreformed gap, h1, used for the evaluation of the two-scale model. On the left, corresponding to a turned surface (measured) against a flat one and, on the right, a self-affine fractal surface (generated) against a flat one.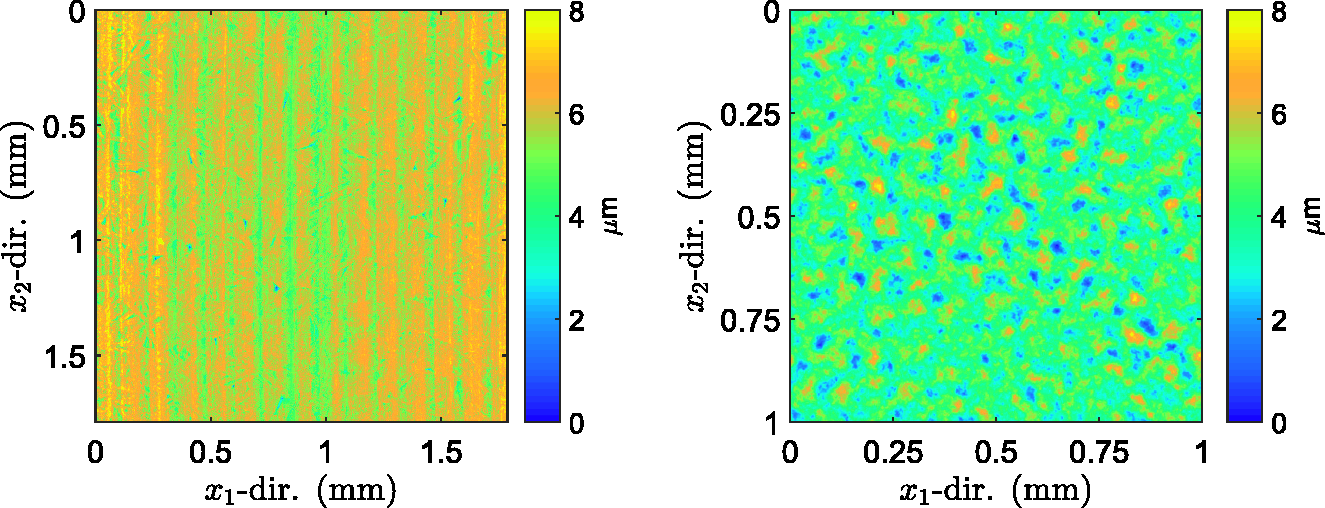
The (periodic) self-affine fractal surface is generated using the algorithm described in Putignano et al.
13
It has a size 1 mm × 1 mm, represented in a grid of size
The material properties used are
In order to assess the influence of the seal size, we construct several domains of size Leakage per unit length in x2-direction. On the left, leakage for different domain of sizes 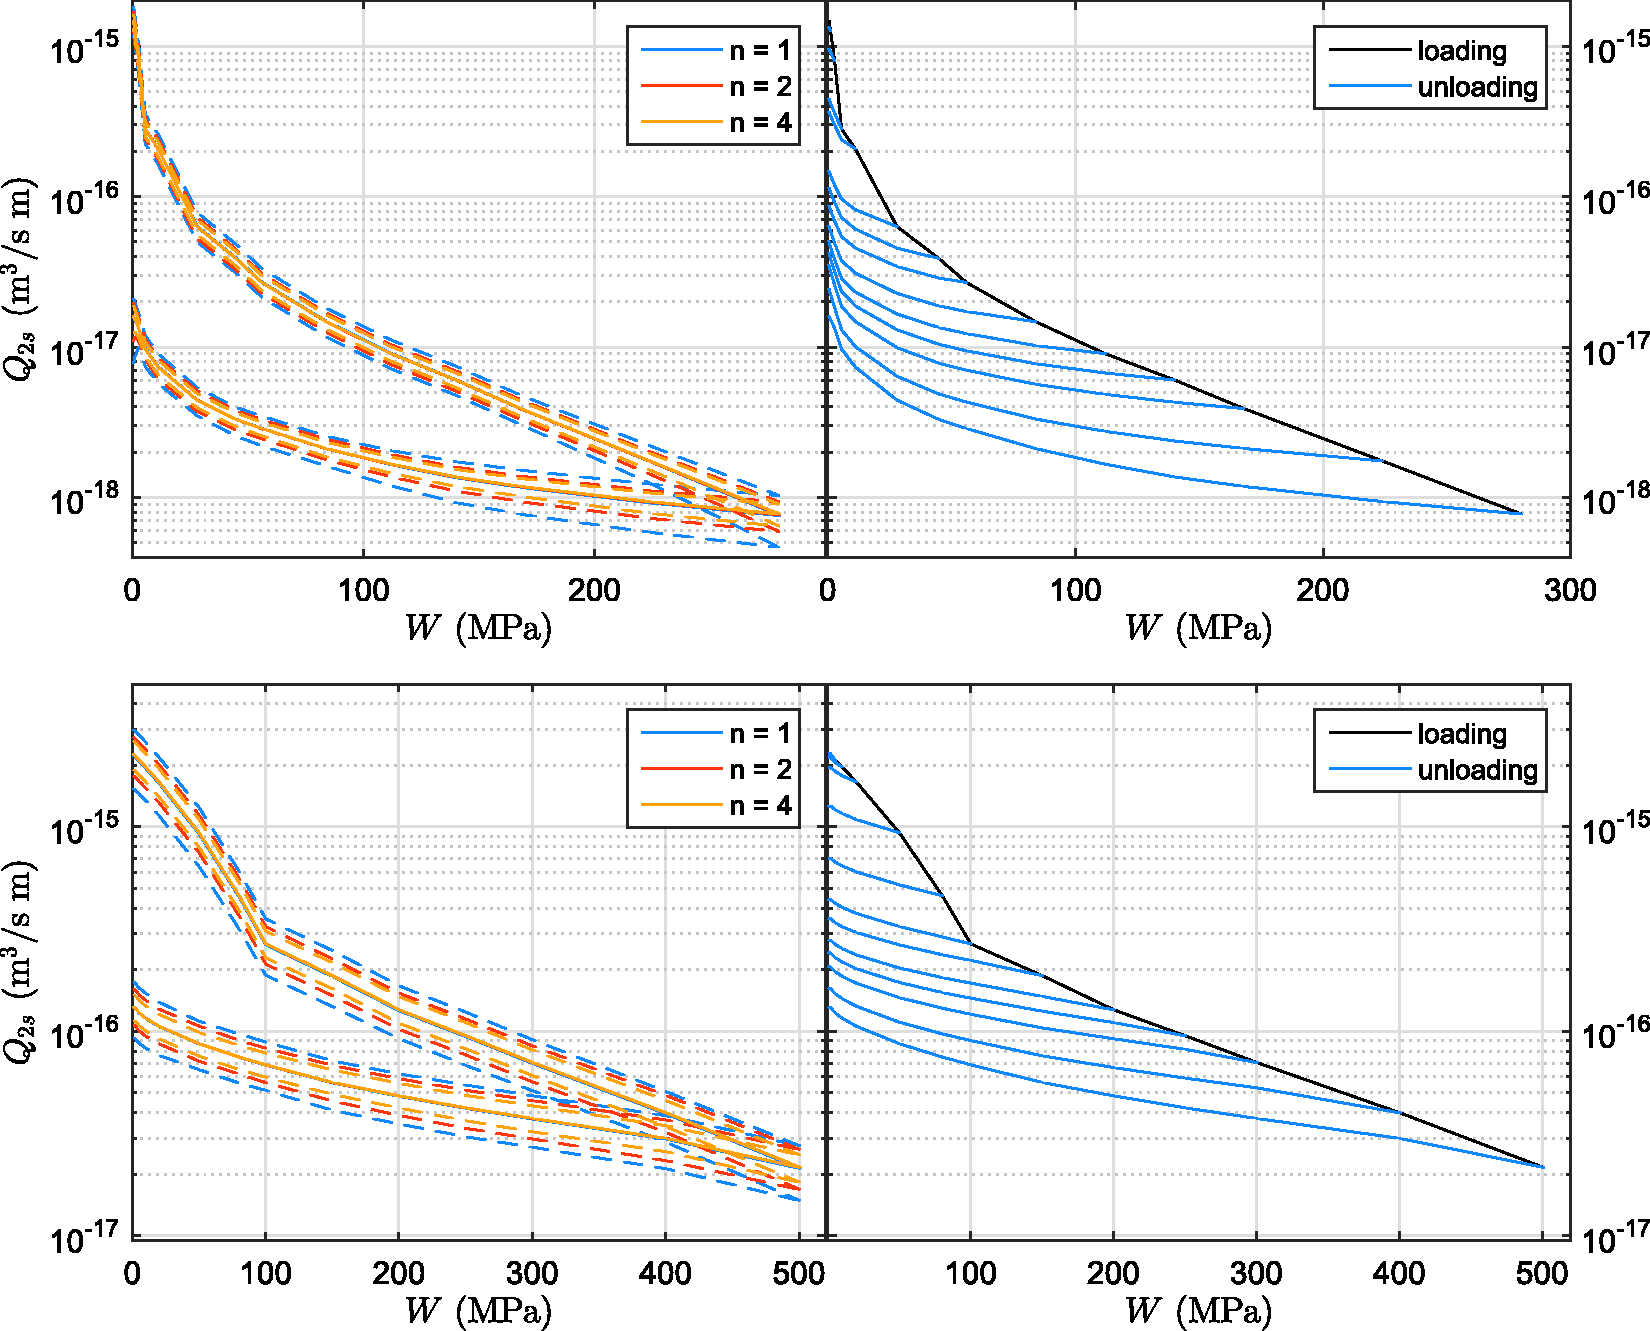
In Figure 8, the loading and several unloading curves are also shown. These results confirm the hypothesis that a zone of more or less constant leakage exists also when real-sized seal domains are considered. In Pérez-Ràfols et al., 3 some of the cases studied presented a much more clear transition at which the rapid leakage increase starts. Despite that the results are consistent with the general trends observed. An explanation for this behaviour can be made using the concept of the critical constriction. That is, at sufficiently small total leakage, the pressure drop occurs over a small number of critical constrictions. Because of this, the leakage at high loads is controlled by local features regardless of the size of the domain.
Concluding remarks
The model presented by Pérez-Ràfols et al. 4 was extended to allow for studying the contact mechanics and leakage of seals during loading and unloading. The present model couples a classical two-scale type of formulation with an explicit consideration to the stochastic nature of the roughness at the local scale. A novelty is a stochastic construction for the permeability, which considers the complete loading–unloading cycle. We have assessed the validity of the model and we conclude that it can provide for trustworthy predictions of leakage during loading and unloading of metal-to-metal seals. Due to its two-scale stochastic nature, it is applicable for studying real-sized seal domains, returning the solution in reasonable times.
The presented model was used to test the hypothesis whether a zone of more or less constant leakage, which starts at the beginning of the unloading and persists during a substantial release of the load, can be observed. The results presented in this work support this hypothesis, which arose while studying the loading–unloading behaviour for small (local) seal domains in Pérez-Ràfols et al. 3
Footnotes
Acknowledgements
The authors are grateful to Shell Global Solutions BV for permission to publish.
Declaration of Conflicting Interests
The author(s) declared no potential conflicts of interest with respect to the research, authorship, and/or publication of this article.
Funding
The author(s) disclosed receipt of the following financial support for the research, authorship, and/or publication of this article: Shell Global Solutions BV and Swedish Research Council (VR).