
Abstract
Background:
Periodontitis is a common chronic inflammatory condition of the supporting tissues of the teeth that destroys the tissues and, if left untreated, results in tooth loss. Accurate and early classification of periodontal bone loss through dental radiographs, such as orthopantomograms (OPGs), is crucial for effective diagnosis and treatment planning.
Objectives:
The present study aimed to evaluate and compare 3 deep learning architectures—InceptionV3, InceptionV4, and ResNet-50—for classifying OPGs into distinct grades of dental features characterised by periodontal bone loss.
Design:
A comparative experimental design was adopted to analyse the performance of multiple convolutional neural network architectures trained on OPG images representing various grades of periodontal conditions.
Methods:
A deep convolutional neural network architecture with varying filter and feature layers was implemented. The training process was conducted using MATLAB on a Dell computer equipped with a GeForce RTX 4060 GPU. Image data augmentation was applied to increase dataset diversity. Several combinations of epochs, learning rates, and optimisation algorithms were tested to enhance performance. Model evaluation metrics included accuracy, precision, recall, and F1-score.
Results:
Among the tested architectures, ResNet-50 achieved superior performance, reaching an accuracy of 96.8% by the 16th epoch when trained using an SGD optimiser with momentum and a learning rate of 0.001. It also demonstrated higher precision, recall, and F1 scores compared to InceptionV3 and InceptionV4, confirming its effectiveness in OPG classification.
Conclusion:
The findings indicate that ResNet-50 provides better classification accuracy and reliability than InceptionV3 and InceptionV4 in detecting periodontal bone loss from OPG images. Expanding the dataset and exploring advanced data augmentation and hyperparameter tuning could further improve model robustness. This study highlights the potential of deep learning-based OPG classification systems to assist dental professionals in faster and more accurate detection of periodontal diseases.
Introduction
Periodontitis is a chronic inflammatory condition affecting the tissues surrounding and supporting the teeth. Also, it is characterised by progressive destruction of gums, periodontal ligament, and alveolar bone, and this causes tooth loss if left untreated. In addition, periodontitis depends on many factors, such as age, geographic location, and socioeconomic status. Moreover, studies show that around 47% of adults over the age of 30 in the United States have some form of periodontal disease, with increasing to over 70% among adults over 65 years old. Finally, the World Health Organization (WHO) estimates that periodontitis affects around 10% to 15% of the adult population, highlighting the significant impact of periodontitis on oral health worldwide. 1
Accurate diagnosis and staging of periodontitis relies heavily on radiographic assessment of periodontal bone loss, yet current manual interpretation methods face significant limitations including inconsistency between practitioners and time-consuming analysis. 2 The measurement of radiographic bone loss is essential for correct periodontal diagnosis, particularly when comprehensive periodontal mapping is unavailable, but doctors can interpret radiographs differently depending on their experience and knowledge. 3 Recent advances in deep learning, particularly U-Net architectures, have demonstrated remarkable potential in automating periodontal bone loss classification with accuracy rates exceeding 94%. 4 These automated diagnostic systems not only enhance clinical efficiency but also provide more consistent and objective assessments compared to traditional manual methods. 5 The integration of artificial intelligence in periodontal diagnosis represents a promising solution to address the growing clinical burden of this widespread condition.
In World Health Organization 1 discussed using radiographs in diagnosing periodontal disease, explicitly comparing intraoral and panoramic radiographs. It aimed to determine how the choice of X-ray technique affects the diagnosis of bone loss in a patient with severe chronic periodontitis. In addition, they examined 110 subjects and analysed both panoramic and intraoral films using computer-assisted measurements to assess bone loss relative to the alveolar crest and bottom of bony defects. The results revealed differences in measurements between intraoral and panoramic X-rays in 47.01% to 81.89% of subjects. In addition, results show an accuracy of panoramic radiographs in estimating linear distances in patients with severe chronic periodontitis or aggressive periodontitis compared to more precise periapical radiographs. Finally, for approximately 20% to 50% of teeth, a noteworthy difference in linear distances surpasses 10% of total root length. The researcher 6 utilised 2 models of machine learning, which are Support Vector Machine (SVM) and Random Forest (RF) algorithms, to determine if a person has periodontitis or not. In addition, the research aims to develop a diagnostic tool for periodontitis using SVM and RF machine learning algorithms. Finally, the results show that RF has the best classifier, even with a small and unstable dataset. Moreover, evaluation metrics for the RF classifier include an accuracy of 0.83, recall of 0.92, specificity of 0.67, and negativity of 0.75, with an overall value of 0.83.
This study 7 conducted a comprehensive literature review by searching 5 databases and using specific keywords to identify articles. Also, PRISMA guidelines were employed to filter eligible studies, focussing on study design, sample size, AI software used, and study results. In addition, the CASP diagnostic study checklist assessed the strength of the evidence in these studies. Moreover, 4 demonstrated strong evidence scores, while 3 had intermediate scores out of 7 eligible articles. Finally, results indicate that AI’s highest reported performance metrics in diagnosing periodontal bone loss was an area under the curve of 94%, an F1 score of 91%, and specificity and sensitivity rates of 98.1% and 94%, respectively.
In Patil et al. 8 the review application of artificial intelligence (AI) models in diagnosing periodontal disease by detecting radiographic bone loss (RBL) was used, and 19 relevant studies out of 322 articles were used. The result shows that AI models for panoramic radiographs demonstrated accuracy ranging from 63% to 94%. Also, periapical radiograph-based AI models exhibited varying precision, with accuracy as high as 99% in radiographic bone-level staging. In addition, CBCT-based AI models showed a sensitivity range of 45% to 72% for detecting periodontal bone loss and a specificity range of 81% to 83%. Finally, AI systems show promise as a valuable initial screening tool for identifying periodontal disease through radiographic analysis, potentially offering more accurate evaluations than human examiners alone. However, further development is needed to enhance the accuracy and reliability of AI models for diagnosing periodontal disease based on RBL, particularly when assessing risk independently of clinician assessment.
The study 9 involves the following key aspects: A total of 1432 images were tagged by an expert to determine the presence of periodontal or non-periodontal bone loss. In addition, 3 deep learning architectures (AlexNet, SqueezeNet, and EfficientNetB5) were used to extract and classify image features. Also, 10 different classifiers were employed to categorise the images and design a user-friendly Graphical User Interface (GUI) application to assist dental experts. Finally, results show the best-performing classifiers were Linear SVM for AlexNet-based features, Medium Gaussian SVM for SqueezeNet-based features, and EfficientNetB5 for direct-CNN features. Moreover, Linear SVM classifier achieved accuracy 81.49%, error rate 18.51%, sensitivity 84.57%, specificity 79.14%, precision 75.68%, and F1 79.88%. In conclusion, the effectiveness of AI-based systems in diagnosing periodontal bone loss offers potential benefits such as reducing experts’ workload, saving time, and enabling early diagnosis of dental disorders.
The researchers 10 utilise a novel deep-learning ensemble model based on predicting various dental parameters using periapical and bitewing radiographs. In addition, the dataset consisted of 270 patients and 8000 radiograph images with 27 964 teeth. Moreover, the ensemble model employed AI algorithms like YOLOv5, VGG-16, and U-Net deep learning models, achieving impressive accuracy rates. Also, the results show that the DL ensemble model demonstrated high accuracy, with approximately 90% accuracy for periapical radiographs and tooth detection accuracy of 88.8%. Finally, the AI models outperformed dentists, whose detection accuracy ranged from 76% to 78%.
This research 11 is centred on using radiographs, favoured for their ability to evaluate the complete dentition with just a single radiation exposure. Also, more than 4000 de-identified radiographs were gathered using a Proline XC machine, following established research ethics guidelines. Moreover, these images were also utilised to train R-CNN to identify teeth with periodontal issues in radiograph images. The study revealed remarkable consistency and replicability among examiners, with both inter- and intra-examiner correlation coefficient values reaching 94%. Additionally, the Area Under the Curve reached 91% for all teeth.
In Ryu et al. 12 image reprocessing is implemented to compute the depth and periodontitis detection. In addition, radiologists manually segment more than 300 images into standard and up-normal cases, validating a classification algorithm with the same dataset. Also, preprocessing using different types of filters, such as median filter and histogram equalisation, improved image clarity, followed by segmentation into teeth and the mandibular region of interest area using the 2-dimensional Otsu thresholding method. Finally, results indicate an accuracy of 91.34%, a sensitivity of 92.8%, and an F of 95.47% in classifying radiography images. The objective in Vigil and Bharathi 13 was to assess the accuracy of detecting radiographic bone loss (RBL) classification using machine learning. Also, the goal is to reduce the time and labour required to diagnose and plan treatment for periodontitis. Initially, 236 patients with full-mouth radiographs were taken by radiography images and evaluated by 3 calibrated periodontists to categorise RBL and classify the pictures of each stage. After that, image reprocessing and augmentation techniques were employed to ensure data balance without pollution, followed by applying the Deep Convolutional Neural Network model InceptionV3. The results show the model achieved an accuracy of 0.87 with an error of ±0.01.
In this study 14 640 radiography images were analysed with the assistance of 3 experienced periodontal physicians who made a necessary point for calculating the degree of bone loss and identifying the location and shape of the loss. Also, 2 deep learning models combined UNet and YOLO-v4 and were introduced to locate teeth accurately. In addition, this allowed for precise calculation of percentage for periodontal bone loss and classifying the stages. The results show that the model’s capability to recognise these features was assessed and compared to that of general dental practitioners. Moreover, the model exhibited an overall classification accuracy of 0.77, with varying performance across tooth locations and stages. Finally, the model’s classification accuracy surpassed that of general practitioners, indicating the feasibility of establishing a deep learning model for assessing and staging radiographic periodontal alveolar bone loss using a two-stage architecture based on UNet and YOLO-v4.
The researcher in Kim et al. 15 used the deep learning model DeNTNet to detect periodontal bone loss in panoramic dental radiographs. Also, DeNTNet not only identifies lesions but also provides corresponding tooth numbers using dental federation notation. In addition, DeNTNet employs Deep Convolutional Neural Networks (CNNs) with transfer learning and clinical prior knowledge. Moreover, the model was trained, validated, and tested on a dataset of 12 179 panoramic dental radiographs annotated by experienced dental clinicians, using subsets of 11 189, 190, and 800 radiographs, respectively. Comparative studies were conducted to validate each phase of the proposed method. The results indicate that when compared to dental clinicians, DeNTNet achieved an impressive F1 score of 0.75 on the test set, outperforming the average performance of dental clinicians, which stood at 0.69.
In Kurt-Bayrakdar et al. 16 a deep learning algorithm was developed to interpret panoramic radiographs and evaluate its performance in detecting periodontal bone losses. In Addition, they used 1121 panoramic radiographs, bone losses in the maxilla and mandibula, interdental bone losses and furcation defects were labelled through segmentation. Moreover, the Convolutional Neural Network (CNN) was constructed using U-Net architecture and was assessed using a confusion matrix and ROC curve analysis. The results revealed the highest diagnostic performance in detecting total alveolar bone losses (AUC = 0.951) and the lowest for vertical bone losses (AUC = 0.733). Sensitivity, precision, F1 score, accuracy, and AUC varied across different types of bone losses.
Limitations
In addition, the studies are primarily based on relatively small or heterogeneous datasets6,9,12 which may affect the potential generalisability and robustness of resulting AI models. Such datasets, if limited, may cause overfitting and bias in the quality and effectiveness of the developed models and require a further validation process on much more extensive and diverse data samples to prove their actual utility in real-life settings. There are also issues with standardising the imaging process and data annotation 16 which makes the produced models low-comparable and low-consistent when used across other studies. Image quality, resolution, and pre-processing type and quality may also affect the AI models used in future clinical practice and limit their scalability. There is also a lack of comparison with real expert human clinicians. In conclusion, the use and applicability of AI models in periodontology diagnosis and disease management, in general, has been proven promising and effective.
Contribution
The main feature of our contribution is that high diagnostic accuracy was made possible by strong deep learning models, inception v3, Inception v4, and ResNet-50, which have been trained on large and heterogeneous databases. While previous studies often struggled with small or heterogeneous datasets, we prioritised working with extensive sets of models that could capture a wide range of patient demographics, disease severity, and imaging types. This enabled the machine learning algorithms we utilised to see a wide range of examples and learn in a way that maximised their ability to generalise across diverse populations. The novelty of this work lies in evaluating the performance of the DCNN InceptionV3, InceptionV4, and ResNet-50 deep learning models for classifying orthopantomograms (OPGs) into grades of periodontal bone loss with high precision. This research offers a potential diagnostic aid for dental professionals by automating the classification of OPG images, enabling faster and more accurate detection of periodontal conditions, thus improving treatment efficiency and addressing a critical aspect of oral health.
Materials and Methods
This section thoroughly explains the overall structure of suggested approaches for Periodontitis using deep convolutional neural networks with OPG images.
Inception v3
Inception v3 is a convolutional neural network (CNN) architecture designed by Google, primarily known for its efficiency and accuracy in image classification. It introduced several innovations, such as the inception module, which employs multiple filter sizes such as 3 × 3, 1 × 3, 5 × 5, 1 × 5, 1 × 7, and 7 × 7 within the same layer to capture features at different scales. It increased the number of layers in length and width, as shown in Figure 1. 17

Inception v3.
Inception v4
Inception v4, an evolution of Inception v3, further refined design by introducing new architectural features to enhance performance. It incorporates advanced techniques such as factorised convolutions and aggressive regularisation to improve training efficiency and generalisation capabilities. It increased the number of inception A to 4 groups, inception B to 7 groups, and inception C to 3 groups with Stem in the beginning, as shown in Figure 2. 18
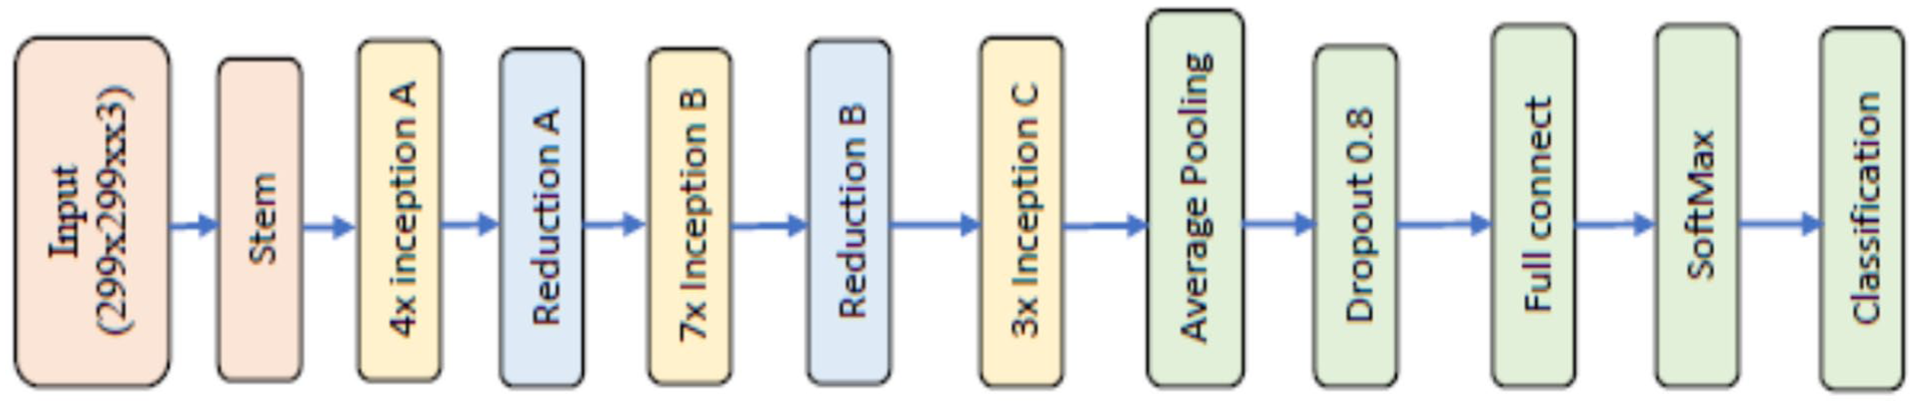
Inception v4.
ResNet 50
ResNet-50, short for Residual Network with 50 layers, is a family of Deep Convolutional Neural Networks (DCNN) that revolutionised the field of image classification. Microsoft Research developed it; ResNet introduced the concept of residual learning, which enables the training of intense networks by mitigating the vanishing gradient problems. This architecture’s skip connections allow for the direct flow of information through the network and enable the training of much deeper models with improved accuracy compared to earlier designs see Figure 3. 19

ResNet 50.
Mathematical Equation
This new way of classifying periodontitis is based on a system that looks at different aspects of the disease. First, it looks at how severe and widespread damage is in a patient’s mouth caused by periodontitis. Then, it considers different factors that could make treating the condition more complex in the long term. Additionally, it examines how quickly the disease is getting worse, how well it responds to standard treatment and how it might affect a person’s overall health. According to these factors, periodontitis is divided into 3 grades (A, B, C), as shown in Table 1. 5 All radiographic measurements of periodontal bone loss (D1–D3) were performed using calibrated ImageJ software, and the distances were taken along the anatomical long axis of each tooth, following the standard periodontal radiographic protocol. Each measurement was verified by an experienced periodontist to ensure alignment accuracy. This approach is consistent with validated methods used in previous studies employing panoramic radiographs (OPGs) for bone-loss assessment.11,12,15,16 These works confirmed that linear measurements along the tooth axis on OPGs provide reliable estimation of alveolar bone height and have been successfully adopted in deep-learning-based analyses.
Periodontitis Staging. 5

Database
The database used in this study consists of OPG images of 250 people, and images were classified into grade A, grade B, and grade C. In addition, an X-ray OPG device was used, characterised by its high resolution, reaching 1024 × 768 pixels. In addition, radiation is Less than 250 micro-Gy/hour (84 kV) at 1 m in any direction. 20 The database is distinguished by its quality, and a protocol was developed to capture it. To train a deep convolutional neural network, it needs approximately 1000 images, so we increased the number of pictures in each category to 700, for a total of 2100 images. Images were augmented from the original images by a process such as vertical flip, horizontal flip, right side flip, left side flip, 45° right turn, and 45° left turn. 21 To complete the database and classify the images into grades A, B, and C, we followed the mathematical equation for each tooth (further discussion in the Mathematical Equations section). Moreover, OPGs have more specifications and high accuracy. The dataset consisted of 250 anonymised panoramic radiographs (OPGs) of patients aged 22 to 63 years (127 males and 123 females) covering all 3 grades of periodontitis (A, B, and C). The images were obtained under standardised exposure conditions and anonymised before analysis. Ground truth labelling followed the 2018 AAP/EFP classification, where the ratio of bone loss to root length, adjusted for patient age, defined Grades A, B, and C. Labelling was performed independently by 3 expert periodontists (Cohen’s κ = 0.91), and disagreements were resolved by consensus. Ethical approval was obtained from the Research and Ethics Committee, Faculty of Dentistry, SEGi University (Approval ID: SREAF/Rev 1/ 24 March 2022).
Preprocessing
Pre-processing is crucial in preparing OPGs for analysis using deep convolutional neural networks (DCNN) in periodontal bone loss detection. This step involves automatically removing unwanted areas from images. Additionally, it is necessary to appropriately resize OPGs before inputting them into different DCNN models.
Feature Extraction
Feature extraction in deep learning involves automatically extracting features from images, but the quantity of features depends on the type of deep learning model utilised. For example, Inception V3 can extract a certain number of features; Inception V4 can extract a different number. A standard feature set called ‘package features’ is available in MATLAB for all models and comprises a specific number of features. Furthermore, extracting more features will increase accuracy detection, although effectiveness relies on the quality and diversity of the dataset used for training.
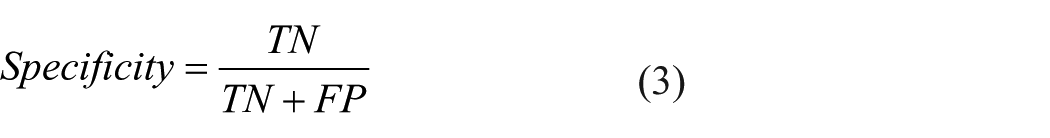
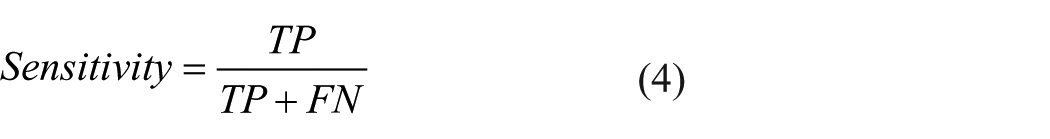
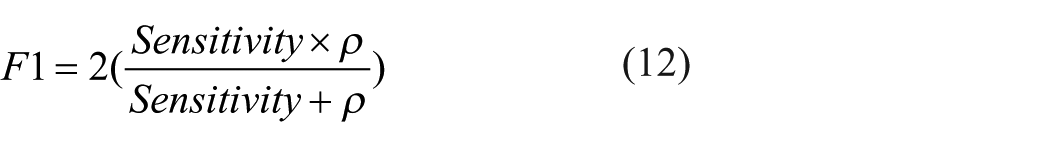
Evaluation Parameter
There are 12 parameters to evaluate proposed methods: accuracy, sensitivity, specificity, positive predictive value, negative predictive value, false-positive rate, false-negative rate, likelihood ratio positive, likelihood ratio negative, an area under the curve, Equal Error rate, and F1 score. 22 There is an equation for each of these parameters as follows:


Results and Discussion
The architecture of the deep convolutional neural network Inception V4 comprises 7 stages: Steam, 4 inception A, Reduction A, 7 inception B, Reduction B, 3 inception C, and Classification, each containing a group of convolutional layers and filters as depicted in Figure 3. In the Stem stage, weights are initialised to zero to expedite the training process using freezeWeights in MATLAB version 2023. The DCNN Inception V3 model comprises 3 inception A, reduction A, 4 inception B, Reduction B, 2 inception C layers, and a classification layer, all featuring 3 × 3 size filters with varying numbers such as 32, 64, 96, 192, 256, and 384. ReLu activation and batch normalisation layers are also connected after each convolutional layer. The Inception V3 deep convolutional neural network is available in the MATLAB Toolbox. Both Inception V3 and Inception V4 models require images of size 299 × 299 pixels, which were automatically adjusted for variations in size within the database. Augmentation operations were performed on training images, including random flipping along the vertical axis, random translation up to 30 pixels, and scaling up to 10% horizontally and vertically to increase the training data and prevent overfitting.
In our experiments, a Dell computer with 16 GB RAM, Core i7 processor, 1TB SSD, and an added graphic card model Asus GeForce RTX 4060 with 8 GB memory were used in conjunction with MATLAB. OPG images were utilised, along with 700 Grade A, 700 Grade B and 700 Grade C teeth, with an image resolution of 1024 × 768 pixels. Four experiments were conducted to assess the performance of Inception V3 and Inception V4 models, utilising OPGs with varying epochs, learning rates, and optimisation methods. We used 10-fold cross-validation to train our models for reliable performance estimation. This approach ensures the model is evaluated across multiple data splits, reducing overfitting.
Our method is based on a comparative analysis of 3 deep learning models, InceptionV3, InceptionV4, and ResNet-50, concerning their capacity to classify OPG images into different grades depending on the features shown in Figure 4. We will test these models using different learning rates and optimisation methods to determine the most accurate models in classifying the images. By varying learning rates and optimisation techniques, the models will perform optimally where optimisation involves techniques such as SGDC or Adam. Performance evaluation measures, including accuracy, precision, recall, and F1 score, will be used to objectively compare the MAS performance in determining the grades shown in the OPG images. In conclusion, we aim to establish the most optimal deep learning model between InceptionV3, InceptionV4, and ResNet-50 for classifying OPG images according to the grades shown. This will help ensure dental experts have a tool they can rely on for accurate grading in clinical practice.

Flowchart of PBL detection process.
Table 2 shows how the 3 ways to improve the computer models work. The results come from Stochastic Gradient Descent with Momentum, ADAM (Adaptive Moment Estimation), and RMSPROP methods. Any digit in the table indicates how accurate the model got at different times in the given way. From the results, SGDM improves in better ways but at lower learning rate intervals. The SGDM 0.001 has the best results with increased improvement until the model is 96.28% good at 20 epoch. However, the learning rates can be as low as 0.0001, whereby the model takes the longest time, but the results are also worth between 86.29% and 95.47%. On the other hand, the ADAM method gives almost a good result in all learning abilities. The 0.001 improves the model until it peaks at 94.31% at 20 epoch. That means that the results of training a complex model depend on the ability of the optimiser to handle different learning rate values. The RMSPROP, on the other hand, gives different results, getting higher results at higher learning rate intervals. For example, the 0.001 RMSPROP results in between 63.39% and 87.97%, indicating that it is less capable than SGDM and Adam. In conclusion, the SGDM 0.001 performs better at 96.28%, while the Adam 0.001 has the best at 94.31%. In contrast, the RMSPROP has the least good result at the same learning ability, 87.97%, indicating that its ability is insufficient to run the optimiser. However, these results show how choosing the right optimiser and learning rate results is essential to give the deep learning models the best result.
Detection Accuracy of Inception v3 by Using Different Optimisation Methods and Learning Rate.
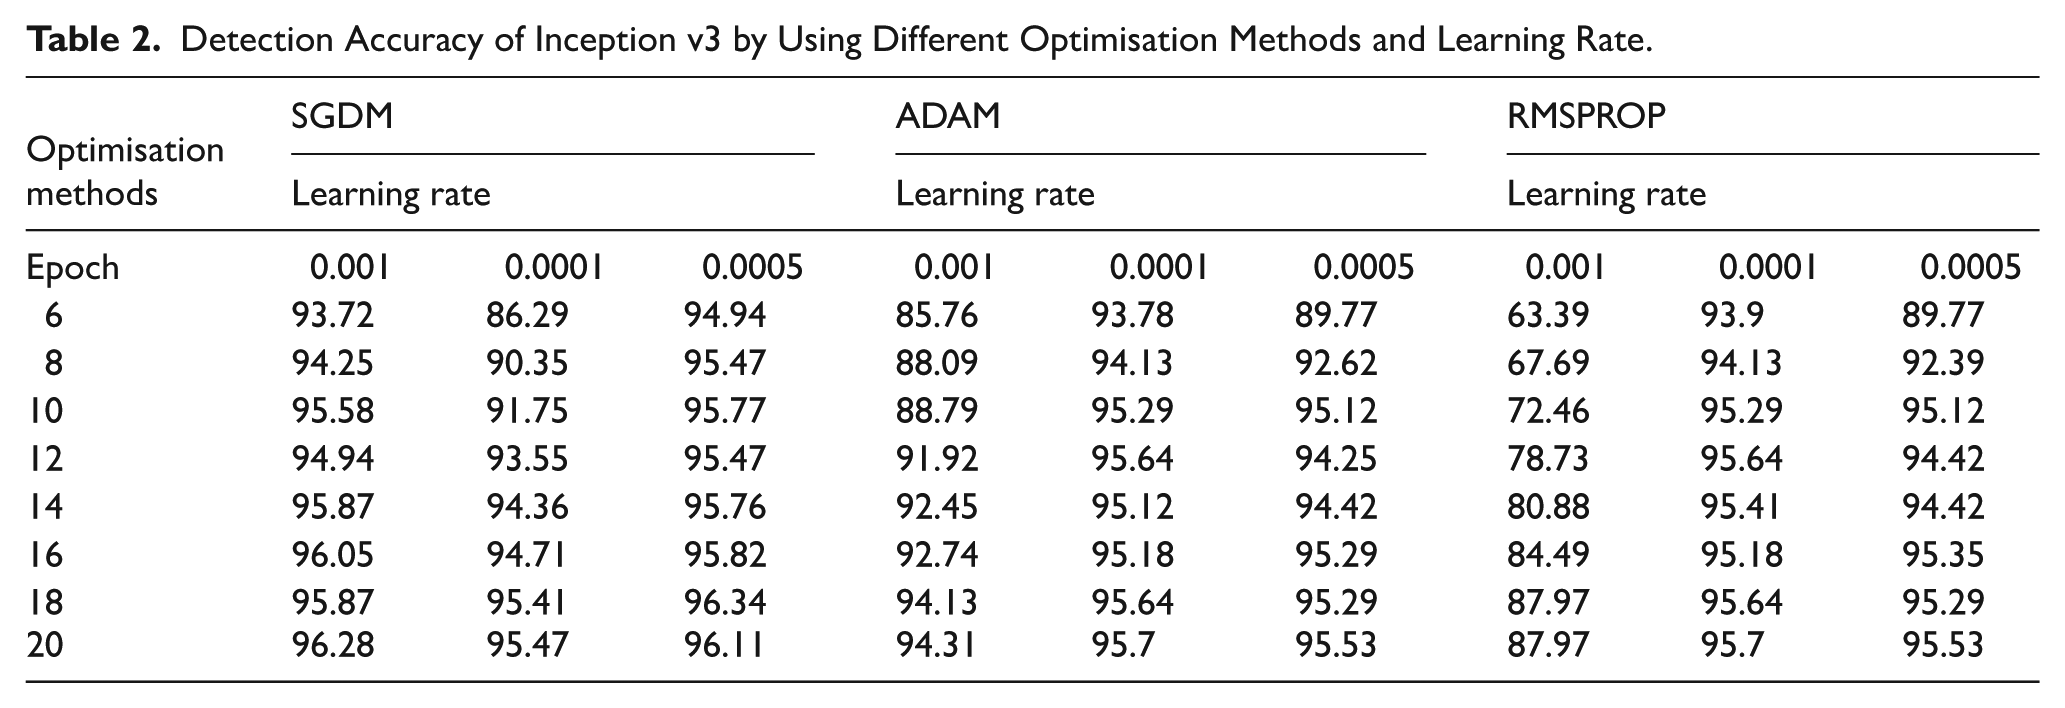
Table 3 shows that the performance of SGDM presents distinctive patterns at different learning rates. For the learning rate of 0.001, SGDM demonstrates accuracies from 77.45% to 95.12% across epochs 6 to 20. The performance of SGDM can improve cyclically and reach a high level of accuracy through a steady state. Concerning other learning rates of 0.0005 and 0.0001, SGDM demonstrates less steep convergence, but the accuracies of SGDM remain at 85.36% to 94.65% by epoch 20. ADAM is characterised by competitive performance at all learning rates. Specifically, 0.001 ADAM demonstrates an accuracy of 85.36% to 94.65% by epoch 20, which improves steadily during learning through all epochs. Regardless of the learning rate, ADAM can maintain comparable accuracies by epoch and achieve improved accuracy for every cycle. The learning rate RMSPROP demonstrates a pattern of different performance definitions: overall, RMSPROP presents relatively low accuracies and convergence. For all 3 learning rates, Accuracy of RMSPROP from 34.4% to 65.64% by epoch 20 is high. Optimisation convergence with SGDM and ADAM is decreased. However, the rest of the compatible SGDM and ADAM with several learning rates may predict that one can obtain similar results with other learning rates. Ultimately, both SGDM and ADAM outperform RMSPROP in all epochs in terms of accuracy. SGDM, with a learning rate of 0.001, achieves the highest level of accuracy of 95.12% by its end, while ADAM maintains comparable performance at all learning rates.
Detection Accuracy of Inception v4 by Using Different Optimisation Methods and Learning Rate.

Upon analysing the results for SGDM, it is evident that SGDM attains high accuracies throughout epochs, with superb performance recorded for a learning rate equal to 0.001, as shown in Table 4. For instance, by epoch 20, SGDM, with a learning rate of 0.001, records an accuracy of 96.8%, indicating excellent optimal abilities for the ResNet-50 model. Learning rates of 0.001 and below also achieved competitive accuracies of between 93.55% and 96.28% during the epochs. For ADAM, consistent tendencies are noted in all learning rates, indicating the ability to enhance model accuracy over epochs consistently. For example, at a learning rate of 0.01, it records an accuracy between 92.39% and 96.4% throughout epoch 20, indicating the optimal ability to optimise the ResNet-50 model. RMSPROP, on the other hand, exhibits inconsistent performance and records low accuracies relative to SGDM and ADAM. At a 0.001 learning rate, RMSPROP records low levels of accuracy between 35% and 58.28% by epoch 20, indicating difficulty optimising ResNet-50 dynamics. In summary, the comparison demonstrates that the optimisation method and learning rates are critical factors in the optimal training of a ResNet-50 model. Among the 3, SGDM and ADAM proved remarkably optimal, with SGDM optimal at higher learning rates and ADAM capable of optimal results within a broader range of learning rates. RMSPROP performance has demonstrated the need for model-specific tuning and may require specialised expertise to optimise deep learning models such as ResNet-50.
Detection Accuracy of ResNet-50 by Using Different Optimisation Methods and Learning Rate.

Figure 5 above describes the performance comparison between 3 well-known deep learning architectures, Inception V3, Inception V4, and ResNet-50, trained using the Stochastic Gradient Descent with Momentum method with a learning rate 0.001 for various epochs. Cell values denote the accuracy level achieved by the respective model at that epoch. The performance comparison indicates that each of the 3 architectures exhibits a different performance trend when trained using SGD with the same learning rate. This architecture performs well, with accuracy levels varying from 93.72% to 96.28% across epochs 6 to 20. Inception V3 achieves a maximum accuracy of 96.28% by epoch 20, thus indicating that it is highly effective with the SGDM optimiser. Similarly, Inception V4 shows increasing accuracy, varying between 77.45% and 95.12% throughout the epochs. While the starting accuracy of Inception V4 under the SGDM optimiser is lower than that of Inception V3, it reaches 95.12% by epoch 20, which is higher than V3. ResNet-50 consistently outperforms models V3 and V4, with accuracies ranging from 95.47% to 96.8% across epochs. It reaches a maximum accuracy of 96.8% by epoch 8 and maintains it until the final epoch, demonstrating its effectiveness across all tested architectures and high performance with a learning rate 0.001. In summary, the above comparative analysis shows that architecture and optimisation methods are significant factors that significantly impact performance. While V3 and V4 perform well, ResNet-50 consistently outperforms them on the accuracy metric across all epochs. Thus, ResNet-50 is a superior performing model using the SGD optimiser at a learning rate 0.001 on this dataset.

Accuracy comparison between deep learning models.
Table 5 compares 3 deep learning models, Inception v3, Inception v4, and ResNet-50, using different performance evaluation metrics during a classification. The above metrics can be used to assess how the models perform in identifying the cases when they are truly positive or negative. They also offer insights into the trade-offs between the 4 types of errors. Analysis of TP and FN rates can show how accurate the models are at identifying positive cases. While Inception v4 has a higher TP rate of 0.65, its FN rate is 0.06, significantly lower than Inception v3 and ResNet-50, which record 0.041 and 0.04. Concerning FP rates, Inception v3 and 50 have ratios of 0.01 and 0.002, while Inception v4 has 0.0042. This suggests that Inception v4 is more specific and avoids false alarms than Inception v3 and ResNet-50. Precision indicators show the accuracy of the models in predicting when the cases are positive. ResNet-50 has the highest precision of 0.99794, with Inception v4 having 0.995604 and Inception v3 with 0.989772. The negative predictive value is uniform across the 3 models. AUC scores show that ResNet-50s classification is superior since 0.976752 is higher than Inception v3 and v4 values of 0.963548 and 0.963432, respectively. The 3 models have unique strong and weak points based on the metrics. ResNet-50 excels in precision and AUC values, suggesting it is highly accurate in optimistic prediction and effective classification. Inception v4 had a high TP rate and a low FP rate; thus, it shows a balancing of the true positive and false positive AUC, while Inception v3 is consistent across most of the parameters, though its precision value is relatively low.
Performance Evaluation Metrics During a Classification for Different Deep Learning Models.
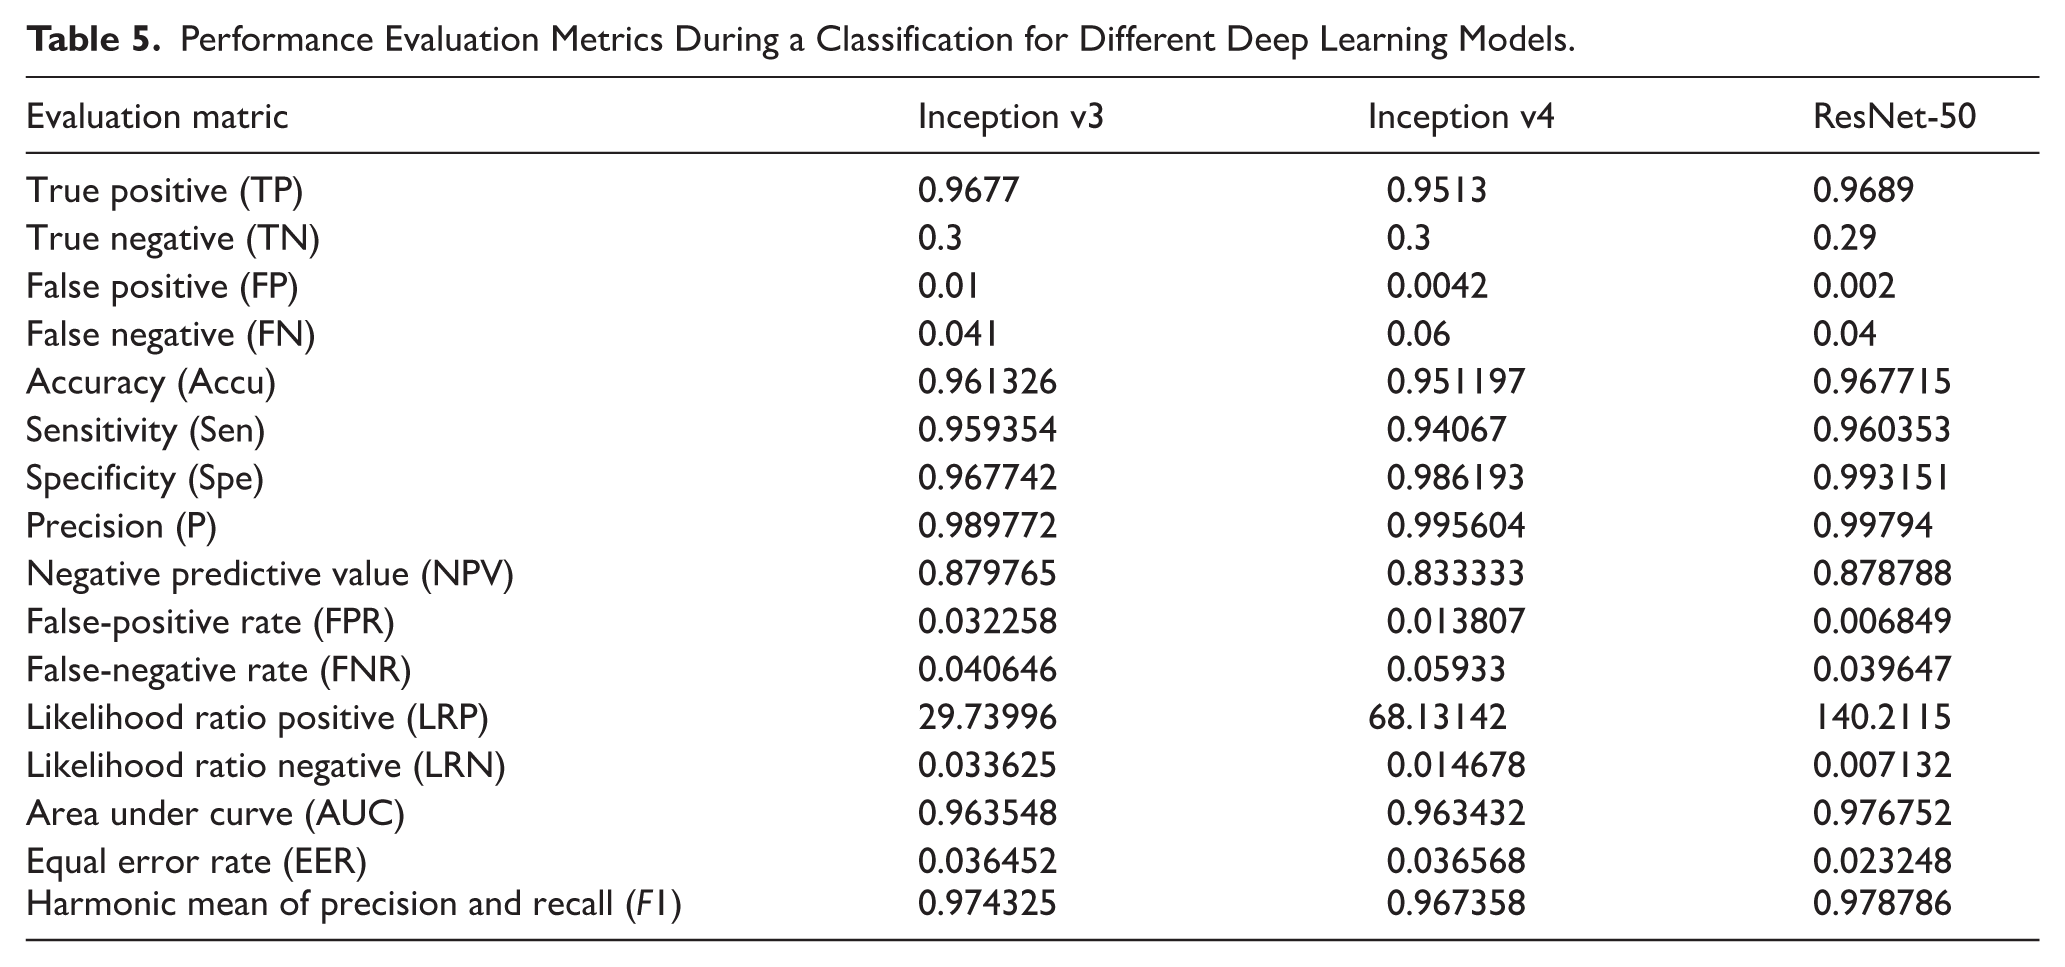
Figure 6 shows the OPGS. After training, the deep learning model is completed. The figure also gives the validation results with a highly accurate 99.8% percentage in cases. High validation accuracy in this stage indicates that the system is robust in identifying objects or proposals. However, the performance can be low in some cases, for example, the validation accuracy is 51.1%. The percentage indicates that more effort is needed for the system or that its performance varies depending on the scenario. Stage A also gives the validation results, but the accuracy obtained from this level is low. This accuracy can imply that the system was validating a different subset or different type of object. The OPGS is more spartan, consisting only of 2 simple stages. Figure 7 shows the OPGS in action during the classification phase; the classification accuracy obtained at stage B is 91.577%. This figure shows how the trained deep learning model is accurate and reliable in classifying the generated object proposals. The figure depicts that some objects or scenes are being classified in this stage; the accuracy is very high, indicating that the model can make correct decisions based on learned patterns and features. The achieved classification accuracy of 91.577% shows that the system can be deployed in real-world visual data where it can assess and predict accurately.

OPGS validated after training deep learning model.

OPGS classified.
To calculate the site of most significant loss and understand the terminology of ‘radiographic bone loss measured in percentage of root length’, there are several steps. First, an FMS is conducted to identify the site of most bone loss related to periodontitis rather than due to other reasons such as trauma or extraction. Next, imaging software, such as ImageJ, was used to measure the distance from D1 to the apex of the root in site D3, as shown in Figure 8. The current bone height from D2 to D3 at that site should then be measured to establish bone level loss, as shown in Figure 9. Each annotated point used in the bone-loss measurement process was semantically defined rather than numerically indexed. Specifically, D1 represented the cemento-enamel junction (CEJ) to the alveolar crest (bone height), D2 represented the CEJ to the root apex (total root length), and D3 indicated the site of maximum bone loss used for grade computation. These landmarks were consistently labelled using the calibrated coordinate system in ImageJ and validated by 3 expert periodontists to ensure clinical accuracy and consistency across the dataset.

(a) Identifying signs using ImageJ for each tooth in OPG and (b) a clip showing the amount of bone loss.

The percentage of bone loss is then calculated by dividing the bone level loss by the healthy bone level and multiplying it by 100. This percentage will help in the staging of the periodontal disease. Lastly, the rate of bone loss should be divided by the patient’s age to find the grade of periodontal disease progression. This will help to grade the severity of periodontitis based on age-adjusted bone loss percentage.
Conclusions
This study thoroughly analysed 3 deep learning models, namely InceptionV3, InceptionV4, and ResNet-50, to classify OPG images based on distinct grades characterised by dental features. Different optimisation methods and learning rates were applied to experiment with the possibilities of optimising the performance of deep learning models. We then compared the models’ performance indicators, including accuracy, precision, recall, and F1 score, to identify the most effective model for OPG image classification. The performance observations of the models under different optimisation and learning rate settings led to a finding that ResNet-50 generally exhibited better performance than InceptionV3 and InceptionV4. ResNet-50 demonstrated relatively high accuracy and precision in classifying OPG images based on the grades. The results show that ResNet-50 achieved an accuracy of 96.8% by the 16th epoch with the SGDM optimiser with Momentum and a learning rate of 0.001. Notable avenues for future research include expanding the dataset with more OPG images or dental conditions to improve the model’s generalisability. Further research could involve experimenting with alternative data augmentation strategies and tweaking the hyperparameters to enhance the training and validation outcomes.
Footnotes
Ethical Considerations
The Ethics Review Committee at SEGi University approved our study (approval: SREAF/Rev 1/ 24 March 2022).
Consent to Participate
NA.
Author Contributions
MASAl: Conceptualization, methodology, supervision, project administration, validation, formal analysis, writing – review & editing.
MHH: Data curation, investigation, software, resources, visualization, writing – original draft.
SY: Methodology, data collection, formal analysis, statistical analysis, writing – review & editing.
Funding
The authors received no financial support for the research, authorship, and/or publication of this article.
Declaration of Conflicting Interests
The authors declared no potential conflicts of interest with respect to the research, authorship, and/or publication of this article.