
Abstract
Background
Diffusion magnetic resonance imaging (MRI) abnormalities in multiple sclerosis (MS) are not limited to lesions, but have also been observed in the white matter that appears normal on conventional MRI sequences, known as normal-appearing white matter (NAWM). There is evidence of microstructural processes occurring in the NAWM.
Objective
To assess the correlation between NAWM apparent diffusion coefficient (ADC) and fractional anisotropy (FA) with brain volume and clinical disability in MS.
Methods
Brain MRI from 33 MS patients were included. ADC and FA measurements of the genu, body, and splenium of corpus callosum (CC) were done. ADC and FA values were analyzed to measure their correlation with brain volume from MR volumetry and clinical disability represented by Expanded Disability Status Scale (EDSS).
Results
The mean ADC of CC NAWM was .93 ×10−3 mm2/s (±.13 SD), and the mean FA .72 (±.12 SD). ADC and FA of CC NAWM were significantly correlated with the ratio of brain volume to intracranial volume (R = −0,70 and 0,78 respectively), and with EDSS (R = .52 and −.59 respectively).
Conclusion
There were significant correlations between ADC and FA of NAWM with brain volume and EDSS of MS patients. Further longitudinal studies were needed to evaluate the potential of diffusion MRI in the evaluation of MS.
Keywords
Introduction
Multiple sclerosis (MS) lesion is defined as an area of focal hyperintensity demonstrated on T2-weighted or proton density (PD)-weighted sequence, predominantly on the white matter (WM). This has become the standard of diagnosis and evaluation of MS. Although T2 and PD-weighted sequences have shown high sensitivity for MS lesions, it turns out that lesion burden only has a limited correlation with clinical disability, which is known as the clinical-radiological paradox.1-3 Other MRI indices being used in the evaluation of MS are brain volumes using MRI volumetry. MRI volumetry plays an important role in MS to assess the degree of brain atrophy. Several studies have shown that brain volume is well correlated with clinical disability.4-6 However, MRI volumetric analysis has its shortcomings and is not widely available for use in clinical practice.
In addition to MRI volumetry, diffusion MRI has shown potential as an imaging biomarker for MS. Histopathologically, the hallmark of MS are demyelination and axonal damage, which in turn changes the WM architecture, resulting in increased diffusion in the tissue as demonstrated by diffusion MRI.7,8 Recent studies have provided an understanding that the pathology of MS is not limited to lesions demonstrated on T2 or PD-weighted sequences. Diffusion MRI values, such as apparent diffusion coefficient (ADC) and fractional anisotropy (FA) were found to be not only abnormal in lesions, but also abnormal in normal-appearing white matter (NAWM).9-11 Studies that reviewed histological, biochemical, and histochemical features of NAWM revealed evidence of microstructural processes in the NAWM.12,13 This in turn invites new questions regarding the neuropathology of MS, especially the role of NAWM abnormalities in the progression of brain atrophy and clinical disability. This cross-sectional study aims to assess the correlation between NAWM ADC and FA, brain volume, and clinical disability represented by EDSS in MS patients in Indonesia, to help discover the role of NAWM in the neuropathology of MS, and to open up the possibility of alternative methods for volumetric techniques in the evaluation of MS. There have been no studies to date that have reviewed the correlation between these parameters in Asian MS patients.
Methods
This study was conducted at the Radiology Department of Dr. Cipto Mangunkusumo Hospital (RSCM) in Jakarta, Indonesia from June to August 2020, after being approved by the institutional ethics committee (LB.02/221/0823/2020). Written informed consent was obtained from all research participants.
Subject
Subjects were recruited through consecutive sampling. Patients diagnosed with MS by the Neurology Department of RSCM were enrolled in this observational study. The diagnosis was based on the 2010 McDonald’s criteria. 14 The inclusion criteria were a diagnosis of secondary-progressive MS (SPMS) or relapsing-remitting MS (RRMS), brain MRI examinations performed with Optima MR450w 1.5 T scanner (GE Healthcare), and disability assessments using the Expanded Disability Status Scale (EDSS). 15 The EDSS ranged from 0 (normal neurological status) to 10 (death due to MS). Exclusion criteria were patients with other central nervous system diseases (e.g brain tumor), suboptimal MRI images, and artifacts on MRI images that may affect brain volumetry and measurement of ADC and FA values. Patients with a gap between MRI examination and EDSS assessment of more than 2 weeks were also excluded from this study.
The minimum sample size was calculated using the sample size formula for bivariate (Pearson) correlation:
MRI Protocol
Brain MRI examinations were performed using an Optima MR450w 1.5 T MRI scanner (GE Healthcare). Axial diffusion tensor imaging (DTI) series with slice thickness 4 mm, interslice gap 1 mm, field of view (FOV) 240 x 240, TE 97.5, TR 8000, b-values 0 and 1000, with 25 diffusion-encoding gradient directions; axial diffusion-weighted imaging (DWI) sequences with slice thickness 5 mm, interslice gap 0.5 mm, FOV 240 x 240, TE 76.6, TR 6000, b-values 0, 500, and 1000; and axial T2WI sequences with slice thickness 5 mm, interslice gap 0.5 mm, FOV 220 x 220, TE 97, TR 6212.
Brain volumes were obtained from a data-set of another research conducted in RSCM Neurology Department by Firdausia (2019) entitled “Correlation between grey and white matter atrophy with the degree of disability in multiple sclerosis patients”. 6 Image acquisitions for volumetry assessments were performed using BRAVO sequence protocol on the 1.5 T Optima MR450w 1.5 T MRI scanner (GE Healthcare).
MRI Post-processing
Measurements of NAWM ADC and FA were performed using Functool (GE Medical System) software. Measurements were done in the corpus callosum by drawing a range of interest (ROI) on the corpus callosum WM which showed normal appearance on axial T2WI. The ROIs were drawn on the midline genu, right and left corpus, and midline splenium, simultaneously on the corresponding ADC and FA maps. Measurements were carried out twice, first using a point-shaped ROI measuring 1 mm2 (Figure 1), and the second using an ellipse ROI with the largest size that can be accommodated by the structure being measured (Figure 2). The values of ADC and FA are taken from the four structures using both of the ROI techniques. Mean ADC and FA values from those four structures were calculated to obtain a mean value of the corpus callosum. Measurements were confirmed by a senior radiologist in our institution’s neuroradiology division. Measurement using point-shaped ROI technique on the ADC and FA map (1 = genu, 2 = splenium, 3 = right corpus, 4 = left corpus). Measurements using ellipse ROI technique on ADC and FA map (1 = genu, 2 = splenium, 3 = right corpus, 4 = left corpus).

Brain volumetric analysis was performed with an automatic segmentation method using FreeSurfer stable 6.0.0 software. Cerebral volume without ventricles and cranial volume were measured, and the ratio of cerebral volume without ventricles to cranial volume (CCVR) was calculated.
Statistical analysis
Data were statistically processed using SPSS 20.0. Shapiro-Wilk test was used for normality; a numerical variable was considered as normally distributed if the Sig. value is greater than .05, otherwise, it was considered to have a skewed distribution. Numerical variables with normal distribution were presented as means and standard deviations, while numerical variables with skewed distribution were presented as medians and ranges. Numbers and percentages were given for categorical variables.
Intraclass correlation coefficient (ICC) between point-shaped and ellipse ROI technique measurement results were calculated using average measures of two-way mixed effects model. Intraclass correlation coefficient greater than .7 was considered good, ICC greater than .8 was considered optimal, and ICC greater than .9 was considered excellent.
Correlations between these numerical variables were analyzed: NAWM ADC and cerebral volume, NAWM FA and cerebral volume, NAWM ADC and cerebral to intracranial volume ratio, NAWM FA and cerebral to intracranial volume ratio, NAWM ADC and EDSS, and NAWM FA and EDSS. Pearson correlation test was used for normally distributed variables, while Spearman test was used for variables with skewed distribution. P values of less than .05 were considered statistically significant. Pairwise deletion was applied to the missing data.
Results
Demographic characteristics, brain volume, and EDSS of the MS patients.
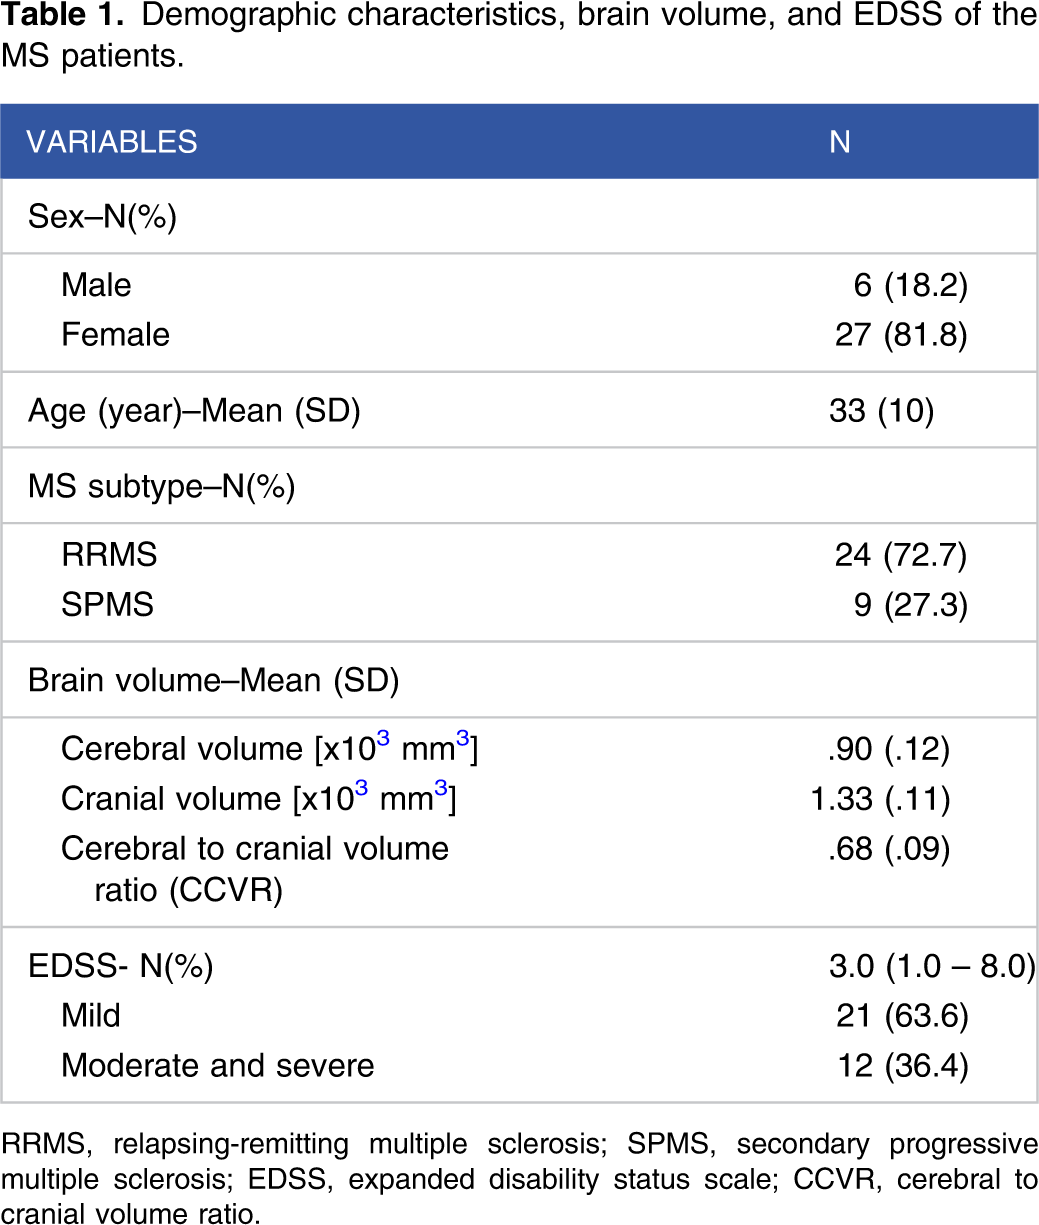
RRMS, relapsing-remitting multiple sclerosis; SPMS, secondary progressive multiple sclerosis; EDSS, expanded disability status scale; CCVR, cerebral to cranial volume ratio.
The majority of the subjects were women, ranging in age from 20 to 61 years (mean age 33 ± 10 years). Most of the subjects (72.7%) experienced relapsing-remitting multiple sclerosis (RRMS), while the rest had secondary progressive multiple sclerosis (SPMS). The cerebral volume of the subjects ranged from .70 to 1.2 × 103 mm3, (mean .90 × 103 mm3 ±.12). The cerebral to cranial volume ratio (CCVR) was .49 to .81 (mean .68 ±.09). EDSS scores ranged from 1 to 8 (median 3.0). One subject had lesions on the corpus of CC, one had lesions on the splenium, and one had lesions on the genu that prevented the measurement of ADC and FA of the NAWM in those regions.
NAWM ADC and FA
Corpus callosum NAWM ADC and FA of MS patients measured using point-shaped and ellipse ROI measurement techniques.

CC, corpus callosum; NAWM, normal-appearing white matter; ADC, apparent diffusion coefficient; FA, fractional anisotropy; ROI, range of interest; ICC, intraclass correlation coefficient.
Regarding MS subtype, the RRMS group mean ADC was 93 × 10−3 mm2/s (±.12 SD) and mean FA .72 (±.11 SD). The SPMS group mean ADC was 1.12 × 10⁻³ mm2/s (±.13 SD) and mean FA .59 (±.07 SD).
Correlation with brain volume
Corpus callosum NAWM ADC and FA of MS patients measured using the point-shaped and ellipse ROI techniques and their correlation with brain volume.

CC, corpus callosum; NAWM, normal-appearing white matter; ADC, apparent diffusion coefficient; FA, fractional anisotrophy; ROI, range of interest; CCVR, cerebral to cranial volume ratio.
Correlation with EDSS
Corpus callosum NAWM ADC and FA of MS patients measured using the point-shaped and ellipse ROI techniques and their correlation with EDSS.
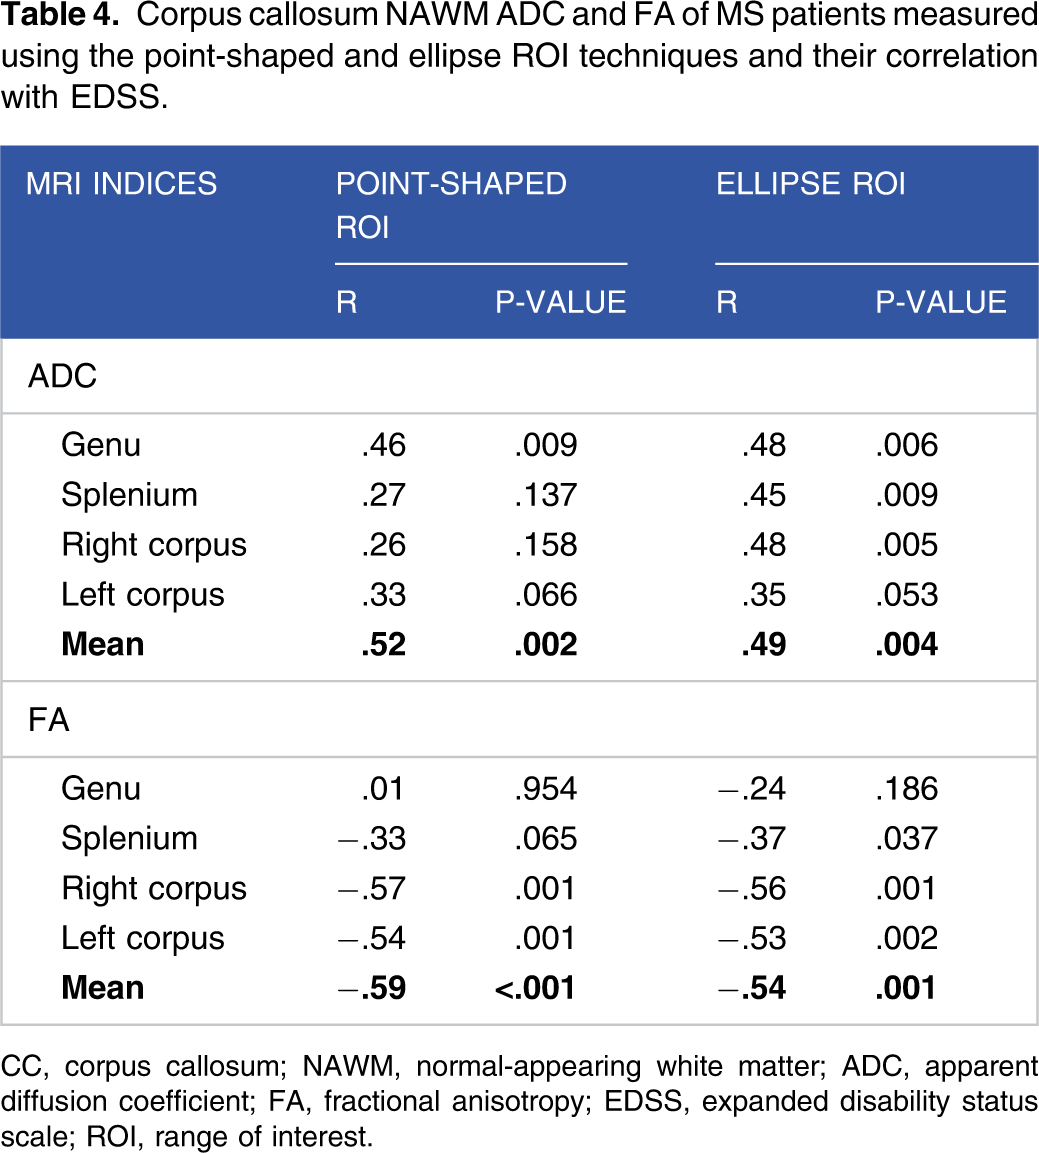
CC, corpus callosum; NAWM, normal-appearing white matter; ADC, apparent diffusion coefficient; FA, fractional anisotropy; EDSS, expanded disability status scale; ROI, range of interest.
Discussion
ADC and FA of the NAWM
The role of MRI in the evaluation of MS was initially limited to the visualization of hyperintense lesions in the T2 or PD-weighted sequences. However, several studies, including histopathological studies, 12 provided an understanding that MS is a diffuse pathological process that is not confined to the lesions seen on conventional MRI. On top of that, diffusion MRI indices correlate to some degree with myelin content and axonal count in MS. 13 In this study, the mean CC NAWM ADC was .93 × 10−3 mm2/s, FA .72 (point-shaped ROI) and ADC .98 × 10−3 mm2/s, FA .68 (ellipse ROI). When compared to normal controls from Coombs et al, 16 NAWM has higher ADC and lower FA (normal control ADC .816 × 10−3 mm2/s, FA .78). Other studies by Chen et al, 17 Andrade et al, 11 and Hameed et al 10 also observed higher ADC and lower FA in the NAWM of MS patients. These findings support the theory that MS caused a diffuse pathological process in the WM, although no abnormalities are seen on conventional MRI, and that diffusion MRI is a sensitive technique for microstructural changes in the NAWM.
Based on MS type, NAWM of the SPMS group had higher ADC and lower FA compared to the NAWM of the RRMS group, although our sample size was too small for statistical analysis between the groups. However, these conformed with Mohammed 18 who discovered that NAWM ADC was higher in SPMS compared to RRMS. This may be related to the disease course of MS. The majority of MS was initially RRMS, and as the disease progresses, some will transition to SPMS. SPMS generally occurs 10 to 15 years after the onset of RRMS.
Correlation with brain volume
The NAWM ADC was negatively correlated with brain volume, while NAWM FA was positively correlated with brain volume, specifically with the CCVR (R = −.70 and .78 respectively, P < .001). Kolasa et al. 19 also found significant correlations between CC diffusion MRI parameter and brain volume, albeit in their study it was radial diffusivity (RD). In MS, there is damage to the myelin sheath and a decrease in axonal integrity, resulting in WM architectural changes. These changes caused an increase in extracellular diffusion as well as a decrease in overall brain volume. There was a slightly stronger correlation between FA and brain volume compared to ADC. While ADC assessed the magnitude of the diffusion process of water molecules in the tissue, FA assessed the anisotropy of the process. Therefore, in highly anisotropic tissue, FA can be used as a good quantitative parameter for tissue integrity. The WM of the corpus callosum is an example of tissue with high anisotropy, which is formed by densely arranged axon fibers connecting the two hemispheres of the brain. The integrity of the corpus callosum tissue can be well assessed using FA parameters.
Correlation between NAWM ADC and FA with the CCVR (R = −.70 and .78 respectively, P < .001), was slightly stronger than their correlation with cerebral volume (R = −.68 and .70 respectively, P < .001). This may be caused by the influence of multiple factors on brain volume, such as the size and shape of the cranial cavity. In cross-sectional measurements, the CCVR can be used to reduce bias due to differences in cranial morphometry between individuals.
Correlation with EDSS
There was a weak to moderate correlation between NAWM ADC and FA with EDSS (R = .52 and −.59 respectively, P<.001). This finding was in line with those of Elsayed et al 9 who found a significant positive correlation between NAWM ADC and EDSS, and a negative correlation between FA and EDSS. In their study, the subjects were grouped according to their MS subtypes, and a strong negative correlation was found between NAWM global average FA and EDSS in the SPMS group. On the other hand, Kolasa et al. 19 found that there were no correlations between NAWM DTI parameters and EDSS. This difference in results may be caused by differences in the demographics of the research subjects. Kolasa et al. 19 included patients with stable and progressive MS subtypes, and reviewed the duration of the subjects' medical treatment, while this study did not review those variables. Vrenken et al. 20 analyzed the ADC and FA of NAWM and normal-appearing gray matter (NAGM) of MS patients. This study found an increase in the ADC of cortical NAGM, and there was a significant correlation between cortical NAGM ADC and clinical disability. The study also found that there was an increase in ADC and a decrease in FA of NAWM, but they were not correlated with clinical disability. A longitudinal study by Jacobsen et al. 21 found that there was a better correlation between gray matter (GM) atrophy and clinical progression than WM atrophy. These findings provided an understanding that there were significant structural changes in MS, both in WM and GM, but changes in GM might have a better correlation with clinical disability.
ADC and FA measurement technique
There is no standard technique for measuring NAWM ADC and FA values, especially in the corpus callosum. The ROI size used varied, depending on the size of the structure being evaluated. The wider the ROI area, it is expected that the sampling area will be larger, thus providing more representative results. In this study, two ROI techniques were used, first, in the form of an ellipse which was drawn according to the measured area, and second, ROI in the form of a point measuring 1 mm2 in size. Point-shaped ROI has several advantages, including being easier to draw, having a small size so that its placement allows for better precision, and shorter measurement time. From the results of this study, there was no significant difference between measurements using the ellipse and the point-shaped ROI methods.
Study limitations
The limitation of this study was that the MRI protocol used resulted in low spatial resolution images, especially in the axial T2 sequence. This may have caused less than optimal lesion identification, thus affected the determination of NAWM area. The relatively thick slices d, both in the diffusion and axial T2 sequences, might have affected the measurement accuracy.
Conclusion
There were significant correlations between the NAWM diffusion MRI indices (ADC and FA) with brain volume and clinical disability in MS patients. The higher ADC and the lower FA values correlated with smaller brain volume and worse clinical disability. Longitudinal studies are needed to assess the ability of diffusion MRI as an alternative to volumetric MRI in evaluating MS progression.
Footnotes
Acknowledgements
The authors thank Dr. Sawitri Darmiati for her contributions, Tri Budi Heruningsih and Mega Amanda (MRI technologists) for their assistance, and the MS patients of RSCM for participating in this research.
Declaration of conflicting interests:
The authors declared no potential conflicts of interest with respect to the research, authorship, and/or publication of this article.
Funding:
The authors received no financial support for the research, authorship, and/or publication of this article.