
Abstract
Obesity continues to be a health burden to society and new efforts may be needed to combat this epidemic. This study aims to investigate the contribution of parents education and level of income, food environment (grocery stores and fast food restaurants), and built environment (perceived safety, availability/quantity of parks) on childhood obesity. This cross-sectional observational study explored whether parents education and income level, built environment, and food environment can affect children with obesity. Participants were selected from 3 separate elementary schools located in an urban community with higher risk to have children with obesity in Montclair, California. Children living in families with low incomes have 2.31 times greater odds to be affected by obesity than children living in higher income homes. Children whose parents did not feel safe in their neighborhoods had odds of obesity 2.23 times greater than those who reported their neighborhoods as safe. Age also appeared to be a risk factor, and the odds of children affected by obesity among children 8 to 9 years was 0.79, and the odds of being affected by obesity among children 10 to 11 years of age was 0.36, when compared to children 6 to 7 years old. Findings suggest that low family income, perceptions of neighborhoods as unsafe, and young age are associated with higher body mass index (BMI) percentiles among children living in poor neighborhoods in Montclair, California.
Keywords
Introduction
Historically epidemics have often been overcome with appropriate drugs or vaccines. In the case of obesity, however, treatment is more complex. It is well known that diet and exercise are primary tools to combat obesity. The imbalance between caloric intake and output through physical activity is a main contributor to weight gain. 1 Despite public health and health care efforts to increase physical activity and change diet among patients with obesity, there has been insufficient progress in reducing the burden of this condition. Efforts targeting children may be one effective strategy for bringing about early change and prevention, especially considering nearly 17% of U.S. children and adolescents are now affected by obesity. 2 Children with obesity are more likely than children of normal weight to become overweight or adults with obesity, with correlated increased risk of heart disease, hyperlipidemia, hypertension, diabetes, strokes, musculoskeletal disorders, certain types of cancers, and early death.3,4 Not only later in life, but these children are also at higher risks of developing high cholesterol, high blood pressure, diabetes, and various musculoskeletal disorders in their youth.3,5
The prevalence of childhood obesity is highest in urban settings, minority populations, and in lower income households.2,6,7 These trends imply certain contributing factors are at play, income level and geographic location chief among them.5,8 Many recent studies have begun to explore these contributing factors.6,7,9-13 Lower income level and socioeconomic status (SES) leads to living in low-income communities that have substandard food and built environments, low affordability to healthy food, difficult to access recreation centers, and parks.6,10,11,14 There has been increased interest in exploring food environments (eg, presence of fast food outlets, number of grocery stores) and built environments (eg, perception of neighborhood safety, number of parks) as obesogenic factors.6,11-13
Children living in poor social and built environments are 50% less likely to be physically active. 14 Many studies and systematic reviews have revealed that various environmental barriers such as unsafe neighborhoods and lack of community parks and recreational centers impede a community’s ability to engage in physical activity.1,11,15-18 Where public parks do exist, they are unsafe. These places are marred by graffiti, serve as shelters for the homeless, and have become meeting grounds for drug use, trafficking, gang activities, and alcohol use. 14 A study that surveyed more than one thousand 5th and 6th graders in Connecticut confirmed that in addition to better access to parks, playgrounds, and gyms, children’s perception of accessibility was even more important in encouraging physical activity. 19
In addition, neighborhoods with lower SES have inferior food environments and various studies have identified a relationship between food environment and diet quality.13,20-22 One study involving a multiethnic urban population showed that Hispanics, compared to Blacks, consumed twice as many fruits and vegetables when a large grocery store was available, versus half as much when only convenience stores were available. 23 Yet convenience stores are far more prevalent in neighborhoods with low SES. Another study of more than 500 Hispanic youth showed that limited access to supermarkets contributed to higher body mass index (BMI, kg/m²) in boys, but no correlation was seen in girls. 16 Not all studies showed a clear association between food environment and obesity, one study examining racial disparities in obesity concluded that food environment alone was not responsible. 24 One argument is that disparities are more likely attributed to differences in cultural preferences and local businesses respond in kind. 25 In sum, results from various studies demonstrate mixed conclusions, more evidence with cohesive studies are necessary.
The purpose of the present study was to gain more information regarding the contribution of parental education and income level, food environment (grocery stores and fast food restaurants), and built environment (perceived safety, availability/quantity of parks) on children with obesity—by looking at an especially high-risk population of children from an urban setting, in southern California.
Methods
Study design and sample
We conducted a cross-sectional nonexperimental correlational study of elementary school students (Grades 1-5, aged 6-11 years) from Montclair, CA. Our research methodology involved a survey format with the final survey and study proposal approved by the Loma Linda University Institutional Review Board (IRB). We received no grants or special funds to finance our research.
Out of 8 total elementary schools in central Montclair, we randomly selected 3 to be used in our research. The names of the 8 schools were numbered and entered into Microsoft Excel with the RAND function used to obtain a simple random sample of 3 schools. All students from these 3 schools were given a take-home consent form along with the study survey to request study participation. A total of 171 parents/guardians signed consent, completed the survey with their children’s input, and were enrolled in the study. For the purpose of this study, “parent” we mean any parent or legal guardian who is the primary caregiver of the participant. Students were given a small toy chosen by the school district representative worth approximately US$2 as an incentive for study participation, and the district administrator discouraged giving incentives to parents.
Setting
Overall, California spends more on obesity-related health care expenses than any other state. 26 San Bernardino County is the 5th most populous county in California and 12th in the nation. 27 Within San Bernardino and bordering Los Angeles, 2 of the most racially and ethnically diverse urban counties in the United States, Montclair is equally heterogeneous. 27 While about half of residents in San Bernardino are Hispanic, a larger concentration resides in Montclair making up 70% of its population; 14% of residents are White, 5% are Black, and 9% are Asian. 28 Nineteen percent of Montclair residents are currently living in poverty. 28 Forty-five percent of Montclair children are affected by obesity. 3
Outcome measure
According to the Centers for Disease Control, 29 a child is considered “underweight” if he or she has a BMI value with a percentile range less than the 5th percentile, “normal or healthy weight” if BMI is in the range of 5th percentile to less than the 85th percentile, “overweight” if within the 85th to less than the 95th percentile, and “obese” if BMI is equal to or greater than the 95th percentile for corresponding age and sex. These definitions were used for this study to categorize our participant values.
Participant’s weight and height measurements were collected in the school’s health office during school hours by a student researcher. The Adam MDW-250L digital medical scale was used, and each measurement took no longer than 5 minutes per child. Children were weighed with minimal clothing, without shoes, and values were rounded to the first decimal. Results were inputted into the CDC BMI percentile calculator to determine BMI and weight category (https://nccd.cdc.gov/dnpabmi/calculator.aspx). The measures were recorded directly into the Statistical Package for the Social Sciences (SPSS 20) software.
Measures
We created a survey and used a self-report method of data collection. We derived our 22 questions from the 2007 National Survey of Children’s Health. Questions assessed parental education and income level, child behavior, perceived neighborhood (determined within the school catchment area) safety, and demographic data such as age, sex, ethnicity, and household size. Surveys were translated into Spanish using 2 forward translations, one done by Google Translate and another by a Spanish-speaking volunteer. A different volunteer then back translated the questions into English. The final translations were then compared by the 2 volunteers for any discrepancies and then pilot tested with further revisions made as needed. With pilot testing, it was determined that the survey takes less than 10 minutes to complete.
We distributed 500 surveys with consent forms to each school. Teachers handed these to students to take home. Surveys were also distributed to parents during parent and teacher association (PTA) and other parent meetings until the sampling goal was reached. Reminder postcards were mailed 1 week after distribution and participants were given 3 weeks to return surveys. Our final sample size totaled 171 students with their corresponding parents who agreed to participate and completed the surveys.
Study variables and data collection
We assessed participant’s education and income level in addition to food and built environments as main independent variables. We assessed food environment based on number of grocery stores and fast food restaurants within the school district area. The built environment was evaluated according to quantity of parks and perceived safety in corresponding participant’s neighborhoods. Thus, our analysis included a total of 6 independent variables: income, education level, number of grocery stores, quantity of fast food restaurants, quantity of parks, and parent’s perception of neighborhood safety. General demographic and household demographic data were also collected.
Participant’s family income and parent education levels were determined via survey questions. We also used sections from the National Survey of Children’s Health (2007) to measure SES, which is measured in terms of (a) parent education and (b) parent income.
We obtained Geographic Information System (GIS) mapping data for our chosen region from the California Department of Public Health (http://www.cdph.ca.gov/Pages/DEFAULT.aspx). This database provided details regarding number of grocery stores, fast food restaurants, and parks within each school catchment area. In addition, researchers visited each area under study and manually counted grocery stores, fast food restaurants, and parks to compare with GIS data and assert accuracy.
To assess neighborhood safety, we used the 2007 National Survey of Children’s Health survey question K10Q40: “How often do you feel [CHILD NAME] is safe in your community or neighborhood? Would you say never, sometimes, usually or always?”
Sample size and power analysis
We calculated a power analysis based on SAS proc power to determine the sample size needed. Given the observational nature of our study and the use of multiple linear regression statistical analysis, a medium effect size was appropriate. Sample size for a medium effect size (ES = .15), at power = .80, for alpha = .05, is N = 92. The resulting actual power level is also .80. A minimum sample size of 92 subjects is necessary to achieve adequate power (.80). Given that this is only a recommended minimum, we increased the sample size to N = 171 (171 students represented by their parents) to increase power.
Data analysis
We used the Ordinal Logistic Regression method to look at obesity represented by BMI as the outcome variable with 6 potential predictors (income, education, number of grocery stores, number of fast food places, number of parks, and parent perception) and demographic variables (see Table 1).
Distribution of outcome (BMI) and predictor variables collected via survey among parents of Montclair, CA, elementary students.

Regions 1, 2, and 3 represent the district areas randomly chosen for this study. Abbreviation: BMI, body mass index.
Frequency tables were used to identify predictor variable levels with insufficient counts for any category of BMI (see Table 2). The initial 7 levels for parent education were collapsed into 4 levels (Table 2), and neighborhood safety was reduced from 4 to 2 levels (Table 2). We used univariable ordinal logistic regression to assess the association between each predictor variable and BMI as the dependent variable (see Table 3). We created a multivariable logistic regression model to determine the association between BMI and the environment variables of interest. To avoid multicollinearity, principal component analysis was used to identify predictor variables that were highly correlated (Table 4). From the univariate analysis results and analysis of clusters and correlations, 3 predictors (income, availability of fast-food, and perception of neighborhood safety) and 3 confounders (age, race, and sex) were selected for the final model. The variables selected explained 94% of the variables of each child’s BMI percentile.
Distribution of predictor variables by BMI category.

Abbreviation: BMI, body mass index.
Predictor variables levels with small counts (less than 5) were collapsed. Regions 1, 2, and 3 represent the district areas randomly chosen for this study.
BMI univariable analysis to assess the association between predictor variables and BMI.

Abbreviations: BMI, body mass index; CI, confidence interval; OR, odds ratio.
Variable clustering and correlation analysis.

The reported odds ratios represent the odds of obesity compared to the combined effect of overweight and normal and similarly the odds of the combined effect of obesity and overweight compared to normal. The variable of race/ethnicity was not significant but was an important confounder and was retained within the model. The score test was used to assess the proportional odds assumption. All analyses were done using Statistical Package for the Social Sciences (SPSS 20) software and confirmed with SAS 9.3 (SAS Institute, Cary, NC).
Results
Out of 171 participants, 39.2% had a BMI ⩾95th percentile (67 of 171), 35.7% had a BMI between the 85th and 95th percentile (61 of 171), and 25.1% had a BMI <85th percentile (43 of 171). Majority of parents (71%-42%) have high school diploma or GED completed. Many of the families are high income level, with 124 (72.5%) in out sample. However, 91 (53%) of them feel safe at their neighborhood only sometimes. Out of 170 participants, 101 are Hispanic (59%) and 63% are females.
In Table 2, we have the distribution of the predictor variables per BMI category. Many children with BMI ⩾95th percentile or between the 85th and 95th percentile had parents with high school or less. Also, many of those children had parents that answered the question about perception of neighborhood safety as sometimes or never. More children at the age of 7 years are on the BMI ⩾95th percentile.
Univariable analyses are shown in Table 3. When exploring income level alone, children of lower income families had 2.31 times greater odds of being affected by obesity. Assessing built environment data, compared to children whose parents felt “mostly” or “always” safe in their neighborhoods, children whose parents “sometimes” or “never” felt safe in their neighborhood had 2.23 times greater odds of having children with obesity than the combined effect of overweight and normal. Older children presented with lower odds of obesity when compared to those 6 to 7 years of age. The odds of obesity among children aged 8 to 9 years was 0.79, and the odds of obesity among children 10 to 11 years of age was 0.36. The other variables assessed on the univariable analysis were not statistically significant.
Finally, the multivariable analysis is presented in Table 5. Regarding parents’ education, fast food outlets, sex, and race/ethnicity, no association was found. The odds of overweight and obesity versus normal weight were 2.23 times greater among children with parents who perceive the neighborhood as safe only sometimes or never, having all other predictors constant. Older age between children also decreases the odds of obesity when compared to children 6 to 7 years old, when all other variables in the model are constant.
Multivariable analysis obese versus overweight/normal and obese/overweight versus normal.
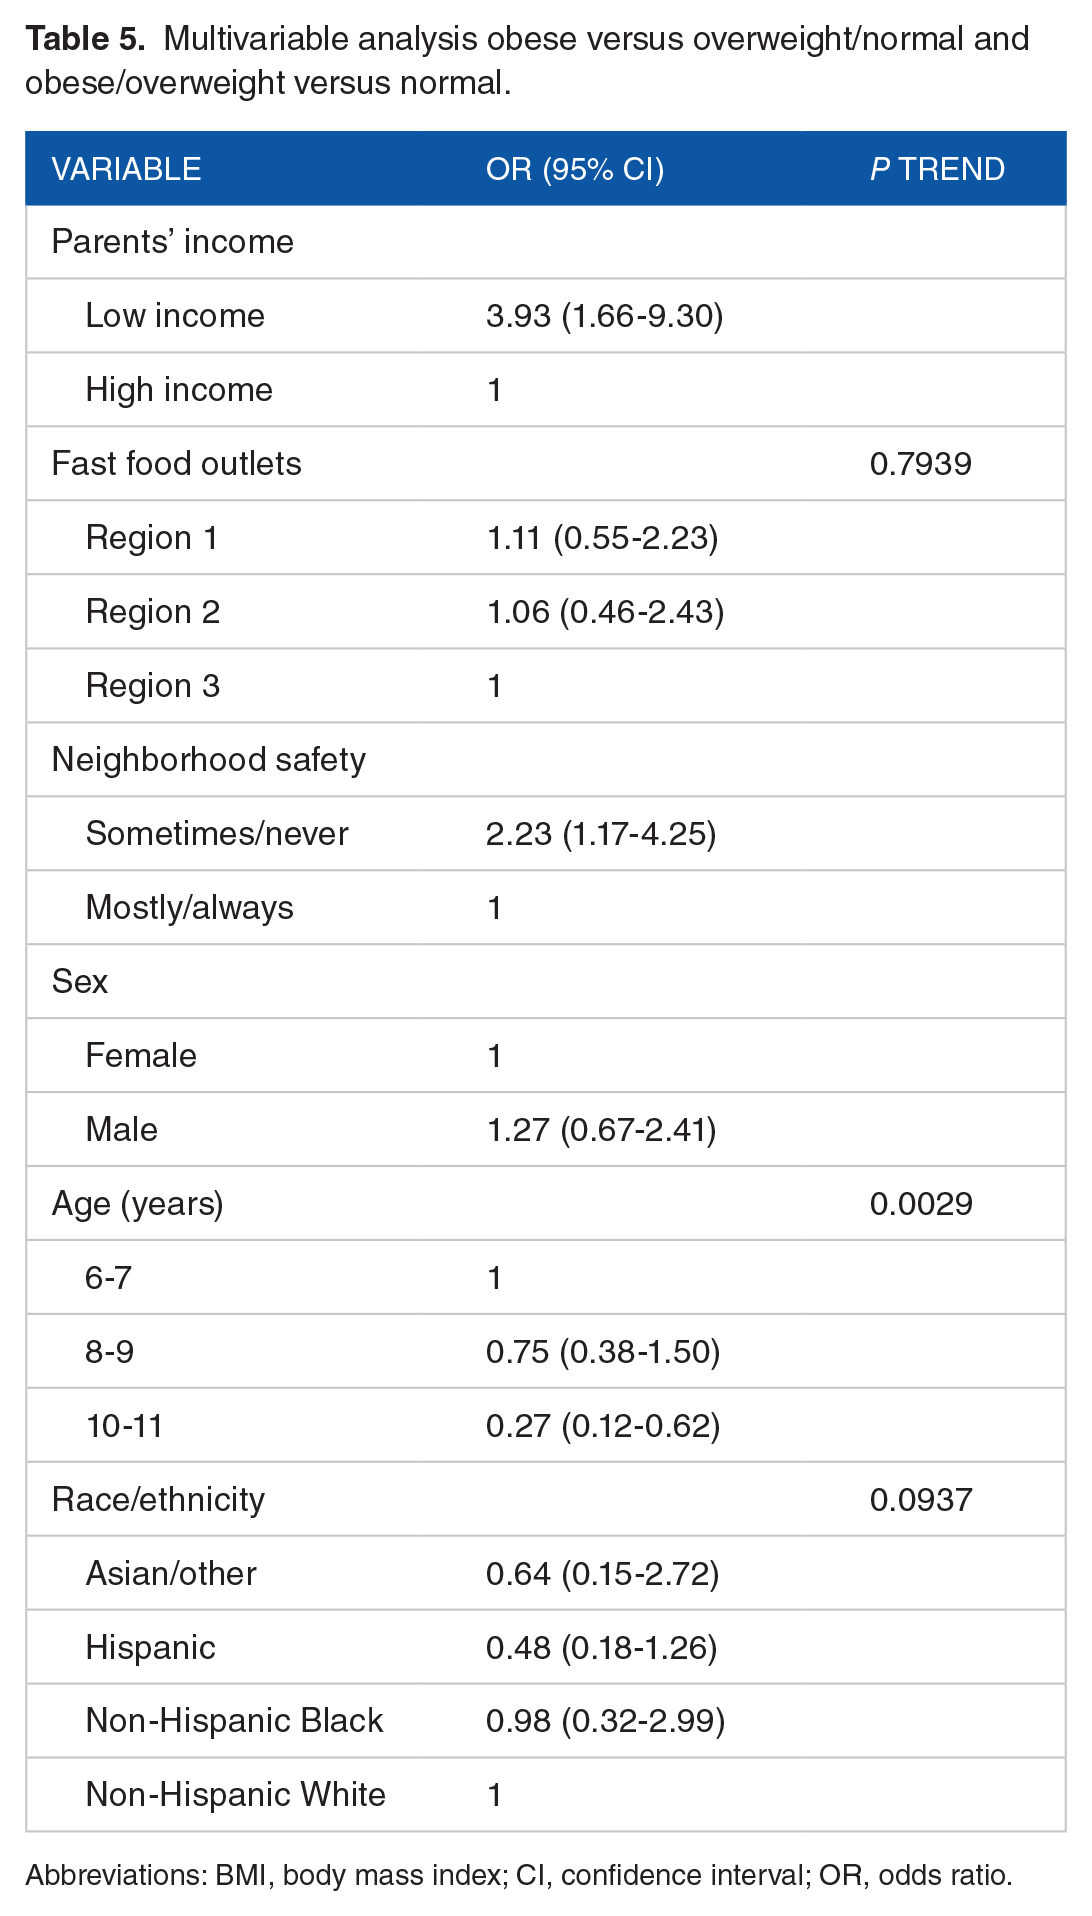
Abbreviations: BMI, body mass index; CI, confidence interval; OR, odds ratio.
Discussion
The purpose of this study was to identify an association between childhood obesity, SES, food environment, and built environment. We investigated SES (parents education and income level), availability to grocery stores, availability of fast food outlets, perception of neighborhood safety and parks, and how these factors might contribute to a child’s weight (represented as BMI percentile). There is a gap in the literature regarding how these factors affect the BMI of individual children. A review of the literature revealed that some associations do exist between these identified variables. However, most studies evaluated aggregated county-level data rather than information pertaining to smaller geographic regions such as Montclair. This study attempted to investigate whether present predictors of childhood obesity apply to a specific, smaller population. Thus, our study provided additional information regarding factors that may influence obesity in a different setting—to compare with larger populations and further elucidate the complexity of obesogenic factors. The results of the study support our hypothesis that lower income and increased concerns over neighborhood safety are associated with higher BMI, and the other independent variables were not statistically significant.
Our findings confirmed an association between low income and obesity. Children of low-income parents were twice as likely to have increased BMI scores compared to children from higher income families. Some studies suggest this could be due to low-income families not having access to affordable healthy foods.6,14 Our study, however, did not uncover an association between food environment and children affected by obesity. However, our findings did suggest an association between one of the built environment factors—that of parental perception of neighborhood safety and child obesity. Children whose parents reported increased concerns over neighborhood safety were twice as likely to be affected by overweight or obesity compared to those with fewer safety concerns. As the research suggests, parents who feel their neighborhoods are unsafe are reluctant to allow their children to play and exercise outdoors. These children have lower levels of physical activity and caloric expenditure, increasing their risk of developing obesity. Our study did not reveal any connection between obesity and availability to parks. It is plausible that parents may avoid use of these facilities if they perceive their neighborhoods to be unsafe, regardless of availability.
Limitations
The lack of associations found in our study may be attributable to various limitations. First, the generalizability of our results is limited given our small population size. Second, using a self-report method to assess perception of neighborhood safety as well as to measure SES reduces potential validity of our data—due to risk of bias, inaccuracies, and subjectivity. Furthermore, given that participants were not blinded and were told that the study would assess specific factors that impact children with obesity could have influenced their responses—perhaps influencing them to portray a healthier lifestyle than reality.
Study implications
Obesity is a public health concern that requires educating children, parents, individuals, families, schools, communities, and public policy. Health education and promotion play a major role in preventing, controlling, and combatting the obesity epidemic. Developing a better understanding of how socioeconomic factors, food environments, and built environments impact childhood obesity provides insight into interventions and policies that can minimize these risk factors. Our study aimed to increase understanding of environmental determinants of childhood obesity, exploring whether a different approach to resolution of this epidemic may be more effective than looking into individual behaviors alone. More studies exploring obesogenic environmental factors are needed, and we hope to have elucidated such considerations in a given urban setting. Our findings that obesity was not associated with quantity of parks correlate with other similar studies. 30 Perhaps education regarding resources that are available and safe in respective communities may increase physical activity—lack of knowledge about resources may be the reason why many neighborhoods have high childhood obesity rates despite presence of parks and recreation. However, if despite access safety is still a concern, more research is needed to confirm this association. Our study helped to enlighten better questions that future studies should pose: “Are lower income neighborhoods truly lacking in resources or do they need better education about resources that are available? Is the problem of built environment one of quantity or quality/safety? Or perhaps a combination?” Answering these questions would better guide public health and policy efforts to combat obesogenic factors. Furthermore, in addition to environmental impact, this study exposed significant age-related risk. The findings of substantially higher BMI scores within mid-childhood years (8-9 years old) implicate interventions are especially crucial for elementary school-aged children. In addition, preventive efforts targeting children in the age ranges leading up to this stage might prove most effective in curtailing the development of obesity.
This study contributes to the work and objectives of Healthy People 2020 to improve child health and behaviors, to prevent obesity and related health problems in future generations. It served to raise awareness of the extent of childhood obesity within a growing inland area with lower SES, high homogeneity, and greater presence of minorities. Our study hoped to aid efforts in elucidating the factors that place a vulnerable population at risk for developing childhood obesity. Future research focusing on similar settings is needed to enhance understanding of the complexities behind childhood obesity in such higher risk groups. This study implicates that further inquiry should focus on the specific habits of lower SES children which place them at higher risk for obesity, how to remedy negative neighborhood safety perceptions, and what specific factors lead to a higher BMI in a particular age group compared to others.
Footnotes
Funding:
The author(s) received no financial support for the research, authorship, and/or publication of this article.
Declaration of conflicting interests:
The author(s) declared no potential conflicts of interest with respect to the research, authorship, and/or publication of this article.
Author Contributions
All authors have made substantial contributions to this manuscript, which include the design, data collection and analysis, interpretation of data, drafting and editing the article, and final approval for publication.