
Abstract
Aim:
To help parents assess disability in their own children using World Health Organization (WHO) International Classification of Functioning, Disability and Health, Child and Youth Version (ICF-CY) code qualifier scoring and to assess the validity and reliability of the data sets obtained.
Method:
Parents of 162 children with spina bifida, spinal muscular atrophy, muscular disorders, cerebral palsy, visual impairment, hearing impairment, mental disability, or disability following brain tumours performed scoring for 26 body functions qualifiers (b codes) and activities and participation qualifiers (d codes). Scoring was repeated after 6 months. Psychometric and Rasch data analysis was undertaken.
Results:
The initial and repeated data had Cronbach α of 0.96 and 0.97, respectively. Inter-code correlation was 0.54 (range: 0.23-0.91) and 0.76 (range: 0.20-0.92). The corrected code-total correlations were 0.72 (range: 0.49-0.83) and 0.75 (range: 0.50-0.87). When repeated, the ICF-CY code qualifier scoring showed a correlation R of 0.90. Rasch analysis of the selected ICF-CY code data demonstrated a mean measure of 0.00 and 0.00, respectively. Code qualifier infit mean square (MNSQ) had a mean of 1.01 and 1.00. The mean corresponding outfit MNSQ was 1.05 and 1.01. The ICF-CY code τ thresholds and category measures were continuous when assessed and reassessed by parents. Participating children had a mean of 56 codes scores (range: 26-130) before and a mean of 55.9 scores (range: 25-125) after repeat. Corresponding measures were −1.10 (range: −5.31 to 5.25) and −1.11 (range: −5.42 to 5.36), respectively. Based on measures obtained at the 2 occasions, the correlation coefficient R was 0.84. The child code map showed coherence of ICF-CY codes at each level. There was continuity in covering the range across disabilities. And, first and foremost, the distribution of codes reflexed a true continuity in disability with codes for motor functions activated first, then codes for cognitive functions, and, finally, codes for more complex functions.
Conclusions:
Parents can assess their own children in a valid and reliable way, and if the WHO ICF-CY second-level code data set is functioning in a clinically sound way, it can be employed as a tool for identifying the severity of disabilities and for monitoring changes in those disabilities over time. The ICF-CY codes selected in this study might be one cornerstone in forming a national or even international generic set of ICF-CY codes for the benefit of children with disabilities, their parents, and caregivers and for the whole community supporting with children with disabilities on a daily and perpetual basis.
Introduction
No one is better qualified than parents to assess disabilities in their own children. This is stressed in the World Health Organization (WHO) International Classification of Functioning, Disability and Health, Child and Youth Version (ICF-CY), where a child with a disability is seen in the context of the family. 1 As the ICF concept still constitutes and is seen as a major tool to assess disability, 2 we pursued this strategy by collaborating with the parents of children with 8 different disabilities to validate their assessments by analysing psychometric and Rasch data on ICF-CY codes and qualifiers. We also aimed to create a common disability variable for each child generated only by parent assessment and that can provide information on that disability in and across health sectors. This could add valid information to the WHO International Statistical Classification of Diseases and Related Health Problems, 10th revision (ICD-10) codes as it could contribute to answering questions on not only which disease or disability is involved but also to what degree disability constitutes conditions in daily living.
Previous to this study, we have found that both body functions (b codes) and activity and participation (d codes) can form a common disability variable3–5 and that both b and d codes can be joined to cover disability in a simpler way. 6 These studies were based on visits and interviews with parents in their homes, with simultaneous scoring of code qualifiers by the researcher on agreement with parents.
We have communicated with the same group of parents by letter. We wanted to determine whether parents’ independent ICF-CY qualifier scores – repeated over a period of half a year – were understood by parents and were reliable, valid, and stable. Also, we sought to determine whether a minor set of 26 joined b and d codes related to everyday living could be well-functioning and sufficient for forming a generic data set for possible application in our daily clinical practice when dealing with children with various disabilities. To that end, both data sets were evaluated via psychometrics and Rasch analysis. We thus wanted to find ways to secure validity of data in future online application of an ICF-CY data set that will be employed with repeated scoring by parents whenever needed.
Methods
International Classification of Functioning, Disability and Health, Child and Youth Version
The WHO ICF-CY classification is a conceptual model encompassing health in the individual child and in a population of children with disabilities. It relates body functions (b codes), body structure (s codes), and activities and participation in daily living (d codes) to environmental factors (e codes) and personal factors. Personal factors are not yet defined by the WHO. Each of a total of 1400 different items is subdivided in first-level through fourth-level items with increasing detail. For example, first-level b2 stands for sensory functions and pain, b210 for seeing functions, and b2102 for quality of vision and the fourth-level b21022 stands for contrast sensitivity. Many codes do not have a defined fourth level, and some even have no third level. All codes applied here, however, do have a second level. Added to these are 7 different first qualifiers: 0 – no impairment, 1 – mild impairment, 2 – moderate impairment, 3 – severe impairment, 4 – complete impairment, 8 – not specified, and 9 – not applicable. For example, no problem with seeing functions is coded b210.0. According to the ICF-CY taxonomy, second and third qualifiers might be added. In this study, we employed body function b codes and activity and participation d codes only. Furthermore, we used second-level codes and first-level qualifiers only to keep answering as simple as possible.
Children with disabilities and qualifier-level wording
The children and their parents were followed clinically from diagnosis and intentionally including 16 years of age at the Department of Child Neurology, H. C. Andersen Children’s Hospital, Odense University Hospital. Parents of children with spina bifida, spinal muscular atrophy, muscular disorders, cerebral palsy, visual impairment, hearing impairment, mental disability, and disabilities following treatment for brain tumours were visited from 2010 to 2011 and interviewed in their own homes. Apart from parents to children that had reached 17 years of age or had died, the same parents were again contacted twice more by letter and asked to score their children’s disability on 26 selected codes with topics related to daily living from early morning until night, and qualifiers were worded in the same way as previously used 4 :
Child’s ability is as expected for his or her age.
Child has difficulties, but functioning is still in the expected range for his or her age.
Child needs help from another person with functions, activities, and participation.
Child needs help and care; the child has only limited ability with respect to body functions, activities, and participation.
Child is totally dependent on others for body functions, activities, and participation.
If the parents considered their children too young for a given task, they scored a 1, and if a task was too difficult despite being age appropriate, they scored a 5. For example, children with severe mental retardation irrespective of cause might not have school performance considered despite of age and had score 5. This approximation was done solely to keep data as simple as possible to handle.
The codes adopted were all second-level (out of 4) ICF-CY codes and were expressed in more general terms. They are presented in Table 1.
The 26 ICF-CY codes selected were all second-level (out of 4) codes.
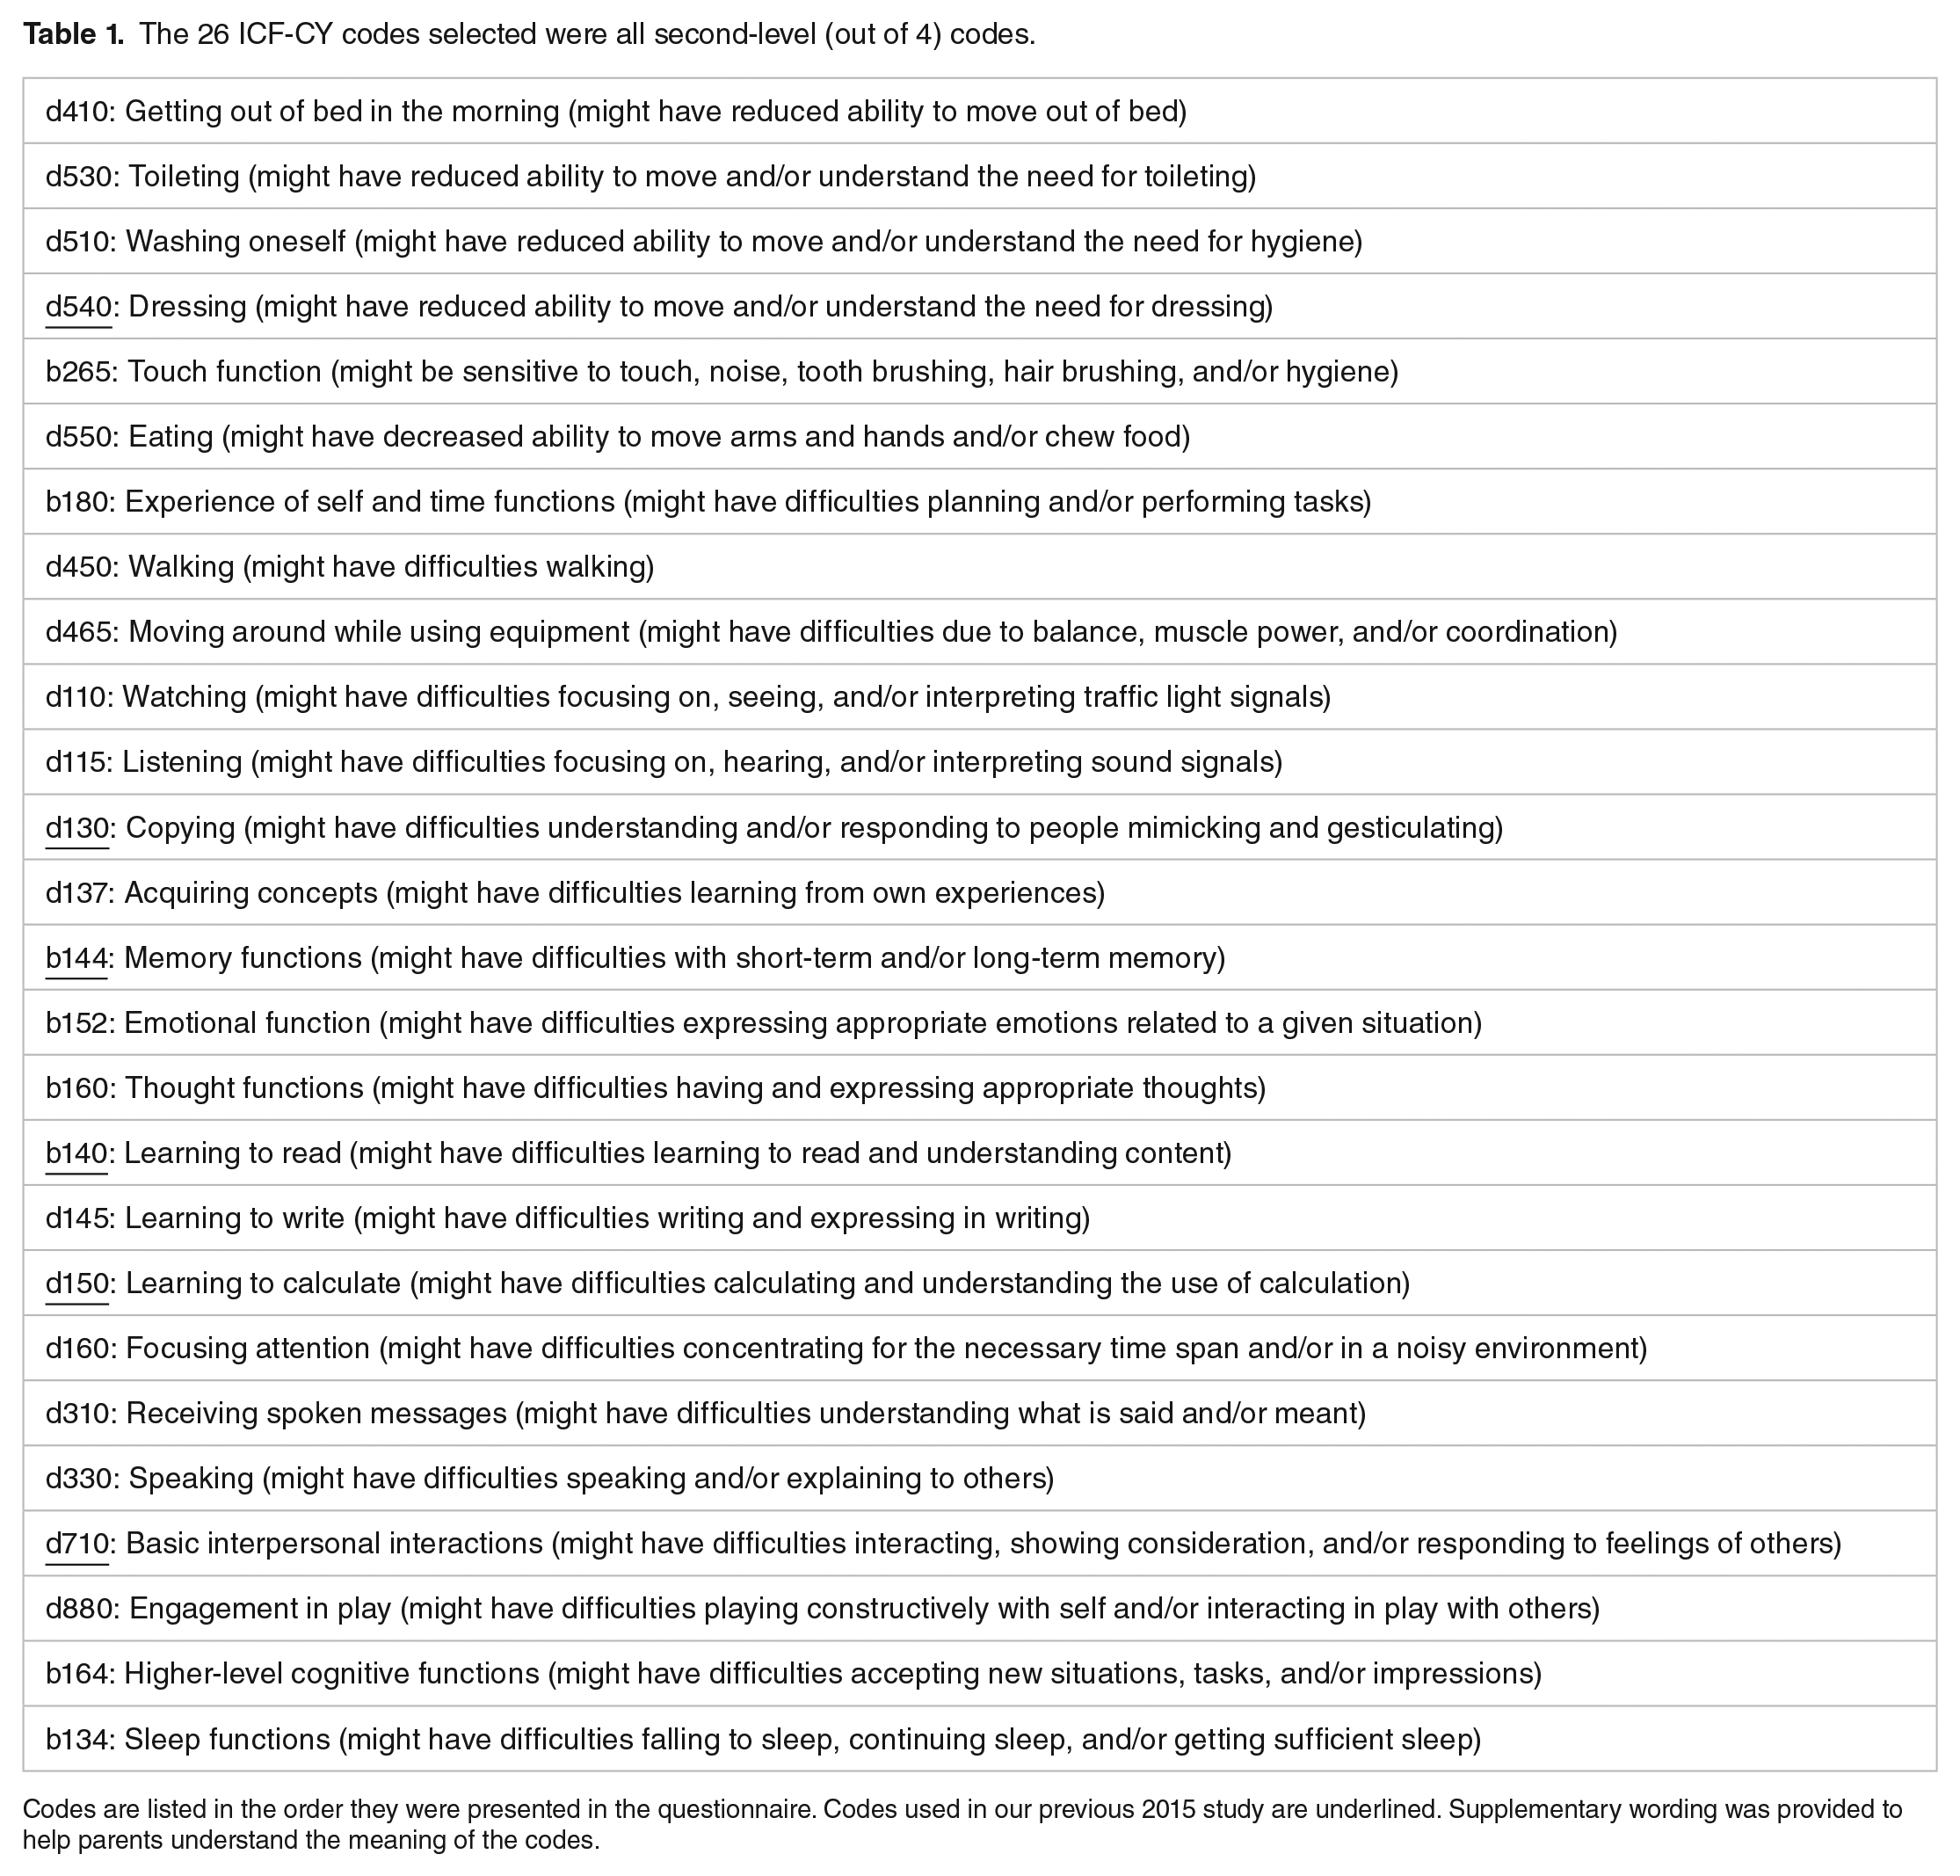
Codes are listed in the order they were presented in the questionnaire. Codes used in our previous 2015 study are underlined. Supplementary wording was provided to help parents understand the meaning of the codes.
Psychometric evaluation
Data targeting was estimated from the code scale’s midpoint, range, and observed scores with floor and ceiling effects. Reliability was estimated by Cronbach α coefficient, inter-code correlation, standard error (SE), and SE of measurement (SEM). Validity was estimated by corrected code-total correlations and Cronbach α:
Stata 14 (StataCorp, College Station, TX, USA) was used for data analysis.
Rasch modelling data
The model defines an individual’s probability of success (P) on a given item in terms of the difference between the individual’s disability (B) and the item difficulty (D). P = exp(B − D)/1 + exp(B − D) or logP/(1 − P) = B − D. The probability of success P can also be expressed as log(odds) = B − D or logit = B − D.
Rasch analysis was applied to all 5 qualifiers for the selected ICF-CY b and d codes. In practice, when a child’s level of disability is equal to a certain qualifier level, B and D are identical, and the derived log(odds) or logit value will be 0. For codes at which the child’s disability level is higher or lower, the relevant logit value will be positive or negative, respectively. A logit scale constitutes the latent disability construct or variable (also called a measure in Rasch terminology) for the joined b and d codes and qualifiers used.
The joined b and d code response categories should be ordered to imply an impact continuum. In the polytomous ICF-CY scale, 5 qualifiers with 4 Rasch-Andrich thresholds (τ1, τ2, τ3, and τ4) are defined. Each threshold is indicated by the equal probability of disability between 2 adjacent qualifiers.
The joined b and d codes should define a single disability variable. This can be tested by calculating how well the observed responses conform to the expected responses calculated using the Rasch model (logit = B − D). Conformity with the model is denoted by fit, which is expressed as infit and outfit. Infit statistics reflect the overall performance of the codes and decrease when the data appear to be too predictive. Infit statistics weight information (1/variance) and are less sensitive to unexpected scores. Outfit statistics are sensitive to rare outlier results or results that have occurred in an unexpected way. Both are expressed in terms of mean-squared values (MNSQs) (infit MNSQ and outfit MNSQ). The values should be near 1. Values greater than 1 are defined as under-fit and indicate other sources of variance that degrade the data. Values less than 1 are defined as over-fit and indicate that data are predicted too well. Mean-squared values are productive for measurements in the range of 0.5 to 1.5. Values in the range of 1.5 to 2.0 are nonproductive and do not disturb measurement, but values >2.0 may distort or degrade measurement and are misfit. It may be reasonable to retain a misfit joined b or d code if it is part of a stable continuum and is clinically meaningful.3,7–9 Standard error quantifies the precision of the measure obtained.
A child’s location on the disability continuum should be reliable and reproducible. There should be a high probability that children who have higher logits are actually more severely disabled than children who have lower logits.
Winsteps 3.74.0 was used for the Rasch measurements. 10
Ethical Considerations
Neither the Danish Ministry of Social Affairs nor the National Board of Health influenced the study protocol, data collection, data analyses, or results.
All of the eligible parents in a defined geographical area were contacted by mail for this study. The parents knew us. Participation was voluntary for the parents and caregivers. Parents were not contacted again if they did not respond spontaneously. Preferences of parents had no positive or negative influence on any treatment of their children. The protocol aimed at exploring ways of implementing ICF-CY in daily clinical practice was accepted by and registered at the Danish Data Protection Agency (DOK121763) before the start of the research. Approval for the protocol was sought from the National Board of Health (Project 7-202-05-207/8). In Denmark, Ethical Committee approval of such a project is not needed, as it is based on voluntarily answered questionnaires only. All parents have undersigned participation. Parents are given feedback on the publication of data.
Children were not contacted in this study, as we wanted to have parents’ opinions first and wanted to obtain a uniform assessment across disability severities. Many children for whom daily living was described would, due to age and/or disability, not be able to respond to questions covered in this research approach.
Results
Children with disabilities and ICF-CY codes
In 2010 to 2011, the parents of 332 children were visited in their own homes. Data from these visits, which were obtained through dialogue, constituted our basic analysis. 4 The second and third follow-ups occurred in May and November 2015, respectively, and involved written material where parents were left alone to score their children’s disabilities based on qualifiers. These data are presented here.
From 2011 to 2015, 55 children out of the original population of 332 children had reached the age of 16 years, 5 had died, 3 were declared healthy, 2 could not be reached, and 4 returned an incomplete questionnaire. Thus, in May 2015, 263 families had questionnaires forwarded by mail. Of those, 162 (61%) questionnaires were returned. In total, 33 children out of originally 63 children (52%) had a discharge diagnosis of spina bifida, 8 out of 8 (100%) had spinal muscular atrophy, 16 out of 36 (44%) had muscular disorders, 74 out of 157 (47%) had cerebral palsy, 5 out of 8 (63%) were visually impaired, 6 out of 13 (46%) were hearing impaired, 7 out of 11 (64%) had a mental disability, and 15 out of 36 (42%) had been diagnosed with and treated for brain tumours. The children’s mean age was 8.0 years (9.4 in 2010-2011) and the age range was 5.0 to 17.9 years (originally 1.0-15.9). In November 2015, the 162 families that had responded in May 2015 were again asked to participate and rate their children by exactly the same 26 codes and qualifiers. Of those, 120 (74%) participated.
The data sets analysed are as follows:
Data set A. 162 children were scored in May 2015.
Data set B. 120 children were scored again in November 2015.
Psychometric properties of 26 joined b and d code qualifier scores
Because joined b and d codes had previously shown good psychometric and Rasch properties with a measure correlation coefficient of 0.89, thus indicating coherence in measuring disability, 9 26 b and d codes were joined to represent issues in everyday life in a progressive order, from early morning to night (Table 1).
Psychometric properties of the b and d code qualifier scores were performed half a year apart (data sets A and B) and demonstrated good reliability with Cronbach α of 0.96 and 0.97 in data sets A and B, respectively. The mean (range) inter-code correlations were 0.54 and 0.76. The standard errors were 1.9 and 2.5. Validity was high with a mean corrected code-total correlation of 0.72 and 0.75, respectively. Data are presented in more detail in Table 2.
Qualitative data analysis of data set.

Abbreviation: CIs, confidence intervals.
Code number was 26. International Classification of Functioning, Disability and Health, Child and Youth Version qualifiers denoted 0 to 4 were registered as 1 to 5. Number of children participated in data set A was 162. Number of children participated in data set B was 120.
When qualifier score data were correlated on the basis of identical scores on the 2 occasions, the correlation coefficient was 0.90 (Figure 1).

Correlation of ICF-CY code score data on the 120 children who participated in both of the 2 scoring occasions, A and B. The red line represents the fitted line, and the dotted line equals x with y. ICF-CY indicates International Classification of Functioning, Disability and Health, Child and Youth Version.
Results of the Rasch analysis
The mean score for the children’s disability variable (measure) was −1.10, SD: 1.61 in data set A and 0.88, SD: 1.82 in data set B. The lowest score (least disabled child) was −5.31 (observed in data set A), and the highest score was 6.89 (observed in data set B, representing the most disabled child).
The mean τ’s of all 26 joined codes are ordered to indicate that the code qualifiers represent the increasing severity of disability (Table 3).
Structure calibration of 26 joined International Classification of Functioning, Disability and Health, Child and Youth Version b and d codes.
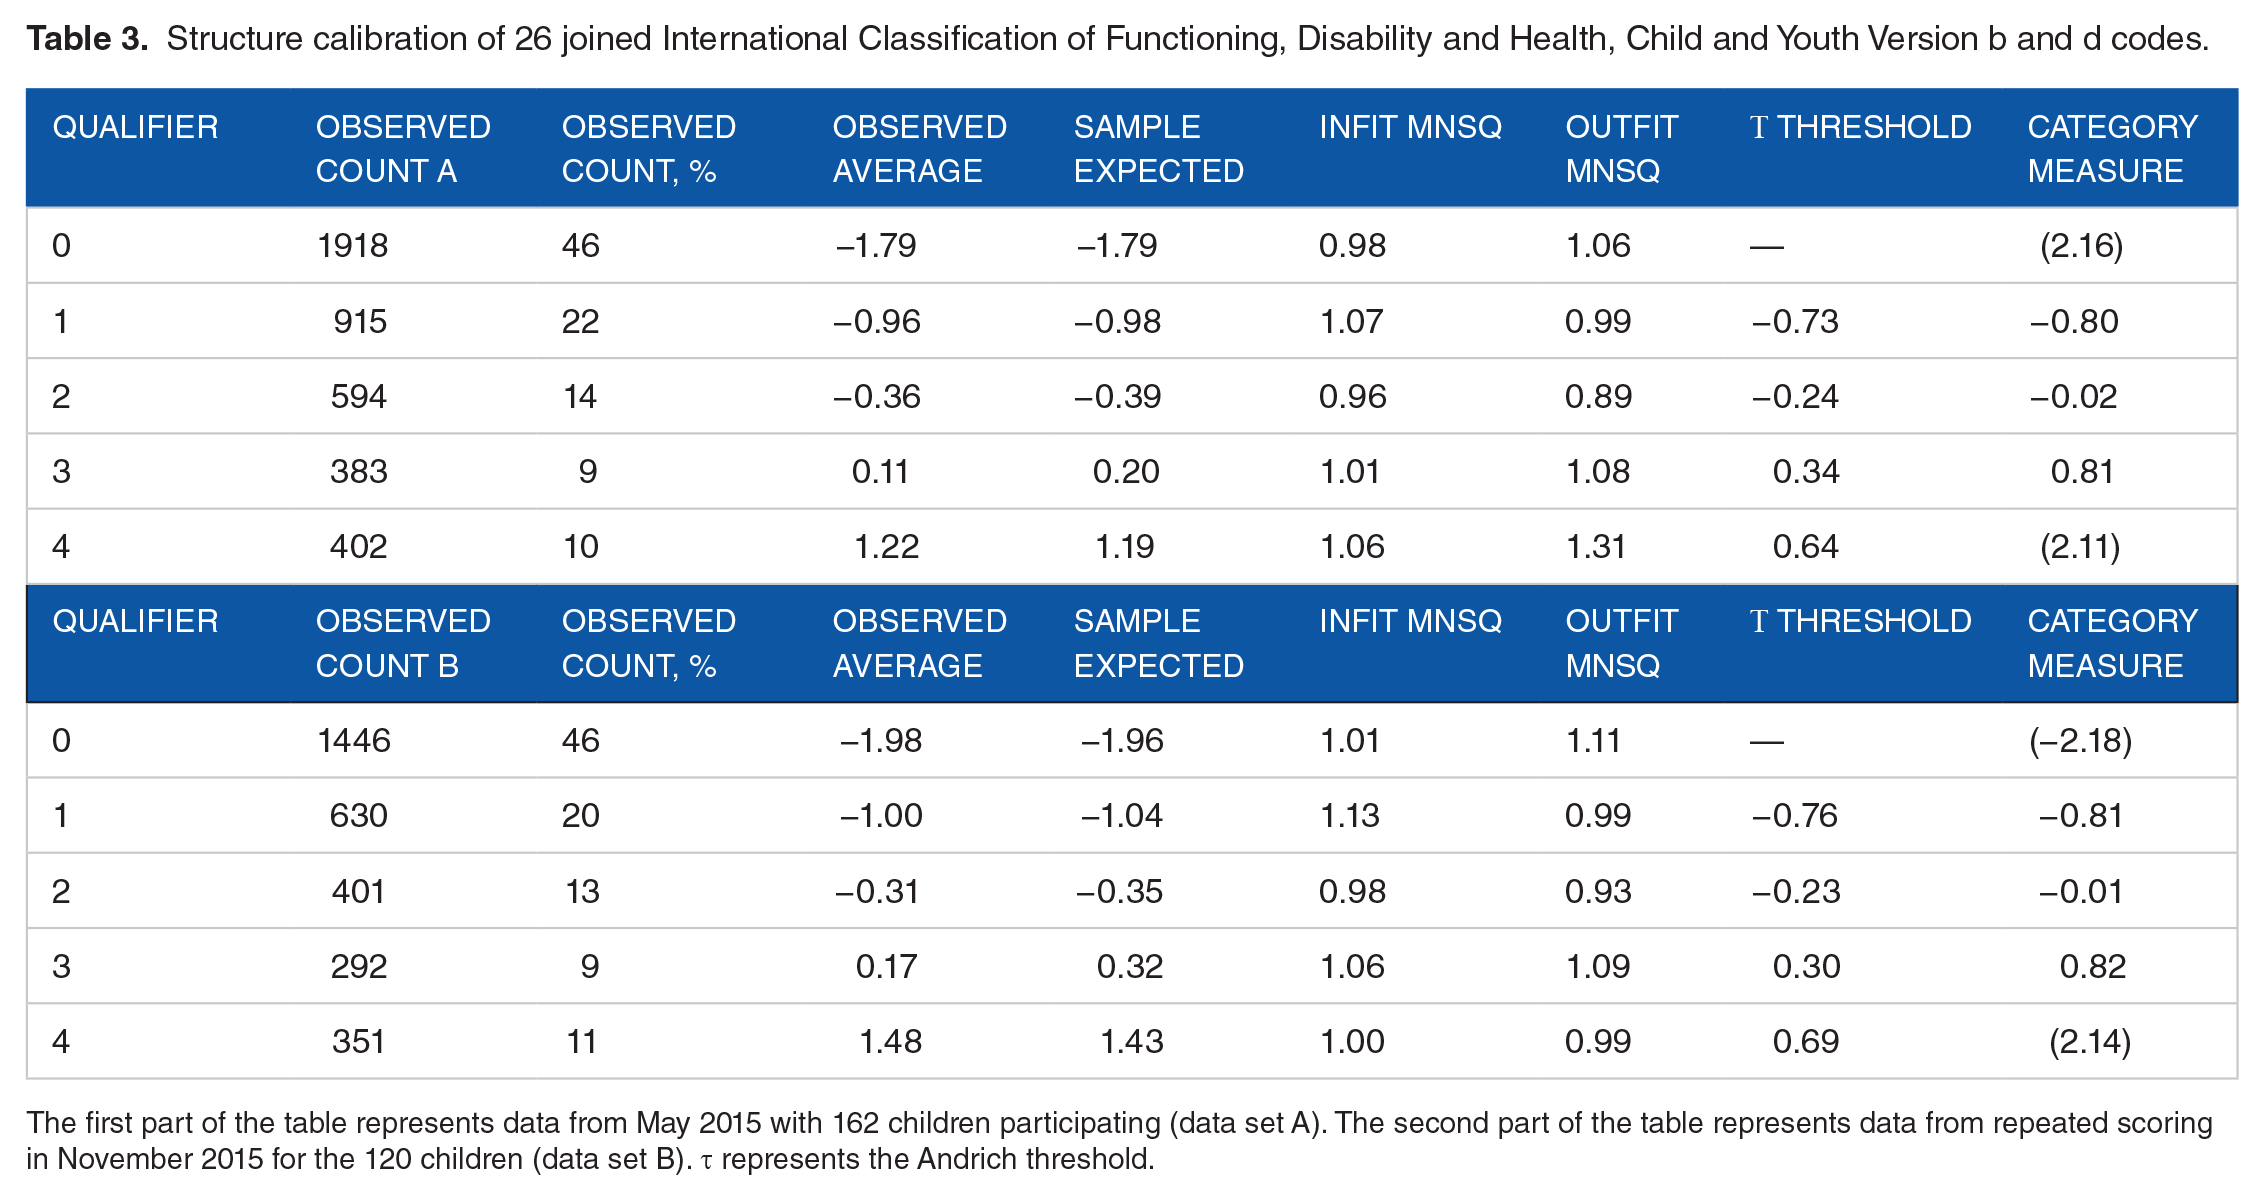
The first part of the table represents data from May 2015 with 162 children participating (data set A). The second part of the table represents data from repeated scoring in November 2015 for the 120 children (data set B). τ represents the Andrich threshold.
The Rasch ICF-CY code data from data set A had infit MNSQ >1.5 for codes b134 (1.94), d410 (1.74), and d465 (1.73) (data not shown). The outfit MNSQ for data sets A and B was >1.5, as shown in Table 4.
Measure and outfit MNSQ of 26 joined International Classification of Functioning, Disability and Health, Child and Youth Version b and d codes.

Abbreviation: MNSQ, mean-squared value.
Data from May 2015 with 162 children participating represent data set A. Data from repeated scoring in November 2015 for the same 120 children represent data set B. Measure unit is logits. Measure is arranged for increasing disability according to data set A.
Regarding the 162 participating children represented in data set A, 11 children had infit MNSQ >1.5 to <2.0 and 10 had infit >2.0, whereas 13 had outfit MNSQ >1.5 to <2.0 and 11 had outfit >2.0. Of those, 16 had both MNSQs >1.5.
The average SE on the children’s measure was identical for both data sets A and B.
Mean values for the children are represented in Table 5.
Code counts for the participating children.

Abbreviation: MNSQs: mean-squared values.
Mean and range () of score, measure, standard error (SE), infit, and outfit MNSQs. The first part of the table represents data from May 2015 with 162 children participating (data set A). The second table represents data from repeated scoring in November 2015 for 120 children (data set B).
When measure was correlated on the basis of identical scores on the 2 occasions, the correlation coefficient was 0.84 (Figure 2).

Correlation of Rasch measure data on 120 children that participated in both of the 2 scoring occasions: A and B. The red line represents the fitted line and the dotted line equals x with y. ICF-CY indicates International Classification of Functioning, Disability and Health, Child and Youth Version.
The child code map, illustrating the relationship between children’s placement and code placements, is illustrated in Figure 3A and B. Corresponding to data in Table 5, mean measure for children is −1.10 and −1.11 in data set A and data set B, respectively. Children’s measure seems to be fairly equally distributed, and codes d115, b265, d110, d710, d880, b164, and d140 remain in position relative to the mean when repeated. However, on repetition, some change occurs in position of other codes, where b134, b152, d130, d550, b160, b144, d310, d330, d137, b180, d145, d150, and d160 change position 1 bar up (more disability) relative to the mean. One bar represents a change in disability severity of 0.2 on the measure scale. Codes d410, d450, d540, d510, d530, and d465 take 2 to 3 and 3 to 4 bars up, the more the lower these codes are placed on the map. No codes have moved to a lower placement relative to the mean.

Child code map on Rasch data from (A) 162 children and 26 ICF-CY codes and (B) 120 children and 26 ICF-CY codes. Each X represents 1 child. M equals mean, S represents 1 standard deviation, and T represents 2 standard deviations. Each bar represents an interval on the measure scale of 0.2. ICF-CY indicates International Classification of Functioning, Disability and Health, Child and Youth Version.
The parents of 42 children (162 children − 120 children) did not answer the questionnaire the second time. As judged from the mean measure value of those children of −1.25, relatively more non-repeated answers were among parents to children with relatively less disability, as the mean from the total group of 162 children was −1.10.
We found highly different profiles on measure data according to the diagnoses of participating children (Figure 4, for data set B only).
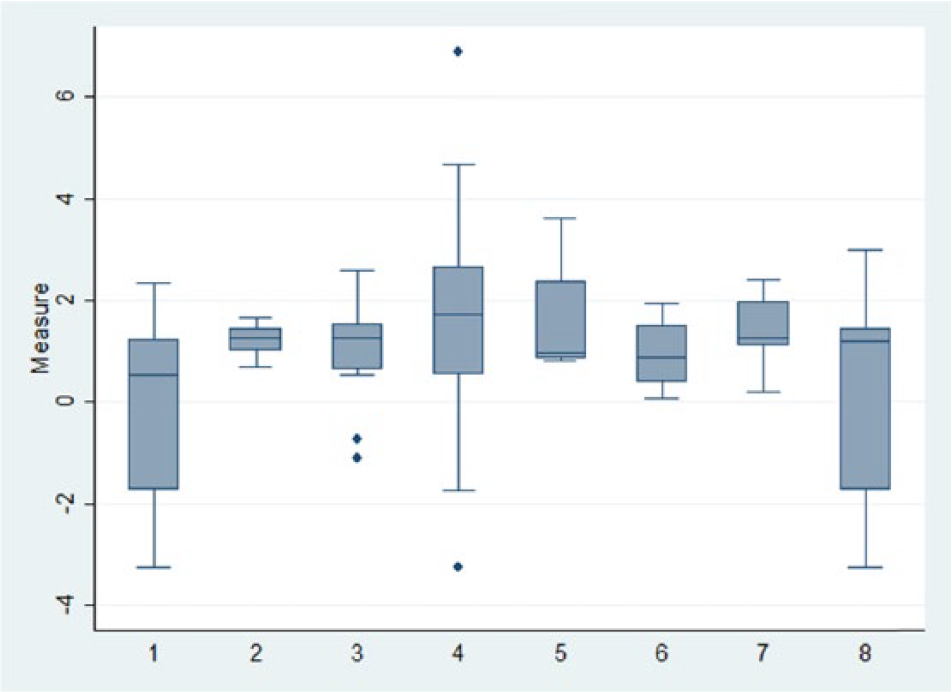
The distribution of measure is according to diagnoses. 1 – spina bifida, 2 – spinal muscular atrophy, 3 – muscular disorders, 4 – cerebral palsy, 5 – visual impairment, 6 – hearing impairment, 7 – mental disability, and 8 – disability following brain tumours. Boxes denote median, 25th and 75th percentiles. Adjacent lines denote lower and upper adjacent values and dots outliers. Data are from the repeated scoring (data set B) only.
Discussion
Although the WHO ICD-10 diagnosis codes are used to classify children with disabilities in clinical practice, the question of how much severity of the disability is repeatedly raised. Often in daily clinical practice, the medical doctor, the registered nurse, the social worker, the physiotherapist, and the occupational therapist must turn their attention from the medical record to the parents to ask for their opinion, and parents, for their part, might be a bit tired of answering such questions.
The WHO ICF-CY could be a valid and reliable tool for gathering information on childhood disabilities in a systematic way.11–15 It could also be useful for sharing information among health workers16–18 to help set rehabilitation goals 19 and repeat data sets for reliable measures, 20 as well as for monitoring purposes. 21 In this, parents and youths could well have a valuable role in providing valid data.22–24
Ideally, disability is capability and difficulties matched against task requirements. And mismatch equals disability. In ICF-CY terminology, as well as in daily practice, the environment of each child, as well as personal equipment, constitutes essential factors that must be addressed when analysing disability. Such factors were included in our previous approach where we visited families in their own homes. In the study presented here, these elements were not included but were implied by the parents. The reason for this was that too many factors to deal with in our previous experience would compromise answering. We wanted to keep answering on 26 items as simple as possible to obtain as valid as possible answers. In our future application, both environment factors and external assessors will be included.
In previous research, we have demonstrated the possibility of creating a disability variable – a measure – unique to each child which has been created from ICF-CY code qualifier scores and worded for greater clarity. 4 Furthermore, we have found that ICF-CY functioning b codes and activity and participation d codes could be mingled and still constitute a valuable variable. 6 The disability variable is a log measure, a numerical and continuous variable created by Rasch analysis from the categorical and ordinal variable that constitutes the ICF-CY code qualifiers. Therefore, this numerical variable can, in principle, be a more precise measure of the severity of a disability to differentiate better among children and to monitor changes in children’s disabilities over time. Furthermore, by creating the child code map based on the same Rasch measures, we have found some codes might express the same level of disability in our population of children, and some may therefore be omitted or exchanged for other codes as scorings are repeated. This opens the possibility for a new method of creating code data sets that cover a range of disabilities sufficiently and that can simultaneously be analysed for functionality and be understandable within a given population of children of different ages, diagnoses, disability severities, and sex.
However, it remains to be seen how well parents can independently assess and score their own children by means of the ICF-CY codes employed and how stable their qualifier scoring is over time. Furthermore, the 26 ICF-CY codes employed here are related regarding the different functions they represent and to access whether they could form a generic set of codes applicable in wider settings within the health sectors dealing with children with disabilities. The purpose of this study is to provide some insight into the matters mentioned, as we have collected a set of codes that resemble everyday living and are worded for greater clarity (Table 1).
First, parents’ independent assessments and code qualifier scoring demonstrate the good psychometric properties of the code qualifier scores. Targeting showed a mean of 56.00 and range of 26 to 130. The floor effect was 4.9% and the ceiling effect 0.0%. Reliability had Cronbach α of 0.98, and the inter-code correlation was 0.54 with a range of 0.23 to 0.91. Data were valid with corrected code-total correlations of mean: 0.72 and range: 0.49-0.83. Data thus seemed coherent and seemed to measure a common disability trait. When repeated after 6 months, data were stable (Table 2), and the correlation coefficient R was 0.90. However, some difference in parents’ scoring was observed among children with relatively more disability (Figure 1). Proper understanding of each qualifier was illustrated by no overlap and equal distance between τ thresholds (Table 3). The code measures placed the codes in an order of increasing disability severity, and the code MNSQ outfit measures had only 4 outliers >1.5, of which 1 was >2.0 (data set A in Table 4). The mean outfit MNSQ was satisfactory, with a value of 1.01.
The children’s data obtained from parents’ independent assessments of their own children had a mean measure of −1.10, a mean infit MNSQ of 1.07, and a mean outfit MNSQ of 1.05, meaning that, on average, children were scored properly despite a considerable range of measure score, thus a range of disability was calculated (data set A in Table 5). However, 10 children (6%) had an unacceptable infit MNSQ greater than 2.0, and 10 (6%) had an outfit MNSQ greater than 2.0. Such misfits were observed among children with both high-negative and high-positive measures, indicating that the healthiest and the most disabled children were more difficult to assess by the parents.
Second, data set B of 120 children (the same children from data set A with a repeated assessment after 6 months) all showed stable and almost identical measures of mean −1.11 and code outfit MNSQ values (data set B in Table 5). The range of measure was identical, meaning that the healthiest and the most disabled children were still participating. The children’s average measure and average infit and outfit MNSQ values were also fairly stable (data set B in Table 5). This indicates that repeated assessments by parents seem stable.
A period of 6 months between scores might be shorter to better register possible change in disability in individual children. This could be better addressed with future online registering whenever changes do occur.
However, there remains some difference in parents’ assessments, as there seems to be a greater discrepancy among the more disabled children between the 2 assessment occasions. This is seen in Figure 1. When measure is analysed, this difference seems to be less pronounced apart from a few outlier assessments. When looking at the child code maps (Figure 3A and B), it is observed that some codes activated among children with less disability drift toward higher levels after 6 months, as if fewer children with less disability were not assessed again after 6 months. This might be underscored by the fact that although mean measures were almost identical on the 2 occasions, the mean measure of the 42 children omitted from the second assessment had a lower measure mean of −1.25.
Third, relationships of the codes employed overall hints to the fact that the disability variable or measure in Rasch terminology might have a common value. This is illustrated by high corrected code-total correlation of mean 0.72 and inter-code correlation of mean 0.54 (Table 2). Also, ICF-CY code Rasch data hint to coherence with proper τ thresholds, category measure, infit and outfit properties, and a coherent and continuous range of measures as visually illustrated in the child code maps in Figure 3A and B. Although minor gaps are present, the codes employed cover a fairly continuous range over different disabilities and ensures disabilities of various severities are properly measured.
It is also seen that ICF-CY codes employed here (Table 1) dealing with motor functions (such as d465 – moving around, d450 – walking, and d540 – dressing) are activated among children with minor disability, codes dealing with more complex tasks (such as d137 – acquiring concepts and d880 – engagement in play) are activated among children with more disability, and codes dealing with more severe disability are activated last (such as d550 – eating). This is in accordance with familial experience and clinical practice where children with motor difficulties alone are less disabled than children with added cognitive difficulties and most disabled when more complex tasks are compromised. Derived hereof, ICF-CY codes dealing with these entities are placed together in the child code map (Figure 3A and B).
Regarding creating a generic set of ICF-CY codes for children with disability, such sets should be useable and purposeful across and within different health sections and likewise meaningful to a defined group of patients.18,25 In this case, the ICF-CY code set employed could be a candidate first and foremost because code data represent familial daily living and clinical experience and practice in a meaningful way and can be reproduced. In this study, we have chosen codes and wordings that are kept as simple as possible. This has been done by asking the parents to reflect on the degree of help their child needs in daily living. Using such a basic concept, we believe that it is applicable to all children with disability. But at the same time, the concept does not reveal in any further detail what this help is about. The ICF-CY concept gives ample opportunities to describe further details in coming studies.
We did not compare measures obtained with data from other assessment tools, as we first wanted to study the generalizability of ICF-CY codes across different diagnoses. Furthermore, other questionnaires might not function properly across the range of children participating in this study. 26 Future research should address this issue. However, one can get an idea of how each different diagnosis stands out against the others by comparing data on measures as illustrated in Figure 4. It is here seen that more complex disabilities, such as spina bifida, muscular disorders, disability following brain tumour, and especially cerebral palsy contain the greatest range of disability, whereas less complex disabilities, such as spinal muscular atrophy and mental disability, are more coherent in the range of disability.
Strengths of his study are that the approach chosen seem simple to apply, and data can be and should be validated by Rasch analysis to keep track on the validity of simplicity and function in different settings including application to children in developing countries.
Limitations are that the ICF-CY code set is not validated before this study was undertaken but only on the basis of the data set obtained. Age, gender, appliances, socioeconomic issues, demographic issues, and other ICF-CY components are not yet included. Parent’s assessment of their own children relative to what they consider normal development is not addressed yet. Furthermore, comparisons with many other relevant scales are not included nor are ICD-10 associated diagnoses for further detailed description of disability in each child.
In conclusion, it still seems important to consider applications in daily clinical practice of a relatively small set of second-level and joined ICF-CY functioning and activity and participation codes that relate to daily living are qualifier-worded, well understood, and meaningful. Furthermore, it is important to entrust parents to perform independent and repeated assessments and scoring using ICF-CY codes. This approach could provide valid and reliable assessments of children with disabilities. It could be a first step contributing to forming a national and international generic set of ICF-CY codes and would be valuable to join these codes to WHO ICD-10 to promote communication between health sectors and parents. This is in accordance with the basic idea behind the WHO ICF-CY system. Repeated data sets can undergo psychometric and Rasch analyses related to each child and groups of children, and quality surveillance, goal setting for rehabilitation, efficacy registration, and treatment monitoring can be strengthened for the benefit of children with disabilities and their parents.
Footnotes
Peer review:
Four peer reviewers contributed to the peer review report. Reviewers’ reports totalled 1992 words, excluding any confidential comments to the academic editor.
Funding:
The author(s) disclosed receipt of the following financial support for the research, authorship, and/or publication of this article: This study was funded by the Danish Ministry of Social Affairs partnership project §16, 21, 31 administered by the National Board of Health.
Declaration of conflicting interests:
The author(s) declared no potential conflicts of interest with respect to the research, authorship, and/or publication of this article.
Author Contribution
NOI has contacted parents, obtained score data, performed data analysis and drafted manuscript. KOG has contributed to data design and analysis, reviewed data analysis and reviewed and accepted manuscript.