
Abstract
Background:
Detection rate and isolation yield of circulating tumor cells (CTCs) are low in lung cancer with approaches due to CTC invasiveness and heterogeneity. In this study, on the basis of the epithelial cell adhesion molecule (EpCAM) phenotype, markers of vimentin and epidermal growth factor receptor (EGFR) phenotype were added to jointly construct a precise and efficient CTC capture system for capture of lung cancer CTCs.
Methods:
A CTC capture system combined with EpCAM lipid magnetic bead (Ep-LMB)/vimentin lipid magnetic bead (Vi-LMB)/EGFR lipid magnetic bead (EG-LMB) was constructed, and its performance was tested. The amount of CTC captured in the blood of patients with lung cancer was detected by immunofluorescence identification and analyzed for clinical relevance.
Results:
The constructed CTC capture system has low cytotoxicity. The capture efficiency of lung cancer cells in phosphate belanced solution (PBS) system was 95.48%. The capture efficiency in the blood simulation system is 94.55%. The average number of CTCs in the blood of patients with lung cancer was 9.73/2 mL. The quantity distribution of CTCs is significantly correlated with tumor staging and metastasis. The area under the curve (AUC) of CTCs for the diagnosis of lung cancer was 0.9994 (95% CI = 0.9981-1.000, P < .0001). The cutoff value was 4.5/2 mL. The sensitivity was 99.39%, and the specificity was 96.88%.
Conclusion:
The EpCAM/vimentin/EGFR combined capture system has feasibility and high sensitivity in the detection of lung cancer CTC typing, which can be used as an auxiliary diagnostic indicator for lung cancer and is expected to promote the clinical application of CTCs.
Introduction
Lung cancer is one of the malignant tumors with the highest incidence rate in the world. The incidence rate of lung cancer is 14%, and the mortality rate is 18%. 1 Although lung cancer is sensitive to radiotherapy and chemotherapy, it recurs rapidly, and the 5-year survival rate of patients is less than 10%.1,2 Circulating tumor cells are tumor cells released from the primary tumor site into the blood circulation, which play a very important role in the development of tumors. 3 Studies have found that the formation of circulating tumor cells (CTCs) is related to epithelial-mesenchymal transformation (EMT). Under the regulation of EMT-related transcription factors, tumor cells located in the original site cause the down-regulation of epithelial cell adhesion molecule (EpCAM), cytokeratin (CK), and epithelial specific proteins, while the up-regulation of vimentin, N-calmodulin, and mesenchymal-specific proteins.4,5 The CTCs entering the blood circulation experience various challenges and only a very small number of cells survive. The surviving CTCs undergo mesenchymal-epithelial transition after reaching their destination, forming metastases. 6 Therefore, efficient identification of CTCs disseminated through blood circulation and timely and accurate detection of very few and different phenotypes of CTCs are crucial for early tumor detection, successful tumor treatment, and improved patient survival.
The existence of CTCs is closely related to the occurrence and development of tumors. 7 However, the abundance of CTCs in blood is extremely low. It is a challenge to detect CTCs, especially in the early stage of metastasis. It is difficult to identify and capture a very small number of tumor cells from blood samples obtained by patients. 8 At present, various fields are developing different CTC capture technologies, including density gradient centrifugation, cell filtration, cell adhesion, immunomagnetic bead, nanomatrix separation, and microfluidic chip methods.9,10 Among them, immunochemistry-based magnetic nanoparticles can recognize and capture CTCs in whole blood with high efficiency and high selectivity.11,12 CellSearch system is the only clinical CTC testing system approved by the US Food and Drug Administration (FDA). CellSearch is a technology based on antibody-coated magnetic nanoparticles coupled with EpCAM to capture CTCs. However, CellSearch has great limitations, such as the inability to capture CTCs lacking EpCAM expression or CTCs that have undergone EMT, which limits the clinical application of this technology.13,14 Therefore, more CTC capture can only be achieved by binding to magnetic beads modified with multiple specific protein antibodies.
Studies have shown that vimentin is highly expressed in a variety of tumor cells, especially in tumor cells that undergo EMT. 15 In addition, epidermal growth factor receptor (EGFR) protein is highly expressed in lung cancer tumor tissues.16,17 Therefore, vimentin and EGFR have potential clinical application value in the enrichment of lung cancer CTCs and can serve as potential targets for capturing lung cancer CTCs. This study developed a precise and efficient capture system for lung cancer CTCs based on the occurrence of EMT and EGFR expression, which is used for the specific targeted rapid separation and detection of lung cancer CTCs. The capture efficiency of lung cancer CTCs by using EpCAM, vimentin, and EGFR 3 kinds of LMBs, respectively, and the capture efficiency of 3 kinds of magnetic beads at the same time were compared, and CTCs were captured in the blood of patients with lung cancer in clinical samples. In this study, we investigated the clinical application value of CTC capture system in lung cancer and provided technical references for auxiliary diagnosis, efficacy assessment, judgment of prognosis, and detection of micrometastasis in patients with lung cancer.
Material and Methods
Sample source
From March 2021 to April 2023, 185 patients were treated in The Second Affiliated Hospital of Fujian Medical University, including 136 cases of lung adenocarcinoma, 27 cases of lung squamous cell carcinoma, and 22 cases of high-risk population (HRP) (benign pulmonary nodules/lesions, etc). In this study, 2 mL of patient’s blood was collected using a medical anticoagulation blood collection tube, and the anticoagulant was ethylene diamine tetraacetie acid (EDTA)▪K2, which was stored and transported at 4°C, and was performed to detect CTCs in the blood within 72 hours. At the same time, blood samples of 32 healthy people were collected as a control study. This study was approved by the Ethics Committee of The Second Affiliated Hospital of Fujian Medical University ([2020] Ethical Review No. (61) of The Second Affiliated Hospital of Fujian Medical University), and all the selected cases fulfilled the obligation of informing and signed the informed consent.
Material and instruments
Human lung cancer cell lines (A549, H1975, H460, H446) and human umbilical vein endothelial cell line (HUVEC) were purchased from the Shanghai Cell Bank of the Chinese Academy of Sciences. Fe3O4 solution, carboxymethyl chitosan hexadecyl quaternary ammonium salt (HQCMC), 1,2-dioleoylphosphatidylcholine (DOPC), and dimethyloctadecylglycidyl ammonium chloride (GHDC) were purchased from Huzhou Lieyuan Medical Laboratory Co, Ltd dulbecco’s modification of eagle’s medium dulbecco (DMEM)/1640 medium, fetal bovine serum, and trypsin were purchased from Gibco. Epithelial cell adhesion molecule, vimentin, and EGFR antibodies were purchased from eBioscience. Cholesterol, dichloromethane, N-hydroxysuccinimide (NHS), 1-ethyl-3-(3-dimethylammoniumpropyl) ammonium carbonate (EDC), and other common reagents were purchased from Sinopharm Group. Prussian blue staining kit was purchased from Solarbio.
Preparation of lipid magnetic beads
First, cholesterol (20 mg), DOPC (10 mg), HQCMC (15 mg), and dichloromethane (1 mL) were added to a pear-shaped vial, respectively, followed by the addition of 1 mL of Fe3O4 (72.8 mg/mL) solution and mixing, and finally the addition of 6 mL of PBS. The mixed solution was ultrasonically oscillated; the ultrasonic power was set to 27%; the temperature was 25°C; and the total time was 6 minutes. After the ultrasound was completed, the solution was rotated and evaporated for 30 minutes to remove dichloromethane and obtain an aqueous solution of LMB. Dissolve 1 mg of GHDC in 1 mL of isopropanol, dissolve 60 µg of EpCAM/vimentin/EGFR antibody in 1 mL of GHDC solution, add coupling agents NHS and EDC, and let stand overnight at 4°C. Dissolve 1 mL EpCAM GHDC/vimentin GHDC/EGFR GHDC in 1 mL LMB, vortex for 5 minutes, and store at 4°C. Vortex once every 1 hour for 24 hours to obtain EpCAM, vimentin, and EGFR antibodies modified LMB, named EpCAM lipid magnetic bead (Ep-LMB), vimentin lipid magnetic bead (Vi-LMB), and EGFR lipid magnetic bead (EG-LMB), respectively.
Characterization test
After taking 20 μL of sample solution and adding it to 1 mL of distilled water for dilution, the particle size and potential of the samples were tested by using a BI-90Plus laser particle sizer. The ultraviolet (UV) absorption spectra of the samples were measured by UV spectrophotometer. In total, 50 μL of the sample dilution was applied to the mica sheet, and the morphology of the sample was observed by atomic force microscopy (AFM). Freeze-dried 1 mL sample was prepared, and the infrared spectrum was tested by Fourier transform infrared (FT-IR) spectroscopy on Bio-Rad FTS 6000 spectrometer.
Cytotoxicity
Lung cancer cells were cultured in DMEM containing 10% fetal bovine serum and 1640 medium at 37°C in a constant temperature incubator with 5% CO2. Add 8000 cells in a 96-well plate, and when the cells grow to 80%, add Ep-LMB, Vi-LMB, and EG-LMB containing different concentrations and continue to culture for 24 hours. Add 20 μL of 2,5-diphenyltetrazolium bromide (MTT) (5 mg/mL) reagent, incubate in a carbon dioxide incubator for 3 hours, and finally add 150 μL of dimethyl sulfoxide (DMSO) solution to dissolve the formed blue-purple crystal formazan. Read in a microplate reader and analyze the experimental results (wavelength is 490 nm), and do 3 parallel tests for each group.
Distribution of LMB on the cell surface
A549, H1975, H460, H446, and HUVEC cells were prepared into single-cell suspensions and counted, respectively. In total, 100 cells were added to 2 mL of PBS solution to simulate CTC suspensions, which were captured with prepared LMB, Ep-LMB, Vi-LMB, and EG-LMB magnetic beads, respectively, and stained with Prussian blue stain, and observed under a fluorescence microscope.
Exploration of cell capture time
1 × 10⁴ A549 cells were inoculated in culture dishes and cultured at 37°C, 5% CO2 for 24 hours. In total, 20 μL Ep-LMB-fluoresceine isothiocyanate (FITC), Vi-LMB-FITC, and EG-LMB-FITC were added to the cells, respectively, and 100 μL 4’,6-diamidino-2-phenylindole (DAPI) and 100 μL 1,1’-dioctadecyl-3,3,3’,3’-tetramethylindocarbocyanine perchlorate (Dil) were added to mix the staining at the same time. The cell culture dish was fixed on a fluorescence microscope and observed and photographed by fluorescence microscope at 0, 5, 10, 15, and 20 minutes, respectively.
Detection of cell capture efficiency
A549 cells were prepared into single-cell suspensions and counted, and 100 A549 cells were added to 2 mL PBS solution, respectively. Epithelial cell adhesion molecule lipid magnetic bead, Vi-LMB, and EG-LMB groups: 6, 9, 12, 15, and 18 μL magnetic beads were added to 2 mL cell suspension, respectively; Ep-LMB + Vi-LMB + EG-LMB group: Mix Ep-LMB, Vi-LMB, and EG-LMB according to the volume ratio of 1:1:1, and add 6, 9, 12, 15, and 18 μL Ep-LMB + Vi-LMB mixed solution, respectively; Ep-LMB/Vi-LMB/EG-LMB group: First add 2, 3, 4, 5, and 6 μL Ep-LMB for capture, then add 2, 3, 4, 5, and 6 μL Vi-LMB for capture, and finally add 2, 3, 4, 5, and 6 μL EG-LMB for capture; Ep-LMB/EG-LMB/Vi-LMB group, Vi-LMB/Ep-LMB/EG-LMB group, Vi-LMB/EG-LMB/Ep-LMB group, EG-LMB/Ep-LMB/Vi-LMB group, and EG-LMB/Vi-LMB/Ep-LMB group are the same as Ep-LMB/Vi-LMB/EG-LMB group: Add 2, 3, 4, 5, and 6 μL magnetic beads in sequence, and each group has 3 repetitions. Blood replaces PBS solution to perform the capture experiment of CTCs in simulated blood. Using the Ep-LMB/Vi-LMB/EG-LMB capture protocol, HUYEC, A549, H1975, H460, and H446 cells were adjusted to different cell gradients of 10, 50, 100, 500, 1000, 5000, and 10 000 cells. The sensitivity of this protocol was studied in the PBS system, and the specificity of this protocol was studied in a simulated blood system. Finally, magnetic beads with antibody content of 0, 20, 40, 60, 80, and 100 μg were used to capture A549 cells in gradients, respectively, and the capture efficiency of magnetic beads with different antibody content on cells was investigated in PBS system and simulated blood system, respectively.
Isolation and identification of CTCs in blood
Collect 2 mL of the subject’s blood sample, add 5 mL of Ep-LMB/Vi-LMB/EG-LMB in sequence, and incubate for 15 minutes. After the incubation is completed, insert the centrifuge tube into the magnetic separation rack for adsorption for 10 minutes, suck out the blood, and add 20 mL CK8/18/19-FITC, DAPI staining solution, CD45-phycoerythrin (PE), dark staining for 15 minutes; after staining, add 1 mL dd H2O to wash twice, and finally add 20 µL dd H2O to the centrifuge tube and mix evenly. Spread the mixture evenly on the poly-lysine-treated detachment-proof glass slide and wait for the droplet to dry naturally. After drying, observe and count under a fluorescent microscope, and perform statistical analysis on the counting results and clinical information. When plotting the receiver operating characteristic (ROC) curve, the one with the largest positive likelihood was chosen as the best screening cutoff values.
Statistical processing
All statistical analyses in this study were performed using statistical product and service solutions (SPSS) 21.0 software. The measurement data of normal distribution were expressed as mean ± standard deviation (x ± s). The analysis of variance of repeated measurement design was used in the comparison of repeated measurement data. One-way analysis of variance was used for comparison between groups. The difference was statistically significant with P < .05 (*); P < .01 indicates extremely significant differences (**).
Results
Detection procedure
In this study, LMB was prepared by reverse evaporation method and coupled with EpCAM/vimentin/EGFR antibody, Ep-LMB, Vi-LMB, and EG-LMB were successfully prepared, respectively, which were used to capture CTCs in the blood of subjects. After immunofluorescence staining, the captured CTCs were identified and counted by fluorescence microscope (Figure 1).

Flow chart of preparation of LMB and separation and identification of CTCs.
Characterization test analysis
The average particle size of Ep-LMB was 111.52 ± 6.29 nm, and the polydispersity index (PDI) was 0.108 (Figure 2A); the average particle size of Vi-LMB was 106.33 ± 4.47 nm, and the PDI was 0.129 (Figure 2C); the average particle size of EG-LMB was 118.41 ± 4.82 nm, and the PDI was 0.175 (Figure 2E). The charge of Ep-LMB was +16.52 mV (Figure 2B). The charge of Vi-LMB was +8.11 mV (Figure 2D). The charge of EG-LMB was +11.93 mV (Figure 2F). Epithelial cell adhesion molecule lipid magnetic bead, Vi-LMB, and EG-LMB have absorption peaks at 260 to 280 nm, which have the characteristics of protein UV absorption (Figure 2G). In the FT-IR spectra of Ep-LMB, Vi-LMB, and EG-LMB, new peaks appear at about 2840 to 2930 cm−1; these peaks are due to the long carbon chain and methyl group on the quaternary ammonium salt, indicating that in GHDC exists on Ep-LMB, Vi-LMB, and EG-LMB, and GHDC is coupled to EpCAM, vimentin, and EGFR, which indirectly indicates that EpCAM, vimentin, and EGFR antibodies have been coupled to Ep-LMB, Vi-LMB, and EG-LMB surface (Figure 2H). The observation results of atomic force microscope (Figure 2I-K) show that Ep-LMB, Vi-LMB, and EG-LMB are all spherical in different sizes, with regular shape and no agglomeration, indicating good stability and vesicular characteristics of liposomes.

Characterization test of LMB. (A) Particle size distribution of Ep-LMB. (B) Potential distribution of Ep-LMB. (C) Particle size distribution of Vi-LMB. (D) Potential distribution of Vi-LMB. (E) Particle size distribution of EG-LMB. (F) Potential distribution of EG-LMB. (G) UV test results. (H) Infrared test results. (I) AFM observation chart of Ep-LMB. (J) AFM observation chart of Vi-LMB. (K) AFM observation chart of EG-LMB.
Cytotoxicity
Ep-LMB, Vi-LMB, and EG-LMB have little effect on the activity of different cancer cells, and the cell survival rate gradually decreases with the increase in LMB concentration. Select 50 μg/mL as the safe use concentration of LMB, the cell survival rate is above 90% at this safe use concentration, and it has low cytotoxicity (Figure 3A-D).
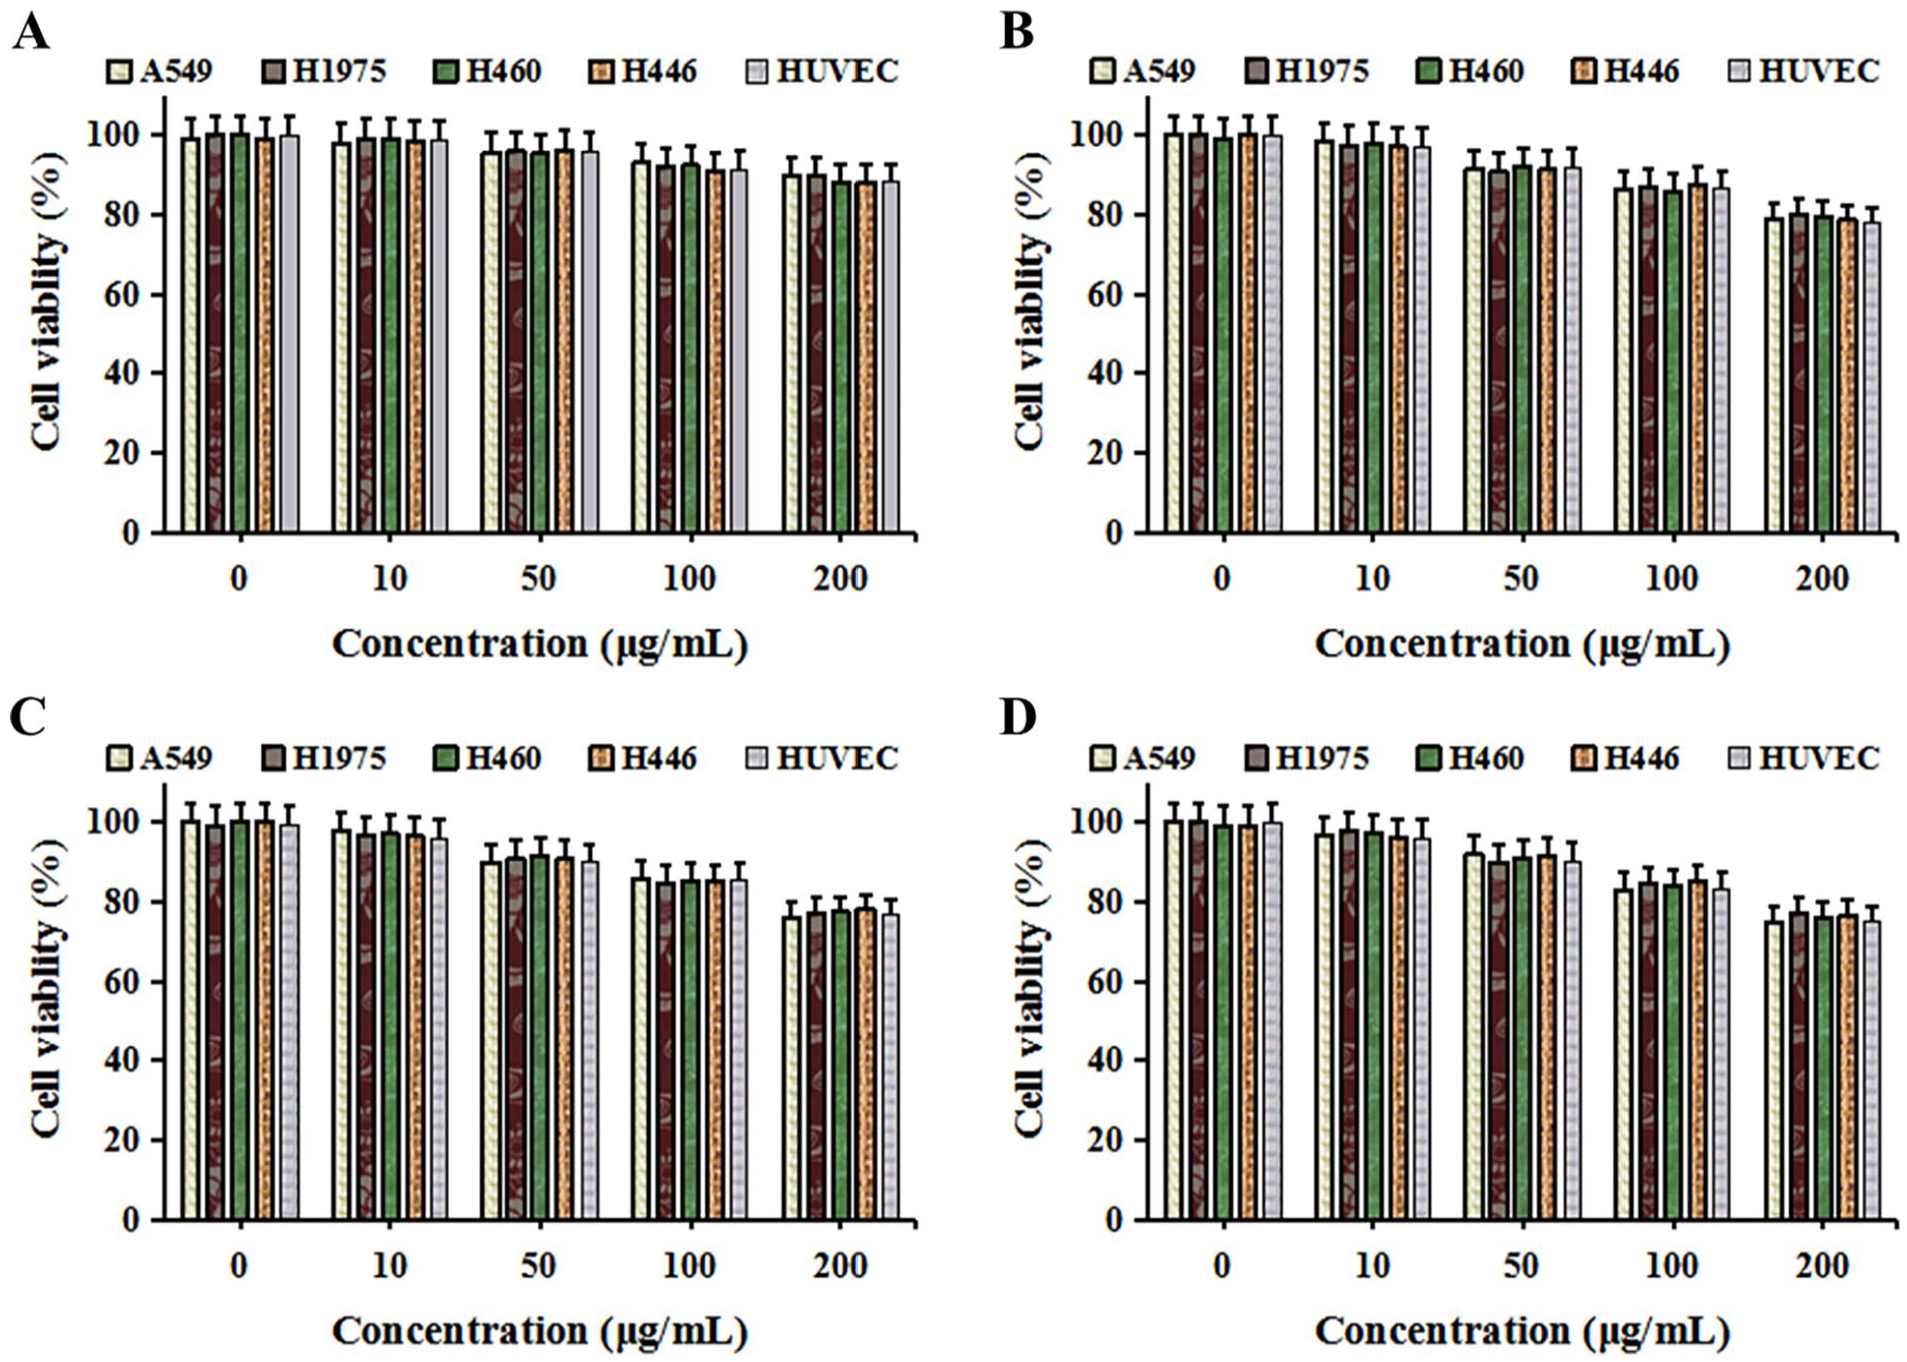
Effect of LMB to cell. (A) Effect of LMB to cell activity. (B) Effect of Ep-LMB to cell activity. (C) Effect of Vi-LMB to cell activity. (D) Effect of EG-LMB to cell activity.
Exploration of the distribution and binding time of LMB on cell surface
LMB has no ability to recognize cells and is irregularly distributed on and around the cell surface. Epithelial cell adhesion molecule lipid magnetic bead, Vi-LMB, and EG-LMB can all target and recognize tumor cells, and mainly attach to the cell surface, indicating that Ep-LMB, Vi-LMB, and EG-LMB have the ability of target recognition (Figure 4A). Add Ep-LMB, Vi-LMB, and EG-LMB to the culture dish after being labeled with FITC fluorescence, respectively. With the prolongation of incubation time, the FITC fluorescence signal in cells gradually increases, indicating that with the prolongation of time, the LMB on the cell surface gradually increases. The incubation time can achieve the best effect at the 15th minute (Figure 4B-D).

Distribution of LMB on the cell surface and exploration of binding time of LMB to cells. (A) Prussian staining results after LMB targeted recognition of tumor cells. (B) Staining of Ep-LMB-FITC after binding to A549 cells for different times. (C) Staining of Vi-LMB-FITC after binding to A549 cells for different times. (D) Staining of EG-LMB-FITC after binding to A549 cells for different times (DAPI blue, FITC green, and Dil red).
Capture efficiency detection
Under the condition of the same cell concentration and the same amount of magnetic beads, the capture efficiency of A549 cells by sequentially adding 3 kinds of magnetic beads was higher than that of single magnetic bead sorting and combined magnetic bead sorting. The order of adding magnetic beads in sequential sorting had no effect on the sorting efficiency. Adding 5 μL of Ep-LMB/Vi-LMB/EG-LMB to capture sequentially was the best capture scheme, and the capture rate was above 90% (Figure 5A). Verified in simulated blood, it was found that the capture efficiency had decreased, but the capture rate was still above 90%, which was due to the occurrence of blood viscosity in the simulated blood system (Figure 5B). The detection results in PBS showed that there was no significant difference in the capture rate of the 4 lung cancer cells captured by Ep-LMB/Vi-LMB/EG-LMB sequentially (P > .05), and the average capture rate was 95.48% (Figure 5C). The detection results in simulated blood system showed that there was no significant difference in the capture rate of the 4 lung cancer cells captured by Ep-LMB/Vi-LMB/EG-LMB sequentially (P > .05), and the average capture rate was 94.55% (Figure 5D). The results of the cell gradient experiment with different antibody content showed that when the antibody content was 60 μg, the capture efficiency reached the maximum in both the PBS system and the simulated blood system (Figure 5E and F).

Detection of capture efficiency of Ep-LMB, Vi-LMB, and EG-LMB on lung cancer cells. (A) In the PBS system, the capture efficiency of A549 cells was detected by using different capture schemes and different amounts of magnetic beads. (B) In the simulated blood system, the capture efficiency of A549 cells was detected by using different capture schemes and different amounts of magnetic beads. (C) In the PBS system, 4 lung cancer cell lines were used to detect the capture efficiency of the sorting system. (D) In the simulated blood system, 4 lung cancer cell lines were used to detect the capture efficiency of the sorting system. (E) The capture efficiency of A549 cells by adding LMB with different antibody contents in the PBS system. (F) The capture efficiency of A549 cells by adding LMB with different antibody contents in the simulated blood system.
Immunofluorescence identification of CTCs
Obvious cell morphology under white light. CK19-FITC positive for identification of tumor cells, showing green fluorescence. DAPI positive for identification of nucleus, showing blue fluorescence. CD45-PE negative for exclusion of leukocyte, that is, tumor cells do not show red fluorescence. Cells that simultaneously meet the above fluorescence coloring conditions can be determined as CTCs (Figure 6).

Immunofluorescence identification map of blood CTCs.
Analysis of the number and clinical features of CTCs
Among 163 patients with lung cancer, the number of CTCs and the total number of CTCs in the blood of patients with lung cancer detected by Ep-LMB, Vi-LMB, and EG-LMB were higher than those of healthy people (Figure 7A). The CTCs detected in the blood of HRP were significantly higher than those of healthy people, and the CTCs detected in the blood of patients with lung cancer were significantly higher than those of HRP and healthy people. The mean values of CTCs detected in 2.0 mL of blood from patients with lung cancer, HRP, and healthy individuals were 9.73, 3.32, and 1.47, respectively (Figure 7B). The number of CTCs in the blood of patients with lung cancer is related to tumor staging. The mean values of CTCs in the blood of patients with stage I, stage II, stage III, and stage IV lung cancer were 8.75, 11.94, 14.33, and 16.50, respectively (Figure 7C). The number of CTCs in the blood of patients with lung cancer was related to tumor metastasis. The mean values of CTCs in the blood of patients with lung cancer without metastasis and those with metastasis were 9.36 and 16.11, respectively (Figure 7D). There was no correlation between the number distribution of CTCs in the blood of patients with lung adenocarcinoma and lung squamous cell carcinoma (Figure 7E). There was no correlation between the distribution of CTCs in the blood of smoking and nonsmoking patients with lung cancer (Figure 7F).

Correlation analysis between the number of CTCs and clinical characteristics of patients. (A) Distribution of CTCs with different phenotypes in healthy individuals and patients with lung cancer. (B) Distribution of CTCs in healthy individuals, high-risk populations for cancer, and patients with lung cancer. (C) Distribution of CTCs in different tumor stages of patients with lung cancer. (D) Distribution of CTCs before and after tumor metastasis. (E) Distribution of CTCs in lung adenocarcinoma and lung squamous cell carcinoma. (F) The relationship between whether the patient smokes and the number of CTCs. **See Stastical processing.
Diagnostic value of CTCs in lung cancer
The ROC curve was drawn using the number of CTCs in the blood of healthy people as a control; the area under the ROC curve for patients with lung cancer was 0.9994; the 95% confidence interval was 0.9981 to 1.000 (P < .0001); cutoff value was 4.5/2 mL; the sensitivity of lung cancer diagnosis was 99.39%; and the specificity was 96.88% (Figure 8A). The ROC curve was drawn using the number of CTCs in the blood of HRP as a control; the area under the ROC curve for patients with lung cancer was 0.9887,; the 95% confidence interval was 0.9769 to 1.000 (P < .0001); cutoff value was 5.5/2 mL; the sensitivity of lung cancer diagnosis was 97.55%; and the specificity was 86.36% (Figure 8B). The ROC curve was drawn using the number of CTCs in the blood of healthy people as a control; the area under the ROC curve for HRP was 0.7813; the 95% confidence interval was 0.6491 to 0.9134 (P = .0005); cutoff value was 4.5/2 mL; the sensitivity of HRP diagnosis was 31.82%; and the specificity was 96.88% (Figure 8C).

The diagnostic value of CTC detection in lung cancer and the relationship between CTCs and the survival rate of patients. (A) ROC curve of the number of CTCs in the blood of patients with lung cancer to healthy people. (B) ROC curve of the number of CTCs in the blood of patients with lung cancer to HRP. (C) ROC curve of the number of CTCs in the blood of HRP to healthy people.
Discussion
Circulating tumor cells can be a new diagnostic tool, which can provide information for tumor occurrence, development, and evaluation of curative effect earlier. Circulating tumor cells are found in prostate cancer, colorectal cancer, breast cancer, lung cancer, ovarian cancer, hepatocellular carcinoma, bladder cancer, and other solid tumors; CTCs are becoming independent predictors of tumor occurrence, development, and treatment response.18 -20 Lung cancer is the most common cancer, and if detected early and surgically removed, the prognosis is good, with a 5-year survival rate of 70% to 90%.21,22 However, most patients are diagnosed at an advanced stage (stage III/IV). 23 Therefore, early diagnosis and treatment of patients with lung cancer can improve the prognosis of patients. Although various lung cancer biomarkers have been developed, such as carcino-embryonic antigen (CEA), squamous cell carcinoma antigen (SCC), and cytokeratin 19 fragment antigen21-1 (CYFRA 21-1), the positive rate of these tumor biomarkers is extremely low, and even if combined testing is used, the diagnostic positive rate for early lung cancer is less than 20%.24,25 Therefore, it is necessary to develop an accurate and sensitive detection method to diagnose patients with lung cancer as early as possible, so as to perform intervention treatment to improve the prognosis of patients.
The bottleneck of clinical application of CTCs lies in their enrichment technology. The CellSearch system approved by the FDA for clinical CTC detection is based on EpCAM antibody capture of epithelial phenotype CTCs. This method has great limitations in clinical application of lung cancer CTC detection, with low sensitivity (about 20%-40%).13,14,26 In addition, studies have confirmed that tumor cells are highly heterogeneous, and CTCs entering peripheral blood are also heterogeneous, and capturing CTCs with 1 marker cannot effectively capture all CTCs. 27 Second, CTCs need to go through EMT conversion when entering the blood circulation. It has been shown that mesenchymal CTCs with EMT are more disseminated than epithelial CTCs, which is a factor of poor prognosis. 28 Simply improving the sensitivity of the detection of single epithelial CTCs can only detect more epithelial CTCs with low invasiveness and no EMT, which has limited significance. This study is based on a new CTC separation system, which has a capture efficiency 4.4 ± 1.2 times higher than the CellSearch system. 29 On this basis, this study aimed at the 3 markers of epithelial type, mesenchymal type, and EGFR phenotype, and jointly constructed a system for capturing CTCs in the blood of patients with lung cancer. The results showed that the average capture efficiency of the CTC capture system in the PBS system was 95.48%, and the average capture efficiency of the CTC capture system in the simulated blood system was 94.55%. The mean values of CTCs detected in 2 mL blood of patients with lung cancer, HRP, and healthy people were 9.73, 3.32, and 1.47, respectively. The number of CTCs in the blood of patients with lung cancer is related to tumor staging and metastasis, indicating that the system can accurately and efficiently capture CTCs in the blood of patients with lung cancer.
Studies have shown that the isolation and detection of CTCs in peripheral blood are helpful for the early diagnosis of lung cancer.30,31 The immunomagnetic bead method is used for the diagnosis of lung cancer in CTCs with positive folate receptors, with a sensitivity of 0.875. 32 The sensitivity and specificity of CanPatrol technology in detecting peripheral blood CTCs in non-small-cell lung cancer were 0.816 and 0.868, respectively. 33 Furthermore, the sensitivity of CTCs detected using the epithelial tumor cell size fractionation method to diagnose lung cancer was only 0.263 [95% CI = 11.8-48.8], indicating that this method for detecting CTCs is not suitable as a means of early diagnosis of lung cancer.34,35 The results of our study indicate that the CTC capture system combined with Ep-LMB/Vi-LMB/EG-LMB has a sensitivity of 99.39% and a specificity of 96.88% for the diagnosis of lung cancer (AUC = 0.9994, 95% CI = 0.9981-1.000, and cutoff value = 4.5/2 mL). It shows that the CTC capture system established in this study has high sensitivity in the clinical diagnosis of lung cancer, can be used as an effective marker for the diagnosis of lung cancer, has high clinical application value, and is worthy of clinical application. In this study, the sample size is still relatively small. To better explore the application value of CTC detection in patients with lung cancer, the sample size needs to be further enlarged. This may be the future research direction of liquid biopsy for lung cancer diagnosis.
Conclusions
This study preliminarily confirmed that the combined use of multiple tumor screening markers can be used as an auxiliary diagnostic index for lung cancer, and the construction of a CTC capture system combined with Ep-LMB/Vi-LMB/EG-LMB has good clinical application value in the auxiliary diagnosis of lung cancer. The detection of CTCs can provide a certain guiding value for the early detection, early treatment, and curative effect monitoring of patients with lung cancer.
Footnotes
Declaration of conflicting interests:
The author(s) declared no potential conflicts of interest with respect to the research, authorship, and/or publication of this article.
Funding:
The author(s) disclosed receipt of the following financial support for the research, authorship, and/or publication of this article: This study was supported by the Fujian Natural Science Foundation Project (grant no. 2020J01207).
Author Contributions
WJ, JW, XL, ZC, and LL performed the experiments and wrote the article. JY participated in the design of the study and the interpretation of the data and supervised all the experiments. All authors read and approved the final article.
Data Availability Statement
All data generated or analyzed during this study are included in this published article.
Research Ethics and Patient Consent
This study was approved by the Ethics Committee of The Second Affiliated Hospital of Fujian Medical University ([2020] Ethical Review No. (61) of The Second Affiliated Hospital of Fujian Medical University). All the selected cases fulfilled the obligation of informing and signed the informed consent.