
Abstract
Background:
Following changes in primary tumor (T) and lymph node (N) staging for nasopharyngeal carcinoma (NPC) in the Eighth Edition AJCC Cancer Staging Manual, simplification of T staging has been proposed. However, a limited range of 2-deoxy-2-[fluorine-18] fluoro-
Methods:
A total of 435 NPC patients underwent 18F-FDG PET/CT before treatment were retrospectively examined. The primary endpoint was differences in standard uptake value (SUV), lean body mass-normalized SUV (SUL), body surface area-normalized SUV (SUS), glucose-normalized SUV (GN), metabolic tumor volume (MTV), total lesion glycolysis (TLG), and glucose-normalized total lesion glycolysis (GNTLG) of primary tumors and LNM between different T and N stages. The metabolic parameters associated with T and N staging were identified.
Results:
There were significant differences between all parameters relative to the primary tumor but no significant differences in any parameter relative to the LNM and T stages. Higher mean values of TGNmax, TGNmean, TSUVpeak, and TSUSmax were associated with advanced T stages. Higher mean values of all the LNM parameters were associated with more advanced N stages. Only primary tumor metabolic tumor volume (TMTV), TSUVpeak, TSULmax, and TSUSmax showed a significant positive association with T staging, while lymph node metabolic tumor volume (LNMTV) and TSUSmax were significantly positive in N staging.
Conclusions:
Our findings suggest that metabolic parameters are useful indicators of tumor invasiveness and LNM based on the Eighth Edition manual. Compared with volume-dependent parameters, TGNmax, TGNmean, TSUVpeak, and TSUSmax may be better indicators of local tumor aggressiveness. SUSmax of the primary tumor was associated with LNM. In addition to SUVmax, other metabolic parameters (eg, SULmax, SUSmax, GNmax, and GNmean) could evaluate tumor aggressiveness and LNM better.
Keywords
Introduction
Nasopharyngeal carcinoma (NPC) exhibits clear geographical distribution patterns, especially in East and Southeast Asia. 1 The geographical global distribution of NPC is extremely unbalanced with over 70% of new cases diagnosed in eastern and southeast Asia corresponding to a 5-year prevalence (all ages) of 12.91 cases per 100 000 in China. 2 With the advancement of radiotherapy technology, induction and concurrent chemotherapy, and the development of an accurate staging system, the treatment of NPC has continuously improved. 1
In 2017, the American Joint Committee on Cancer/Union for International Cancer Control (AJCC/UICC) revised the staging system for NPC 3 in the Eighth Edition AJCC Cancer Staging Manual. The Eighth Edition AJCC Cancer Staging Manual is currently the most common prognostic tool for NPC and remains the most influential resource for guiding treatment, assessing the treatment response, comparing outcomes between different institutions, and academic research. The main changes to T staging in the Eighth Edition are as follows: medial pterygoid, lateral pterygoid, or prevertebral muscle involvement was included in T2, cervical vertebral invasion was included in T3, and the ambiguous terms infratemporal fossa/masticator space invasion was removed and replaced with extensive soft tissue invasion (soft tissue outside the lateral pterygoid muscle and parotid gland) in T4. 4 Regarding N staging changes, stages N3a and N3b in the Seventh Edition were merged into a single stage, N3, and the N3 criterion was changed to “below the caudal border of cricoid cartilage.” 4 However, some studies have expressed support for these changes,5-9 while others have not.10-14 Many studies have shown that N staging is reasonable5-9 while T staging needs further improvement.10-14 A comparative assessment was conducted by Li et al 11 on the 5-year overall survival (OS) and progression-free survival (PFS) of individuals diagnosed with NPC who presented severe skull base invasion (SBI) versus those with slight SBI. Their results suggested that patients with slight SBI experienced improved outcomes and that the OS and PFS of patients with slight SBI is not significantly improved by additional induction chemotherapy therapy. They advised to downgrade the stage of NPC patients with mild SBI from T3 to T2 stage. This suggestion could potentially address the issue of conflicting prognoses for T2 and T3 stages and indications for using induction chemotherapy. Pan et al 14 have simplified T stage as the use of 17 anatomical structures in the Eighth Edition is too complicated, its popularization and application are greatly limited. The differences in local control and survival between T stage have narrowed down due to the advances in diagnostics and treatment. Therefore, some studies have proposed the simplification of T staging.14,15
Magnetic resonance imaging (MRI) is the preferred imaging technique for assessment, staging, evaluating treatment effectiveness, and monitoring NPC progression due to its advantages of high soft tissue resolution, multiparametric imaging, and non-ionizing radiation.
16
However, 2-deoxy-2-[fluorine-18] fluoro-
18F-FDG PET–CT parameters offer metabolic information that can be used to evaluate tumor aggressiveness,18-20 predict lymph node metastasis (LNM)21-23 and may be correlated with patient survival. 24 The maximum standard uptake value (SUVmax) is the most commonly used metabolic parameter. SUVmax is an averaged value of the tracer uptake in sufficient numbers of cancer cells and other cells in the most metabolically aggressive part of the potentially heterogeneous tumor. The limitation of SUVmax is that it only represents the maximum uptake within the volume of interest (VOI) and not the entire mass. The use of 18F-FDG-PET–CT parameters reflecting tumor size and metabolic information, such as metabolic tumor volume (MTV) and total lesion glycolysis (TLG), has been proposed to overcome the limitation. MTV and TLG have been acknowledged as useful indicators for tumor aggressiveness, LNM, and patient survival for various tumors. MTV is defined as the total number of voxels exceeding the predetermined SUV threshold within the VOI, while TLG is calculated by multiplying the MTV by the mean of SUV (SUVmean). 25 Other metabolic parameters, such as the maximum lean body mass (LBM)-normalized SUV (SULmax), 26 maximum body surface area (BSA)-normalized SUV (SUSmax), 27 maximum glucose-normalized SUV (GNmax), GNmean, and glucose-normalized total lesion glycolysis (GNTLG), 28 have rarely been utilized in previous studies.
Given the changes to T and N staging, and the few18 F-FDG PET–CT metabolic parameters investigated in previous studies, the main objectives of this study were to evaluate the primary tumor invasiveness and the LNM in the new staging system by comparing metabolic parameters of primary tumors and LNM of different T and N stages. We also aimed to determine the relationship between metabolic parameters and T and N stages to provide reference values for future research.
Patients and Methods
Patients
The clinical records of all patients with NPC with undifferentiated carcinoma diagnosed between June 2016 and January 2020 at Jiangsu Cancer Hospital, Nanjing, China, were investigated. Carcinoma staging was based on the Eighth Edition AJCC Cancer Staging Manual, and patients who were not staged according to the latest staging system were re-staged by clinicians according to the Eighth Edition manual. Only patients who had undergone MRI of the neck were eligible. All patients provided written informed consent to participate before the initiation of the study. The Ethics Committee of Jiangsu Cancer Hospital approved this study (protocol code 2022k-k026 and date of approval: April 22, 2022).
PET–CT imaging
All patients underwent examination with a PET–CT scanner (Discovery 710; GE Medical Systems, Waukesha, Wisconsin, USA). Intravenous administration of 18F-FDG (0.1–0.2 mCi/kg) was performed in patients who fasted for a minimum period of 6 hours. Before injection, blood glucose concentrations were measured to ensure that they were less than 11 mmol/L. During the radiotracer distribution, patients rested in the waiting room and orally ingested approximately 1 000 mL of water. The patients were instructed to urinate immediately before the examination. PET–CT image acquisition started 50–70 minutes after 18F-FDG injection. CT and PET scan parameters were as follows: vertex to mid-thigh scanning range, 140 kV tube voltage, auto mA (noise index, 28.5) tube current, 0.8 second rotation time, 3.75 mm slice thickness, 2 minutes/bed position emission scan time, and six to seven bed positions scanning range. The acquired PET images were reconstructed with an iterative reconstruction algorithm (VUE point FX +SharplR: iteration = 2; subset = 24) with CT-based attenuation correction. Images were analyzed on the workstation (Advanced Workstation AW 4.6, GE HealthCare, Chicago, IL, USA).
PET–CT image analysis
An experienced nuclear medicine physician analyzed the images. VOIs were placed around the primary tumor and LNM. Methods for the placement of VOI have been described previously. 29 Within the selected VOI, SUVmax, SULmax, SUSmax, SUVmean, GNmax, GNmean, MTV, TLG, and GNTLG of the primary tumor and LNM with the highest SUVmax values were evaluated using the fixed percentage of SUVmax threshold algorithm (42% of SUVmax). 30 The SUV measures the uptake in a tumor normalized according to the distribution volume. SUVmax and SUVmean were defined as the maximum and average values of SUVs, respectively. Glucose-normalized SUVmax and SUVmean were defined as GNmax and GNmean, respectively. 28 SUVpeak is the average SUV computed within a fixed VOI, most often containing (and not necessarily centered on) the hottest pixel value. 31 GNTLG is calculated by multiplying MTV by GNmean. 28 The LBM-normalized SUV was defined as SUL, while the BSA-normalized SUV was defined as SUS. 27
Statistical analysis
Multigroup comparisons were performed using analysis of variance (ANOVA) to compare the differences in metabolic parameters of the primary tumors and LNM of stages T1–T4 and N0–N3. The Spearman rank correlation coefficient was used to characterize the relationship between the PET parameters and NPC T and N staging. Ordered logistic regression analysis was used to identify the PET parameters that are significantly associated with T and N staging. Two-tailed P-values of < .05 were considered statistically significant. Statistical Package for Social Sciences software (SPSS, version 22.0, IBM, Armonk, NY, USA) was used for all statistical analyses.
Results
A total of 435 patients with histologically confirmed undifferentiated carcinoma who underwent 18F-FDG-PET–CT imaging before treatment were included in this study.
Clinical characteristics
The clinical characteristics of patients with NPC included in this study are listed in Table 1.
Clinical characteristics of patients with stages I–IV nasopharyngeal carcinoma.

Abbreviation: 18F-FDG, 2-deoxy-2-[fluorine-18] fluoro-
IV includes IVA and IVB.
Comparison of PET parameters between stage T1–T4
Significant differences in TMTV, TSUVmax, TSUVmean, TTLG, TGNmax, TGNmean, TGNTLG, TSUVpeak, TSULmax, and TSUSmax values between stages T1 and T4 tumors were found (P < .05).
We did not observe any significant differences in the lymph node metabolic tumor volume (LNMTV), lymph node standard uptake value (LNSUV)max, LNSUVmean, LNTLG, lymph node glucose-normalized standard uptake value (LNGN)max, LNGNmean, lymph node glucose-normalized total lesion glycolysis (LNGNTLG), LNSUVpeak, lymph node lean body mass-normalized SUV (LNSUL)max, or lymph node body surface area-normalized SUV (LNSUS)max values between stages T1 and T4 carcinomas (P > .05).
The pairwise comparison of the TGNmax, TGNmean, TSUVpeak, and TSUSmax values between stages T1 and T4 showed significant differences (P < .05). Further analysis suggested that higher TGNmax, TGNmean, TSUVpeak, and TSUSmax mean values were associated with more advanced T staging.
We observed no significant differences in TMTV, TTLG, and TGNTLG values between stages T1 and T2 (P > .05) (Table 2, Figure 1).

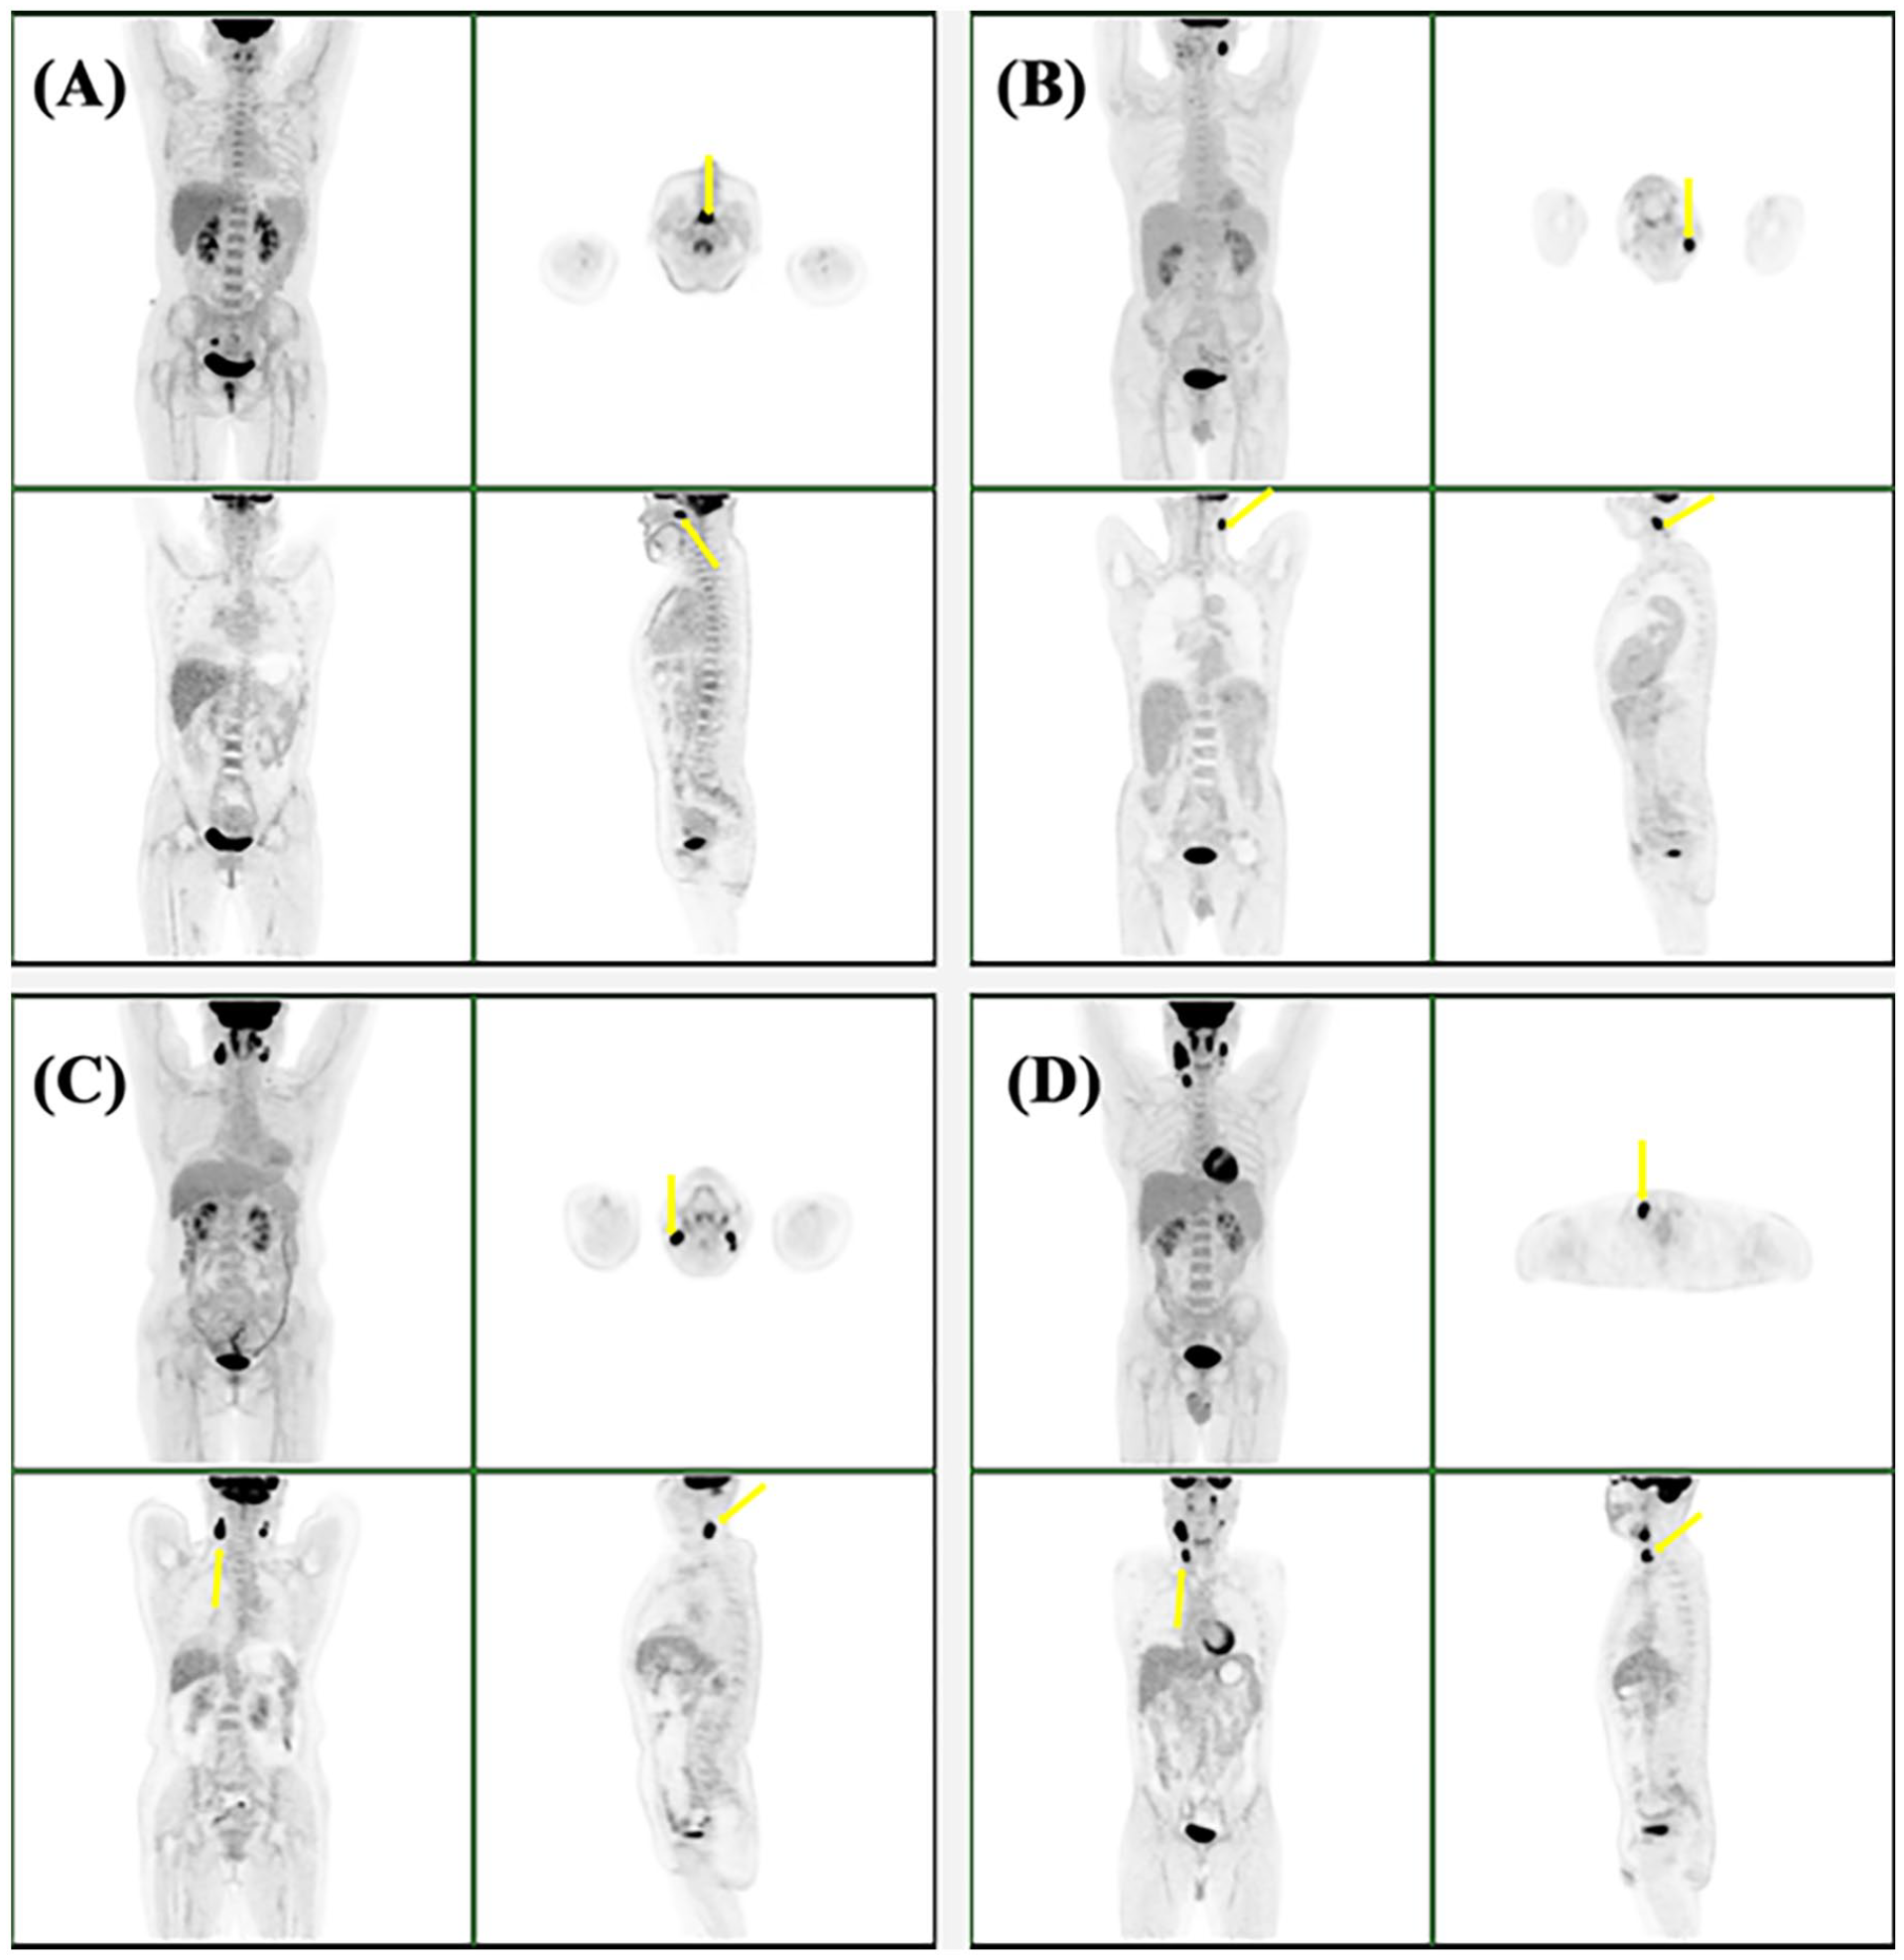
18F-FDG PET–CT imaging of primary tumors (yellow arrows) in patients with nasopharyngeal carcinoma. A, B, C, and D depict stages T1, T2, T3, and T4 carcinomas, respectively. 18F-FDG PET–CT indicates 2-deoxy-2-[fluorine-18] fluoro-
Comparison of PET parameters of primary tumors and lymph node metastasis between stages T1 and T4.

Abbreviations: LN, lymph node; LNGN, lymph node glucose-normalized standard uptake value; LNGNTLG, lymph node glucose-normalized total lesion glycolysis; LNMTV, lymph node metabolic tumor volume; LNSUL, lymph node lean body mass-normalized SUV; LNSUS, lymph node body surface area-normalized SUV; LNSUV, lymph node standard uptake value; LNTLG, lymph node total lesion glycolysis; PET, positron emission tomography; TGN, primary tumor glucose-normalized standard uptake value; TGNTLG, primary tumor glucose-normalized total lesion glycolysis; TMTV, primary tumor metabolic tumor volume; TSUL, primary tumor lean body mass-normalized SUV; TSUS, primary tumor body surface area-normalized SUV; TSUV, primary tumor standard uptake value; TTLG, primary tumor total lesion glycolysis.
Not significantly different from T2.
Not significantly different from T1.
Not significantly different from T3.
Comparison of PET parameters between stages N0 and N3
Significant differences were found between TMTV, TSUVmax, TSUVmean, TTLG, TGNmax, TGNmean, TGNTLG, TSUVpeak, TSULmax, TSUSmax, LNMTV, LNSUVmax, LNSUVmean, LNTLG, LNGNmax, LNGNmean, LNGNTLG, LNSUVpeak, LNSULmax, and LNSUSmax values of stages N0–N3 (P < .05).
The pairwise comparison of LNMTV, LNSUVmax, LNSUVmean, LNTLG, LNGNmax, LNGNmean, LNGNTLG, LNSUVpeak, LNSULmax, and LNSUSmax values between stages N0 and N3 showed significant differences (P < .05). Further analysis suggested that higher mean LNMTV, LNSUVmax, LNSUVmean, LNTLG, LNGNmax, LNGNmean, LNGNTLG, LNSUVpeak, LNSULmax, and LNSUSmax values were associated with more advanced N stages (Table 3).
Comparison of PET parameters of primary tumors and lymph node metastasis between stages N0 and N3.

Abbreviations: LN, lymph node; LNGN, lymph node glucose-normalized standard uptake value; LNGNTLG, lymph node glucose-normalized total lesion glycolysis; LNMTV, lymph node metabolic tumor volume; LNSUL, lymph node lean body mass-normalized SUV; LNSUS, lymph node body surface area-normalized SUV; LNSUV, lymph node standard uptake value; LNTLG, lymph node total lesion glycolysis; PET, positron emission tomography; TGN, primary tumor glucose-normalized standard uptake value; TGNTLG, primary tumor glucose-normalized total lesion glycolysis; TMTV, primary tumor metabolic tumor volume; TSUL, primary tumor lean body mass-normalized SUV; TSUS, primary tumor body surface area-normalized SUV; TSUV, primary tumor standard uptake value; TTLG, primary tumor total lesion glycolysis.
Not significantly different from N3.
Not significantly different from N2.
Not significantly different from N1.
Not significantly different from N0.
Correlation between PET parameters, and T and N staging
The parameters TMTV, TSUVmax, TSUVmean, TTLG, TGNmax, TGNmean, TGNTLG, TSUVpeak, TSULmax, and TSUSmax were correlated with T staging (P < .05), and the correlation coefficients were 0.662, 0.391, 0.384, 0.731, 0.393, 0.384, 0.732, 0.477, 0.415, and 0.421, respectively.
The parameters LNMTV, LNSUVmax, LNSUVmean, LNTLG, LNGNmax, LNGNmean, LNGNTLG, LNSUVpeak, LNSULmax, and LNSUSmax were not correlated with T staging (P > .05).
All primary tumor and LN parameters, except TMTV (P = 0.120), were correlated with N staging (P < 0.05), and the correlation coefficients were 0.165, 0.155, 0.117, 0.202, 0.192, 0.143, 0.150, 0.168, 0.175, 0.506, 0.568, 0.559, 0.560, 0.574, 0.573, 0.574, 0.569, 0.567, and 0.568, respectively.
Relationship between PET parameters, and T and N staging
TMTV, TSUVpeak, TSULmax, and TSUSmax had significant positive associations with T staging, and the odds ratio (OR) and P-values were 1.357 and 0.000, 1.709 and 0.000, 1.436 and 0.020, and 1.643 and 0.033, respectively. LNMTV and TSUSmax had significant positive associations with N staging, and the OR and P-values were 1.404 and 0.000, and 1.913 and 0.024 (Table 4, Figure 2).
Summary of logistic regression analysis results of PET parameters, and T and N staging.

Abbreviations: CI, confidence interval; LN, lymph node; LNGN, lymph node glucose-normalized standard uptake value; LNGNTLG, lymph node glucose-normalized total lesion glycolysis; LNMTV, lymph node metabolic tumor volume; LNSUL, lymph node lean body mass-normalized SUV; LNSUS, lymph node body surface area-normalized SUV; LNSUV, lymph node standard uptake value; LNTLG, lymph node total lesion glycolysis; OR, odds ratio; PET, positron emission tomography; TGN, primary tumor glucose-normalized standard uptake value; TGNTLG, primary tumor glucose-normalized total lesion glycolysis; TMTV, primary tumor metabolic tumor volume; TSUL, primary tumor lean body mass-normalized SUV; TSUS, primary tumor body surface area-normalized SUV; TSUV, primary tumor standard uptake value; TTLG, primary tumor total lesion glycolysis.
18F-FDG PET–CT imaging of lymph node metastasis (yellow arrows) in patients with nasopharyngeal carcinoma. A, B, C, and D depict stages N0, N1, N2, and N3 lymph node metastases, respectively. 18F-FDG PET–CT indicates 2-deoxy-2-[fluorine-18] fluoro-
Discussion
The unique 18F-FDG probe is utilized for molecular imaging, exploiting the ability of cancer cells to take up the tracer in proportion to their glucose utilization rate. The Warburg effect refers to the enhanced utilization of glucose through aerobic metabolism in cancer cells, which becomes more pronounced as the cells become less differentiated and more aggressive. Therefore, as a tumor becomes increasingly undifferentiated and aggressive, it results in elevated glucose utilization and increased uptake of the radioactive tracer 18F-FDG.19,20 Black patients with breast cancer have poorer prognosis and higher mortality. Abubakar et al 19 observed differences in 18F-FDG PET–CT metabolic parameters of locally advanced invasive ductal carcinoma (IDC) among patients of different racial groups and molecular subtypes. A notable increase in the SUVmax, MTV, and TLG values of the primary tumor was observed in black patients when compared with patients of other ethnicities. Moreover, the luminal subtype showed a significant increase in SUVmax, while both SUVmax and TLG values were significantly elevated in the basal subtype of the primary tumor. Overall, Black patients with IDC exhibited markedly elevated PET parameters, implying a more aggressive disease phenotype for this racial group, particularly with luminal and basal carcinoma subtypes. 19
Some studies have proposed to simplify the T staging.14,15 Our study aimed to compare metabolic parameters in patients of different T stages and to evaluate the differences in primary tumor aggressiveness by identifying the metabolic parameters associated with T staging. We observed significant differences in the values of primary tumor MTV, SUVmax, SUVmean, TLG, GNmax, GNmean, GNTLG, SUVpeak, SULmax, and SUSmax between stages T1–T4. SUVmax, SUSmax, and GNmax only represent the maximum uptake within the VOI, while MTV, TLG, and GNTLG reflect not only the tumor size but also the metabolic information. In our study, we observed no significant differences in TMTV, TTLG, and TGNTLG values between the stages T1 and T2. Conversely, the pairwise comparison of the primary tumor GNmax, GNmean, SUVpeak, and SUSmax between the four groups showed significant differences. Further analysis suggested that higher mean values of TGNmax, TGNmean, TSUVpeak, and TSUSmax were associated with advanced T stages. The T staging of NPC is based entirely on the anatomical tumor extent rather than the size of the malignant tumors. 16 The above results suggest that GNmax, GNmean, SUVpeak, and SUSmax can be used to evaluate the local aggressiveness of the primary tumor and may be more effective indicators compared with volume-dependent parameters, such as MTV and TLG. Our results showed that the primary tumor metabolic parameter values were significantly different in patients with tumors of different T stages. In other words, our results suggested that T staging based on the Eighth Edition AJCC Cancer Staging Manual is credible from a metabolic perspective.
Our study further aimed to elucidate the relationship between PET-CT parameters and LNM. In our study, all parameters of the primary tumor and LNM, except TMTV, were correlated with N staging. We observed significant differences in all parameters of the primary tumor and LNM between stages N0 and N3. The pairwise comparison of all LNM parameters between the four stages showed significant differences. Furthermore, our analysis showed that higher mean values of LNMTV, LNSUVmax, LNSUVmean, LNTLG, LNGNmax, LNGNmean, LNGNTLG, LNSUVpeak, LNSULmax, and LNSUSmax were associated with advanced N staging. Our findings suggest that metabolic information is a useful indicator in N staging of LNM based on the Eighth Edition AJCC Cancer Staging Manual. Two metabolic parameters (LNMTV and TSUSmax) exhibited a significant positive association with N staging. The primary tumor SUSmax was associated with LNM. Previous studies have also described the association between PET–CT parameters and LNM. For example, a study by Yilmaz et al 22 showed that higher primary tumor SUVmax was associated with a higher probability of LNM in patients with cervical cancer. A study by Crivellaro et al 23 illustrated that primary tumor MTV and TLG were significantly related to the presence of LNM in early-stage cervical cancer. Li et al 32 also proposed that in early-stage cervical cancer, primary tumor TLG may predict LNM. Husby et al 21 demonstrated that SUVmax, SUVmean, MTV, and TLG of the primary tumor tend to indicate LNM in endometrial carcinoma. In incidentally detected thyroid cancer, high MTV and TLG are associated with LNM. 33 A study unveiled an association between the retention index (calculated as the difference between SUVmax delayed point and SUVmax early point, divided by SUVmax early point) of the primary tumor and a heightened likelihood of LN metastasis in patients afflicted by non-small cell lung cancer (NSCLC). 34 Another study illustrated that the SUVmax of the mediastinal LNM and primary tumor SUVmax, SUVpeak, SUVmean, MTV, and TLG were significantly associated with the presence of mediastinal LNM in NSCLC. In particular, the study found a strong correlation between the mediastinal LNM SUVmax, the primary tumor SUVpeak, and the occurrence of mediastinal LNM in patients with NSCLC. 35 PET–CT metabolic parameters have also been used to predict LNM in other tumors, such as vulvar cancer, 36 esophageal squamous cell carcinoma, 37 breast cancers, 38 rectal cancer, 39 and gastric cancer. 40 In addition to some similarities, differences between the findings of our study and those of previous studies were noted. We investigated not only the presence of LNM but also the staging of LNM. In addition, we investigated more metabolic parameters than previous studies. SULmax, SUSmax, GNmax, and GNmean have rarely been investigated. SUV is typically normalized to total body mass. However, because FDG accumulation in white adipose tissue (WAT) is minimal in the fasting state, SUV in tissues other than WAT tends to be higher in patients with obesity. SUV values of the target tissue in patients with higher body mass will be higher than those in leaner patients. Therefore, some studies have proposed that SUV should be normalized to LBM instead of total body mass. 26 Normalization to BSA also has been proposed. 27 Our study suggested that TSULmax and TSUSmax were positively associated with T staging, while TSUSmax instead of SUVmax was positively associated with N staging. Few studies have investigated GN. Hence, evidence supporting that GN improves the treatment response monitoring or the prediction of outcomes compared with uncorrected SUVs is lacking. 28 Our study showed that higher mean values of TGNmax and TGNmean rather than SUVmax and SUVmean were associated with advanced T staging. Our study also suggested that glucose-normalized SUVmax and glucose-normalized SUVmean reflect the metabolic parameter differences between T stages. Our study provides reference values for follow-up studies that investigate the utility of other metabolic parameters in addition to SUVmax (eg, SULmax, SUSmax, GNmax and GNmean) to evaluate tumor aggressiveness and LNM.
Currently, the treatment of NPC mainly involves radiotherapy combined with chemotherapy, and most patients do not need surgical resection of the nasopharyngeal primary tumor and LNM. Due to the lack of gross surgical specimens, the depth of tumor invasion and LNM could not be accurately judged from the pathological level. In fact, comprehensive imaging is generally used to stage NPC in clinical practice, but when the disease (primary or metastatic) is in a critical state, clinical staging based on imaging involves certain difficulties. A study by Feng et al 41 showed that a model based on PET and MRI features (1 T2WI feature and 11 PET features) and metabolic parameters (primary tumor SUVmax and TLG) exhibited good diagnostic performance for predicting NPC staging in the testing set (AUC, 0.90). Our study retrospectively analyzed the association between various PET–CT metabolic parameters and T and N staging, which may provide novel directions for clinical work and prove helpful for clinicians.
Several limitations of this study should be acknowledged. First, some patients underwent a biopsy of the primary lesion before the PET examination, which may have affected the accuracy of the metabolic parameters measurements. Second, our measurement method for MTV and TLG is only one of the many measurement methods, and we only used a 42% SUVmax threshold. The relationship between metabolic parameters determined via more measurement methods and thresholds and the primary tumor and LNM requires further study. Third, outcome analysis was not performed. Follow-up studies with larger, homogeneous patient cohorts are planned to investigate this aspect.
Conclusion
We observed significant differences in certain primary tumor PET–CT metabolic parameters between different T-stage tumors. Further analysis showed that higher mean values of TGNmax, TGNmean, TSUVpeak, and TSUSmax were associated with advanced T staging. Compared with volume-dependent parameters, such as MTV and TLG, TGNmax, TGNmean, TSUVpeak, and TSUSmax may be more useful indicators of the local aggressiveness of tumors. Furthermore, our analysis suggests that higher mean values of all the LN metabolic parameters were associated with advanced N staging. Our results indicate that metabolic parameters are useful for T and N staging based on the Eighth Edition AJCC Cancer Staging Manual. LNMTV and TSUSmax were positively associated with N staging. The SUSmax of the primary tumor was associated with LNM. In addition to SUVmax, other metabolic parameters (eg, SULmax, SUSmax, GNmax, and GNmean) were indicated to be useful in the evaluation of tumor aggressiveness and LNM. With further improvement and validation, PET–CT metabolic parameters may become useful predictors of local tumor aggressiveness and LNM of NPC.