
Abstract
Background:
Copper chaperone for superoxide dismutase (CCS) is an essential component of the oxidation-reduction system. In breast cancer cells, CCS expression is highly up-regulated, which contributes to cellular proliferation and migration. Breast cancer is a multifaceted disease with different tumor prognoses and responses to clinical treatments, which may be associated with multiple molecular subtypes of CCS.
Methods:
The CCS expression patterns in breast cancer were investigated by TNMplot, cBioPortal, and HPA network database. The correlation of CCS expression with clinicopathological parameters was analyzed using the UALCAN database. The Cancer Genome Atlas (TCGA) data set was used to analyze the Clinical characteristics of CCS in luminal B patients. The bc-GenExMiner database was used to analyze the effects of BReast-CAncer susceptibility gene (BRCA)1/2, TP53 mutation status, estrogen receptor (ER), progesterone receptor (PR), and human epidermal growth factor receptor (HER) expression on CCS expression. The survival curves and prognostic value of CCS in luminal B breast cancer were performed through Kaplan-Meier curves, univariate and multivariate Cox regression using the PrognoScan, bc-GenExMiner, and Clinical bioinformatics analysis platform.
Results:
We found that CCS expression was associated with patient age, race, ER, and PR status. We also discovered that BRCA1/2 mutations had an effect on CCS expression. The luminal B subtype had the highest CCS expression, which was linked to poor survival compared with other subtypes. In addition, Kaplan-Meier curve analysis showed that luminal B patients with high CCS mRNA expression showed a poor survival and the CCS gene is an independent predictor of outcome in patients with luminal B breast cancer by univariate and multivariate Cox regression.
Conclusions:
Our findings emphasize the significant expression of CCS in luminal B breast cancer and its potential as an autonomous prognostic determinant for this specific molecular subtype. These findings suggest that CCS holds promise as a prospective marker for the treatment of luminal B breast cancer.
Introduction
Breast cancer is the most frequent cancer in women and the main cause of cancer deaths globally. 1 The latest World Health Organization (WHO) International Agency for Research on Cancer (IARC) Global Burden of Cancer 2020 data showed breast cancer to be the most prevalent cancer. 2 The molecular traits and clinical manifestations of breast cancer are exceedingly varied, and treatment strategies differ depending on the molecular subtype. Based on the molecular type classification, breast tumors are divided into 5 subtypes: basal-like, human epidermal growth factor receptor (HER)2-positive, luminal A, luminal B, and triple-negative breast cancer (TNBC) subtypes that lack the estrogen receptor (ER), progesterone receptor (PR), and HER2.3,4 Compared with other subtypes, luminal B breast cancer is associated with greater challenges in clinical management, such as low overall ER expression, high histological grade, resistance to endocrine therapy, and poor prognosis.5-7 Pharmacoresistance increases the risk of breast cancer recurrence and metastases, and there is a particularly urgent need to explore specific biomarkers in clinical research to develop individualized treatment strategies for luminal B subtypes. 8 Abnormal gene expression plays a key role in tumorigenesis, progression, and metastasis of breast cancer. For example, mutations in the TP53 oncogene, as well as in the phosphatidylinositol-4,5-bisphosphate 3-kinase catalytic subunit alpha (PIK3CA), RB transcriptional corepressor 1 (RB1), and phosphatase and tensin homolog (PTEN) genes, account for more than 50% of TNBC metastatic tumors.9-11 Overexpression of HER2 drives tumor growth by constitutive activating the mitogen activated kinase-like protein (MAPK) and phosphatidylinositol 3-kinase(PI3K)/Akt kinase (AKT) signaling pathways, which in turn enhances cell proliferation, invasion, and metastasis.12,13
The copper chaperone for superoxide dismutase (CCS) was originally identified in Saccharomyces cerevisiae as the protein product of LYS7 (copper chaperone of lysine biosynthesis protein). 14 Copper chaperone for superoxide dismutase has been reported to be an essential component of the oxidation-reduction system and can play a role as a tumor promoter in many cancers.15,16 Indeed, a previous study found that inhibition of CCS expression or activity significantly increased intracellular reactive oxygen species (ROS) levels in tumor cells, ultimately inhibiting lung carcinogenesis. 17 It was also found that knockdown of CCS resulted in a decrease in adenosine-triphosphate (ATP) levels in tumor cells, which further triggered the adenosine monophosphate (AMP)-activated protein kinase and led to decreased adipogenesis. 18 Excess copper accumulation in tissues promotes ROS production and is strongly associated with the Wilson disease and neurodegeneration. 19 Moreover, levels of copper are increased in certain tumor tissues and angiogenic lesions and promote neovascularization. 20 The strong expression of the CCS promotes the migration and invasion of breast cancer through the regulation of ERK1/2 activity mediated by the accumulation of ROS. 21 Copper chaperone for superoxide dismutase is vital in many diseases and cancers, particularly tumor proliferation and migration; however, few studies have studied the role of CCS expression in different molecular cancer subtypes, and its clinical and prognostic importance is uncertain, particularly with respect to breast cancer subtypes.
In this study, we evaluated the expression of CCS in BReast-CAncer susceptibility gene (BRCA) through the utilization of online software and immunohistochemistry (IHC). In addition, we conducted an analysis to investigate the correlation between CCS and clinicopathological parameters, as well as compared the expression of CCS across various molecular subtypes using bioinformatics analysis. The main objective of our study was to investigate the prognostic relevance of CCS in luminal B subtype breast cancer, with the aim of establishing a theoretical basis that supports the potential inclusion of CCS as a molecular target for the precise treatment of luminal B breast cancer.
Materials and Methods
Immunohistochemistry staining
Copper chaperone for superoxide dismutase expression was analyzed by IHC on a human BRCA tissue microarray (No.HBreD090PG01) purchased from the Shanghai Outdo Biotech Company (Shanghai, China). The tissues used for IHC staining included BRCA tumor tissue specimens (n = 70) and precancerous tissues (n = 20). The CCS antibody (Cat #: 22802-1-AP) was purchased at the Proteintech Group. The score was based on the percentage of positive protein cells within each tissue. Images were taken by a panoramic viewer with an objective of 50 or 100 μm (3D Histech, Hungary).
UALCAN database analysis
The UALCAN database (http://ualcan.path.uab.edu/) was used to analyze the expression characteristics of CCS in patients with breast cancer. The CCS mRNA and protein levels were evaluated in BRCA and normal tissues. Samples were grouped according to sample type, patient age, sex, race, individual cancer stage, and histological subtype. A P value of .05 was considered to be a significant threshold for all tests.
cBioPortal database analysis
cBioPortal (http://www.cbioportal.org/) is an online cancer genomics analysis platform that provides free genomics data and tools for studying cancer mechanisms and therapeutic strategies. 22 The breast invasive carcinoma (METABRIC, Nature 2012 & Nat Commun 2016) data set, containing data from 1980 samples, was selected to analyze the genomic profile changes of CCS, including mutation, putative copy-number alterations from DNA copy (CNAs), and mRNA expression z-scores relative to all samples (log microarray). A P value of less than .05 was used as the cutoff.
TNMplot database analysis
The TNMplot database (https://www.tnmplot.com/) is also a useful tool for analyzing gene expression in tumors, normal and metastatic tissues. Copper chaperone for superoxide dismutase expression in normal, cancerous, and metastatic tissues was evaluated and compared with RNA-sequencing data.
bc-GenExMiner database analysis
The expression of CCS in breast cancer patients was further evaluated using the Breast Cancer Gene-Expression Miner v4.7 online database (http://bcgenex.centregauducheau.fr). The web-based data set is a statistical exploration tool for published annotated transcriptomic breast cancer data, including DNA microarrays and RNA-seq, which can be used for statistical analysis of gene expression, correlation, and prognosis. The relationship between CCS and clinic pathological parameters or the BRCA1/BRCA2 status of patients with breast cancer was evaluated using bc-GenExMiner v4.7. Global significant differences between groups were assessed using the Welch t test to generate P value, along with the Dunnett-Tukey-Kramer test.
HPA database analysis
The HPA data (http://www.proteinatlas.org) were used to investigate CCS protein expression in patients. HPA is a platform that contains IHC-based protein expression data for 20 major cancer types. 23 In this study, the protein expression of CCS in malignant lymphomas and 19 types of cancer was directly visualized using HPA analysis.
PrognoScan online database and Kaplan-Meier curve analysis
The PrognoScan online database (http://www.prognoscan.org/) is a useful tool for identifying tumor biomarkers or therapeutic targets. PrognoScan database analysis was used to validate the importance of CCS mRNA expression in breast cancer patients, and a corrected P value was used to alter the threshold. The online tool was used to divide CCS expression into “high” and “low” expression categories based on the median expression of genes. Blue curves represent low CCS expression, while red curves represent strong CCS expression. The prognostic value of CCS in OS and distant metastasis-free survival (DMFS) of luminal B breast cancer patients was examined with Kaplan-Meier (KM) curve from DNA microarray collected by Breast Cancer Gene-Expression Miner v5.0 platform and compared by log-rank test. All tests were considered statistically significant at P < .05.
Gene networks, Gene Ontology, and KEGG pathway enrichment analysis
We compared differentially expressed genes in samples with high or low CCS expression among luminal B molecular types to examine the functional relevance of the CCS gene in luminal types of breast cancer. The corrected P values and fold-change values were used to create volcano graphs. Statistically significant up-regulated genes are represented by red dots in the plot, whereas down-regulated genes are represented by blue points. The differently expressed mRNA levels between tumor and normal tissues were examined using hierarchical clustering. Enriched KEGG signaling pathways were chosen to demonstrate the key biological actions of the major potential mRNAs. The x-axis shows the ratio of genes, and the enriched pathways are presented on the y-axis. Gene Ontology was used to analyze potential target mRNAs. The biological process (BP), cellular component (CC), and molecular function (MF) of potential targets were grouped according to the Cluster Profiler software (version 3.18.0), and a P value < .05 or FDR <0.05 was considered to indicate a significant pathway.
Clinical bioinformatics analysis
A clinical bioinformatics database (www.aclbi.com) is a multifunctional analytical platform that currently contains data on up to 40 disease types. RNA-sequencing expression (level 3) profiles and corresponding clinical information for CCS in luminal B patients were downloaded from The Cancer Genome Atlas (TCGA) data set (https://portal.gdc.com), as well as to analyze the differentially expressed genes between the high-expression group of CCS in luminal B breast cancer and the normal group, with the aim of elucidating the functional role of these genes. Subsequently, the functions of these up-regulated or down-regulated genes were screened through functional enrichment. In addition, using this software, we were able to examine how genes and clinical parameters including age, sex, and TNM stage affected prognosis. First, univariate Cox regression analysis was used to show that CCS was associated with prognosis, while multivariate Cox regression analysis showed that CCS could be considered an independent prognostic factor. Based on the results of multivariate Cox regression analysis, this tool can automatically extract variables with significant differences in prognosis to construct a nomogram for clinical prognosis. A nomogram was created to predict overall X-year recurrence based on the findings of multivariate Cox proportional hazards analysis. 24 The nomogram gives a graphic representation of the variables that can be used to determine a patient unique risk of recurrence based on the points connected to each risk factor. R software version 4.0.3 (The R Foundation for Statistical Computing, 2020) was used to conduct all analytical procedures, and P values < .05 were considered statistically significant.
Results
Human breast cancer shows high expression of CCS
In our previous study, we examined the expression of CCS in several breast cancer cell lines by quantitative polymerase chain reaction (qPCR) and western blot. 21 Here, we sought to further verify the CCS expression through the HPA database and assist in the bioinformatics analysis of clinical samples. We first analyzed the expression patterns of CCS in different cancers. As shown in Figure 1A, moderate CCS staining was found in more than 80% of malignant lymphoma samples, nearly 50% of breast cancer samples, ~20% of carcinoid, melanoma, prostate cancer, and thyroid cancer samples, and ~10% of testis cancer samples through the HPA database analysis. In contrast, no positive signals were found among cervical cancer, colorectal cancer, glioma, head and neck cancer, lung cancer, pancreatic cancer, and urothelial cancer samples, which imply tissue-specific expression of CCS. Moreover, CCS mRNA expression levels were compared between tumor samples and normal tissues using the Clinical Bioinformatics Analysis Assistant (www.aclbi.com). According to data from the TCGA and GTEx databases, CCS expression was considerably increased in BRCA patients (Figure 1B), and it was greatest in metastatic tissues relative to normal and malignant tissues (Figure 1C). We also investigated the transcriptional data of CCS in patients with breast cancer from the cBioPortal databases (https://www.cbioportal.org/); the graphical representation reveals a notable elevation of CCS mRNA levels in breast cancer samples exhibiting amplification of CCS mRNA (Figure 1D). To further support this discovery, CCS expression patterns in breast cancer tissue microarrays including 90 biopsies (70 breast cancer tissues and 20 nontumor normal breast tissues) were identified by IHC employing a CCS-specific antibody. Copper chaperone for superoxide dismutase immune staining was found to be stronger in breast cancer tissue than in para cancer tissue (Figure 1E and F). Taken together, the above findings show that CCS is abundant in breast cancer tissues and may be a predictive indicator for breast carcinoma.

The protein and mRNA expressions of CCS in normal, tumor, and metastatic tissues: (A) protein expression summary of CCS in 20 types of cancers was evaluated using the HPA database; (B) compared mRNA expression levels between CCS tumor samples and normal tissues through Assistant for Clinical Bioinformatics Analysis (www.aclbi.com) from The Cancer Genome Atlas and GTEx database; (C) the TNMplot database (https://www.tnmplot.com/) is used for analyzing CCS expression in tumor tissues, normal tissues, and metastatic tissues; (D) a plot showing the relationship between CCS mRNA abundance and CNA in the CCS gene in tumors from the breast cancer study. Shallow deletion: low-level gene loss event; diploid: 2 alleles present; gain: low-level gene amplification event; amp: high-level gene amplification event; and (E, F) the CCS expression detected by immunohistochemistry. Scale bar: 50 μm.
Expression of CCS is related to clinical pathological parameters and prognosis
To assess the relationship between CCS expression and the clinical-pathological characteristics of BRCA, multiple clinic pathological features of 1097 breast cancer samples in TCGA were analyzed by UALCAN database subgroup analysis. Copper chaperone for superoxide dismutase expression levels were considerably higher in cancer patients of all ages than in the control group, with CCS displaying the greatest expression in patients aged 41 to 60 years (Figure 2A). In addition, among patients with breast cancer, the expression of CCS was greater in women than in men (Figure 2B). The expression of CCS in BRCA patients, as analyzed by race, showed that CCS was more expressed in African-American patients compared with those of other races, including white and Asian (Figure 2C). Moreover, the expression level of CCS in different stages of breast cancer was significantly higher than that in normal tissue (Figure 2D). In addition, corresponding clinical characterization information of CCS (Table 1) in 194 luminal breast cancer tumors was obtained from TCGA data set (https://portal.gdc.com). Survival association analyses, including overall survival (OS) and postprogression survival (PPS), were conducted to further verify the correlation of CCS expression with prognosis in BRCA. Moreover, according to the KM plotter data, patients with strong CCS expression had a lower OS and PPS (Figure 2E). In brief, CCS expression was linked to clinicopathological parameters and poor survival and may serve as a diagnostic indicator of BRCA patients.

CCS transcription in subgroups of patients with breast cancer, stratified based on age, sex, race, and cancer stages. The University of ALabama at Birmingham CANcer data analysis Portal (UALCAN): (A) boxplot showing relative expression of CCS in normal and BRCA patients based on age; (B) boxplot showing relative expression of CCS in normal and BRCA patients based on sex; (C) boxplot showing relative expression of CCS in normal and BRCA patients based on race; (D) boxplot showing relative expression of CCS in normal and BRCA patients based on cancer stages; (E) the correlation between CCS expression and overall survival in BRCA patients; and (F) the correlation between CCS expression and postprogression survival in BRCA patients. Data are mean ± SE.
RNA-sequencing expression (level 3) profiles and corresponding clinical information for CCS in luminal B patients were downloaded from the TCGA data set (https://portal.gdc.com).

Abbreviations: CCS, copper chaperone for superoxide dismutase; TCGA, The Cancer Genome Atlas.
The measurement data are displayed as the mean ± SD. Unpaired t test was used for analyzing statistical assessments.
BRCA1/BRCA2 mutations affect CCS expression
The BRCA1/BRCA2 and TP53 genes are directly associated with inherited breast cancer, but may also inhibit the development of malignant tumors. Families with these gene mutations have an increased risk of developing breast cancer. Therefore, the effects of these gene mutations on CCS expression were analyzed. The results showed that neither BRCA1 nor BRCA2 mutations alone had a significant effect on CCS expression (Figure 3A and B), whereas BRCA1 and BRCA2 double mutations significantly affected CCS expression (P = .0243) (Figure 3C). Meanwhile, CCS expression was considerably lower in the TP53 mutant group compared with the wild-type group (P = .0002, Figure 3D). Collectively, these findings imply that CCS expression is linked to BRCA1/BRCA2 mutations in breast cancer.

Boxplots of CCS expression according to BRCAs and TP53 mutation status: (A) boxplots of CCS expression according to wild and mutation of BRCA1 status from TCGA data; (B) boxplots of CCS expression according to wild and mutation of BRCA2 status from TCGA data; (C) boxplots of CCS expression according to wild and mutation status of BRCA1/2 from TCGA data; and (D) boxplots of CCS expression according to wild and mutation of TP53 status from TCGA data.
Receptor expression affects CCS expression
Receptor expression is an important basis for the molecular classification of breast cancer. Using bc-GenExMiner v4.7, we investigated the connection between CCS expression and ER, PR, and HER2 status. Copper chaperone for superoxide dismutase mRNA expression was considerably elevated in the ER+ and PR+ groups compared with the ER2 (−) and PR (−) groups, respectively (P < .0001; Figure 4A and B). However, the CCS RNA expression in the epidermal growth factor receptor-2 (HER2) (−) group was significantly lower than that in the HER2 (+) group (P = .0023) (Figure 4C). We next analyzed the expression of CCS in the 4 states of ER/PR, including ER+/PR+, ER+/PR−, ER−/PR+, and ER−/PR−, and the outcomes demonstrated that the ER+/PR+ condition had the highest expression (P < .0001) when compared with the other 3 (Figure 4D).

Analysis of the correlation of CCS expression with hormone status: (A) boxplots of CCS expression according to ER status from RNA-seq data; (B) boxplots of CCS expression according to PR status from RNA-seq data; (C) boxplots of CCS expression according to PR status from RNA-seq data; and (D) boxplots of CCS expression according to ER+/PR+, ER+/PR−, ER−/PR+, and ER−/PR− status from RNA-seq data.
CCS is an independent biomarker for prognosis in luminal B subtype breast cancer
To identify the detailed relationship between the CCS level and molecular types of breast cancer, CCS expression was analyzed according to Prediction Analysis of Microarray 50 (PAM50) and Subtype Classification Model 1 (SCMOD1) subtype classes. The findings demonstrated that, compared with other subtypes, such as basal-like, HER2, luminal A, and normal-breast-like, the luminal B subtype had the greatest expression of CCS (Figure 5A and B). We then used univariable and multivariable Cox regression models to examine the impact of CCS and clinical parameters, including age, race, and stage influence on prognosis. The results of univariate and multivariate Cox analyses showed that CCS, age, and pTNM stage were significantly associated with OS (Figure 5C and D); it showed that these 3 variables were independent predictive variables in breast cancer of the luminal B subtype. Using the Assistant for Clinical Bioinformatics database, variables with significant prognostic differences were identified and used to generate a prognostic nomogram for patients with luminal B subtype breast cancer using multivariate Cox regression analysis (Figure 5E). As shown in Figure 5F, calibration analysis revealed that the nomogram for the 1-year survival rate (red line) was highly similar to the ideal performance (45° gray line) when compared with the 3-year (orange line) and 5-year (blue line) survival rates, indicating that this model predicted a remarkably accurate nomogram. The prognostic value of CCS in the OS and DMFS of luminal B breast cancer patients were examined with the KM curves and compared using the log-rank test. Overall survival (P = .0349) and DMFS (P = .0260) of patients with low CCS mRNA expression were significantly better than patients with high CCS mRNA expression (Figure 5G and H), which indicates that high CCS mRNA expression may be a poor prognostic marker of luminal B breast cancer.
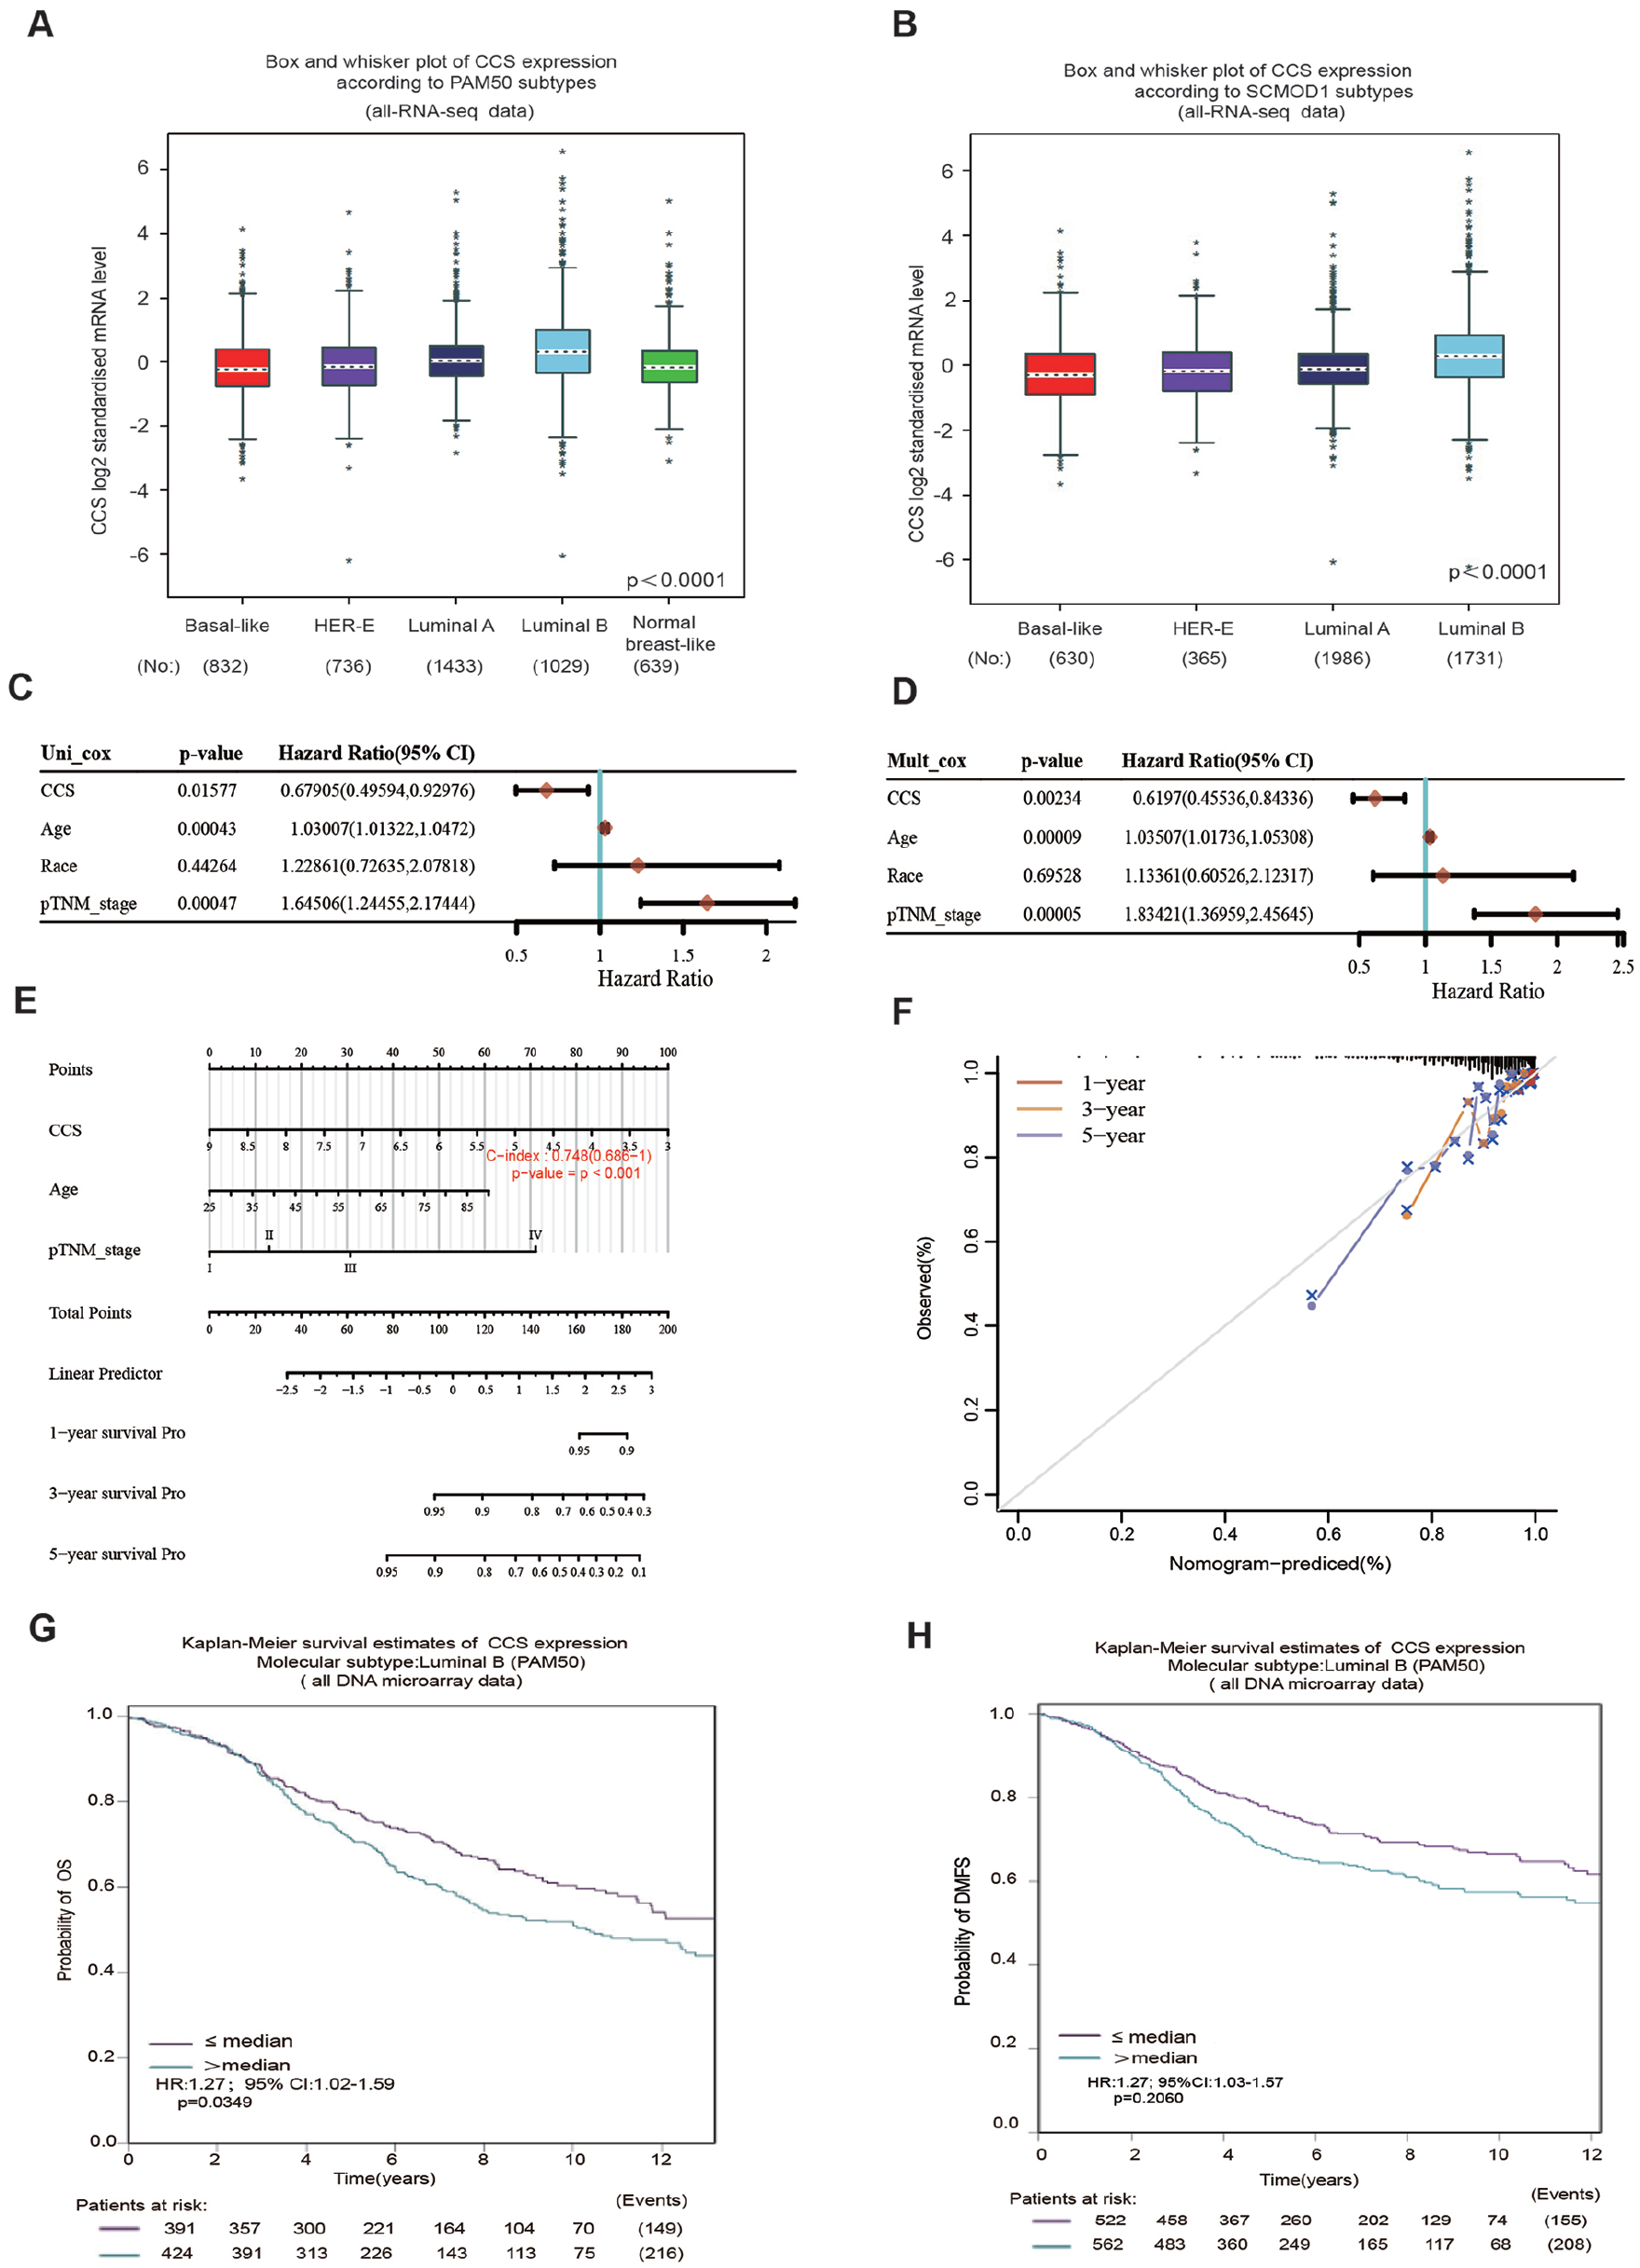
Boxplots of CCS expression according to PAMP50 and SCMOD1 2 different classification methods: (A) boxplots of CCS expression according to PAMP50 subtypes from RNA-seq data; (B) boxplots of CCS expression according to SCMOD1 subtypes from RNA-seq data; (C) HR and P value of constituents involved in univariate Cox regression and age, race, and pTNM_stage parameters of the CCS gene; (D) HR and P value of constituents involved in multivariate Cox regression and age, race, and pTNM_stage parameters of the CCS gene; (E) nomogram to predict the 1-year, 3-year, and 5-year overall survival of luminal B breast cancer patients; (F) calibration curve for the OS nomogram model in the breast cancer group. A dashed diagonal line represents the ideal nomogram, and the red line, orange line, and blue line represent the 1-year, 3-year, and 5-year observed nomograms; (G) Kaplan-Meier analysis of the association between CCS mRNA expression and OS in luminal B breast cancer patients; and (H) Kaplan-Meier analysis of the association between CCS mRNA expression and distant metatasis-free survival in luminal B breast cancer patients.
Function enrichment of CCS in luminal B subtype breast cancer
We next sought to confirm the mechanism behind the elevated CCS expression in luminal B subtype breast cancer. Normal breast tissue gene expression and the elevated CCS expression in luminal B subtype breast cancer were analyzed to obtain clues to the function of CCS from TCGA RNA data set by Assistant for clinical bioinformatics analysis online, which used the Limma package in R software to study the differentially expressed mRNA. As a result, we identified 1327 up-regulated and 2318 down-regulated genes (Figure 6A). In the heatmap showing differential gene expression, different colors represent the trend of gene expression in different tissues. The top 50 up- and down-regulated genes from normal and luminal subtype tissues are shown in the heatmap in different colors (Figure 6B). These up-regulated genes were analyzed in luminal B subtype tissues and compared with normal tissues by GO and KEGG pathway enrichment analyses. The findings showed that the strongest association between these proteins and DNA replication, DNA packaging, DNA conformation change, and cell cycle was found (Figure 6C and D). In gene expression, proliferation-related genes, such as CCNB1, MKI67, and MYBL2, are highly expressed in medium-sized luminal B histological grade III tumors. 25 Therefore, we analyzed the correlations between CCS and DNA replication pathway scores using Spearman analysis, and the results showed that the expression of CCS was significantly correlated with the DNA replication pathway (Figure 6E). We analyzed the correlation between CCS and CCNB1, MKI67, and MYBL2 expression, and found a positive connection between CCS and MYBL2 expression, a protein related to cell cycle progression (Figure 6F). Taken together, these findings imply that increased CCS expression promotes tumor progression by participating in cell cycle progression in luminal B subtype breast cancer.

Using the Limma package in the R software to analysis of differentially expressed genes in luminal B breast cancer with high expression of CCS compared with normal breast cancer with low expression of CCS: (A) volcano plot: The volcano plot was constructed using the fold change values and P-adjust. Red dots indicate upregulated genes; blue dots indicate down-regulated genes; gray dots indicate not significant; (B) the heatmap of the differential gene expression, different colors represent the trend of gene expression in different tissues. The top 50 up-regulated genes and top 50 down-regulated genes were showed in this figure; (C) Gene Ontology is analyzed for annotating genes with functions; (D) genes with functions are annotated using the KEGG pathway analysis. The size of the circles shows the number of genes; the wider the circle, the more genes. Colors indicate the importance of differential enrichment. A relevant route in the enrichment result is defined as P = .05 or FDR = 0.05 (enrichment score with log10 [P] of greater than 1.3). (E) The correlations between CCS gene and DNA replication pathway score were analyzed with Spearman; and (F) analysis correlation between CCS gene and proliferation-related genes with Spearman. The abscissa and ordinate represent genes, and different colors represent different correlation coefficients (blue represents positive correlation), the darker the color, the stronger the relation.
Discussion
Breast cancer represents a major threat to the health of women worldwide. 26 Breast cancer is a varied collection of tumors, and depending on the subtype, the prognosis and response to therapy might vary. 27 The prognosis of luminal-type breast cancer is better than that of other subtypes due to the use of targeted therapies for estrogen-receptor positive tumors. In addition, luminal B breast cancer has lower expression of hormone receptors, higher expression of proliferation markers, higher histologic grade, and worse prognosis, as well as being more resistant to endocrine therapy and chemotherapy compared with the luminal A subtype.28,29 However, clinical and basic studies have failed to elucidate many characteristics of luminal B breast cancer. Copper plays important roles in cell proliferation and angiogenesis in several physiological processes, and high levels of copper accumulation have been observed in several tumor tissues.17,18,20 Copper transporters such as copper transporter 1 (CTR1), copper-transporting P-type ATPase and (ATP7A and ATP7B), and copper chaperones such as CCS 1 and antioxidant-1 (Atox-1) regulate the bioavailability of intracellular copper; abnormalities that cause intracellular copper accumulation are involved in the progression of tumors.30,31 Protein expression summary analysis of the HPA database showed that CCS expression was highest in lymphoma, breast cancer, and carcinoids. In this study, through analysis of multiple databases and immunohistochemical data, we confirmed higher expression of CCS in breast cancer metastatic tissues compared with normal and tumor tissues, which was consistent with the results of our previous research in migratory breast cancer cell lines. Notably, CCS expression was found to be associated with clinical pathological characteristics such as age, sex, and race from RNA-seq data. The most common breast cancer markers are ER and PR status, which absence status is a sign of a poor prognosis. 32 Therefore, we analyzed the relationship of CCS gene expression with ER and PR status, and the results showed that CCS gene expression was influenced by the status of ERs and PRs in breast cancer.
PAM50 is a well-known classification method in oncology research that uses 50 genetic features to classify breast cancer into 5 different types.33,34 To investigate the possible role of CCS genes in different subtypes of breast cancer, we compared CCS expression in different subtypes according to PAM50 and SCMOD1 subtypes, the results showed that the expression of CCS was highest in luminal B type compared with other subtypes in both PAM50 and SCMOD1 subtypes. The effect of CCS expression on the prognosis of patients with luminal B patients was further investigated, KM analysis found that high CCS mRNA expression indicates a poor prognosis of luminal B patients, univariate and multivariate Cox regression models revealed that CCS may be an independent prognostic factor in luminal B patients.
BRCA (BReast-CAncer susceptibility gene) comprises BRCA1 and BRCA2. An increased risk of breast cancer is linked to BRCA1 and BRCA2 mutations. 35 Numerous crucial physiological activities have been linked to BRCA proteins; in particular, both genes contribute to DNA repair and transcriptional control in response to DNA damage. 36 In addition, recent findings indicate that BRCAs control the transcription of several genes related to DNA repair, the cell cycle, and apoptosis. 37 Therefore, we analyzed the effect of BRCA genes on CCS expression and found that mutations in BRCA1 and BRCA2 did not affect the expression of CCS genes. These results suggest that changes in the high expression of cell proliferation-related genes caused by high CCS expression in luminal B breast cancer are not associated with mutations in BRCA genes. Compared with BRCA1/2 gene mutations, TP53 gene mutations are rare in breast cancer, but patients with TP53 gene mutations have an increased risk of developing breast cancer. 38 Therefore, we analyzed the effect of TP53 status on CCS expression and showed that CCS expression was significantly reduced in the TP53 mutant group compared with the wild type. However, the specific molecular mechanism underlying how the double BRAC1/BRCA2 gene mutation and the TP53 mutation function to reduce CCS expression needs further analysis.
By using gene chip-based data, we discovered that metastatic breast cancer tissues had the greatest levels of CCS expression, which was consistent with our previous results indicating that invasive breast cancer cells exhibit a high level of CCS expression. Overexpressed CCS may operate as a tumor promoter in breast cancer since its silencer activates the ROS-mediated MEK/ERK pathways to inhibit tumor cell proliferation. 21 To further clarify the molecular mechanism of high CCS expression in the luminal B subtype, we compared the differential genes in 2 groups of luminal B breast cancer samples—the CCS high expression group and the normal breast CCS low expression group, and the differential genes were functionally enriched to provide clues for CCS gene function in luminal B breast cancer. The results of GO and pathway analyses showed that the high expression group was mainly involved in DNA replication, cell cycle, and DNA conformation change and that CCS expression was significantly associated with the tumor proliferation-related gene MYBL2 by correlation analysis. MYBL2 is part of the MYB family of transcription factors, which is an essential component in the regulation of vital cellular processes, including cell proliferation, differentiation, and DNA repair. Indeed, expression of MYBL2 has been identified as a predictor of recurrence, resistance, and metastasis in cells, especially.39-42 However, how CCS and MYBL2 collaborate to promote cancer cell progression in luminal B breast cancer requires further investigation.
The increasing survival rate of breast cancer in recent years is partially attributable to the development of clinically efficient treatment paths based on a better knowledge of molecular subtypes. 43 We performed a bioinformatics analysis using public databases to assess the expression of CCS and its relationship with clinicopathologic parameters and potential prognostic value. This discovery will contribute to the establishment of a theoretical framework for predicting risks and implementing customized interventions and therapies for luminal breast cancer in the clinical setting. Nevertheless, it is crucial to recognize the current constraints in our research. Additional in vitro and in vivo studies are necessary to authenticate our results. We anticipate that our findings will offer a fresh perspective that could potentially enhance the clinical utilization of CCS as prognostic biomarkers in luminal B breast cancer in the foreseeable future.
Conclusions
In summary, the results of our investigation illustrate the correlation between the expression of CCS in breast cancer and various clinicopathologic parameters. Moreover, our research emphasizes the independent prognostic significance of CCS specifically in luminal B breast cancer subtypes. These results establish a theoretical groundwork for future investigations on the potential utilization of CCS as a biomarker for luminal B breast cancer.
Footnotes
Acknowledgements
We appreciate all the free online databases that have helped us with our research.
Author Contributions
YL designed the project, conducted the bioinformatic analysis, and wrote the initial manuscript. WD conducted the bioinformatic analysis. RY conducted the immunohistochemical staining experiment data analysis. XW assisted with data analysis. HL assisted with data analysis. XZ provided the funding and revised the manuscript.
Declaration of conflicting interests:
The author(s) declared no potential conflicts of interest with respect to the research, authorship, and/or publication of this article.
Funding:
The author(s) disclosed receipt of the following financial support for the research, authorship, and/or publication of this article: This work was supported by the National Natural Science Foundation of China (no. 82002961 to Y.L.) and Research Fund for Academician He Lin New Medicine (JYHL2022MS03 to X.Z.).
Data Availability Statement
The data are available for all study authors. The data sets used and analyzed during the current study are available from the corresponding author on reasonable request.
Ethics Approval and Consent to Participate
Not applicable.