
Abstract
Background:
Radiomics strategies exhibit great promise in the context of thyroid nodule diagnosis. This study aimed to compare radiomics features of different sizes of medullary thyroid carcinoma (MTC) and papillary thyroid carcinoma (PTC) tumors and to compare the efficiency of radiomics approaches as a means of differentiating between these tumor types.
Methods:
In total, 86 MTC and 330 PTC nodules were divided into the macronodular (>10 mm) and micronodular (⩽10 mm) categories. The radiomics features of these nodules were analyzed to identify independent prognosis factors and evaluate the efficacy of individual and combined indicators as predictors of tumor type.
Results:
In total, 12 radiomics features were found to differ significantly between MTC and PTC macronodules, while 6 differed significantly between MTC and PTC micronodules. Shape 2D_Sphericity, firstorder_Skewness, glrlm_RunLengthNonUniformity, glszm_GrayLevelNonUniformity, and glszm_SizeZoneNonUniformity were features that were independently associated with the differential diagnoses of MTC and PTC macronodules. Receiver operating characteristic (ROC) curve analyses of the efficacy of these 5 single indicators and a combined indicator composed thereof yielded area under the curve (AUC) values of 0.621, 0.678, 0.704, 0.762, 0.747, and 0.824, respectively, with respective sensitivities of 55.3%, 43.0%, 53.1%, 56.3%, 46.9%, and 65.6%, and respective specificity values of 65.6%, 89.1%, 81.6%, 88.8%, 95.0%, and 91.1%. The glrlm_RunEntropy and glszm_SizeZoneNonUniformity features were identified as independent factors associated with the differential diagnoses of MTC and PTC micronodules. Receiver operating characteristic curve analyses of the efficacy of these 2 single indicators and a combined indicator composed thereof yielded respective AUC values of 0.678, 0.678, and 0.771; Sensitivities of 57.0%, 72.7%, and 72.7%; and specificities of 77.3%, 64.2%, and 77.5%.
Conclusions:
A range of different radiomics features can enable effective differentiation between MTC and PTC nodules of different sizes. Moreover, analyses of combinations of radiomics features yielded diagnostic efficiency values higher than those associated with single radiomics features, highlighting a more reliable approach to diagnosing MTC and PTC tumors.
Introduction
Medullary thyroid carcinoma (MTC) and papillary thyroid carcinoma (PTC) are endocrine malignancies that are primarily detected via thyroid ultrasonography. Aschebrook-Kilfoy et al 1 posited that no ultrasonographic findings can reliably differentiate between MTC and PTC tumors, with nodule size being one of the primary determinants of ultrasound characteristics. Zhou et al2 -4 further suggested that MTC nodules >1.0 cm in size differed from those of nodules ⩽1.0 cm in size.For example, MTC nodules ⩽1.0 cm in size with a width-diameter ratio >1 tend to exhibit poor blood flow and low rates of cervical lymph node metastasis, consistent with typical findings associated with PTC nodules ⩽1.0 cm in size. Moreover, the calcification, internal composition, and echoic features of MTC and PTC lesions >1.0 cm in size are very similar to one another. As such, there is substantial overlap with respect to the ultrasonographic features of MTC and PTC nodules of different sizes, yet the prognosis of these different nodules and their responsiveness to treatment can differ greatly. As such, the selection of an appropriate treatment strategy based solely on ultrasonography findings can be very challenging.
As there is an inherent degree of subjectivity to the visual interpretation of ultrasound images, there are often substantial differences among diagnosticians with respect to judgments made regarding MTC and PTC nodules of different sizes.5,6 Lambin et al 7 first proposed a radiomics, approach that extracts high dimensional features from medical images. Gu 8 has since found such an approach to be a reliable means of quantitatively differentiating between and diagnosing benign and malignant thyroid nodules. Liang et al 9 also reported similar findings, and Yoon et al 10 applied texture analyses and the LASSO method to interpret ultrasonographic images to classify malignant thyroid nodules with indeterminate cytology, achieving satisfactory predictive performance. To date, however, these approaches have primarily focused on distinguishing between benign and malignant thyroid nodules based on radiomics features. Whether such an approach can similarly be used to differentiate between MTC and PTC nodules of differing sizes remains to be established.
Herein, we sought to compare the radiomics features of MTC and PTC nodules of different sizes with the goal of better-defining radiomics features capable of reliably aiding in the differential diagnosis of these two tumor types, including 2D shape features, first-order features, gray-level co-occurrence matrix (GLCM) features, gray-level dependence matrix (GLDM) features, gray-level run length matrix (GLRLM) features, gray-level size zone matrix (GLSZM) features, and neighboring gray-tone difference matrix (NGTDM) features.
Methods
Clinical subjects
Retrospective study data from consecutive MTC and PTC patients from West China Hospital of Sichuan University were collected from February 2005 through September 2021. As there are usually fewer MTC patients than PTC patients, all MTC patients were first selected, after which PTC patients evaluated during this same period were selected at random to reduce selection bias. Ultrasound imaging data were used to define each nodule as being either macronodular (>10 mm) or micronodular (⩽10 mm). Patients eligible for inclusion were those who had undergone surgical resection and been diagnosed via pathologic examination, with thyroid ultrasonography having been performed for all patients at first observation. Patients were excluded from this study if they had undergone previous thyroid surgery, adjunctive treatment such as thyroid radiation, or chemotherapy. In addition, those patients whose ultrasound images did not meet the quality control standards of the department were excluded. In total, imaging data from 86 and 330 MTC and PTC patients, respectively, were analyzed herein. The primary approach of this study was the utilization of receiver operating characteristic (ROC) curves to analyze the differential diagnosis of MTC (positive) and PTC(negative). Accordingly, the PASS software was used to calculate sample size according to ROC results. With an AUC of 0.7 as the null hypothesis and an AUC of 0.85 as an alternative hypothesis, at a test level of 0.05 and a test efficiency of 0.85, 32 cases were needed in the positive group (MTC patients) according to a 1/5 positive/negative ratio. With AUC = 0.60 as the null hypothesis and AUC = 0.75 as the alternative hypothesis, 86 cases in the positive group (MTC patients) and 83 cases in the negative group (PTC patients) were calculated under a test level of 0.05 and test efficiency of 0.95. The power value calculated by using 86 cases in the positive group and 330 cases in the negative group reached 99.42%. Therefore, the sample size of 86 MTC and 330 PTC patients in this study achieved sufficiently high test efficiency.11,12 Our study was approved by the ethics committee of West China Hospital of Sichuan University (approval number: 2021-919), and the need to obtain written informed consent was waived due to its retrospective nature. The study was performed according to the principles of the Declaration of Helsinki.
Image acquisition
All patients underwent preoperative thyroid ultrasound (US) using the Philips iU22, Philips HD11XE, and Philips Envisor HD2 with a commercially available 5 to 12 MHz linear-array transducer before surgery. A total of 7 radiologists with 5 to 20 years of experience in the thyroid US performed all ultrasonographic imaging for this study.
Radiomics feature extraction
Two-dimensional (2D) images were used, and all JPG format images were collected from the picture archiving and communication system. Radiologist 1 (10 years experience) selected one 2D image with the largest cross-section for every thyroid nodule and drew a single region-of-interest (ROI) along the nodule margin using Photoshop software (Figure 1A and B). Then, the ROIs were validated by radiologist 2 (20 years experience). These radiologists were blinded to pathology findings. For multifocal disease, we selected the largest nodule for analysis. Radiomics hold great promise as a modern approach to thyroid tumor diagnosis. 13 However, due to the limited code capabilities of our research group, we were unable to develop a feature extraction tool comparable to Pyradiomics. The reliability and stability of Pyradiomics have been widely recognized. 14 As such, it was used for feature extraction in our study. The contours (Figure 1C and D) and radiomics features from each volume of interest were extracted with the “PyRadiomics 3.0.1” package in Python software (Python 3.6.10.).

(A) and (B): manual segmentation; (C) and (D): extracted nodule contour.
In total, 102 radiomics features were extracted from each volume of interest, including 9 2D shape features, 18 first-order features, 24 GLCM features, 14 GLDM features, 16 GLRLM features, 16 GLSZM features, and 5 NGTDM features. Details regarding these radiomics features are listed in Table 1.
Details and descriptions of the radiomics features.

GLCM, gray-level co-occurrence matrix; GLDM, gray-level dependence matrix; GLRLM, gray-level run length matrix; GLSZM, gray-level size zone matrix; NGTDM, neighboring gray-tone difference matrix; ROI, region-of-interest.
Statistical analysis
SPSS v25 was used for all statistical testing. Data are given as means ± SD when normally distributed and were otherwise given as medians. Optimal radiomics feature selection and comparisons among groups were performed using t-tests, Mann-Whitney U-tests, and least absolute shrinkage selection operator (LASSO) approaches. Independent predictors of MTC or PTC nodule diagnoses were identified via a logistic regression analysis approach. Receiver operating characteristic curves based on the developed models were then used to assess the diagnostic efficiency of different individual and combined radiomics indicators based on area under the curve (AUC), sensitivity, specificity, and cut-off values. P < .05 was the threshold of statistical significance.
Results
Patient information
In total, 86 MTC patients (28 male, 58 female) with a median age of 46 years (range: 17-75) were included in this study, of whom 64 and 22 exhibited macronodules and micronodules, respectively. In addition, 330 PTC patients (86 male, 244 female) were included in this study with a median age of 40.50 years (range: 7-72), of whom 179 and 151 exhibited macronodules and micronodules, respectively.
Comparison of MTC and PTC macronodule radiomics features
Using t-tests or Mann-Whitney U-tests, 30 significant radiomics features that differed between MTC and PTC macronodules were identified and subjected to LASSO regression to filter out 12 features exhibiting noncollinearity. The firstorder_Energy, glrlm_RunLengthNonUniformity, glszm_GrayLevelNonUniformity, glszm_SizeZoneNonUniformity, glszm_SmallAreaEmphasis, glszm_ZonePercentage, and ngtdm_Busyness values in MTC macronodules were significantly greater than corresponding values in PTC macronodules (Z = 3.319, P <.05; Z = 4.838, P < .05; Z = 6.212, P < .05; Z = 5.860, P < .05; Z = 3.769, P < .05; Z = 3.292, P <.05; Z = 6.075, P < .05). The shape2D_PerimeterSurfaceRatio, shape2D_Sphericity, firstorder_Minimum, firstorder_Skewness, and glcm_ClusterShade radiomics features were significantly greater in PTC macronodules relative to corresponding values in MTC macronodules (Z = 4.513, P < .05; Z = 2.878, P < .05; Z = 3.481, P < .05; t = 4.698, P < .05; Z = 2.238, P < .05).
Evaluation of the diagnostic efficiency of individual radiomics features as tools for differentiating between MTC and PTC macronodules
Logistic regression analyses indicated that shape2D_Sphericity, firstorder_Skewness, glrlm_RunLengthNonUniformity, glszm_GrayLevelNonUniformity, and glszm_SizeZoneNonUniformity were independent indicators of MTC or PTC macronodule diagnosis (Table 2), with AUC, sensitivity, specificity, and cut-off values being summarized in Table 3 and Figure 2.
Results of logistic regression analysis of radiomics features in diagnosis of MTC and PTC macronodules.

SE, standard error.
The efficacy of single and combined indicator differential diagnoses models for macronodules and micronodules of MTC and PTC.

AUC, area under the curve.

ROC analysis of the diagnostic ability of radiomics features used to distinguish between MTC and PTC macronodules. This approach revealed that combined indicators based on 5 radiomics features had significantly higher diagnostic accuracy than the corresponding individual radiomics features, all P < .05.
Evaluation of the diagnostic efficiency of a combined radiomics indicator as a tool for differentiating between MTC and PTC macronodules
A logistic regression model for the differential diagnosis of MTC and PTC macronodules based on the 5 radiomics features identified above was next developed with the following formula: logistic(P) = 5.226 − 8.025 × shape2D_Sphericity-0.87 × firStorder_Skewness − 0.002 × grlrlm_RunLengthNonUniformity + 0.024 × glszm_GrayLevel-NonUniformity + 0.036 × glszm_SizeZoneNonUniformity. Corresponding AUC, sensitivity, specificity, and cut-off values are summarized in Table 3 and Figure 2.
Comparison of MTC and PTC micronodule radiomics features
Using t-tests or Mann-Whitney U-tests, 12 significant radiomics features that differed between MTC and PTC micronodules were identified and subjected to LASSO regression to filter out 6 features exhibiting noncollinearity. This analysis revealed the glcm_Imc1, glszm_SizeZoneNonUniformity, and glszm_ZonePercentage values in MTC micronodules to be greater than those in PTC micronodules (Z = 2.829, P < .05; Z = 2.693, P < .05; Z = 2.948, P < .05). The firstorder_Minimum, glrlm_LongRunHighGrayLevelEmphasis, and glrlm_RunEntropy features were also significantly larger in PTC micronodules relative to MTC micronodules (Z = 2.088, P < .05; Z = 2.634, P < .05; t = 2.954, P <.05).
Evaluation of the diagnostic efficiency of individual radiomics features as tools for differentiating between MTC and PTC micronodules
Logistic regression analyses revealed glrlm_RunEntropy and glszm_SizeZoneNonUniformity to be independent indicators of MTC or PTC micronodule diagnosis (Table 4), with AUC, sensitivity, specificity, and cut-off values being summarized in Table 3 and Figure 3.
Results of logistic regression analysis of radiomics features in diagnosis of MTC and PTC micronodules.
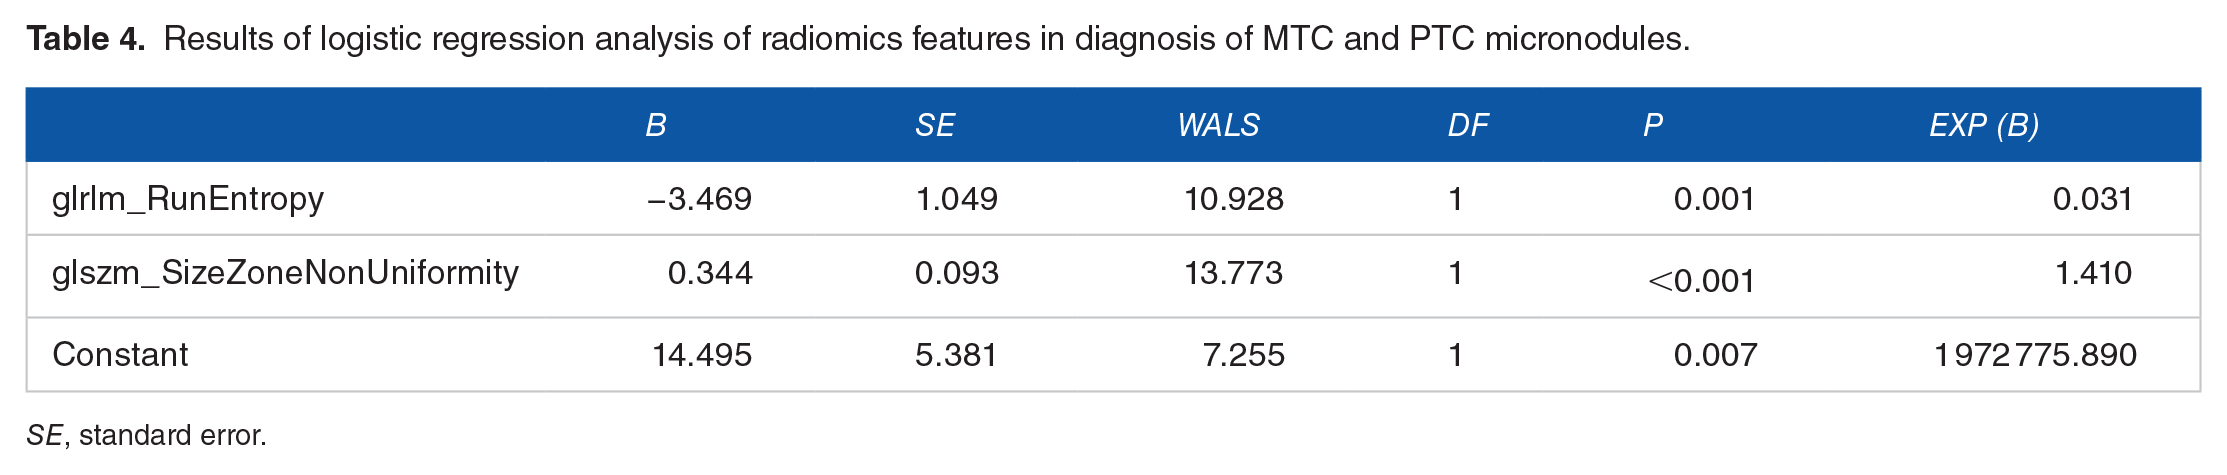
SE, standard error.
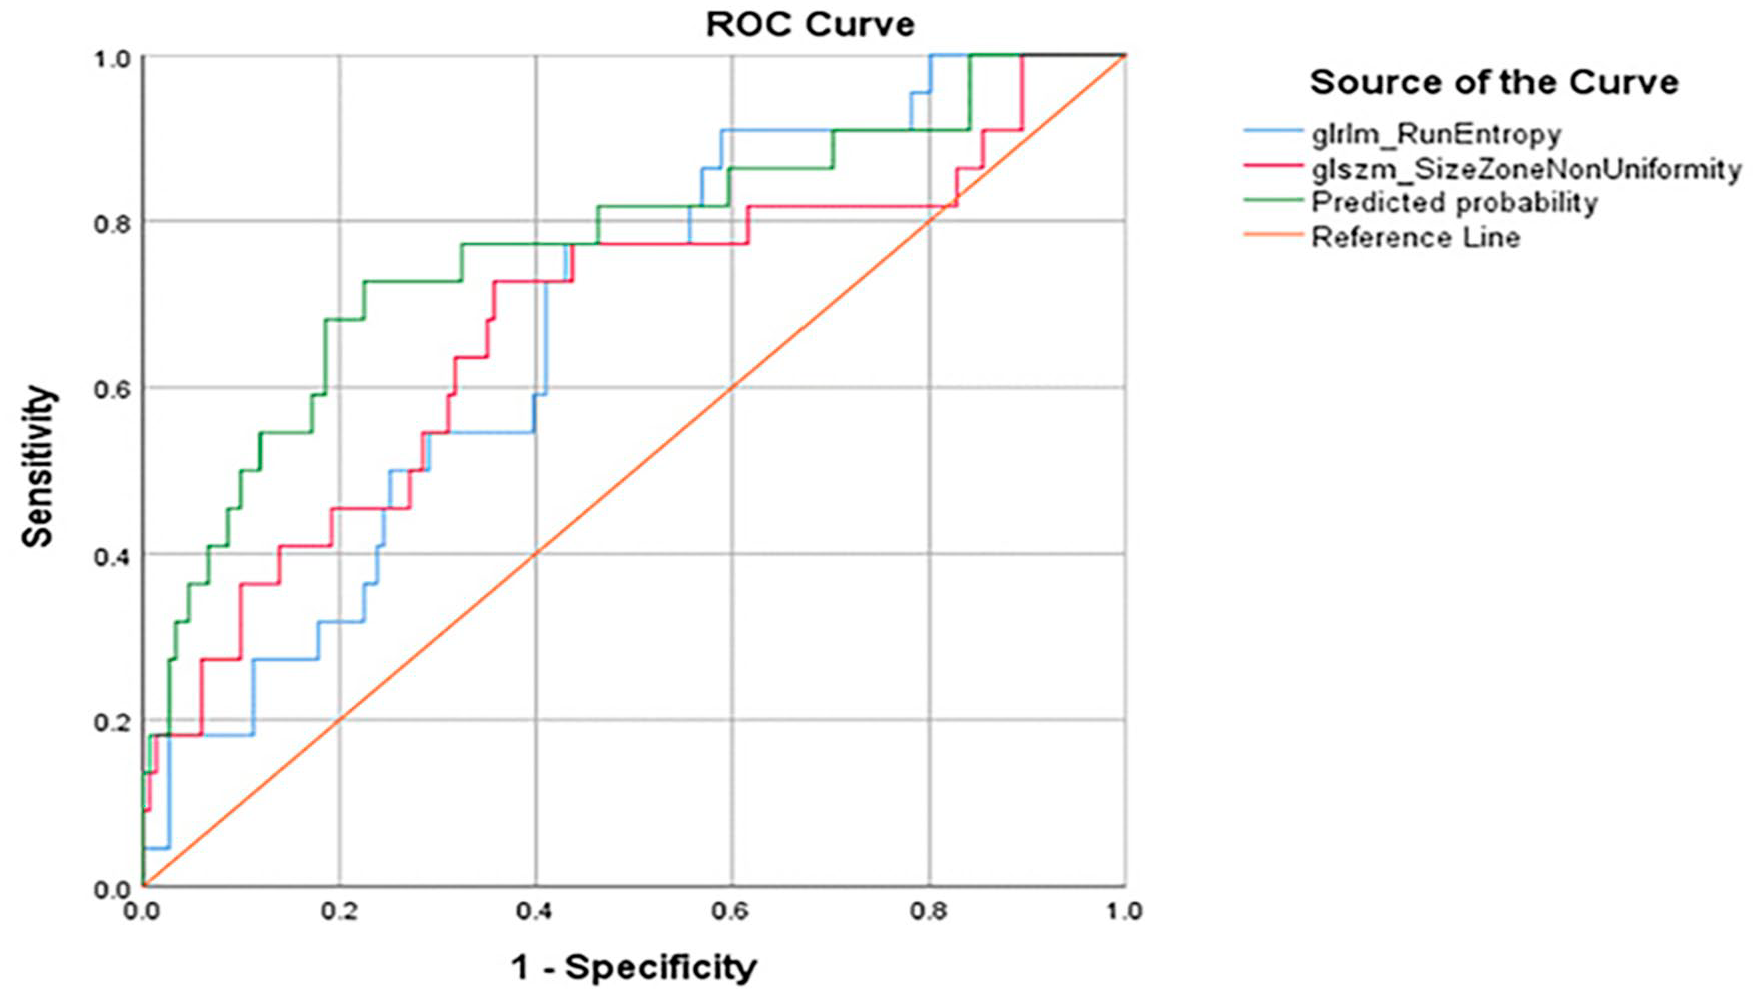
ROC analysis of the diagnostic ability of radiomics features used to distinguish between MTC and PTC micronodules. This approach revealed that combined indicator diagnoses based on 2 radiomics features exhibited significantly greater accuracy than those based on the corresponding individual radiomics features, all P < .05.
Evaluation of the diagnostic efficiency of a combined radiomics indicator as a tool for differentiating between MTC and PTC micronodules
A logistic regression model for the differential diagnosis of MTC and PTC micronodules based on the 2 radiomics features identified above was next developed with the following formula: logistic (P) = 14.495 − 3.469 × glrlm_RunEntropy + 0.344 × glszm_SizreZoneNonUniformity. Corresponding AUC, sensitivity, specificity, and cut-off values are summarized in Table 3 and Figure 3.
Discussion
Medullary thyroid carcinoma nodule ultrasonographic findings are often inconsistent and highly similar to those of similarly sized PTC nodules. Despite their apparent similarity upon imaging evaluation, however, PTC and MTC tumors originate from different cells, necessitate disparate treatment strategies, and exhibit distinct prognostic outcomes. 15 Ultrasonographic images are typically monochromatic and low-resolution, such that relatively few features can be reliably recognized by the naked eye even with training. Luo et al 16 found that radiomics strategies exhibit great promise in the context of thyroid nodule diagnosis. As such, there is a clear need to conduct a comprehensive analysis of the unique radiomics features associated with MTC and PTC nodules to more reliably differentiate between these tumor types.
There may be value in comparing the diagnostic performance of a standard clinical approach, and this newly proposed radiomics approach, and future studies will thus seek to test this. Elevated levels of serum calcitonin (sCt) are a highly sensitive marker for MTC but lack specificity. 17 Here, these levels were not examined in 3 MTC patients, while 74 of 83 MTC patients (89.2%) were sCt positive (>10 pg/mL). Unfortunately, sCt was not examined in most PTC patients in this study. In 2021, Yang et al 18 found that the levels of sCt in the MTC group were significantly higher than those in the PTC group. Only 10% to 40% of all patients with thyroid nodules associated with high basal levels of sCt were diagnosed with MTC. 17 Among the non-MTC conditions reported to cause elevations in sCt levels, PTC is the most relevant.17,19 There have also been many individual case reports pertaining to MTC patients with basal sCt level and stimulated calcitonin levels within the normal range (up to 10 pg/mL). 20 As such, we believe that radiomics analysis will offer additional auxiliary value in the evaluation of these patients.
Tumor growth patterns may be a key determinant of the differences in radiomics features associated with MTC and PTC nodules of different sizes. In this study, we were able to extract over 100 radiomics features for MTC and PTC nodules of different sizes. These features have the potential to offer greater insight into the internal structure and heterogeneity of these types of nodules, enabling the quantification of specific voxels, figures, and grayscale areas within the images using appropriate radiomics methods that cannot otherwise be recognized by sonographers, thereby aiding in the differential diagnosis process.
In our logistic regression analysis, five independent factors were found to be of value when differentiating between MTC and PTC macronodules.
The Shape2D_Sphericity features indicated that PTC macronodules were shaped more closely a perfect circle than were MTC macronodules. This may be related to the size of thyroid nodules. As these nodules grow, the anterior and posterior diameters of PTC macronodules are limited by the thyroid capsule and can grow in other directions, including laterally. The firstorder_Skewness features revealed that PTC macronodules exhibited greater asymmetry with respect to value distributions about the mean as compared with MTC macronodules. The glrlm_RunLengthNonUniformity parameter indicated that PTC macronodules exhibited greater image run-length homogeneity than MTC macronodules. The PTC macronodule grayscale unevenness factor takes the minimum value into account, and the distribution across the whole image was not as uniform as that for MTC macronodules. This may be related to the fact that PTC tumor cells often exhibit more complex internal structures relative to MTC macronodules. Papillary thyroid carcinoma macronodule tumor cells often exhibit complex papillary structures and ground glass nuclei, with irregular nuclear morphology and overlap, nuclear grooves, pseudo-inclusion bodies, and surrounding lymphocytic infiltration. 21 The glszm_GrayLevelNonUniformity parameter indicated that PTC macronodules exhibited greater intensity value homogeneity relative to MTC macronodules, while glszm_SizeZoneNonUniformity indicated that PTC macronodules exhibited greater homogeneity in size zone volumes relative to MTC macronodules. These differences may be attributable to differences in cell origin. Medullary thyroid carcinoma cells are derived from parafollicular C-cells of the thyroid, and PTC cells originate from thyroid follicular or parafollicular epithelial cells. Zhou et al 2 additionally reported that while both MTC and PTC macronodules are prone to undergoing calcification, this process occurs through distinct mechanisms. Specifically, in MTC, calcification is a consequence of amyloid deposition, whereas in PTC, it is a result of grit, resulting in distinct imaging results.22,23
Shape2D_Sphericity and firstorder_Skewness exhibited relatively limited diagnostic accuracy (AUC < 0.7), while the remaining 3 texture feature values exhibited good diagnostic accuracy (AUC > 0.7). Cut-off values indicated that while these 3 texture features exhibited high specificity, they exhibited markedly lower sensitivity, making them less valuable as screening tools but more useful when attempting to distinguish between MTC and PTC macronodules.
When a combined indicator model based on these five radiomics indicators was constructed to more reliably differentiate between MTC and PTC macronodules, a predicted probability of ⩾.355 was considered indicative of a great chance of a given nodule being an MTC nodule while a predicted probability of <.355 suggested that a nodule was more likely to be diagnosed as a PTC nodule. This combination indicator achieved better sensitivity, higher diagnostic accuracy, and good specificity as compared to the individual radiomics features assessed above, with the selected cut-off value exhibiting high specificity but relatively low sensitivity. As such, this combined indicator can be used to supplement ultrasonographic findings when differentiating between MTC and PTC macronodules.
Through logistic regression analyses, two independent factors were found to be of value when differentiating between MTC and PTC micronodules. The glrlm_RunEntropy parameter indicated that PTC micronodules exhibited greater texture pattern heterogeneity relative to MTC micronodules. This may be because PTC cells exhibit more interstitial fibers than do MTC cells. The glszm_SizeZoneNonUniformity parameter indicated that PTC micronodules exhibited homogeneity in size zone volumes than did MTC micronodules. This may be because MTC cells are highly abundant in the mesenchyme, exhibit poorly defined nucleoli with few mitoses, and can be separated into fibrovascular and/or amyloid subsets.
The above two independent factors associated with the differential diagnosis of MTC and PTC micronodules have larger AUC values. The glrlm_RunEntropy feature exhibits high specificity but relatively low sensitivity, whereas the glszm_SizeZoneNonUniformity parameter exhibits higher sensitivity but relatively low specificity, necessitating a more comprehensive approach to sample evaluation. A combined indicator based on the above two radiomics featured was also used to differentiate between MTC and PTC micronodules. When the predicted probability was ⩾.133, patients were more likely to be diagnosed with MTC, whereas they were otherwise more likely to be diagnosed with PTC. This combination indicator achieved better sensitivity, specificity, and higher diagnostic accuracy than either individual radiomics feature, with an AUC > 0.7. The sensitivity and specificity at the chosen cut-off level were also relatively high, indicating that such combined indicators offer great clinical promise as a means of diagnosing MTC and PTC micronodules.
There are several limitations to this study. For one, the extracted radiomics features herein were derived from 2D images, and no color doppler or ultrasound-based elasticity images were available. Second, owing to the rarity of MTC and the small number of cases, independent validation of these results was not performed. Future large-scale analyses will thus be needed to validate and expand upon these findings.
Despite these limitations, this project has multiple key strengths. For one, there have been few studies assessing the distinctive radiomics features of MTC and PTC tumors of different sizes as a means of differentiating between these tumor types, and our data thus highlight a novel approach to such differentiation. Second, we conducted a correlation analysis assessing the relationship between radiomics features and pathology. We additionally established combined radiomics indicator models that were even more reliable as tools for differentiating between these MTC and PTC tumors based on ultrasonographic imaging findings. These combined indicator models offer great potential for future clinical application as they may enable the more reliable prediction of patient clinical outcomes, guiding diagnostic and treatment strategies in an optimized manner.
Conclusions
In summary, the results of this study highlight the ability of different radiomics features to reliably differentiate between MTC and PTC tumors. Specifically, the shape2D_Sphericity, firstorder_Skewness, glrlm_RunLengthNonUniformity, glszm_GrayLevelNonUniformity, and glszm_SizeZoneNonUniformity features exhibited independent diagnostic value in the evaluation of MTC and PTC macronodules, with a combined radiomics indicator consisting of these 5 features exhibiting superior diagnostic efficiency relative to any single indicator. Similarly, the glrlm_RunEntropy and glszm_SizeZoneNonUniformity radiomics features were found to exhibit independent diagnostic value when differentiating between MTC and PTC micronodules, with a combined indicator consisting of both of these features exhibiting diagnostic efficiency superior to that of either feature individually. In conclusion, radiomics features can facilitate the differentiation of MTC and PTC nodules of different sizes based on ultrasound imaging findings.
Supplemental Material
sj-rar-1-onc-10.1177_11795549221097675 – Supplemental material for Radiomics Features of Different Sizes of Medullary Thyroid Carcinoma (MTC) and Papillary Thyroid Carcinoma (PTC) Tumors: A Comparative Study
Supplemental material, sj-rar-1-onc-10.1177_11795549221097675 for Radiomics Features of Different Sizes of Medullary Thyroid Carcinoma (MTC) and Papillary Thyroid Carcinoma (PTC) Tumors: A Comparative Study by Ling Zhao and Buyun Ma in Clinical Medicine Insights: Oncology
Footnotes
Funding:
The author(s) disclosed receipt of the following financial support for the research, authorship, and/or publication of this article: This study was supportd by a grant from the Science and Technology Plan Project of Sichuan Province (grant no.2018RZ0138).
Declaration of Conflicting Interests:
The author(s) declared no potential conflicts of interest with respect to the research, authorship, and/or publication of this article.
Author Contributions
ZL and MBY were major contributors in writing the manuscript. MBY conceived and designed the experiments. ZL did the literature research. ZL analyzed the data. MBY provided basic information on all cases. All authors contributed to the article and approved the submitted version.
Availability of Data and Materials
The data sets used and/or analyzed during the current study are available from the corresponding author on reasonable request.
Ethics Approval and Consent to Participate
Our study was approved by the committee of West China Hospital of Sichuan University (Sichuan, China; approval no. 2021919), and the need to obtain written informed consent was waived due to its retrospective nature. The study was performed according to the principles of the declaration of Helsinki.
Supplemental Material
Supplemental material for this article is available online.
References
Supplementary Material
Please find the following supplemental material available below.
For Open Access articles published under a Creative Commons License, all supplemental material carries the same license as the article it is associated with.
For non-Open Access articles published, all supplemental material carries a non-exclusive license, and permission requests for re-use of supplemental material or any part of supplemental material shall be sent directly to the copyright owner as specified in the copyright notice associated with the article.