
Abstract
Background
The aim of this retrospective research was to develop an immune-related genes significantly associated with m5C methylation methylation (m5C-IRGs)-related signature associated with lung adenocarainoma (LUAD).
Methods
We introduced transcriptome data to screen out m5C-IRGs in The Cancer Genome Atlas (TCGA)-LUAD dataset. Subsequently, the m5C-IRGs associated with survival were certificated by Kaplan Meier (K-M) analysis. The univariate Cox, least absolute shrinkage and selection operator (LASSO) regression, and xgboost.surv tool were adopted to build a LUAD prognostic signature. We further conducted gene functional enrichment, immune microenvironment and immunotherapy analysis between 2 risk subgroups. Finally, we verified m5C-IRGs-related prognostic gene expression in transcription level.
Results
A total of 76 m5C-IRGs were identified in TCGA-LUAD dataset. Furthermore, 27 m5C-IRGs associated with survival were retained. Then, a m5C-IRGs prognostic signature was build based on the 3 prognostic genes (HLA-DMB, PPIA, and GPI). Independent prognostic analysis suggested that stage and RiskScore could be used as independent prognostic factors. We found that 4104 differentially expressed genes (DEGs) between the 2 risk subgroups were mainly concerned in immune receptor pathways. We found certain distinction in LUAD immune microenvironment between the 2 risk subgroups. Then, immunotherapy analysis and chemotherapeutic drug sensitivity results indicated that the m5C-IRGs-related gene signature might be applied as a therapy predictor. Finally, we found significant higher expression of PPIA and GPI in LUAD group compared to the normal group.
Conclusions
The prognostic signature comprised of HLA-DMB, PPIA, and GPI based on m5C-IRGs was established, which might provide theoretical basis and reference value for the research of LUAD.
Public Datasets Analyzed in the Study
TCGA-LUAD dataset was collected from the TCGA (https://portal.gdc.cancer.gov/) database, GSE31210 (validation set) was retrieved from GEO (https://www.ncbi.nlm.nih.gov/geo/) database.
Introduction
Lung cancer, the primary cause of mortality in cancer patients, is the second most common cancer identified worldwide. 1 And lung adenocarcinoma (LUAD) is the most common subtype of lung cancer, accounting for roughly 40% of all cases. 2 Despite significant advances in multimodal treatment methods such as immunotherapy, radiotherapy, and non-invasive surgical resection in recent decades, the results of eradicating lung cancer remain poor, with a 5-year relative overall survival rate of roughly 18%. 3 In order to create the best and most individualized therapy and care choices for various LUAD patients, new more durable and effective prognostic indicators are urgently needed.
Methylation is 1 of the most common post-transcriptional modifications of RNA and greatly affects translation efficiency. 4 More than 160 different forms of RNA modifications have been documented since the discovery of the first RNA modification, 5 including N6-methyladenosine (m6A), N1-methyladenosine (m1A), 5-methylcytidine (m5C), N7-methylguanosine (m7G), and ribose-methylation (Nm). These modifications are intimately linked to the development of human cancer, which offers suggestions for the creation of novel cancer treatments. M5C RNA has been reported to maintain RNA stability, regulating the translation process and ribosome biosynthesis.6,7 Moreover, m5C methylation can also be involved in regulating tumorigenesis. A recent study showed that the expression of m5C methylation-related genes NSUN3 and NSUN4 in LUAD was higher in tumor tissues than in normal lung tissues, which was related to clinicopathological features and survival rate. 6 The expression patterns of NSUN5, DNMT1 and DNMT3A help to predict the prognosis of the disease. 8 Further, researches reported that the novel m5C-related molecular subtypes of LUAD cohorts were constructed by unsupervised clustering analysis to assess the similarity and difference information in m5C methylation as well as m5C gene expression patterns of LUAD samples, providing a preliminary rationale for further screening of key genes in LUAD progression.9,10 On the other hand, the immune related prognostic signature for predicting survival of LUAD cohorts has been explored, 11 Inspired by these studies, the relationship of m5C methylation and immune microenvironments alterations was revealed gradually. 12 Therefore, it is of great significance to search for novel therapeutic directions such as immune-related genes significantly associated with m5C methylation (m5C-IRGs) in LUAD for early diagnosis and prognosis assessment of LUAD patients.
In our study, we firstly explored the role and impact of m5C-IRGs on the prognosis of LUAD via the correlation analysis, and analyzed their possible biological pathways, providing a theoretical basis for the prognostic assessment of LUAD patients and the study of the molecular mechanisms involved in disease progression. This manuscript is written following TRIPOD Checklist.
Methods
Data Source
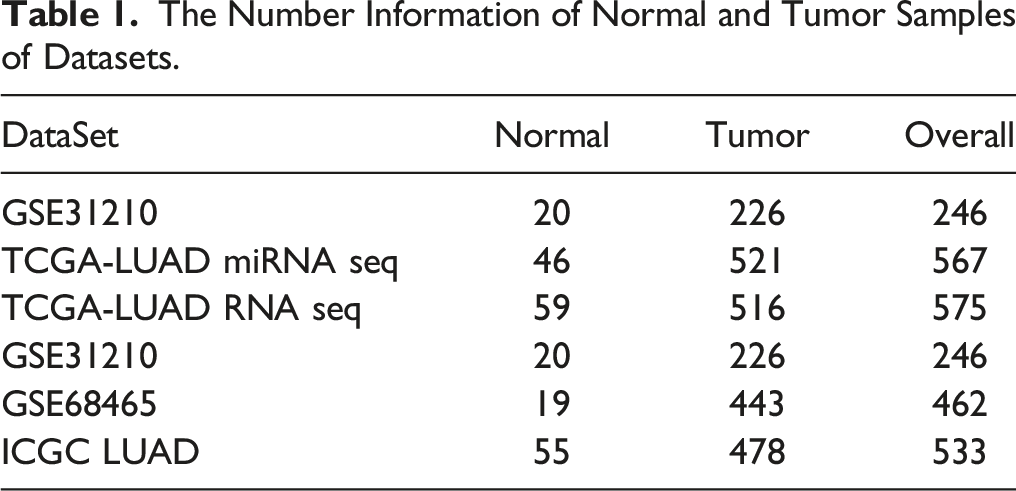
The Number Information of Normal and Tumor Samples of Datasets.
Differential Analysis
The ‘DESeq2’ package (version1.36.0) 17 was executed to obtain the m5C-related differentially expressed genes (m5C-DEGs) between tumor group and normal group in TCGA-LUAD dataset. The adj.P.Value <.05 and |log2FC| > .5 were determined as the liminal value. Volcano plot and heatmap were applied to show m5C-DEGs via ‘ggplot2’ (version 3.4.0) 18 and ‘pheatmap’ (version 1.0.12), respectively. The same method was utilized to obtain immune-related differentially expressed genes (IR-DEGs).
The Correlation Analysis and Function Enrichment
The Spearman correlation was executed to screen differentially expressed m5C-immune-related genes (DE-m5C-IRGs) based on IR-DEGs. The |Cor| > .5 and P < .05 were determined as the threshold. GO and KEGG enrichment analyses of DE-m5C-IRGs were conducted via ‘clusterProfiler’ (version 4.4.4) package. 19 P.adjust < .05 was selected as criterion.
Kaplan-Meier (K-M) Analysis
Based on the optimal value of the expression level for DE-m5C-IRGs, LUAD patients with survival information were divided into 2 subgroups (low-expression and high-expression). The K-M survival curve of DE-m5C-IRGs was drawn to compare survival differences.
Risk Score-based Subgroup Analysis of LUAD Patients
TCGA-LUAD dataset was selected as training cohort. Based on DE-m5C-IRG associated with survival, univariate cox analysis was yielded to obtain candidate genes. Least absolute shrinkage and selection operator (LASSO) regression, XGBoot-Surv analysis were applied to screen prognostic DE-m5C-IRG associated with survival in TCGA dataset. The final model variables that were included were chosen using multivariate Cox regression analysis with the minimum AIC value.
20
Further, via ‘predict.coxph’ function in the survival package, the risk score of each sample in TCGA dataset were calculated based on the LASSO coefficiants and gene expression levels of each prognostic genes using the formula as follows: risk score =
Clinical Feature Estimation
To study the difference of risk score in clinicopathological features, we compared whether there were significant differences in risk scores between different clinical features through wilcox.test, including age, gender, pathologic N, T, M. In addition, we draw a histogram of the proportion for clinical features in 2 risk subgroups. Chi-square test was further yielded to evaluate the relevance between 2 risk subgroups and clinical features. We used the risk score to perform stratified survival analysis on LUAD patients to verify the stability of the risk model in different clinical features.
Clinical Nomogram Model
Stage, pathologic N, T, M, and RiskScore were enrolled into univariate and multivariate Cox analysis to authenticate independent prognostic predictors. The nomogram containing independent factors were drawn to predict 1-, 3-, and 5-year survival probability of LUAD patients. Evaluation of the predictive effect was done by the calibration curve and decision curve analysis (DCA) curve.
Differential Analysis of Risk Subgroups
The ‘DESeq2’ package (version1.36.0) 17 was utilized to calculate the DEGs between 2 risk subgroups (adj.P.Value <.05 and |log2FC| > .5). Then, GO and KEGG analyses were applied to show the function of DEGs. Furthermore, based on hallmark gene set, Gene Set Enrichment Analysis (GSEA) (P-val<.05, |NES|>1 and q-val<.2) was performed for finding related pathways between 2 risk groups.
Immune Feature Estimation and Chemotherapy Analysis
The CIBERSORT algorithm was yielded to calculate the expression status of 22 immune cells according to LM22 gene set in LUAD microenvironment. Subsequently, correlation coefficients between immune cells and risk score were analyzed. Meanwhile, the half maximal inhibitory concentration (IC50) of 209 drugs was calculated by ‘oncoPredic’ (version .2) package in CellMiner database. Then, we analyzed the correlations between drug sensitivity and risk score, and compared IC50 difference of several chemotherapy drugs which were frequently used in LUAD between 2 subgroups.
Construction of Competing Endogenous RNA (ceRNA) Network
The ceRNA network constructed mainly applied the miRNAs data in the TCGA-LUAD (521 tumor vs 46 normal samples). The ‘DESeq2’ package (version1.36.0) 17 was utilized to calculate the expression levels of miRNAs between 2 risk subgroups. The miRNAs associated with prognostic genes were forecasted by starbase database, and the screening criterion were clipExpNum >= 1 and pancancerNum>= 3. Intersected miRNAs were obtained by the intersection of differential miRNAs and miRNAs associated with prognostic genes. The same method was utilised to obtain intersected lncRNAs. Moreover, the ‘lncRNA-mRNA-miRNA’ network. Cytoscape software was applied to optimize the results.
The Analysis of the Expression of Prognostic Genes
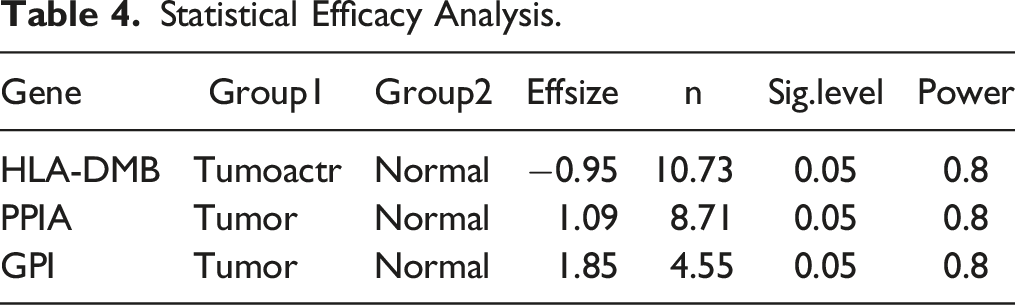
To demonstrate the adequacy of the sample, we conducted an power analysis. The significance level of the study (usually .05) and the desired level of statistical efficacy (.8) were first set, and the effect sizes for t-tests were calculated based on the data from RNA_seq (Cohen’s d), using a significance level of .05, was the sample size required for the key genes calculated using the R package pwr (version 1.3-0). In order to confirm the expression of prognostic genes in LUAD, we implemented Quantitative Real-time PCR (qRT-PCR). 10 carcinoma side normal tissue and 10 tumor samples were obtained from patients with their knowledge and consent from the author’s affiliation, and this study was approved by the ethics committee of the author’s affiliation (Approval No. LDYYLL2023-255). In addition, We confirm that all patient details have been de-identified to protect confidentiality and comply with relevant laws and ethical standards. Any identifying information has been removed or altered to prevent identification. We have taken necessary steps to ensure anonymity, and no personally identifiable information is disclosed in this study. All participants were informed.Total RNA of 20 samples was separated by the TRIzol (Ambion, Austin, USA) based on the manufacturer’s guidance. The inverse transcription of total RNA into cDNA was implemented by using the First-strand-cDNA-synthesis-kit (Servicebio, Wuhan, China) based on the producer’s indication. Then, qRT-PCR was carried out utilizing the 2xUniversal Blue SYBR Green qPCR Master Mix (Servicebio, Wuhan, China) under the direction of the manual. The primer sequences for PCR were tabulated in Table S1. GAPDH was used as an internal reference gene, and the expression was calculated according to the 2−ΔΔCt method. 21
Statistical Requirements
Differences of the survival probabilityl in the K-M curves were compared using the log-rank test. Statistical analysis of the 2 risk groups was conducted by wilcox.test. The correlation between risk score and clinical features was explored through Chi-square test. The P-value correction in multiple comparisons was implemented by Benjamini-Hochberg (BH) method.
Participant Informed Consent
Oral informed consent has been obtained from all participants in this study. The verbal consent was obtained during face-to-face interviews. Participants were informed that their participation was voluntary and that they could withdraw at any time. They also agreed to the use of their data for research purposes after anonymous processing.
Results
Identification of DE-m5C-IRGs in LUAD
The study design was shown in Figure S1. A total of 7 up-regulated m5C-DEGs were identified in TCGA-LUAD database (Figures 1(A), (B)). Similarly, 618 IR-DEGs were extracted, including 298 significantly up-regulated and 320 significantly down-regulated IR-DEGs in LUAD (Figures 1(C), (D)). Correlation analysis between m5C-DEGs and IR-DEGs suggested that there were 76 DE-m5C-IRGs (Table S2), and heatmap for results with | Cor | > .5, P < .05 were shown in Figure 1(E). Furthermore, the functional enrichment analysis of DE-m5C-IRGs was performed. GO items revealed that they were mainly involved in the ‘immune receptor activity’ and ‘MHC protein complex’ Identification and analysis of m5C-IRGs in TCGA-LUAD dataset. (A-B) Volcano plot and heatmap of 7 up-regulated m5C-DEGs between tumor group and normal groups. (C-D) Volcano plot and heatmap of 618 IR-DEG between tumor group and normal groups. (E) Heatmap for Spearman correlation analysis of m5C1-DEGs and IR-DEGs to screen 76 DE-m5C-IRGs with |Cor| > .5 and P < .05. (F-G) Functional enrichment analysis of 76 DE-m5C-IRGs in LUAD, including the enriched GO and KEGG terms (P.adjust <.05). m5C-DEGs: m5C-related differentially expressed genes; IR-DEGs: immune-related differentially expressed genes; DE-m5C-IRGs: differentially expressed m5C-immune-related genes; GO: Gene ontology; KEGG: Kyoto encyclopedia of genes and genomes; LUAD: lung adenocarcinoma.
Prognostic Signature Based on DE-m5C-IRGs Associated with Survival
Univariate regression analysis identified 27 survival related candidate genes (HR≠1 and P < .05) in the TCGA-LUAD dataset (Figure 2(A); Table2). To further dig out the key genes, LASSO regression analysis was conducted on 27 significant genes to unearth the optima. Ultimately, 9 feature genes were obtained (Figures 2(B), (C)). Meanwhile, Top10 feature genes were retained by XGBoost algorithm (Figure 2(D)). We combined 4 overlapping genes between these 2 methods, including HLA-DMB, PPIA, VEGFD, and GPI (Figure 2(E)). Furthermore, 3 genes (HLA-DMB, PPIA, and GPI) with the minimum AIC value were selected by multivariate cox analysis for building a m5C-IRGs-related prognostic signature with LUAD (Figure 3(A)). The risk model calculating formula was: Screen of the prognostic DE-m5C-IRGs in TCGA. (A) Forest plot of univariate cox analysis to obtain survival related candidate genes. (B) 9 significant genes were selected by the LASSO Cox models. (C) Cross-validation for tuning parameter selection in the LASSO model. (D) Feature importance rank in the XGBoot model to screen ten significant genes. (E) Venn plot of prognostic DE-m5C-IRGs associated with survival in TCGA. LASSO: least absolute shrinkage and selection operator; XGBoot: extreme gradient boosting. Univariate Regression Analysis of Survival Related Candidate Genes in the TCGA-LUAD Dataset. Establishment and assessment of the prognostic signature based on 3 prognostic m5C-IRGs (HLA-DMB, PPIA, and GPI) in LUAD. (A) Forest plot of univariate cox analysis to obtain prognostic genes to build the prognostic signature. (B) Distribution of the risk score and survival status of LUAD patients for the 2 risk groups stratified by the prognostic signature in the TCGA-LUAD cohorts. (C) Geen expression heatmap of prognostic genes between the 2 risk groups. (D) The K-M survival analysis of the 2 risk groups in the TCGA-LUAD cohorts. (E) The ROC curves for the predictive accuracy of the prognostic signature in the TCGA-LUAD cohorts. (F) Correlation scatter diagram of risk score and 3 prognostic genes.


Analysis of Clinical Characteristics
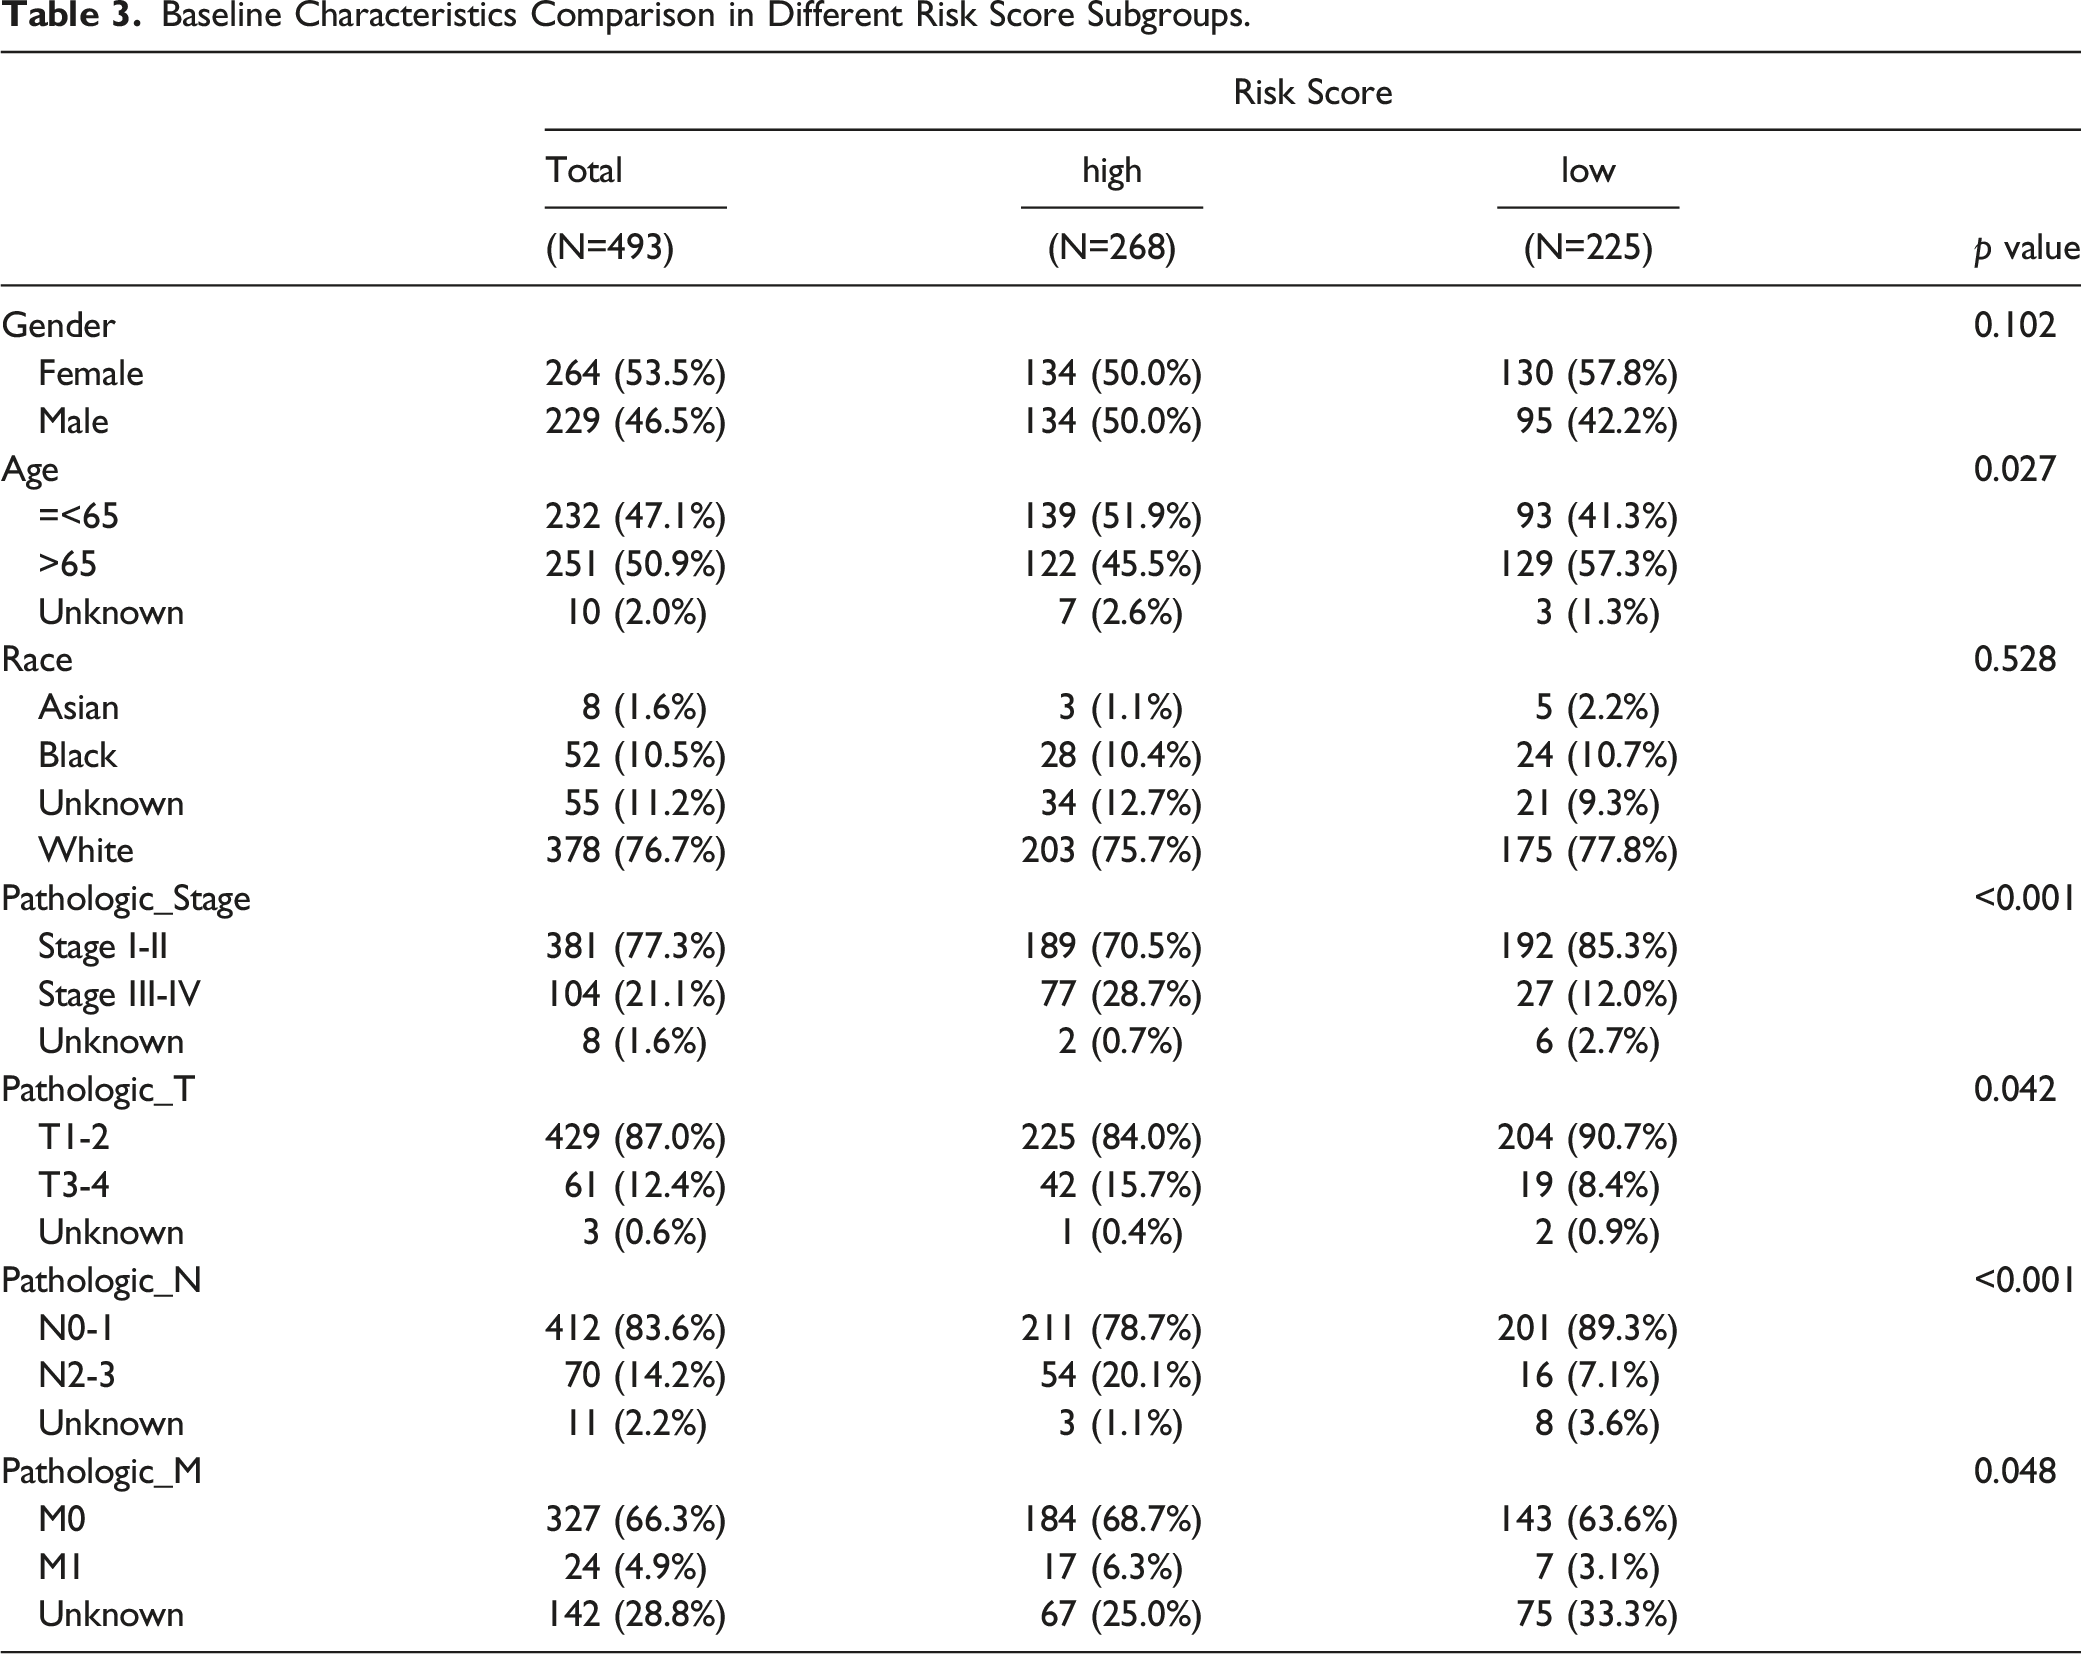
Clinical correlation analysis suggested that the risk scores of patients were significantly different in stage, gender, age, pathologic N, T, M (Figure 4(A)). Notably, the population of LUAD patients in each clinical feature was significantly different between Stage, Gender, Age, pathologic N, T (Figure 4(B)). We also found that patients in Age, Stage, pathologic N, T, M were significantly different in 2 risk subgroups (Figure 4(C); Table 3). Stratified survival analysis demonstrated that there were significant survival differences between 2 risk groups in different clinical stages (Figure 4(D)). Correlation analysis of the prognostic signature and clinical features in TCGA-LUAD dataset. (A) Box plot of the risk score in patients with different clinical features (wilcox.test). (B) Histogram for the proportion with different clinical features in 2 risk subgroups. (C) Heatmap for prognostic genes expression in different clinical subgroups and risk subgroups. (D) Stratified survival analysis of 2 risk subgroups. Baseline Characteristics Comparison in Different Risk Score Subgroups.
Independent Prognostic Analysis for LUAD Patients
The results of Cox analyses suggested that Stage (HR: 1.6, 95% CI for HR: 1.1-2.4, P = .02) and RiskScore (HR: 1.8, 95% CI for HR: 1.4-2.5, P < .001) were prognostic independent factors (Figures 5(A), (B)). The nomogram containing 1-, 3-, 5-year survival rates was generated (Figure 5(C)). The calibration, risk stratification and DCA curves proved that the feasibility of the nomogram was effective (Figures 5(D), (F)). Establishment and assessment of the nomogram based on the risk score. (A,B) Univariate and multivariate Cox regression analyses confirmed that risk score could be an independent prognostic factor affecting the prognosis of LUAD patients. (C) The nomogram combining risk score and stage was developed to predict 1-, 3-, and 5-year survival. (D) Calibration curves of the nomogram. (E) DCA curves of the 1-, 3-, and 5-year survival in the TCGA-LUAD dataset. (F) Clinical impact curves of the nomogram prediction in the TCGA-LUAD dataset. DCA: decision curve analysis.
Differential Gene Enrichment Analysis in Low- and High-Risk Groups
In TCGA-LUAD dataset, we obtained 4104 DEGs (1687 up-regulated and 2417 down-regulated in high-risk group) between 2 risk subgroups (Figures 6(A), (B)). GO analysis implied that these DEGs were mainly concerned in ‘immune receptor activity’ and ‘regulation of T cell activation’ (Figure 6(C)). KEGG results demonstrated that these DEGs were mainly related to ‘calcium signaling pathway’ (Figure 6(D)). To further study the potential roles of 4104 DEGs in LUAD, we performed GSEA on hallmark gene sets. The results showed that these DEGs were enriched in the ‘G2M checkpoint’ and ‘E2F targets’ (Figure 6(E)). Analysis of the 2 risk groups in TCGA-LUAD dataset. (A-B) Volcano plot and heatmap of 4104 DEGs between the high-risk and low-risk groups. (C-D) GO and KEGG functional enrichment analysis of 4104 DEGs. (E) GSEA enrichment analysis of 4104 DEGs. (F) The expression of 22 immune cells for each patient in the TCGA-LUAD cohorts. (G) Boxplot for the contents of 21 immune cells between the different risk groups in the TCGA-LUAD dataset. (H) Correlation heatmap of the significantly different immune cells and 3 prognostic genes. DEGs: differentially expressed genes; GSEA: Gene Set Enrichment Analysis.
Immune Infiltration Analysis
To explore the immune microenvironment of LUAD, we analyzed the expression of 22 immune cells between 2 sample groups in TCGA (Figure 6(F)). There were ten immune cell abundances that differ significantly, including memory B cells, CD4 memory resting T cells, follicular helper T cells, Monocytes, CD4 memory activated T cells, resting dendritic cells, Macrophages M0 resting mast cells, activated mast cells and eosinophils (Figure 6(G)). The correlation analysis revealed that HLA-DMB was positively associated with resting dendritic cell. GPI was related to CD4 memory activated T cell and Macrophages M0, etc. (Figure 6(H)).
Drug Sensitivity Analysis
In order to discover potential drugs targeting prognostic genes, we analyzed the correlation between drug sensitivity and risk score. The results suggested that Riskscore was positively associated with acetalax estimated, floxuridine.1 estimated and Bisacodyl, active ingredient of Viraplex, while Riskscore was negatively associated with isotretinoin estimated, denileukin diftitox ontak estimated and panobinostat estimated (Figure 7(A)). Furthermore, we compared IC50 for 209 drugs in 2 risk groups. A total of 6 drugs were identified with significant differences between 2 risk groups, including Isotretinoin, Denileukin Diftitox Ontak, Panobinostat, Acetalax, Floxuridine.1 and Bisacodyl, active ingredient of Viraplex (Figure 7(B)). Prediction of the potential drugs and ceRNA network that target 3 prognostic genes. (A) Correlation scatter diagram of risk score and 6 potential drugs targeting prognostic genes. (B) The boxplot for the IC50 levels of different drugs in 2 risk groups. (C) The ceRNA network of 3 prognostic genes. IC50: half maximal inhibitory concentration; ceRNA: competing endogenous RNA.
The ceRNA Network Analysis
To explore the regulatory mechanism of HLA-DMB, PPIA and VEGFD, the ceRNA network was constructed. We obtained 288 differential miRNAs between 2 risk subgroups (Figure S5(A), (B)). Through the intersection with miRNAs predicted by starbase database and differential miRNAs, 20 miRNAs were obtained (Figure S5(C)). Similarly, we identified 14 lncRNAs (Figure S6(A)-C)). Finally, the ceRNA network was constructed (Figure 7(C)). The network had 37 nodes and 38 edges, in which PPIA was associated with hsa-miR-135a-5p. The hsa-miR-135a-5p affected the expression of GPI. Hsa-miR-183-5p regulated the expression of HLA-DMB.
Expression Validation of the Prognostic Genes
Statistical Efficacy Analysis.

Varifying of m5C-IRGs expression using Quantitative Real-time PCR (qRT-PCR). Boxplots for the expression of 3 prognostic genes in carcinoma side normal tissue (n = 10) and tumor samples (n = 10).
Discussion
There were numerous active LUAD treatment options, such as surgery, radiotherapy, chemotherapy, and immunotherapy, which have significantly increased the survival rate of LUAD patients. However, treatment outcomes were still inconsistent and 5-year survival rates of LUAD patients were still unsatisfactory, which was why it is urgent to identify new therapeutic targets for the detection and treatment of LUAD. In this study, we identified 7 up-regulated m5C-DEGs and 618 IR-DEGs by analyzing the TCGA-LUAD database.By correlation analysis, we identified 76 DE-m5C-IRGs and further performed functional enrichment analysis. The results indicated that these genes were mainly involved in immune receptor activity and MHC protein complexes. In addition, KEGG analysis showed that m5C-IRGs were mainly enriched in the PI3K-Akt signaling pathway. We further linked these genes to patient survival using LASSO regression, XGBoost algorithm and multivariate Cox analysis, and finally identified 3 genes, HLA-DMB, PPIA and GPI, to construct a new prognostic marker, ie, the prognostic marker associated with m5C-IRGs. In addition, we categorized LUAD patients into high-risk and low-risk groups and found that patients in the high-risk group had poorer survival, and the model was validated in 4 independent datasets, namely TCGA-LUAD, GSE31210, GSE68465 and ICGC-LUAD. We further analyzed the relationship between different clinica.
S G Cho et al in 1991 identified the HLA-DMB as a member of the human histocompatibility complex class II (MHC-II) gene region, encoding the HLA-DMB molecule, and stored in the lysosomes of antigen-presenting cells (APCs). 22 HLA-DMB molecules played a decisive role in antigen presentation and their main function was to cooperate with HLA-DMA molecules to be expressed on the surface of antigen presenting cells and target cells for CD4+ T cells to recognize and generate an immune response. 23 Tumor cell expression of HLA-DMB has been reported to improve survival in advanced plasma ovarian cancer. 24 In our study, the expression of HLA-DMB was higher in the low-LUAD group compare to high-risk group, suggesting that HLA-DMB in LUAD cells might improved the survival of LUAD patients. Although significant advances in the research of HLA-DMB, the role and mechanism of action of HLA-DMB in LUAD have not been fully explored, and more work remains to be done in the study of HLA-DMB. Our findings support previous reports and provide a basis for further investigation of the function and clinical application of HLA-DMB in LUAD. Future studies could explore the specific mechanisms of HLA-DMB in the development and treatment of LUAD and evaluate its potential as a potential therapeutic target or biomarker.
R E Handschumacher et al in 1984 discovered the peptidylprolyl isomerase A (also known as Cyclophilin A,CyPA), an intracellular binding protein specific for cyclosporine A (CsA), encoded by PPIA. 25 PPIA suppressed calcium-regulated neurophosphatase activity by forming CsA-cypa complexes, which in turn inhibits t-cell activation via the nuclear factors of activate the t-cell (NFAT) pathway.26,27 CyPA has been found to be a multifunctional protein expressed intracellularly and extracellularly in endothelial cells, macrophages and other cell types. 28 Several studies confirmed the over-expressed of CyPA in in a variety of cancers, including lung cancer,29,30 pancreatic cancer, 31 hepatocellular carcinoma. 32 Yinan Guo et al demonstrated that overexpressed of CyPA promotes metastasis and cancer cell growth in non-small cell lung cancer, and that CyPA might be a key player in tumor transformation.33,34 As we have studied, the PPIA was over-expressed in the high-risk group of LUAD patients and was likely to be a noteworthy therapeutic target. In summary, our results are consistent with findings in the literature that support the important role of PPIA in LUAD and suggest that PPIA may be a promising therapeutic target. Further studies are needed to delve into the specific mechanisms and clinical applications of PPIA in the development and treatment of LUAD.
The GPI produced phosphoglucose isomerase (PGI), also known as glucose-6-phosphate isomerase, which was essential for the digestion of phosphorylated carbohydrates and had effected on erythrocyte metabolism when deficient.
35
PGI-catalyzed reversible aldose-ketose sugar isomerization of
The tumor immune microenvironment (TME) has an impact on tumor progression, metastasis and patient survival. 40 The study of the immune microenvironment of LUAD was useful to clinicians as it helps us to observe the progress of LUAD. The detection of antigens, pathogens, and allergens, lymph node migration, activation of CD4+ or CD8+ T cell immunity, and generation of inflammatory chemokines in the lung were all mediated by dendritic cell (DC) subgroups. 41 DCs increase the expression of cc-chemokine receptor 7 (CCR7). CCR7 ligand cc-chemokine ligand 21 (CCL21) was expressed at the terminal lymphatic, and the interaction between CCR7 and CCL21 enables DCs to enter the lymphatic vascular system and eventually migrate into the draining lymph nodes to the paracortex. 42 Furthermore, 1 of the causes of carcinogenesis could be the immune condition that results in irregular macrophage infiltration. 43 M0-like macrophage differentiation has been confirmed to be associated with high-grade tumor and poor prognosis. 44 Our research concentrated on the relationship between 3 indicators (HLA-DMB, PPIA, and GPI) and differential immune cells. We found HLA-DMB correlated considerably and positively with resting dendritic cells, and GPI correlated significantly and positively with macrophage M0. These results imply that HLA-DMB and GPI play critical regulating functions in the development and the immune microenvironment of LUAD.
It was a consensus that most lncRNA cannot encode proteins, but they could regulate gene expression via miRNAs both transcriptionally and post-transcriptionally.45,46 These miRNAs played an important role in cell proliferation, differentiation, migration and apoptosis. 47 Consequently, we performed a ceRNA network analysis. It has been demonstrated that hsa-miR-135a-5p promotes tumor cell growth and metastasis via the PI3K/AKT signaling pathway in non-small cell lung cancer. 33 Studies had demonstrated that hsa-miR-183-5p could inhibit the proliferation, migration and invasion of non-small cell lung cancer cells by down-regulating the expression of RAB35 and KLF7.48,49 The 3 biomarkers (HLA-DMB, PPIA, GPI) were associated with hsa-miR-135a-5p and hsa-miR-183-5p, suggesting that these biomarkers have therapeutic potential for LUAD.
However, this study has limitations and shortcomings, we need to further investigate the mechanisms and clinical applications of relevant experiments by continuing to monitor the role of these genes, in addition, due to the limited amount of data, we have shortcomings in calibrating predictive model. In addition, there may be some limitations of a particular design. These limitations may include the way the sample is selected, the method of data collection, the setting of experimental conditions, etc. We may have chosen a particular experimental design or method that may lead to some biases or limitations.
Conclusions
In conclusion, this study was the first to associate the m5C gene with immune-related genes and establish a predictive model for LUAD based on the prognostic features of HLA-DMB, PPIA and GPI based on m5C-IRGs, which provided a theoretical basis and reference value for the prognosis and personalized treatment of LUAD patients.
Supplemental Material
Supplemental Material - Development and Validation of a Machine Learning Prognostic Model of m5C Related immune Genes in Lung Adenocarcinoma
Supplemental Material for Development and Validation of a Machine Learning Prognostic Model of m5C Related immune Genes in Lung Adenocarcinoma by Xiong Cao, Yuxing Ji, Jiajia Li, Zhikang Liu, and Chang Chen in Cancer Control
Footnotes
Author Contributions
Conception and design: Xiong Cao, Jiajia Li, Chang Chen; Administrative support: Chang Chen; Provision of study materials or patients: Xiong Cao, Yuxing Ji; Collection and assembly of data: Xiong Cao, Jiajia Li, Zhikang Liu; Data analysis and interpretation: Xiong Cao, Jiajia Li, Yuxing Ji; Manuscript writing: All authors; Final approval of manuscript: All authors.
Declaration of conflicting interests
The author(s) declared no potential conflicts of interest with respect to the research, authorship, and/or publication of this article.
Funding
The author(s) disclosed receipt of the following financial support for the research, authorship, and/or publication of this article: This study was funded by the Educational Technology Innovation Project of Gansu Province (No. 2022B-014), Hospital Fund of The First Hospital of Lanzhou University(No. ldyyyn2021-66), Hospital Fund of The First Hospital of Lanzhou University(No. ldyyyn2021-130), The health industry research project of Gansu Province (GSWSHL2022-36).
Ethical Statement
Reporting Checklist
The authors have completed the TRIPOD reporting checklist.
Supplemental Material
Supplemental material for this article is available online.
References
Supplementary Material
Please find the following supplemental material available below.
For Open Access articles published under a Creative Commons License, all supplemental material carries the same license as the article it is associated with.
For non-Open Access articles published, all supplemental material carries a non-exclusive license, and permission requests for re-use of supplemental material or any part of supplemental material shall be sent directly to the copyright owner as specified in the copyright notice associated with the article.