
Abstract
Background:
We aimed to study the impact of neoadjuvant chemotherapy to surgery (NCT-S) interval and neoadjuvant radiotherapy (NRT) on pathological complete response (pCR) and overall survival (OS) in pancreatic cancer (pancreatic ductal adenocarcinoma [PDAC]).
Methods:
National Cancer Data Base (NCDB)–pancreatectomy patients who underwent NCT/NRT were included. The NCT-S interval was divided into time quintiles in weeks: 8 to 11, 12 to 14, 15 to 19, 20 to 29, and >29 weeks.
Results:
A total of 2093 patients with NCT were included with median follow-up of 74 months and 71% NRT. The pCR rate was 2.1% with higher median OS compared with non-pCR (41 vs 19 months, P = .03). The pCR rate increased with longer NCT-S interval (quintiles: 1%, 1.6%, 1.7%, 3%, and 6%, P < .001, respectively). In logistic regression, NRT (odds ratio [OR] = 2.5, 95% confidence interval [CI]: 1.1-6.1, P = .03) and NCT-S >29 weeks (OR = 6.1, 95% CI = 2.02-18.50, P < .001) were predictive of increased pCR. The prolonged NCT-S interval and pCR were independent predictors of OS, whereas NRT was not.
Conclusions:
Longer NCT-S interval and pCR were independent predictors of improved OS in patients with PDAC. The NRT predicted increased pCR but not OS.
Introduction
Pancreatic ductal adenocarcinoma (PDAC) is the third leading cause of cancer-related death in the United States preceded by lung and colorectal cancers with 8% 5-year overall survival (OS). 1 Only 15% to 20% of patients are eligible to curative oncological resection, as most tumors are deemed unresectable at the time of diagnosis.2,3 Neoadjuvant chemotherapy (NCT) with or without radiation therapy has emerged as a promising strategy in patients with borderline resectable PDAC. Preliminary data suggest improved OS and resectability with possible pathological complete response (pCR). 3
The rate of pCR after NCT in PDAC ranges between 2% and 10%,4-6 which is considerably lower than in rectal (13%-16%) or esophageal cancer (20%-40%).7,8 Similar to other malignancies,7-9 The pCR is proposed as a surrogate marker of NCT favorable outcomes in PDAC. Studies showed that pCR is associated with better OS among PDAC.4-6,10 Due to rarity of pCR in PDAC, its predictors and prognostic impact has not been elucidated. Prior studies showed that the extended NCT and prolonged NCT to surgery (NCT-S) interval were associated with superior pathological response and survival outcomes.11,12 In recent meta-analysis, Franke et al 13 have demonstrated the positive impact of the neoadjuvant radiotherapy (NRT) on pCR and R0 resection rates. However, due to the relative small size of the prior studies, there is no solid consensus on the impact of NRT and NCT-S interval on pCR. In this study, we sought to investigate the impact of possible variables (including NRT and NCT-S interval) that could alter pCR rate as well as study the predictive value of pCR on OS using a large nationwide US database.
Methods
Data source
Data were obtained from the National Cancer Data Base (NCDB) Participant User File (PUF) for pancreatic tumors diagnosed between 1998 and 2011. The NCDB is a joint project of the Commission on Cancer of the American College of Surgeons and the American Cancer Society. It comprises hospital-based registry from more than 1500 commission-accredited cancer programs, encompassing over 70% of all cancer cases in the United States. 14 This study was reviewed as exempt by the local Institutional Review Board at the University of Miami, Miller School of Medicine (IRB#2665331).
Patient selection criteria
The study population was limited to stage I-III PDAC who received neoadjuvant therapy and underwent pancreatic resection. Patients with a diagnosis of confirmed PDAC histology codes (International Classification of Disease for Oncology [3rd edition] histology code 8140 for adenocarcinoma and 8500 for ductal adenocarcinoma) were included. This dataset excluded patients who did not undergo surgical resection with curative intent and those with incomplete data. Inclusion criteria were confirmed pathology prior to treatment, M0 PDAC patients, and those with definitive surgical resection after at least 8 weeks of commencement of NCT. Exclusion criteria were those with NCT-S <8 weeks and those with missing pT and pN stages. We excluded PDAC patients with an NCT-S interval <8 weeks to avoid confounding our analysis with those with interrupted neoadjuvant treatment.
All included patients had their chemotherapy before their definitive surgery. Definitive surgery (pancreatectomy) was defined as those patients with code 20-80 for their primary site of cancer. The NCDB has no specific date for last chemotherapy session; however, the NCT-S sequence of treatment is available. The NCT-S interval was calculated from day of start of chemotherapy to day of surgery. The patients were categorized into quintiles according to their NCT-S interval (Q1: 8-11, Q2: 12-14, Q3: 15-19, Q4: 20-29, and Q5: >29 weeks; n = 510, 551, 462, 403, and 167 patients, respectively). We chose these intervals to provide groups with almost equal number of the first 4 quintiles for best mathematical comparability. We also evaluated the NCT-S interval as a continuous variable (ie, per week increase). The primary outcomes were pCR and OS. The follow-up period to check OS status was calculated from date of diagnosis.
Patient demographics, tumor, and treatment variables
Potentially relevant patient, tumor, and treatment characteristics were included. Pathologic T-stage, N-stage, and overall stage were based on the American Joint Committee on Cancer (AJCC) staging guidelines, 7th edition. Complete pathologic response to neoadjuvant treatment was defined as ypT0/ypN0 stage. Variables included were T category, nodal status, tumor size, tumor grade, and facility type. The treatment facility was categorized as community or academic. Treatment variables included NRT, total dose of NRT, NCT-S interval, and number of NCT drugs (single vs multi-agent).
Statistical analysis
Continuous variables are presented as mean ± standard error, and categorical variables as frequencies and percentages. For group comparisons, chi-square and Fisher’s exact tests were used for categorical variables; analysis of variance (ANOVA) test was used for continuous variables. Univariate and multivariate logistic regression models were used to examine the predictors of pCR as well as to calculate the odds ratios (ORs). The variables were compared according to the pCR status and NCT-S interval. Separate models were constructed using NCT-S interval as quintile and as per week increase. Kaplan-Meier curve (KMC) survival estimates and a log-rank test were used to examine differences in OS according to PDAC patient’s pCR status (pCR vs non-pCR) and NCT-S interval (8-29 vs >29 weeks). Univariate screening individual Cox regression analyses were used to examine the association between each variable (including pCR and other variables) and OS. Cox regression multivariate analysis was used to identify independent factors associated with OS. We used cT and cN stages rather than pT and pN to avoid overlap when pCR was added to the simultaneous model. For continuous variables, the hazard ratio (HR) gives the increase in the risk for each unit increase in value, whereas for categorical variables, the HR gives the increased risk relative to the reference category. All probabilities are 2-sided, and P values <.05 were considered statistically significant. Statistical analysis was performed using SPSS (version 16.0, SPSS Inc, Chicago, IL, USA).
Results
Baseline characteristics
A total of 2093 PDAC patients were eligible for this analysis. Out of the 2093 patients who received NCT, we had only 2049 patients with known neoadjuvant radiation status. The study population was mostly white (87%) and male gender (51%). Mean age of 63 years with most patients (69%) treated at academic cancer facilities. Clinical T stages 3% and 4 were 50% and 19%, respectively. The range of NCT-S interval was 8 to 52 weeks. There were 44 (2.1%) patients who achieved pCR in this study. Demographic and tumor characteristics based on pCR status, neoadjuvant therapeutic modality, and NCT-S intervals are listed in Tables 1 to 3, respectively.
Baseline characteristics of pancreatic cancer patients according to pCR status.

Abbreviations: pCR, pathological complete response; TNM, Tumor, Node, Metastasis.
Italicized values signify p value < 0.05.
Baseline characteristics of pancreatic cancer patients according to the neoadjuvant therapy modality.

Abbreviations: NA, not applicable; TNM, Tumor, Node, Metastasis.
Italicized values signify p value < 0.05.
Baseline characteristics of pancreatic cancer patients according to NCT-S interval.

Abbreviations: NCT-S, neoadjuvant chemotherapy to surgery; TNM, Tumor, Node, Metastasis.
Patients with pCR had statistically significant longer mean NCT-S interval (23 vs 17 weeks, P < .001) and higher rate of NRT (84% vs 70%, P = .049) and treatment at academic facility (86% vs 68%, P = .01) than non-pCR patients. There was no difference in NRT dose among pCR and non-pCR groups (4498 ± 769 cGy vs 4477 ± 754 cGy, P = .6). There was a significant increase of pCR rate with prolonged time to surgery across the NCT-S interval quintiles (Q1: 5/510 = 1%, Q2: 9/551 = 1.6%, Q3: 8/462 = 1.7%, Q4: 12/403 = 3%, and Q5: 10/167 = 6%; P < .001; Figure 1). The patients who received neoadjuvant chemoradiotherapy (NCRT) had higher rate of non-Caucasians (30% vs 11%, P = .03) and higher rate of cT3/cT4 (71% vs 67%, P = .04) than those who received NCT alone. However, those treated with NCRT had higher rate of pCR (2.5% vs 1.1%, P = .049) and pN0 status (67% vs 49%, P < .001) than those treated with NCT alone. Of note, both NCRT and NCT alone had similar 30-day postoperative mortality rate.

Histogram shows the pCR status among the pancreas cancer patients according to their NCT-S interval. NCT-S indicates neoadjuvant chemotherapy to surgery; pCR, pathological complete response.
Across NCT-S interval subgroups, prolonged NCT-S interval was more likely encountered in academic cancer facilities (81%, P = .001) and was associated with advanced cT stages (58%, P = .001) but increased rates of ypN0 (78%, P = .001). The proportion of the fifth NCT-S quintile (ie, NCT-S >29 weeks) treated at academic cancer facilities was higher than other quintiles (Q5 = 81% vs 64%, 69%, 68%, 70% for Q1, Q2, Q3 and Q4; P = .01).
Pathological complete response
When adjusted for other confounders, multivariate logistic regression analysis showed young age (OR per 1 year increase = 0.97, 95% confidence interval [CI] = 0.94-0.98, P = .04), NRT (OR = 3.7, 95% CI = 1.3-10.6, P = .01), and prolonged NCT-S interval (OR per 1 week increase = 1.07, 95% CI = 1.04-1.10, P = .001) to be the independent predictors of pCR. Likewise, in a multivariate model including NCT-S interval, the fourth and fifth NCT-S quintiles were associated with significant higher rates of pCR (OR = 3.3, 95% CI = 1.04-10.7, P = .04, and OR = 6.8, 95% CI = 2-23, P = .002, respectively; Table 4). The facility type was not statistically significant when adjusted for other confounders (eg, NRT, NCT-S interval, age, and cancer stage).
Logistic regression analyses for the predictors of pCR among pancreatic cancer patients.

Abbreviations: CI, confidence interval; NCT-S, neoadjuvant chemotherapy to surgery; OR, odds ratio; pCR, pathological complete response; TNM, Tumor, Node, Metastasis.
Bold-faced values signify p value < 0.05.
Overall survival
The 5-year OS was 11.7% (526 deaths out of 596 patients with available survival data) with a median survival of 19 months. In the univariate Cox regression analysis, OS was negatively associated with age but improved with prolonged NCT-S interval and pCR status (Table 5). Median OS was superior in pCR compared with non-pCR (41 vs 19 months, P = .01, respectively; Figure 2). Moreover, median OS across NCT-S quintiles were Q1: 21, Q2: 17, Q3: 16, Q4: 20, and Q5: 32 months. Kaplan-Meier analysis showed the best survival in the 5th NCT-S quintile compared with other quintiles (P = .008; Figure 3).
Cox regression analyses for predictors of mortality among pancreatic cancer patients treated with NCT followed by pancreatectomy.
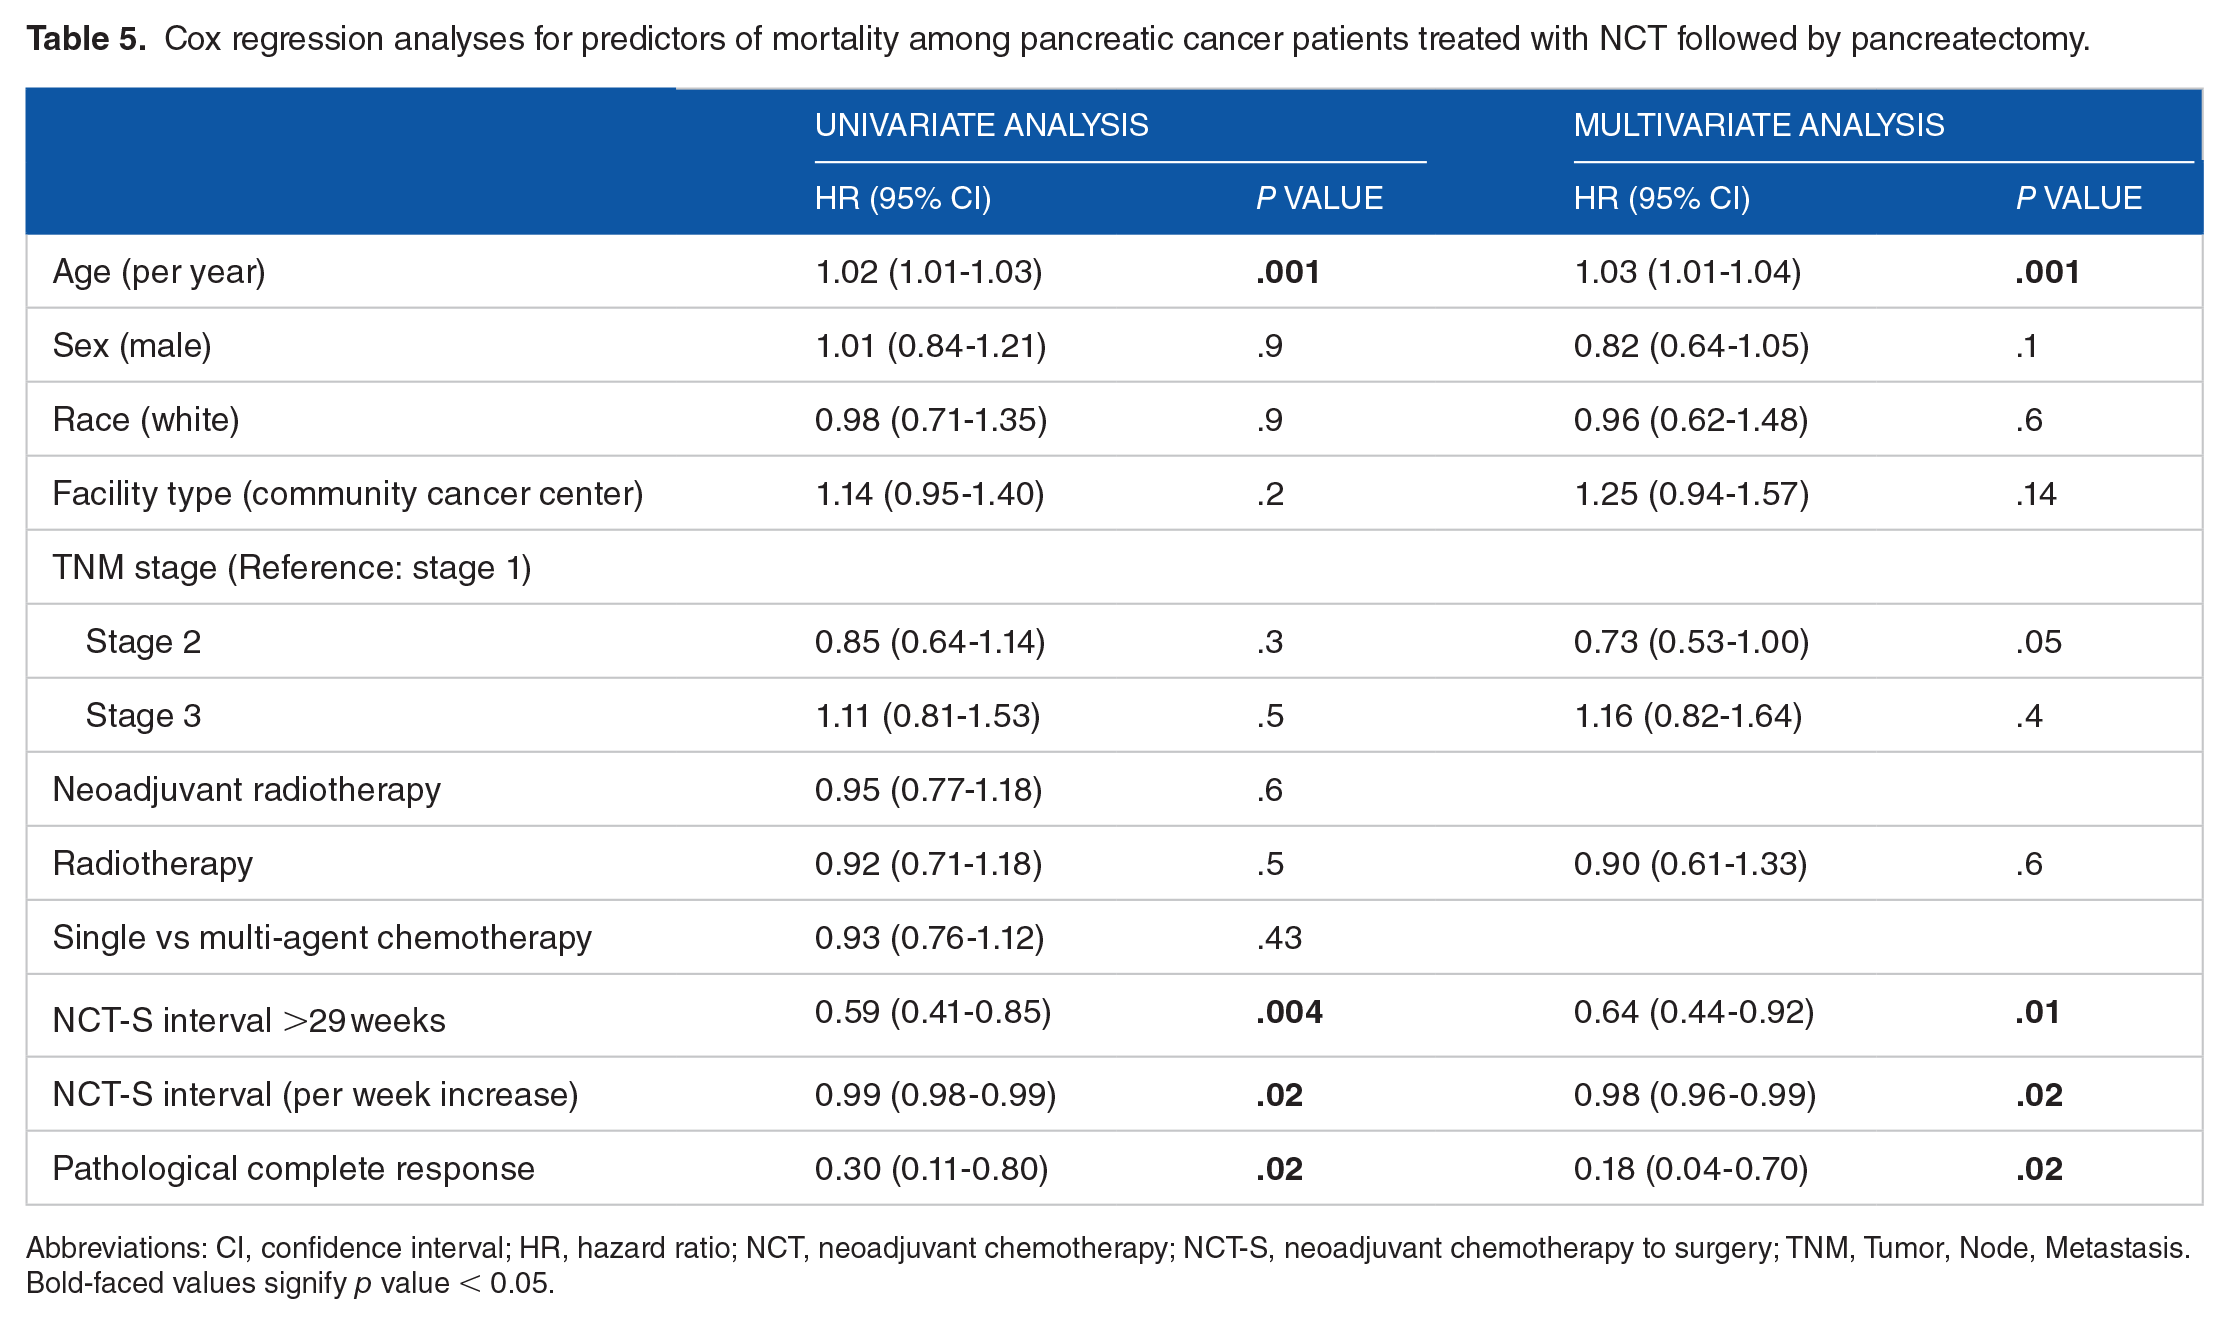
Abbreviations: CI, confidence interval; HR, hazard ratio; NCT, neoadjuvant chemotherapy; NCT-S, neoadjuvant chemotherapy to surgery; TNM, Tumor, Node, Metastasis.
Bold-faced values signify p value < 0.05.

Kaplan-Meier curves of overall survival among pancreas cancer patients according to their pCR status. OS indicates overall survival; pCR, pathological complete response.
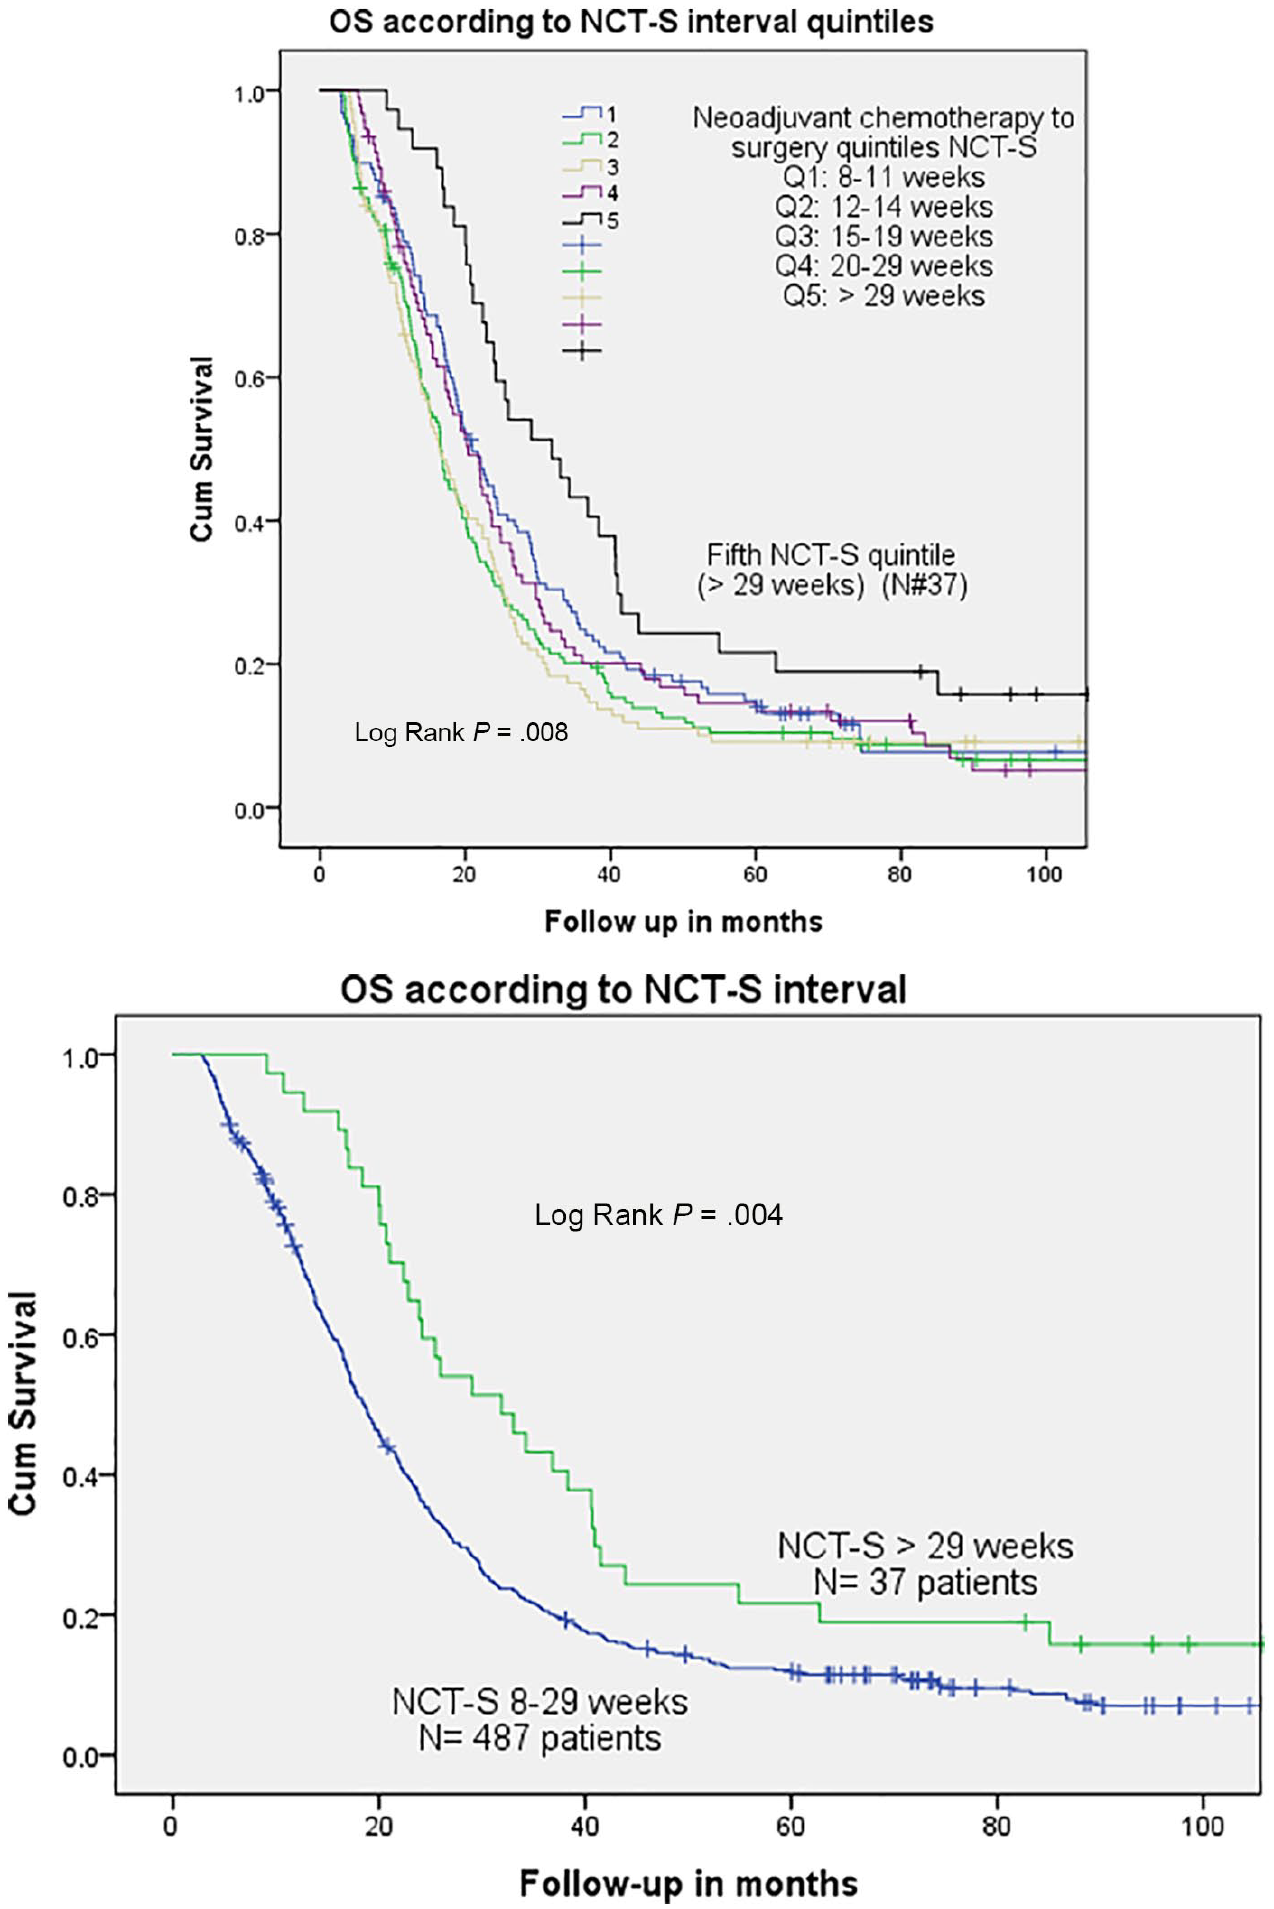
Kaplan-Meier curves of overall survival among pancreas cancer patients according to their NCT-S interval. Patients at risk for Q1, Q2, Q3, Q4, and Q5 were 128, 154, 112, 93, and 37 patients, respectively. NCT-S indicates neoadjuvant chemotherapy to surgery; OS, overall survival.
Multivariate Cox regression showed that age (HR = 1.03, 95% CI = 1.01-1.04, P = .001), pCR (HR = 0.18, 95% CI = 0.04-0.73, P = .020), and prolonged NCT-S interval (HR, per week increase, 0.98, 95% CI = 0.97-0.99, P = .04) and NCT-S >29 weeks (HR = 0.64, 95% CI = 0.44-0.92, P = .020) were significantly predictors of mortality, whereas race, gender, facility type, single vs multi-agent chemotherapy, and NRT were not statistically significant (Table 5).
Discussion
Our study confirmed that pCR is a strong predictor of improved survival in PDAC patients compared with those who could not achieve pCR. In our series, pCR rate was 2%, which is like that reported in prior reports.10,15,16 However, this rate is less than that reported in other retrospective pancreatic cancer studies (4%-10%).4-6,17 Moreover, this rate is less than the reported pCR rate of randomized trials of other malignancies—Rectal cancer CAO/ARO/AIO-94-German trial: pCR rate = 8%; 18 Gastric cancer-RTOG 9904 trial: pCR rate = 26%; 19 and Esophageal cancer-Cross trial: pCR rate = 29%. 20
Contrary to prior findings of superior pCR in multi-agent chemotherapy, 18 we have found no difference in our study. Interestingly, lower rate of pCR at the community cancer facility was not sustained when adjusted for other confounders (eg, NRT and NCT-S interval), which are proved to be independent predictors according to the multivariate analysis. We found patients treated at community cancer facility had statistically significant shorter NCT regimens (M = 16 vs 17 weeks) as compared with those treated at academic facility. We suggest that the longer NCT-S intervals at academic centers could be attributed to multiple lines of chemotherapy regimens, possible clinical trial enrollments, or multiple referrals prior surgical resection at these academic institutes. Moreover, 68% of community facility patients received NRT compared with 72% of those at academic facility. While pCR was associated with an independent significant superior survival, we have noticed 50% OS among pCR group. This corroborates with prior studies that reported locoregional recurrence and cancer-related death among PDAC patients with pCR status. 21 This is proposed by some authors for a possible pathological underestimation 21 and difficulty to determine the viability of cancer cells based on the conventional morphological features, 22 which could lead to a mis-reported pCR status. Nevertheless, both pCR and marked/major response to neoadjuvant therapy were associated with improved survival. 16 As NCDB has no details of the neoadjuvant therapy pathological response as described by various grading systems,22-24 we could not explore the difference of survival among the various grades of the pathological response.
Several retrospective and single-arm prospective studies have assessed the effects of NRT in PDAC.25-35 The majority of these studies have utilized multiple chemotherapy combinations consisting of gemcitabine with either 5-fluorouracil (5-FU) or capecitabine, paired with full-dose radiation (average: 50.4 Gy in 1.8 Gy fractions). 13 It has been suggested that neoadjuvant chemoradiation improves R0 resection rates and pCR, and decreased incidence of postoperative complications. 13 However, these studies are small comprising between 8 and 200 patients, whereas our series included 2093 patients, representing the largest cohort thus far. In our study, we have demonstrated a higher pCR rate among NCRT group compared with NCT. Although NRT is an independent predictor of pCR, it was not associated with improved OS in our series. These results are congruent with previous studies. 13 Zhan et al 36 in a recent met-analysis demonstrated a higher complete response (radiographically or pathological) rate to neoadjuvant CRT than chemotherapy alone (4.0% vs 1.4%). According to this met-analysis, there were 10 patients with pCR but no specific report about NRT impact on pCR. In 2018, Jang et al 37 have illustrated the oncologic benefits of NCRT as they reported the results of their randomized controlled trial with a higher R0 resection rate and 2-year OS among NCRT group vs upfront surgery. Of note, NRT may be culprit of worse outcomes among the non-responders as indicated by positive impact on pCR, which was a clear independent predictor of lower mortality, while NRT itself did not show a survival benefit. Hence, there is a need to find out the best NRT approach to decrease its potential toxicity and surrogate markers for NRT responders.
We have noticed a positive impact of prolonged NCT-S interval on both pCR and OS; however, there is no precise date of finishing chemotherapy in NCDB. Therefore, the prolonged NCT-S interval is possibly attributed to either an extended NCT course or prolonged interval between the completion of NCT-S. Rose et al 11 demonstrated that an extended NCT (up to 6 months) was well tolerated in PDAC patient with potential favorable survival outcomes. Moreover, the Chen et al 12 study, including 83 patients, has demonstrated that a prolonged time interval after NCR was more likely to improve pCR and OS. Several studies on rectal38-41 and esophageal42,43 cancer have demonstrated that prolonged interval between completion of CRT and surgery was associated with improved pCR.
We acknowledge that our study has several important limitations. First, this was a population-based retrospective series, which may include potential for selection bias. The NCDB does not have details about the indication for neoadjuvant (ie, resectability status on presentation: resectable, borderline vs advanced PDAC). Due to heterogeneity between each study and its therapeutic protocols, primary endpoints, and criteria used to define resectability, the interpretation of data should be taken carefully. Also, the NCDB does not include details or complications of each chemotherapy regimen; therefore, a preferred drug regimen could not be assessed. There is a great potential of immortality bias (patient who started with intent of NCT but did not make it to surgery because of disease progression; ie, patients with longer NCT-S interval may have longer survival due to longer lead time bias) that needs to be addressed in a future intention-to-treat analysis. The retrospective nature of the data limits the potential for independent re-review of pathological data including the initial diagnosis and final pathological staging to differentiate between true and false pCR. We also acknowledge the small number of patients with pCR and available survival data. Despite these limitations, we believe this to be the largest series assessing at predicting factors associated with OS in patients with PDAC who achieved pCR.
Conclusions
The rate of pCR according to our study was 2%, which was increased significantly by prolonged NCT-S interval >20 weeks and NRT. The pCR was an independent predictor of improved OS in PDAC patients. While NRT showed a statistically significant higher rate of pCR, it was not a significant independent predictor of OS in PDAC patients. The prolonged NCT-S interval >29 weeks has improved both pCR and OS. Further evidence with prospective trials is warranted to confirm these findings.
Footnotes
Funding:
The author(s) received no financial support for the research, authorship, and/or publication of this article.
Declaration of conflicting interests:
The author(s) declared no potential conflicts of interest with respect to the research, authorship, and/or publication of this article.
Author Contributions
BA designed the study, analysed the data and drafted most of the manscript including discussion. FIM drafted sections in the discussion part. CR assissted in data analysis and review of the manuscript. DC, DF, ASL and DY have critically reviewed and approved the final version of the manuscript.
Ethical Approval
All procedures performed in this study were in accordance with the ethical standards of our institutional research committee and with the 1964 Helsinki Declaration and its later amendments or comparable ethical standards.
Data Accessibility Statement
Patients’ records were achieved via National Cancer Data Base, which has all data as fully anonymized before we accessed them, and the Institutional Review Board (IRB) committee waived the requirement for informed consent given the retrospective nature and national cancer database nature of the study.