
Abstract
Objectives:
Plasma bile acid (BA) has been widely studied as pathophysiological factors in chronic liver disease. But the changes of plasma BA level in lean metabolic dysfunction-associated fatty liver disease (MAFLD) remains unclear. Here, we clarified the BA metabolic characteristics of lean MAFLD and explored its significance and mechanism as a marker.
Methods:
We employed ultra-performance liquid chromatography tandem mass spectrometry based on BA metabonomics to characterize circulating bile acid in lean MAFLD patients. Explore its significance as serum biomarkers by further cluster analysis, functional enrichment analysis, and serum concentration change analysis of differential BAs. Evaluation of diagnostic value of differential BAs by ROC analysis.
Results:
A total of 65 BAs were detected and 17 BAs were identified which showed different expression in the lean-MAFLD group compared with the normal group. Functional annotation and enrichment analysis of KEGG and HMDB showed that differential BAs were mainly related to bile acid biosynthesis, bile secretion, cholesterol metabolism, and familial hypercholangitis, involving diseases including but not limited to cirrhosis, hepatocellular carcinoma, chronic active hepatitis, colorectal cancer, acute liver failure, and portal vein obstruction. ROC analysis displayed that the 6 BA metabolites (GCDCA-3S, GUDCA-3S, CDCA-3S, NCA, TCDCA, and HDCA) exhibited well differential diagnostic ability in discriminating between lean MAFLD patients and normal individuals with an area under the curve (AUC) ⩾0.85.
Conclusions:
We delineated the characteristics of BA level in patients with lean MAFLD, and identified 6 potential plasma BA biomarkers of lean MAFLD.
Plain Language Summary
Keywords
Introduction
Metabolic dysfunction-associated fatty liver disease (MAFLD) once called non-alcoholic fatty liver disease (NAFLD). In addition to fatty denaturation and lipid accumulation in hepatocytes, NAFLD is often accompanied by cardiovascular and metabolic diseases such as hypertension, atherosclerosis, obesity, and diabetes.
Given the importance of metabolic abnormalities in this disease, NAFLD has now been renamed as MAFLD in order to reflect the disease characteristics and risks more appropriately. 1 With the prevalence of metabolic syndrome (insulin resistance, obesity, diabetes, etc.), MAFLD has become the main cause of chronic liver disease worldwide in the past decades. The progression of MAFLD can be described by the level of inflammatory activity and fibrosis stage, instead of simple fatty liver and steatohepatitis. Without therapeutic intervention, some MAFLD patients may subsequently progress to cirrhosis and eventually develop into hepatocellular carcinoma (HCC). The pathogenesis of MAFLD progression remains to be fully elucidated. MAFLD development depends on multiple hepatic insults via several different pathways. 2 Among them, intestine-liver axis interaction and abnormal BA metabolism cannot be ignored.
In HFC diet induced obese mice model, A muciniphila efficiently increased mitochondrial oxidation and BA metabolism in the intestine-liver axis by regulating the metabolism of L-aspartic acid, and improved steatosis and inflammation in MAFLD. 3 Vitamin C and vitamin D3 may be an effective method for treating MAFLD by regulating gut microbiota and BA metabolism via the intestine-liver axis, which may be a potential drug target for future MAFLD interventions. 4 The latest research has found that 3-succinylated cholic acid derived from Bacteroides uniformis strains has been shown to be negatively correlated with liver injury in MAFLD patients. 5 BA are the main component of bile. It can not only promote the digestion and absorption of lipids, but also have important physiological signals and metabolic regulation effects. The quantitative detection of the BA profiles plays an important role in assessing liver disease.6,7 There were significant differences in BA profiles among patients with chronic liver disease of different causes which suggested that BA profiles has clinical potential in distinguishing liver injury types. 8 Compared with healthy individuals, there was no difference in total bile acid (TBA) levels among NAFLD patients, but BA composition changed significantly. 9 Animal experiments showed significant changes in BA levels in the enterohepatic circulation of non-alcoholic steatohepatitis, and the effects could be corrected by diet. 10 A certain study has shown that primary BA is associated with follow-up liver-related events among NAFLD patients, suggesting that BA metabolism may predict the prognosis of NAFLD. 11 Together, increasing evidence suggested a close relationship between BA plasma concentrations and MAFLD patients.
It was noteworthy that “lean” or “non-obese” MAFLD has been extensively reported among in Asian populations in recent years and there were few studies on BA metabolism in lean MAFLD since its redefinition in 2020. MAFLD patients in the advanced stage were usually accompanied by lobular inflammation and liver fibrosis. Here, we assessed the changes in serum BA spectrum inMAFLD progression patients with normal BMI with the aim of explore appropriate serum BA markers to diagnose lean MAFLD by LC-MS/MS technology and metabonomics.
Materials and Methods
Sample collection
This study was a retrospective study. From January to June 2023, serum samples of 15 diagnosed lean MAFLD patients (lean-MAFLD group) and 15 healthy controls (Normal group) were collected from Nanjing Jinling Hospital. The diagnosis of MAFLD was made according to the diagnostic criterion proposed in 2020, emphasized the role of systemic metabolic disorders in triggering liver diseases. 1 In this study, enrolled MAFLD patients with normal BMI (18.5-23.9), serum TG ⩾ 1.70 mmol/L, and hepatic steatosis through abdominal ultrasound scan, were accompanied by diabetes or arterial hypertension for at least 5 years and failure of receive standardized medical treatment within the past 6 to 12 months. The exclusion criteria were as follows: Other chronic liver disease (including, but not limited to viral hepatitis, autoimmune liver diseases and malignancy); medical history of drugs affecting liver function; hazardous alcohol intake. Patients were screened for the presence of lobular inflammation and fibrosis by liver biopsy upon additional informed consent. Histopathological diagnosis of all liver tissue samples was conducted by experienced pathologists. The Scheuer scoring system was adopted as the histological standard of Liver inflammation (G0~G4) and fibrosis (S0~S4). The grades of liver inflammation were classified into the following 5 stages: G0, no inflammation; G1, portal inflammation; G2, mild piecemeal necrosis or acidophil bodies; G3, moderate piecemeal necrosis and severe focal cell damage; and G4, widely bridging necrosis and lobular structural abnormalities. Liver fibrosis was scored as follows: S0, no fibrosis; S1, portal tracts expansion and portal fibrosis without septa; S2, normal lobular structural and portal fibrosis with rare septa; S3, disordered lobular structure and numerous septa without cirrhosis; and S4, early or confirmed cirrhosis. Hepatic steatosis was scored on a 4-point scale (F0~F3). The percentage of fat in liver parenchyma: F0, <5%; F1, 5%~33%; F2, 34%~66%; F3, >66%. Fasting serum from 5 mL peripheral venous blood was collected from each participant and stored in a −80° C refrigerator.
The research protocol was approved by the ethics committees of Nanjing University School of Medicine Affiliated Jinling Hospital. This study was conducted according to the ethical guidelines of the Declaration of Helsinki. Participants willingly agreed to participate in the study and written consents were taken.
BAs detection and quantification by LC-MS/MS
Bile acids contents were detected by MetWare (http://www.metware.cn/) based on the AB Sciex QTRAP 6500 LC-MS/MS platform.
Sample preparation and extraction Samples (50 μL) were extracted with 200 μL methanol/acetonitrile(v/v = 2:8). 10 μL 13 kinds internal standard mixed solution (1 μg/mL) was added into the extract as internal standards (IS) for the quantification. Put the samples at −20°C for 10 minutes to precipitated protein. Then centrifugation for 10 minutes (12 000 r/min, and 4°C), the supernatant was transferred to clean plastic microtubes. The extracts were evaporated to dryness, reconstituted in 100 μL 50% methanol (V/V) for further LC-MS/MS analysis.
The HPLC and ESI-MS/MS conditions based on references.12,13
HPLC Conditions The sample extracts were analyzed using an LC-ESI-MS/MS system (UHPLC, ExionLC™ AD, https://sciex.com.cn/; MS, Applied Biosystems 6500 Triple Quadrupole, https://sciex.com.cn/). The analytical conditions were as follows, HPLC: column, Waters ACQUITY UPLC HSS T3 C18 (100 mm × 2.1 mm i.d., 1.8 µm); solvent system, water with 0.01% acetic acid and 5 mmol/L ammonium acetate (A), acetonitrile with 0.01% acetic acid (B); The gradient was optimized at 5% to 40%B in 0.5 minute, then increased to 50% B in 4 minutes, then increased to 75% B in 3 minutes, and then 75% to 95% in 2.5 minutes, washed with 95% B for 2 minutes, finaly ramped back to 5% B (12-14 minutes); flow rate, 0.35 mL/min; temperature, 40°C; injection volume: 3 μL.
ESI-MS/MS Conditions Linear ion trap (LIT) and triple quadrupole (QQQ) scans were acquired on a triple quadrupole-linear ion trap mass spectrometer (QTRAP), QTRAP® 6500+ LC-MS/MS System, equipped with an ESI Turbo Ion-Spray interface, operating in negative ion mode and controlled by Analyst 1.6.3 software (Sciex). The ESI source operation parameters were as follows: ion source, ESI-; source temperature 550°C; ion spray voltage (IS) −4500 V; curtain gas (CUR) was set at 35 psi, respectively. Bile acids were analyzed using scheduled multiple reaction monitoring (MRM). Data acquisitions were performed using Analyst 1.6.3 software (Sciex). Multiquant 3.0.3 software (Sciex) was used to quantify all metabolites. Mass spectrometer parameters including the declustering potentials (DP) and collision energies (CE) for individual MRM transitions were done with further DP and CE optimization. A specific set of MRM transitions were monitored for each period according to the metabolites eluted within this period.
Data analysis
Unsupervised PCA (principal component analysis) was performed by statistics function prcomp within R (www.r-project.org). The data was unit variance scaled before unsupervised PCA.
Significantly regulated BAs between groups were determined by Variable Importance in Projection (VIP) and absolute LogFC (fold change). VIP values were extracted from OPLS-DA result, which also contain score plots and permutation plots, was generated using R package MetaboAnalystR. The data was log transform (log) and mean centering before OPLS-DA. A permutation test (200 permutations) was performed in order to avoid overfitting. Screening criteria are as follows:
For comparison between 2 groups:
(1) BA metabolites with VIP > 1 were selected. The VIP value represents the influence intensity of the inter group differences of corresponding BA metabolites on the classification and discrimination of each group of samples in the model. It is generally believed that BA metabolites with VIP > 1 have significant differences.
(2) BA metabolites with fold change ⩾2 and fold change ⩽ 0.5 were selected . If the difference in BA metabolites between the lean-MAFLD group and the Normal group is more than twice or less than 0.5, the difference is considered significant.
The diagnostic power of the different BAs were evaluated by the receiver operating characteristic (ROC) analysis by Sangerbox3.0 (http://www.sangerbox.com/tool ).
Public databases
KEGG database (http://www.kegg.jp/kegg/compound/) and HMDB database (http://www.hmdb.ca/) were used for functional annotation and the enrichment analysis.
Results
Statistics of clinical characteristics of the study cohort
Participants in this study included 15 lean MAFLD patients and 15 healthy people. The demographic, clinical, and laboratory characteristics of the 2 groups of participants were shown in Table 1.
Statistics of clinical characteristics of the study cohort.

Screening of BAs metabolites with significant differences
Using UPLC-MS/MS quantitative BA detection method, a total of 65 differential BA metabolites were detected. The standard curve linear equations and correlation coefficients of BA were shown in the Supplemental Table 1. The quantitative results of BA concentration were shown in Supplemental Table 2. OPLS-DA model showed that the BA metabolites in the lean-MAFLD group and the Normal group were clearly separated (Figure 1). The resulting R 2 X, R 2 Y, and Q 2 of permutation test model validation were 0.481, 0.8, and 0.236. By the cutoff of fold change ⩾2 or ⩽0.5, and VIP ⩾ 1.0, 17 differential BAs were identified in patients with lean-MAFLD compared to Normal, of which 14 were upregulated and 3 were downregulated (Table 2 and Figure 2A). The upregulated BAs were 6-ketoLCA, CDCA, GCDCA-3S, GUDCA-3S, CDCA-3S, NCA, CDCA-3Gln, GCA, GCDCA, TUDCA, Tω-MCA, TCA, THDCA, TCDCA, while the downregulated BAs were HDCA, 23-DCA, MDCA. In order to observe the variation of BAs content, we used normalization (Unit Variance Scaling, UV Scaling) to normalize the original content of differential metabolites identified by applying the screening criteria, and drew the heat map with the R software package (Figure 2B). The relative contents of differential BAs between lean-MAFLD group and Normal group were shown in Figure 3.

Establishment and verification of OPLS-DA model. (A) OPLS-DA Score Chart of lean-MAFLD versus Normal. (B) OPLS-DA S-plot of lean-MAFLD versus Normal. The abscissa represents the covariance of the principal component and metabolite, and the ordinate represents the correlation coefficient of the principal component and metabolite. The closer the metabolites are to the upper right and lower left corners, the more significant the difference is. The red dots indicate that the metabolites have VIP values greater than or equal to 1, and the green dots indicate that the metabolites have VIP values less than 1. (C) The model had good prediction ability. Orange represents the random grouping model R2Y, and purple represents the random grouping Model Q2, the values represented by the black arrows are the R2X, R2Y, and Q2 values of the original model.
BAs with significant differences in lean-MAFLD versus normal.

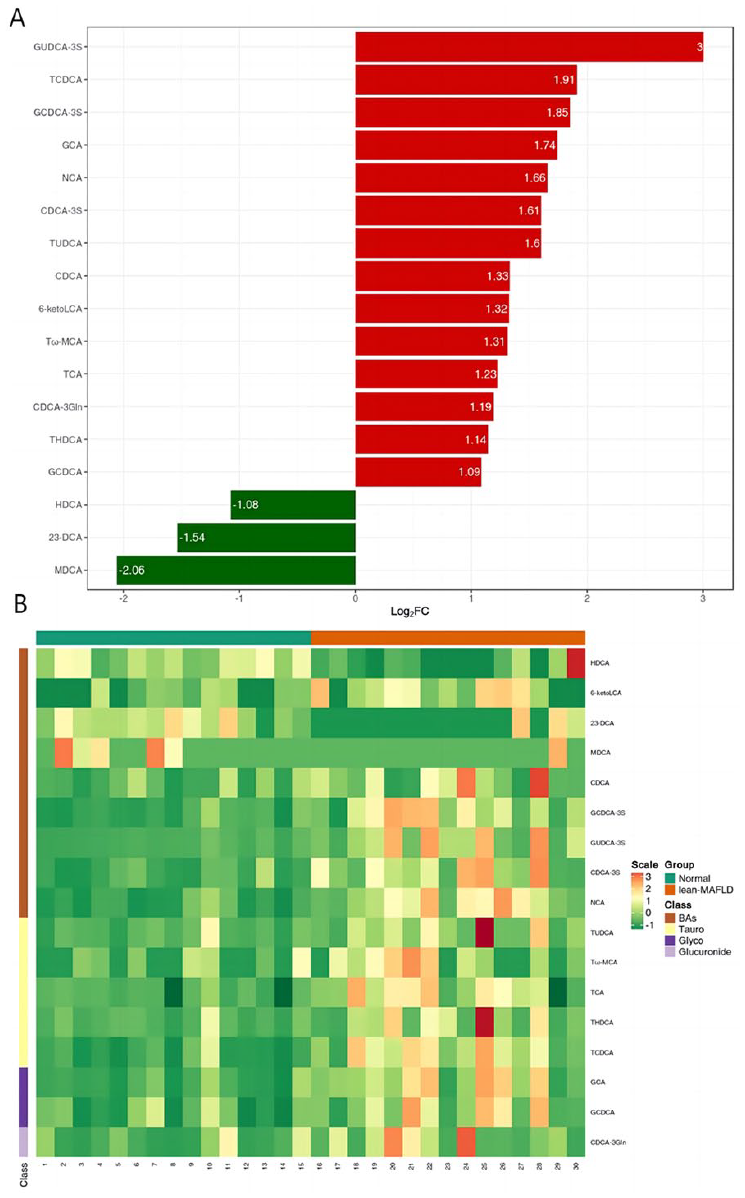
Seventeen significant different BAs in lean-MAFLD versus Normal. (A) Bar chart of fold change. Red represents up-regulation, and green represents down-regulation. (B) Heat map analysis. Red blocks indicate upregulation, whereas green indicates down-regulation.

Relative contents of differential BAs between lean-MAFLD and Normal. The box in the middle represents the quartile range, the thin black line extending from it represents the 95% confidence interval, the black horizontal line in the middle is the median, and the external shape represents the distribution density of the data.
Metabolic pathway analysis
KEGG pathway enrichment analysis of differential BAs found that the plasma between the lean-MAFLD group and Normal group were different in the metabolism pathways of primary bile acid biosynthesis, metabolic pathways, bile secretion, cholesterol metabolism, taurine, and hypotaurine metabolism (Figure 4A and B and Table 3). The detailed annotation information of the BAs with significant differences screened in the KEGG database was shown in Supplemental Table 3.
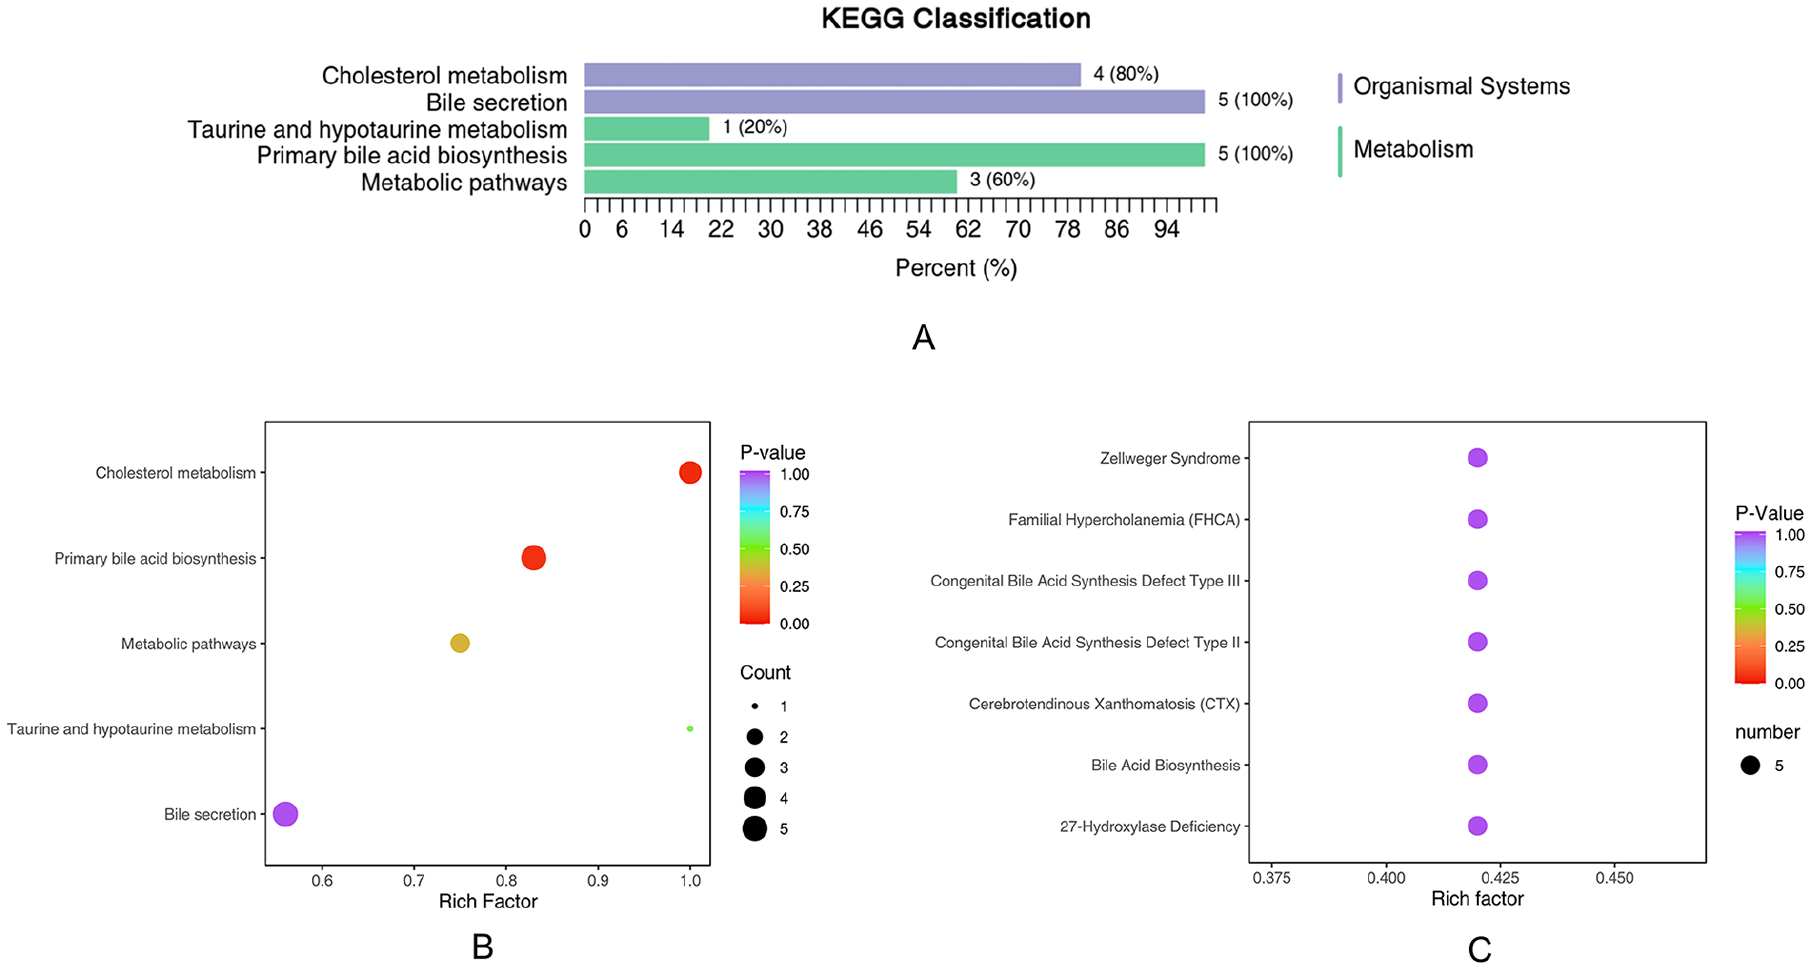
Classification and enrichment of KEGG/HMDB pathway of differential BAs. (A) KEGG classification diagrams. The ordinate is the name of the KEGG metabolic pathway, and the abscissa is the number of BAs from the annotation to the pathway and the proportion of the number of BAs to the total number of annotated metabolites. (B) KEGG enrichment analysis graphs. (C) Enrichment of HMDB pathway of differential BAs. The color of bubbles represents the value of adjusted P value, and the size of bubbles represents the number of counts.
KEGG annotation results for differential Bas.
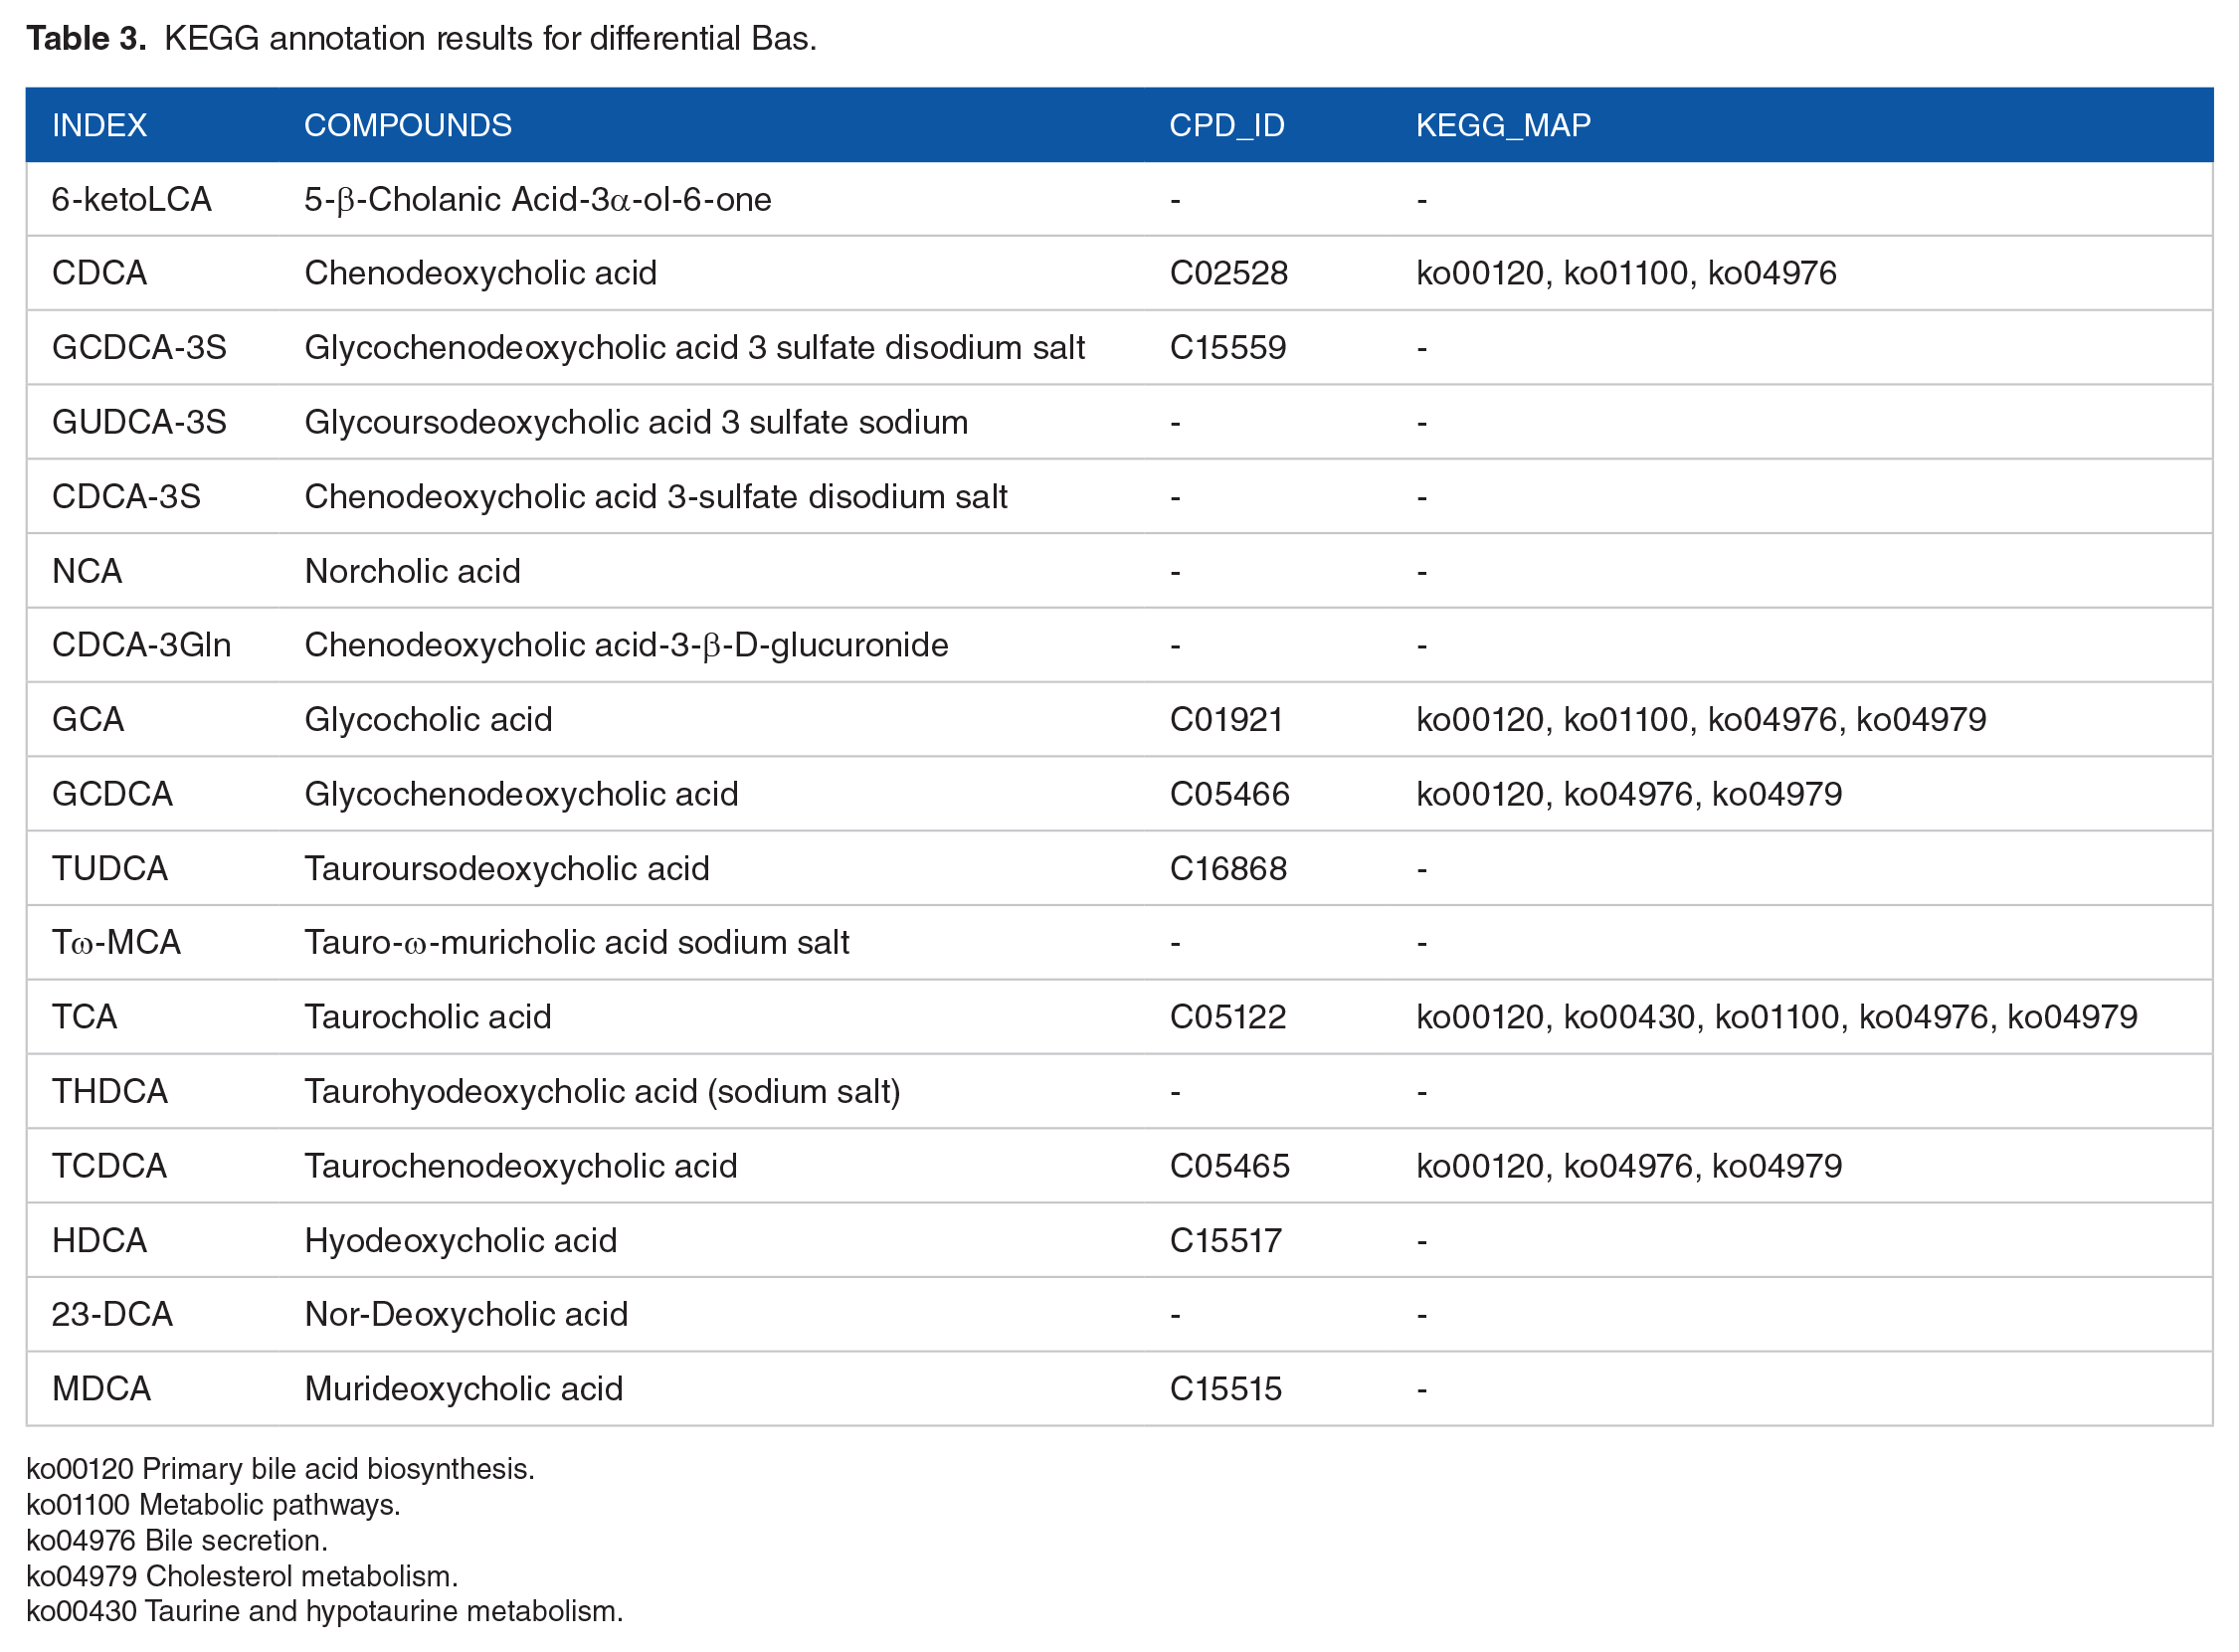
ko00120 Primary bile acid biosynthesis.
ko01100 Metabolic pathways.
ko04976 Bile secretion.
ko04979 Cholesterol metabolism.
ko00430 Taurine and hypotaurine metabolism.
HMDB is a widely used database of more than 40 000 endogenous metabolites and more than 5000 protein (DNA) information associated with it. The HMDB sub-database SMPDB also provides human metabolism, metabolic disease pathways, metabolite signals, and drug activity pathways. Since the SMPDB only opens the image of Primary pathways download, the pathway enrichment analysis was only performed for the Primary pathway. HMDB Primary pathway enrichment analysis of differential BAs found that the plasma between the lean-MAFLD group and Normal group were different in Bile Acid Biosynthesis, Congenital Bile Acid Synthesis Defect Type II, Congenital Bile Acid Synthesis Defect Type III, Familial Hypercholanemia (FHCA), Zellweger Syndrome, Cerebrotendinous Xanthomatosis (CTX), 27-Hydroxylase Deficiency (Table 4 and Figure 4C). The detailed annotation information of the BAs with significant differences screened in SMPDB was shown in Supplemental Table 4.
HMDB annotation results for differential Bas.

SMP0000035 Bile Acid Biosynthesis.
SMP0000314 Congenital Bile Acid Synthesis Defect Type II.
SMP0000318 Congenital Bile Acid Synthesis Defect Type III.
SMP0000317 Familial Hypercholanemia (FHCA).
SMP0000316 Zellweger Syndrome.
SMP0000315 Cerebrotendinous Xanthomatosis (CTX).
SMP0000720 27-Hydroxylase Deficiency.
Differential BA metabolites associated with disease
According to HMDB database, the disease information associated with differential BAs was found. The results were shown in Table 5. Related diseases included, but were not limited to, liver cirrhosis, hepatocellular carcinoma, chronic active hepatitis, colorectal cancer, acute liver failure, portal vein obstruction, etc.
Differential BAs associated diseases.

Predictive value of bile acid spectrum subcomponents on lean MAFLD
All the identified differential BAs were used to perform an ROC analysis. Six of the BAs with an AUC > 0.85 (GCDCA-3S, GUDCA-3S, CDCA-3S, NCA, TCDCA, HDCA) displayed a high discriminating capacity (Figure 5). At the cut-off value less than 109.6, 65.8, 2.31, 2.03, 44.61 ng/mL for GCDCA-3S, GUDCA-3S, CDCA-3S, NCA, TCDCA, the sensitivity, and the specificity were 86.7%, 80%, 100%, 93.3%, 86.7% and 86.7%, 93.3%, 66.7%, 80%, 86.7%, respectively. At the cut-off value higher than 4.54 ng/mL for HDCA, the sensitivity and the specificity were 93.3% and 80%, respectively.

Predictive value of bile acid spectrum subcomponents on lean-MAFLD. GCDCA-3S yielded an AUC of 0.89 (95% CI: 0.76-1.00); GUDCA-3S yielded an AUC of 0.92 (95% CI: 0.83-1.00); CDCA-3S yielded an AUC of 0.89 (95% CI: 0.78-1.00); NCA yielded an AUC of 0.94 (95% CI: 0.86-1.00); TCDCA yielded an AUC of 0.92 (95% CI: 0.81-1.00); HDCA yielded an AUC of 0.86 (95% CI: 0.70-1.00).
Discussion
The increase of MAFLD incidence rate is closely related to the global obesity crisis 14 ; however, up to 10%-20% of MAFLD patients have a normal body mass index (BMI).15,16 The “lean” or “non-obese” MAFLD patients usually do not have systemic obesity but are related to visceral fat accumulation. It seemed that the pathogenesis of lean MAFLD is at least partially related to the changes in gut microbiota composition. 17 The intestinal microbiota could alter the metabolism of BA, cause the onset of MAFLD by regulating the activation of the farnesome X receptor (FXR), thereby affect the homeostasis of fat and glucose. Lean people with MAFLD was associated with comorbidities (such as: diabetes, hypertension, metabolic syndrome, and cardiovascular disease) and cardiovascular mortality, 18 as assessed by histology 19 and retrospective study. 20 Other studies challenged this view.21,22 Although the lean MAFLD phenotype typically manifests as a milder form of disease, it may also exhibit a wide range of histopathological features related to metabolic dysfunction-associated steatohepatitis (MASH), including steatosis, hepatocyte ballooning degeneration, lobular inflammation, and liver fibrosis.22,23 The physique of lean MAFLD patient is normal or even leaner. They often do not pay enough attention to the onset of fatty liver disease. So far, specific biomarkers to diagnose lean MAFLD are missing.
In this study, 17 differentially expressed BAs were identified via BA metabolomics between the lean-MAFLD group and the Normal group. KEGG analysis showed that the 17 differentially expressed BAs were mainly enriched in metabolic pathways, bile secretion, cholesterol metabolism, taurine, and hypotaurine metabolism that have been reported to be related to glycolipid metabolism disorder and oxidative stress. It provides clues for further comprehending the role of BAs in the occurrence and progression of lean MAFLD.
Our results showed that serum bile acids in lean MAFLD patients are mainly upregulated compared to normal individuals. The results of this study were similar to those of previous studies, which indicated that the concentrations of glycochenodeoxycholate, glycocholate, and taurocholate, such as GCDCA, CDCA, GCA, TCA, TCDCA, etc, were significantly higher in subjects with non-alcoholic steatohepatitis (NASH).24 -26 In this study, ROC curve analysis shows that GCDCA-3S, GUDCA-3S, CDCA-3S, NCA, TCDCA, and HDCA have a high predictive value for hepatic injury in lean MAFLD patients. Many studies demonstrated numerous interesting connections between changes in plasma BA profile and the severity of NAFLD. In more severe forms of NAFLD, plasma levels of GUDCA, GCDCA, and TCDCA were associated with fibrosis and lobular inflammation in NAFLD and NASH. 27 NCA can promote the progression and immune invasion of HCC by inhibiting the FXR signaling pathway, 28 which may play a certain role in the progression of MAFLD into HCC. CDCA, the major hydrophobic primary bile acids, was significantly modulate the expression of the human miRNA and mRNA in primary human hepatocytes and has a related impact on the function of gene networks involved in BA lipid, and drug metabolism. 29 In addition, excessive CDCA may be an endogenous danger factor, which activates NLRP3 inflammasome and triggers liver inflammation during cholestasis. 30 We speculate that excessive CDCA may induce inflammation and fibrosis in MAFLD.
In this study, HDCA level decreased in lean MAFLD compared with healthy people. Similar findings indicate that a group of gut microbiota-modified BAs, hyodeoxycholic acid (HDCA) species, are negatively correlated with the presence and severity of NAFLD.31,32 HDCA also influences cholesterol and glucose homeostasis in LDL receptor-null mice. The method of supplementing HDCA could inhibit intestinal cholesterol absorption in mice, reduce plasma VLDL/IDL/LDL cholesterol levels, improve high-density lipoprotein function, as well as lower obesity and blood glucose levels. 33 It means that HDCA may be a protective indicator.
It should be mentioned that this study has a number of limitations. The sample size was relatively small and needs to be increased in further research. Furthermore, the power analysis for sample size calculation was not done. Also, we diagnosed MAFLD patients based on the novel consensus of 2020 diagnostic criteria, metabolic at-risk criteria only include diabetes, hypertension and hyperlipidemia. Finally, this study did not differentiate the severity of lean MAFLD patients.
Conclusion
In summary, we have demonstrated significant changes in composition of bile acids in lean MAFLD. GCDCA-3S, GUDCA-3S, CDCA-3S, NCA, TCDCA, and HDCA were screened and identified as potential serum biomarkers for diagnosing lean MAFLD by LC-MS/MS technique. This strategy provided broad clinical application prospects for disease assessment.
Supplemental Material
sj-docx-1-end-10.1177_11795514241282253 – Supplemental material for Analysis of Serum Bile Acid Profile Characteristics and Identification of New Biomarkers in Lean Metabolic Dysfunction-Associated Fatty Liver Disease Based on LC-MS/MS
Supplemental material, sj-docx-1-end-10.1177_11795514241282253 for Analysis of Serum Bile Acid Profile Characteristics and Identification of New Biomarkers in Lean Metabolic Dysfunction-Associated Fatty Liver Disease Based on LC-MS/MS by Bing Wang, Fei Zhang, Hong Qiu, Yujie He, Haotian Shi and Yuerong Zhu in Clinical Medicine Insights: Endocrinology and Diabetes
Footnotes
References
Supplementary Material
Please find the following supplemental material available below.
For Open Access articles published under a Creative Commons License, all supplemental material carries the same license as the article it is associated with.
For non-Open Access articles published, all supplemental material carries a non-exclusive license, and permission requests for re-use of supplemental material or any part of supplemental material shall be sent directly to the copyright owner as specified in the copyright notice associated with the article.